Dataset description
Bacterial isolates were collected from patient samples from 23 different countries and were over-sampled for drug resistance. Of the 15,211 isolates included in the initial CRyPTIC dataset, 5,541 were phenotypically susceptible to isoniazid, rifampicin, and ethambutol, 5,602 were isoniazid resistant, 5,261 were rifampicin resistant, and 4,125 were multidrug resistant (MDR, resistant to both rifampicin and isoniazid) based on previously published epidemiological cutoffs (ECOFF, MIC that encompasses 99% of wild type) for the microtiter plates used in this study17. Binary phenotypic resistance to the newer drugs was observed at a lower prevalence, with 71 bedaquiline resistant isolates, 106 clofazimine resistant isolates, 76 linezolid resistant isolates, and 85 delamanid resistant isolates (Table S1). Isolate lineages were determined using a published SNP-based protocol from WGS data and the lineage distribution across countries reflects previously described phylogeographic distributions18–20. Five out of eight major lineages of Mtb were represented in the dataset, with most isolates mapping to L4 (6,572 isolates) and L2 (5,598 isolates), while L3 (1,850), L1 (1,150), and L6 (6) comprised the remainder. A complete description of the CRyPTIC dataset and determination of the ECOFFs have been previously published (also see Methods)17,21. After removal of isolates due to errors in phenotyping and sequencing across sites, the final genotype/phenotype intersection for all drugs was ~ 12,350 isolates (Fig. 1).
Genetic resistance determinants in Mycobacterium tuberculosis
Previous studies have shown that the majority of genetic determinants of resistance to most anti-tuberculosis drugs are related to a relatively small number of genes6,22. We thus employed a candidate gene approach and restricted our investigation of genomic variation to previously identified genes and the 100bp directly upstream of each gene for each drug (Table 1). All unique variation in the target genes and upstream regions (SNPs, both synonymous and nonsynonymous, as well as insertions and deletions < 50 base pairs in length) that occurred in isolates with matched high-quality phenotypic data was included in a separate multivariable linear mixed model controlling for population structure and technical variation between sites for each drug, after removing isolates with evidence for mixed allele calls at sites previously identified as resistant (e.g. rpoB S450X, Methods). Final sample sizes per drug ranged from 6,681 for moxifloxacin to 10,042 for rifabutin (mean sample size 8,353, Fig. 1, Methods). Most isolates had less than five nonsynonymous mutations across all target genes for each drug (Table S2).
Table 1
Candidate genes used in this study.
| Drug | Abbrev. | Candidate genes |
| Isoniazid | INH | katG, fabG1, inhA, ahpC, ndh, kasA, Rv1258c, Rv2752c |
| Ethionamide | ETH | ethA, ethR, fabG1, inhA, mshA, Rv3083, Rv0565c |
| Rifampicin | RIF | rpoA, rpoB, rpoC, rpoZ, Rv2752c |
| Rifabutin | RFB | rpoA, rpoB, rpoC, rpoZ, Rv2752c |
| Ethambutol | EMB | embA, embB, embC, embR, rmlD, iniA, iniC, manB, ubiA |
| Amikacin | AMI | rrs, eis, ccsA, whiB6, whiB7, aftB, fprA |
| Kanamycin | KAN | rrs, eis, ccsA, whiB6, whiB7, aftB, fprA |
| Levofloxacin | LEV | gyrA, gyrB |
| Moxifloxacin | MXF | gyrA, gyrB |
| Bedaquiline | BDQ | atpE, Rv0678, mmpL5, mmpS5, pepQ, Rv3249c |
| Clofazimine | CFZ | Rv1979c, pepQ, Rv0678, mmpL5, mmpS5, Rv3249c |
| Linezolid | LZD | rplC, rrl, Rv3249c |
| Delamanid | DLM | ddn, fgd1, fbiA, fbiB, fbiC, fbiD, Rv3249c |
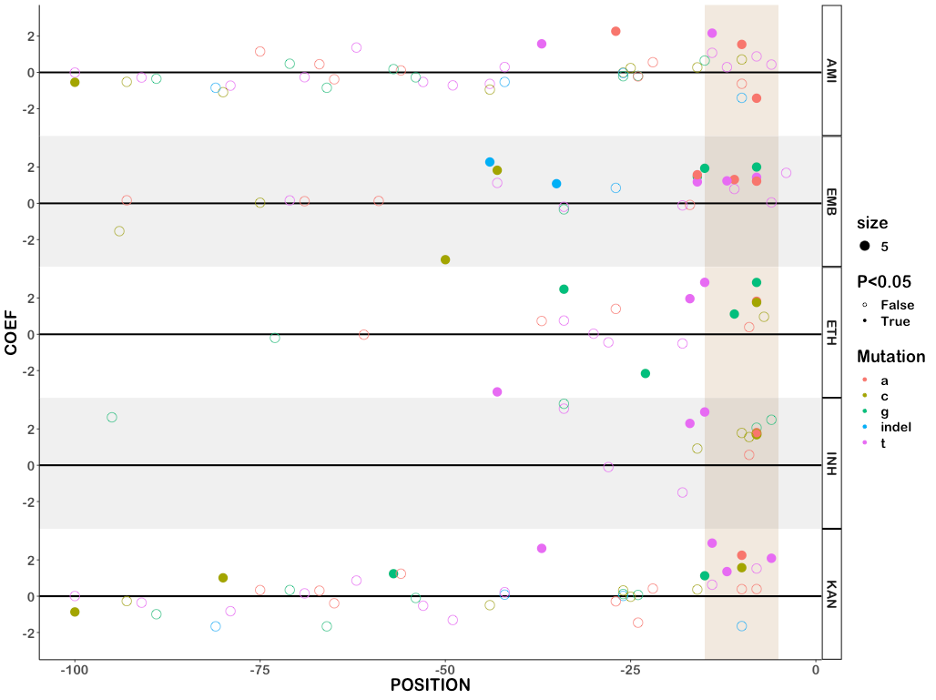
Across thirteen drugs, 584 mutations in 40 genes (out of 4,778 mutations and 50 genes tested) were found to have independent effects on MIC after correction for multiple testing (Benjamini-Hochberg correction, false discovery rate < 0.05, Fig. 2, Table 1, S3). Ethionamide had the most unique variants associated with reduced susceptibility (163), while linezolid had the least (8). Effect sizes were measured in log2MIC (where an increase in 1 log2MIC was equivalent to a doubling of the MIC) and positive effects for estimates derived from at least three observations ranged from a 0.22 increase in kanamycin log2(MIC) for rrs c492t to a 10.1 increase in isoniazid log2(MIC) for katG W477Stop. To facilitate comparison with previously published ECOFF values, we report mutational effects relative to the difference between the ECOFF MIC and the baseline MIC calculated by the model for each drug. Thus, if a mutation is associated with an effect larger than the ECOFF minus baseline, it is associated with an increase in resistance that would be above what is considered wildtype on the plate. Multiple promoter mutations were implicated in resistance to isoniazid, ethionamide, amikacin, kanamycin, and ethambutol (Fig. 2B). The effects of promoter mutations varied widely, with mutations upstream of eis and embA being almost exclusively associated with sub-ECOFF elevations in MIC for amikacin and ethambutol respectively, while most promoter mutations for the isoniazid and ethionamide-related fabG1 resulted in MICs above the ECOFF17. While a prior study found that common promoter mutations tended to be associated with lower-level resistance than their corresponding common gene-body counterparts (e.g. fabG1 c-15 vs inhA I21), we found that mutations affecting coding sequences vs mutations affecting promoters/intergenic regions were only associated with significantly different effects on MIC for isoniazid, ethambutol, and kanamycin (Table S4)13. In fact, we found that the widespread fabG1 c-15t promoter mutation was associated with higher-level and equivalent-level resistance to its gene body counterparts inhA I21V and I21T respectively (Fig. 2B, Wald test for equality of coefficients p = 0.0006, p = 0.24 respectively). Resistance-associated promoter mutations were enriched in the region around each gene’s respective − 10 element, which is consistent with the essentiality of the − 10 hexamer and increased variability around the − 35 position in mycobacterial promoters (Figure S1, +/- 5 nucleotides, Mantel-Haenszel common OR = 4.5, p = 0.0007)23,24. Multiple insertion/deletion mutations were associated with resistance to isoniazid, rifampicin, rifabutin, ethionamide, ethambutol, bedaquiline, clofazimine, and delamanid (Table S3, Fig. 2). Homoplastic mutations (multiple evolutionarily independent occurrences) were more likely to be associated with resistance for all drugs except amikacin, kanamycin, clofazimine, linezolid, and delamanid (Woolf test for homogeneity of ORs p = 0.0004, Table S5). The relative lack of homoplasy in the newer drugs may reflect the lower prevalence of resistant isolates observed for these drugs as opposed to lack of convergent evolution.
One notable advantage of quantitative MIC measurements is that they also enable investigation of variants associated with MIC decreases. We identified 63 increased susceptibility-associated mutations (with at least three occurrences) whose effect sizes ranged from − 4.3 rifampicin log2(MIC) for Rv2752c H371Y to -0.23 kanamycin log2(MIC) for eis V163I (Fig. 2A, Table S6). Eight of these mutations were homoplastic with at least three independent occurrences, which raises the intriguing possibility of a selective pressure for mutations associated with increases in drug susceptibility; however, this remains to be verified experimentally.
First-line drugs
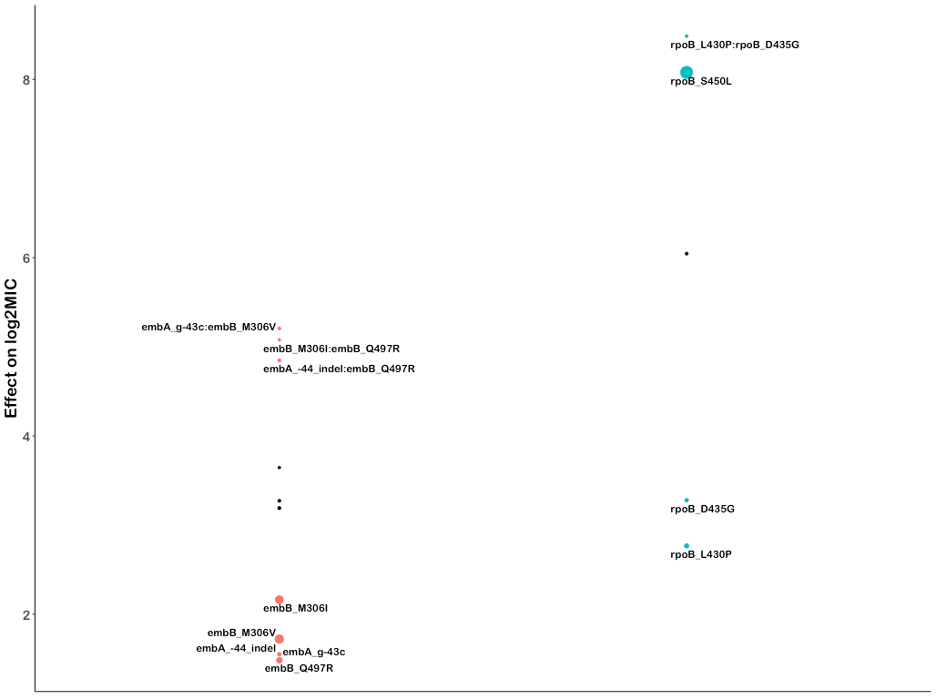
Rifampicin is a critical first line drug and resistance to it is almost entirely mediated by mutations within an 81-base pair region of the rpoB gene (rifampicin resistance determining region, RRDR). Most molecular assays target mutations in this region for rapid prediction of rifampicin resistance, however, mutations outside this region have been associated with outbreaks25,26. We identified 35 mutations in rpoB occurring at least 3 times whose effects collectively ranged from 1.0 to 9.0 increases in log2MIC (Fig. 3A). Notably, seven unique resistance-associated mutations occurred outside the RRDR, at positions V170, Q172, I491, and L731; however, only V170F was associated with high level resistance (8.37 increased log2MIC). Although disparate in primary sequence from the RDRR, positions V170, Q172 and I491 are all near the drug-binding pocket structurally (Fig. 3B). Interestingly, a homoplastic in-frame deletion 12 bp in size in the RRDR was also associated with rifampicin resistance (Fig. 3C, Table S3). Several types of insertion/deletion mutations in the RDRR have previously been reported, although they are rare, consistent with their greater structural consequences for the essential RNA polymerase27.
Prior studies have identified seven “borderline” mutations in rpoB (L430P, D435Y, H445L, H445N, H445S, L452P, and I491F) for rifampicin; resistant isolates with these mutations are often missed by phenotypic methods such as the Mycobacterial Growth Indicator Tube (MGIT), possibly due to slower growth rates, which has led to a reduction in the critical concentration for MGIT in the latest WHO guidelines28–30. These mutations’ MICs range on the plate from 5.1 log2MIC for H445L to 2.3 log2MIC for L430P (rifampicin ECOFF minus baseline MIC = 3.3, Table S3). Here, we identify thirteen additional rpoB mutations independently associated with elevated MICs that are less than 5.1 log2MIC (8/13 located in the RDRR, Table S3). Sixteen rpoB mutations in total were independently associated with elevated MICs at or below the rifampicin ECOFF, including rpoB L430P, a variant that has been successfully treated with a high dose rifampicin-containing regimen clinically31.Several rpoB positions (Q432, D435, H445) harbored both high and low-level resistance-associated alleles, while others (L430, L452, I491) were associated exclusively with lower-level resistance regardless of the amino acid substitution (Fig. 3B,C orange and yellow shading respectively). Mapping these mutations onto the rpoB protein structure revealed that high—level resistance often involves disruption of the interactions with the rigid napthol ring while mutations at positions that contact the ansa bridge had more variable effects, potentially due to increased structural flexibility in this region of the drug (Fig. 3B). Low-level resistance mutations often co-occurred with other low-level resistance mutations, producing high-level resistance additively (Figure S4).
Rifabutin (a structural analogue to rifampicin) is associated with a lower ECOFF (2.2 vs 3.3 log2MIC after subtraction of baseline) and mutations in rpoB were associated with lower elevations in rifabutin MIC compared to rifampicin MIC (paired Wilcoxon p = 3.7e-9, Fig. 3A, Table S3). Interestingly however, all structural features contacted by these mutations were shared between rifampicin and rifabutin (Fig. 3B). A single mutation, rpoB Q409R (n = 24, p = 5.0e-3 after Benjamini-Hochberg (BH) correction), was associated with decreased rifampicin and rifabutin MICs; interestingly, this mutation has been proposed as a compensatory mutation that may alter the rate of transcription initiation and resulting transcription efficiency for isolates that harbor other RDRR mutations32.
Resistance to isoniazid is mediated primarily through loss-of-function mutations in the prodrug converting enzyme katG, with canonical high-level resistance caused by the S315T mutation, which was associated with a 6.2 log2 increase in MIC (Fig. 4A, compared to 2.1 log2MIC ECOFF minus baseline). Not all katG mutations were associated with high level resistance, nearly half (15/31) being associated with increases in MIC at or below the ECOFF. No mutations likely to result in severe loss of function were associated with sub-ECOFF resistance, supporting the consensus of treating presumptive loss-of-function mutants in katG as resistant. The other canonical isoniazid-related genes, inhA and fabG1, tended to be associated with lower-level resistance, with 4/6 and 5/6 mutations associated with sub-ECOFF increases in MIC respectively (Fig. 4A, Table S3). While fabG1 L203L was previously the only synonymous mutation known to be associated with resistance to isoniazid, here we identify a synonymous mutation in the first codon of katG that confers high-level resistance to isoniazid, potentially by reducing the rate of translation initiation and subsequent production of katG enzyme required for activation of isoniazid, although this is a mechanistic hypothesis that requires biochemical confirmation (4.5 log2MIC, n = 3, p = 1.4e-8 after Benjamini-Hochberg (BH) correction, Table S3).
Most isoniazid resistance-associated mutations in katG occurred in the N-terminal lobe responsible for heme-binding and pro-drug conversion (Fig. 4B). Most isolates harbored variation at position S315, located in the primary isoniazid-binding pocket on the δ edge of the heme; interestingly however, another cluster of resistance-associated mutations occurred in the helix made up of residues 138–155. Some structural evidence exists for promiscuous isoniazid binding at this site and mutations of this region in Escherichia coli cause reduced catalase/peroxidase activity and heme binding; however the precise mechanism of effect of these mutations in Mtb is unknown33,34. Intriguingly, one mutation in this region, katG S140N, was associated with decreased isoniazid MIC (n = 9, p = 5.4e-4 after BH correction, Fig. 4B).
Non-canonical isoniazid resistance-associated variants were identified in ahpC, ndh, and Rv1258c (tap) (Fig. 4A). Mutations in ahpC were associated with increased MICs; however, these mutations almost always co-occurred with mutations in canonical isoniazid genes and investigation of the interaction between these co-occurring mutation pairs revealed that ahpC mutations did not result in additive resistance, consistent with their proposed compensatory role (Fig. 4A). Further investigation of these apparent discrepant isolates using an improved version of the Clockwork variant calling pipeline that detected deletions larger than 50bp identified 9 isolates with apparent resistance-associated ahpC mutations that harbored large deletions in katG not reported in the original variant set used for the model. Thus, the apparent effect of these mutations is likely due to isolates with undetected mutations in the canonical resistance genes as opposed to a bona fide individual effect on isoniazid MIC by mutations in ahpC. Several recent genome-wide association studies (GWAS) have implicated mutations in the ribonuclease/beta-lactamase Rv2752c in resistance and tolerance to both rifampicin and isoniazid; however, they also identified convergent mutations in drug susceptible strains13,35. While we identified nine nonsynonymous mutations with significant effects on log2MIC, only one, V218L, was shared between isoniazid and rifampicin, causing a 3.2 elevation in log2MIC for both drugs (Table S3). Only one other Rv2752c variant was associated with elevated rifampicin MICs, while four variants in this gene were associated with elevated isoniazid MICs (Fig. 4A).
Canonical ethambutol resistance is mediated by mutations in embA or embB. We identified 45 variants, 12 in the embC-embA intergenic region, five in embA, and 28 in embB, that were independently associated with elevated ethambutol MICs (Fig. 4C). Mutations in the embC-embA intergenic region have been proposed to upregulate production of embA and embB by altered promoter structure. Most embC-embA intergenic variants were in the upstream region from − 16 to -8, however three were located upstream around the − 35 element (Figure S1). All embC-embA intergenic and embA gene body mutations were associated with MIC increases below the ECOFF (EMB ECOFF = 2 log2MIC minus baseline, Fig. 4C, Table S3). Interestingly, 22/28 mutations in embB were also associated with sub-ECOFF increases in MIC, including the canonical embB M306I. Low-level resistance mutations often co-occurred, resulting in high-level additive resistance, consistent with previous studies (Table S6)36. Mutations associated with resistance in embB were clustered around the drug binding pocket (Fig. 4D)37. We also identified resistance-associated variants in embC and ubiA, although these occur less frequently and require further validation.
Group A and B MDR drugs
The principal mechanism of resistance to fluoroquinolones is mutations in either subunit of DNA gyrase (gyrA or gyrB). We identified 22 mutations (12 gyrA, 10 gyrB) and 19 mutations (10 gyrA, 9 gyrB) that were independently associated with increased levofloxacin and moxifloxacin MICs respectively (Fig. 5A). Resistance-associated mutations in gyrB occurred without an accompanying gyrA mutation ~ 65% of the time (29/44 isolates LEV, 35/54 isolates MXF) but were associated with lower overall—and in some cases sub-ECOFF—changes in MIC (LEV ECOFF = 1.6 log2MIC, MXF ECOFF = 2.3 log2MIC, minus baseline, Fig. 5A, Table S3,S6). Most mutations associated with increased fluoroquinolone MICs were within 10 Å of the drug binding pocket (Fig. 5B). Intriguingly, two positions—gyrB R446 and gyrB S447—each harbored two unique resistance-associated missense mutations despite being over 25 Å from the bound fluoroquinolone. Both residues make contacts with the gyrB protein backbone at positions 473–475, suggesting they may exert an allosteric effect by either influencing protein folding and/or the position of residues (notably D461 and R482) that make up part of the fluoroquinolone binding pocket (Fig. 5B). Interestingly, while gyrB E501D was associated with resistance 1 log2MIC above the moxifloxacin ECOFF, it did not cause a similar elevation for levofloxacin (only 0.1 log2MIC above ECOFF), consistent with previous studies7,38,39. We speculate this could be due to alteration in the coordination of gyrB R482—which must shift to accommodate the bulkier side group of moxifloxacin—although this remains to be shown experimentally (Fig. 5B).
While initial studies on bedaquiline and clofazimine resistance highlighted atpE (bedaquiline), pepQ, Rv0678, and Rv1979c as mediating resistance, surveillance of clinical samples has revealed the importance of the efflux mechanism mediated by the mmpL5 membrane transporter, which is controlled by the transcriptional regulator Rv0678. Consistent with this, we identified sixteen and four mutations in Rv0678 that were associated with elevated bedaquiline and clofazimine MICs respectively, of which four were shared (Figure S2, Table S3). We also identified two mmpL5 mutations that were associated with increased MICs for each drug which were not shared between the two drugs. Finally, we identified both the atpE E61D (n = 3) drug binding site mutation associated with bedaquiline resistance and two mutations in Rv1979c associated with clofazimine resistance. No mutations in pepQ were associated with resistance to either drug. Importantly, 5 unique nonsense and frameshift mutations in mmpL5 increased susceptibility to bedaquiline by -1.9 to -4.0 log2MIC, of which one, mmpL5 Y300Stop, was also shared with clofazimine (Fig. 2A). Inactivating mutations in mmpL5 abrogated resistance mediated by co-occurring Rv0678 mutations, consistent with a hypothesis proposed by a prior study40.
Resistance to linezolid is mediated by mutations in rplC and rrl, which tend to cause higher- and lower-level resistance respectively. We identified the classical rplC C154R (n = 43) mutation and five variants in rrl associated with elevated linezolid MICs (Figure S2, Table S3).
Group C MDR drugs
Aminoglycoside resistance is canonically mediated by mutations in the 16s rRNA encoded by rrs. We identified five and six mutations in rrs that were independently associated with elevated MICs for amikacin and kanamycin respectively (Fig. 5C). Multiple promoter mutations in eis were associated with elevated MICs to kanamycin (7) and amikacin (3). Interestingly, eis promoter mutations were associated with sub-ECOFF elevations in MIC for amikacin, while being associated with elevations in MIC comparable to rrs mutations for kanamycin (AMI ECOFF = 2.3 log2MIC minus baseline). A deletion in eis leading to loss of function was also associated with increased susceptibility to kanamycin, consistent with an epistatic interaction abrogating the resistance gained from eis overproduction41. Variants in aftB, ccsA, whiB6 and whiB7 were also associated with elevated MICs for at least one aminoglycoside, however they were infrequent and require further investigation (Fig. 5C and Table S3).
Ethionamide is a prodrug that is activated by the monooxygenases ethA, mymA (Rv3083), and Rv0565c42. More variants (135) were associated with increased ethionamide resistance than any other drug, with the majority (103) occurring in ethA. Notably however, most (97/103) MIC-elevating ethA variants did not raise the ethionamide MIC above the ECOFF (ETH ECOFF = 2 log2MIC minus baseline). Variants in fabG1 and inhA were common and strongly associated with elevated ethionamide MICs (Figure S2). Seven resistance-associated variants were identified in the alternative activating enzymes for ethionamide, Rv3083 (5) and Rv0565c (2), and three resistance-associated variants were found in the non-canonical ethionamide gene mshA. The relative lack of mutations with significant effects identified in the alternate monooxygenases may reflect their decreased relative abundance as a proportion of the total monooxygenase pools of the strains sampled in this study, as found in a previous study, although this was not biochemically verified here42. Two mutations in ethR were associated with decreased ethionamide MICs, consistent with its role as a regulator of the prodrug activating enzyme ethA.
Resistance to delamanid is mediated by inactivating mutations in ddn or by mutations that affect the cofactor F420 biosynthesis pathway (namely fgd1 and fbiA-D). We identified eleven mutations in ddn, seven in fbiA, and one in fbiC that were associated with increases in delamanid MIC (Figure S2, Table S3). Over half (6/11) of the mutations in ddn were nonsense or frameshift mutations.
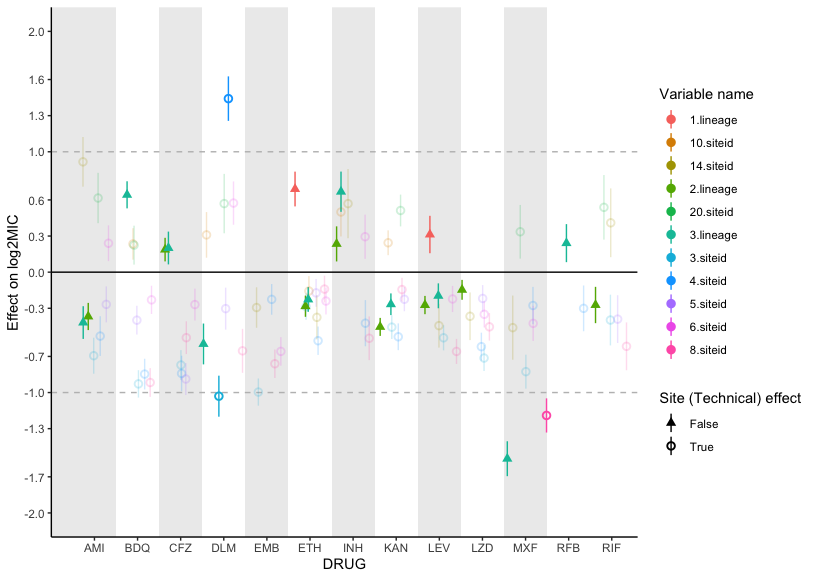
Effect of genetic background on MIC
Several studies have noted that the strain genetic background can influence MICs in addition to primary resistance mutations36,43,44. In this study, we found that the effects of lineage on isolate MIC tended to be small compared to primary resistance allele effects for most drugs (mean lineage effect 0.41 log2MIC, mean lineage effect to median primary resistance allele effect ratio 0.15), yet still statistically significant (Figure S3). Notably however, lineage three was associated with a 1.5 lower moxifloxacin log2MIC compared to lineage four after controlling for primary resistance alleles in gyrA and gyrB.
Interactions beyond additivity
We also sought to identify whether there were any effects beyond additivity for co-occurring mutation pairs. Out of 96 pairs tested across 13 drugs, we identified three mutation pairs with greater than additive effects on ethambutol resistance and two pairs with greater than additive rifampicin resistance (Figure S4, Table S10). The interaction of these mutations resulted in log2MICs increased beyond additivity by 1.4 to 2.4 log2MIC, which resulted in MICs well beyond that of the strongest individual mutations for ethambutol and rpoB S450L for rifampicin. Interestingly, we also identified a mutation pair in rifabutin (rpoB L430P with rpoB D435G) where, in our interaction model, the individual mutations were no longer associated with resistance to rifabutin when occurring individually but are associated with resistance when co-occurring (Table S10). These mutations are in sites previously associated with low-level resistance to rifampicin, so it is possible that the combined disturbance to the drug binding site is required to mediate their resistance-causing potential for rifabutin, although this remains to be experimentally verified. The remaining significant mutation-pairs either consisted of a known resistance mutation with a putative compensatory mutation (such as rpoB with rpoC) or had additive MICs that were in the tails of the distribution, suggesting that interaction effects were reflecting assay thresholds, at least in part, as opposed to true effects.
Extension beyond the 2021 WHO catalogue
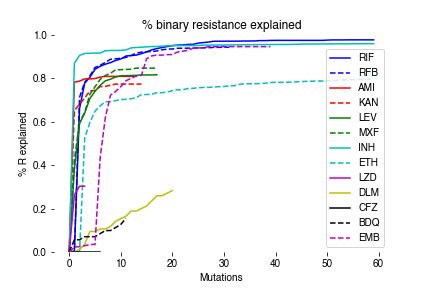
To assess how measurement of MICs improves our ability to detect meaningful genetic associations with resistance/susceptibility, we compared our MIC-based catalogue with the recently published 2021 WHO catalogue for tuberculosis (Table S7)16. 179 unique mutation-phenotype associations were found in both catalogues, with nearly a third (59/179) classified as “resistant – interim”. Our model finds that 61% (36/59) of these mutations are associated with significant elevations in MIC in our data, of which 14 were sub-ECOFF and therefore unlikely to be confidently identified by binary methods. The inability of binary methods to detect these smaller but significant elevations in MIC is also shown by the lack of associations in Rv0678 for bedaquiline and clofazimine in the WHO catalogue, although this is mentioned as a limitation. Notably, we have shown in a separate work that the heritability of resistance for bedaquiline and clofazimine improves dramatically when we detect MICs as opposed to binary phenotypes, consistent with our findings here that many of Rv0678 mutations result in sub-ECOFF elevations in MIC45.