
Reducing carbon footprints of agriculture and food systems

Abstract
Increase in global populations of humans and domesticated livestock are impacting the resource use and have a large ecological footprint (EFP). The ever-increasing EFP of humanity is accelerating climate change, increasing water scarcity and contamination, aggravating soil degradation, and dwindling above and below-ground biodiversity. Several sub-components of EFP include resource footprint (RFP) which comprises land (LFP), water (WFP), nitrogen (NFP), biodiversity (BFP) power (PFP), carbon (CFP), etc. Agricultural practices (e.g., tillage, fertilizer and pesticide use, farm operations such as irrigation, harvesting, baling, etc.) also cause the emission of greenhouse gases (GHGs) such as CO2, CH4, and N2O, and these gasses equivalent in their global warming potential (GWP). In general, CFP is reported as CO2eq by converting CH4 and N2O into CO2. The Human diet, consisting of plant and/or animal-based products and grown diversely with or without chemicals, irrigation, and modern innovations, has a wide range of EFP. The latter, is the widely used measure of resource consumption and humanity’s impact on the planet. EFP encompasses the cumulative GHG emissions by an individual, community, organization, institution, nation for a specific service or product. It can vary widely because of using different reference systems of the studies and differences in system boundaries. Therefore, standardization of the methodologies may require a better understanding of the various ways related CFP concepts are relevant for decisions at individual to global levels. There is no one size that fits all. It is also widely recognized that the global average per capita CFP of humanity, estimated at 4.47 Mg CO2eq in 2020 is not sustainable, and must be reduced to < 2 Mg CO2eqif the global warming is to be limited to 2 0C. Therefore, understanding the magnitude of CFP of agriculture and food systems (FSs), and factors affecting it, can lead to identification of technological options which can enhance the use efficiency of inputs, reduce wastage, and decrease the CFP. Different FSs affect CFP through diverse components of production and supply chains, and in the manner in which food is stored and cooked and the waste is disposed or recycled. There is need to adopt international standard (ISO) protocol. Therefore, this review identifies and deliberates technological options which may be needed for reducing CFP of humanity in general but that of agriculture and FSs in particular, while also advancing Sustainable Development Goals of the Agenda 2030 of the United Nations. CFP of diverse agro-ecosystems, land use and management systems are also discussed. Specific examples of CFP include type of farming systems (organic vs.. conventional, dietary preferences, and food waste). There are several options for the humanity to change lifestyle and make it more sustainable. Food waste, about one-third of all, is an important factor impacting CFP while also accelerating global warming. The impact of avoidable food waste on gaseous emissions, estimated at 2.0 to 3.6 Mg CO2eq per Mg of food waste on dry weight basis, must be minimized.
Keywords
INTRODUCTION
Anthropogenic warming of the planet is among serious global issues of the 21st Century. The present civilization since c 1750 is appropriately called the “Carbon Civilization“(Lal[1], 2007), because of its dependence on fossil C as a source of energy. Since the onset of Industrial Era c 1750, total anthropogenic emissions are estimated at ~690 Pg of carbon (C), two-third of which came from fossil fuel combustion and one-third from land use change [Table 1]. However, ~30% of the anthropogenic emissions have been and are absorbed by the land-based sinks and another 25% by the ocean [Table 1]. Absorption by natural sinks raises the issue of net vs. gross emissions as basis for human accountability, as well as responsibility for predicted sink saturation and sink decline due to anthropogenic activities. Indeed, the 4 per 1000 initiative launched at COP21 in Paris in 2015 was based on the net emissions [Table 1]. Yet, agriculture contributes about 14% (Grünberg et al.[2], 2010) and food systems (FSs) about one-third of anthropogenic greenhouse gas (GHG) emissions (IPCC 2019; Balogh[3,4] 2019). Emission of GHGs from agriculture and FSs is increasing because of an ever growing and progressively affluent human population. Success of the Green Revolution technology since the second half of the 20th Century came at a cost of a significant ecological/environmental footprint or EFP (Khan and Hanjra[5], 2009). Increase in global population at the rate of about 1% per year, from 7.95 B in February 2022 to 9.7 B in 2050 and 11B in 2100 (U.N., 2019)[6], is worrisome in terms of its EFP. In the context of Sustainable Development Goal (SDG) #2 of achieving Zero Hunger by 2030, 691 M were food-insecure in December 2019 prior to COVID Pandemic and the number increased to 820 M by December 2020 (FAO and UNICEF and WHO, 2021)[7]. It is widely argued that SDG #2 will not be realized by 2030. Indeed, global food insecurity is a complex problem. Some perceive the problem as not enough food and argue about the need to increase supply, while others believe the need for reducing consumption and avoiding food waste and emphasizing the need to shift diets. It is apparent, therefore, that achieving worlds sustainable FSs will necessitate simultaneous action on many fronts; improved supply of nutritious food and reduced demand and waste (Röös et al.[8], 2017; Fanzo et al.[9], 2021; von Braun et al [10], 2021). Thus, there is a strong need to reduce the environmental impact by reducing GHG emissions from agriculture and FSs and by re-carbonization of the terrestrial biosphere. Yes, reducing environmental impact by improving agriculture and transforming FSs are among the highest priorities for limiting global warming to 2 0C, and advancing SDGs of the Agenda 2030 of the U.N. (U.N., 2015; Lal et al.[11,12], 2021). Therefore, the objectives of this article are: (1) to review the degree to which various foot prints reflect the key issues and response options; and (2) using CFP concepts, review priorities for action at various levels of decision-making.
Historic carbon emission from land use and fossil fuel emissions (recalculated from Friedlingstein et al.[82] (2021)
| Source/Sink | PgC | ||||
| 1750-2020 | 1850-2021 | 1960-2020 | 2021 | ||
| I Source | |||||
| Land Use Change | 235 ± 75 | 205 ± 65 | 80 ± 45 | 9.7 ± 0.5 | |
| Fossil Fuel | 460 ± 25 | 465 ± 65 | 375 ± 20 | 0.8 ± 0.7 | |
| Total | 690 ± 80 | 670 ± 65 | 455 ± 45 | 10.5 ± 0.9 | |
| II Sink | |||||
| Atmosphere | 290 ± 5 | 270 ± 5 | 205 ± 5 | 4.2 ± 0.4 | |
| Ocean | 180 ± 35 | 170 ± 35 | 115 ± 25 | 2.9 ± 0.4 | |
| Land | 215 ± 50 | 200 ± 45 | 135 ± 25 | 3.3 ± 1 | |
| Imbalance | 10 | 25 | 0 | 0.1 | |
| Land/Sink (% of total source) | 31.1 | 29.9 | 29.8 | 31.4 | |
INDICATORS OF ENVIRONMENTAL FOOTPRINT
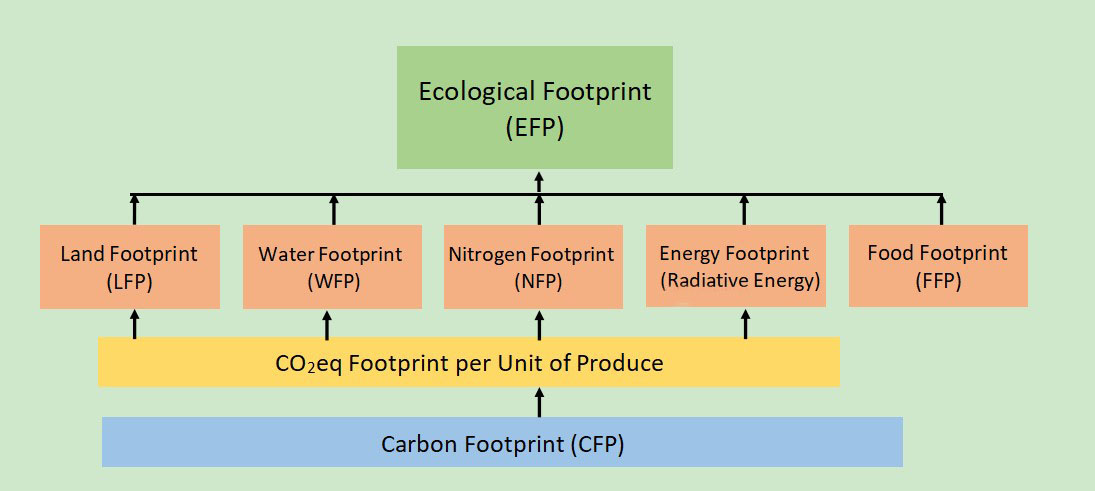
Pertinent indicators of environmental impact of agriculture and FSs are parameters that reflect the direct and indirect measures of resource consumption and adverse changes in quality and functionality of finite, critical and fragile natural resources. Some important among these ecological indicators are quality of soil, water, atmosphere or air, and biodiversity. Rather than being considered as factors of production, natural resources can be considered as finite, fragile and non-renewable. Wiek & Tkacz[13] (2013) proposed the concept of “ecological indicator” or EFP based on life cycle analysis for a wide range of products and services, to signify ecological assets that a community needs and the natural resources it uses to produce the essential goods and services and to absorb or dispose the waste or by-product. In relation to global warming and anthropogenic emissions, therefore, EFP, comprising of all components including water and biodiversity, is an indicator of GHG emissions in production of goods or services. This indicator, converted to a carbon (C) equivalent for product and services for the entire life cycle from the cradle to grave is called “carbon footprint” or CFP. The latter is a widely used in the public domain to address the threat of anthropogenic climate change (Chen et al.[14], 2021). CFP, being the main component of EFP, may represent more than 50% of the total EFP of an agricultural product (Balogh[4], 2019). However, the EFP comprises of a range of components such as land (LFP), water (WFP), biodiversity (BFP), nitrogen (NFP), food (FFP), resources (RFP) etc. [Figure 1]. The term CFP refers to a collective numerical value of all components of EFP (e.g, LFP, WFP, BFP, RFP, FFP etc.) reported in terms of carbon dioxide equivalent (CO2eq). Thus, CFP is widely used in the context of global climate change and identification of options for its mitigation and adaptation.

Figure 1. Components of ecological footprint.
Understanding the magnitude of CFP of agriculture and FSs, and factors affecting it, can lead to identification of technological options which can enhance the use efficiency of inputs, reduce wastage, and decrease the CFP.
The CFP includes total amount of all GHGs, including carbon dioxide (CO2), methane (CH4) and nitrous oxide (N2O), emitted by an activity (e.g., agriculture, transport, landfill of waste) [Figure 2]. Specifically, CFP encompasses the cumulative GHG emissions and there are different ways of expressing CFP such as at level of an individual, community, organization, institution, or service. Principal sources of GHGs from agriculture are N2O from soils through inputs of inorganic fertilizer and organic amendments (i.e., compost, manure, biological nitrogen fixation), CH4 from enteric fermentation in ruminants and emission from rice paddies (Röös et al.[15], 2014) and CO2 from land use conversion (e.g., deforestation, and diesel consumption in farm operation) including tillage and drainage of wetlands for cultivation of upland crops. Assessing the impact of agricultural drainage on increasing emissions of adjacent forest is a challenging issue which needs to be addressed. Because the radiative-forcing or the global warming potential (GWP) of CH4 and of N2O is higher than that of CO2, appropriate factors are used to convert emissions of all GHGs to CO2eq depending upon an agreed timeframe (IPCC, 1996)[16].The GWP is a measure of the relative, globally-averaged warming effect arising from the emissions of a particular GHG [Table 2].
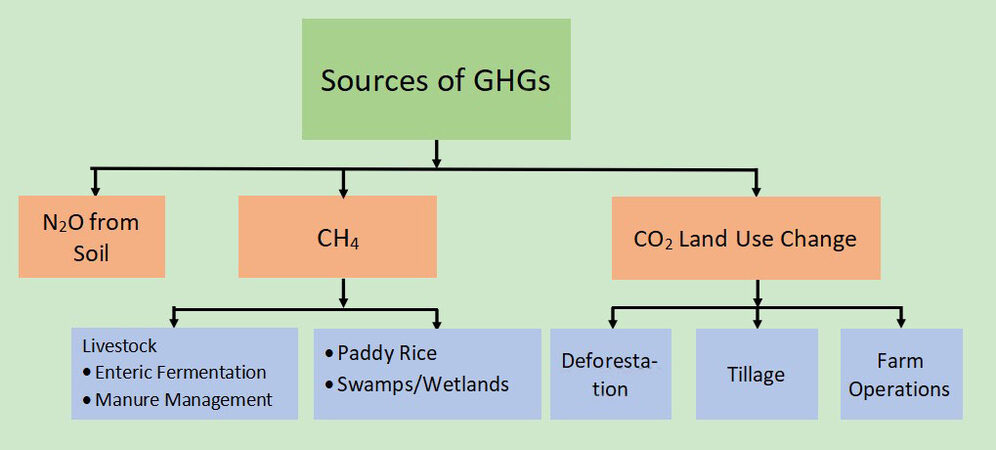
Figure 2. Carbon footprint of food products.
Global warming potential of 3GHGs for different time horizons (adopted from (Ramaswamy et al.[83], 2001)
| Gas | 20 | 100 | 500 |
| CO2 | 1 | 1 | 1 |
| CH4 | 62 | 23 | 7 |
| N2O | 275 | 296 | 156 |
| CFC11 | 6300 | 4600 | 1600 |
| CFC12 | 10,200 | 10,600 | 5200 |
| HCFC21 | 700 | 210 | 65 |
| HCFC22 | 4800 | 1700 | 540 |
Agricultural practices (e.g., tillage, fertilizer and pesticide use, farm operations, irrigation, harvesting, bailing etc.) have different emission of CO2eq (Lal[17], 2004). Similarly, crop production and animal raising differ in their GWP. Drainage and cultivation of peatland is the major cause of emission of GHGs. The calculated GHG emissions of farm products, place or an activity over a specified period is needed to compute CFP. In general, CFP is reported in the units of Kg CO2eq by converting CH4 and N2O into CO2equivalent.
CFP can vary widely because of using different reference systems of the studies and differences in system boundaries (Grünberg et al.[2], 2010). Therefore, standardization of the methodologies following the international Standard (ISO) is critical to obtaining credible information for making sound decisions. Thus, a wide range of CFP reported in the literature for the same product or service may be attributed to differences in the complete or some parts of the value chain rather than that for the whole life cycle. Choosing a different baseline, and different emission factors can also lead to differences in CFP for the same product or service (Grünberg et al.[2], 2010).
PER CAPITA EMISSIONS
The global annual average per capita CFP differ among countries based on their economic development and lifestyle. The national average per capita CFP (Mg CO2eq) varies widely and in 2020 is estimated at 15.52 for USA, 7.38 for China and 1.91 for India with corresponding population of 323 million, 1.41 billion and 1.35 billion, respectively [Table 3]. The national average per capita CFP is higher for developed than developing nations. The lowest per capita CFP at present is for countries in Sub-Saharan Africa followed by those in South Asia [Table 3]. The global per capita CFP (Mg CO2eq) was 3.1 in 1960, 4.1 in 1970, 4.6 in 1980, 3.9 in 1990, 3.8 in 2000, 4.48 in 2010 and 4.48 in 2020 [Table 4], (World Bank, 2019)[18]. Tiseo[19] (2021) reported that global average per capita CO2 emission dropped by about 7% in 2020 because of the disruptions by COVID pandemic. There is also large variation in per capita CO2 emission among G20 nations. For 2020, per capita CO2 emissions (Mg CO2/person. Yr.) in G20 countries in descending order was Saudi Arabia (16.76), Australia (15.21),Canada (14.43), USA (13.68), South Korea (12.06), Russia (11.64), Japan (8.39), China (8.19), Germany (7.71), South Africa (7.41), Italy (5.03), Turkey (4.83), United Kingdom (4.66), France (4.26), Argentina (3.87), Mexico (3.04), Brazil (2.11), Indonesia (2.08) and India (1.74) (Statista.com). Countries with the highest per capita CO2 emissions are Qatar (30.7), Kuwait (21.3), Gibraltar (21.1) and Bahrain (19.9).However, the global average per capita CFP of 4.47 Mg CO2eq in 2020 must be reduced to < 2 Mg CO2eq by 2050 if the global warming is to be limited to 2 0C.
Comparison of carbon foot print (Mg CO2eq/person/year) of 25 countries in sub-Saharan Africa, South and Central Asia, Americas-Europe (adapted from Worldometer, 2022)[84]
| Carbon Footprint (Mg CO2eq/person/yr) | |||||||
| Sub-Saharan Africa | Developing and developed Asia | Europe and Americas | |||||
| Zimbabwe | 0.72 | Turkmenistan | 14.0 | Canada | 18.58 | ||
| Benin | 0.60 | Kazakhstan | 13.01 | Australia | 17.1 | ||
| Senegal | 0.55 | South Korea | 11.85 | USA | 15.52 | ||
| Ghana | 0.51 | Taiwan | 11.72 | Russia | 11.44 | ||
| Nigeria | 0.44 | Japan | 9.70 | Netherland | 9.62 | ||
| Ivory Coast | 0.42 | Malaysia | 8.66 | Germany | 9.44 | ||
| Cameron | 0.40 | Singapore | 8.56 | Finland | 9.31 | ||
| Kenya | 0.33 | China | 8.19 | Austria | 8.43 | ||
| Sudan | 0.33 | Iran | 8.08 | Belgium | 8.34 | ||
| Togo | 0.31 | Hong Kong | 6.50 | Ireland | 8.32 | ||
| Mozambique | 0.21 | Thailand | 3.93 | Norway | 8.28 | ||
| Tanzania | 0.18 | Uzbekistan | 3.68 | Poland | 7.80 | ||
| Liberia | 0.18 | Azerbaijan | 3.50 | Denmark | 6.65 | ||
| Sierra Leone | 0.17 | Bhutan | 2.28 | Italy | 5.90 | ||
| Uganda | 0.13 | Vietnam | 2.20 | Venezuela | 5.89 | ||
| Bukina Faso | 0.13 | Indonesia | 2.03 | U.K. | 5.58 | ||
| Madagascar | 0.12 | India | 1.91 | Spain | 5.40 | ||
| Rwand | 0.12 | Philippines | 1.22 | Hungry | 5.23 | ||
| Malawi | 0.11 | Kyrgyzstan | 1.14 | France | 5.13 | ||
| Chael | 0.11 | Sri Lanka | 0.88 | Switzerland | 4.73 | ||
| Ethiopia | 0.10 | Pakistan | 0.87 | Serbia | 4.65 | ||
| Nigel | 0.10 | Tajikistan | 0.70 | Argentina | 4.61 | ||
| Mali | 0.09 | Bangladesh | 0.47 | Sweden | 4.54 | ||
| Somalia | 0.09 | Cambodia | 0.41 | Mexico | 3.58 | ||
| DR Congo | 0.08 | Myanmar | 0.31 | Brazil | 2.25 | ||
| Nepal | 0.29 | ||||||
| Afghanistan | 0.28 | ||||||
Temporal Changes in Global per Capita CO2 Emissions (Mg CO2 /Person (year) between 1960 and 2020 (World Bank, 2019, Tiseo, 2021)[18,19]
| Year | World bank | Statista.com |
| 1960 | 3.12 | 3.05 |
| 1965 | 3.43 | 3.39 |
| 1970 | 4.15 | 4.03 |
| 1975 | 4.34 | 4.18 |
| 1980 | 4.60 | 4.37 |
| 1985 | 4.43 | 4.17 |
| 1990 | 3.90 | 4.27 |
| 1995 | 3.78 | 4.08 |
| 2000 | 3.81 | 4.11 |
| 2005 | 4.20 | 4.53 |
| 2010 | 4.48 | 4.79 |
| 2015 | 4.48 | 4.81 |
| 2018 | 4.48 | 4.80 |
| 2020 | 4.47 | 4.47 (COVID) |
IMPORTANCE OF AGRICULTURE AND FOOD SYSTEMS IN CARBON FOOTPRINT
It is widely recognized that the present EFP of humanity is not sustainable. Through land use conversion for agriculture and other anthropogenic activities, humanity has altered planetary processes by strongly transforming the earth’s landscape, drastically increasing the resource use and generating a huge amount of waste. Hoekstra & Wiedmann[20] (2014) observed that actual versus sustainable EFP of humanity was 18.2 vs. 12 B ha of land, 46-55 vs.18-25 Gt of CO2eq. per year, 1000-1700 vs. 1100-4500 B m3 of blue water, and 10.5 vs. 8.0 Mg/capita of material foot print. Hoekstra and Wiedmann also observed that humanity’s WFP (B m3 per year) was 6700 for green water and 1400 for gray water. Food and agriculture are the vital components of human wellbeing and the heart of civilization that began with the onset of agriculture about 8000 BC. Most religions and cultures celebrate agriculture and soil as a part of their heritage (Lal[21], 2013). Indeed, sustainable management of soil and agriculture are critical to achieving world peace and stability (Lal[22], 2015). Agriculture and FSs are also major consumer of natural resources. Presently, more than 40% of the ice-free land is used for agriculture accounting for 3.75 B ha allocated for raising animals and 1.5 B ha for growing crops. Further, 70% of all fresh water withdraw is used for irrigation. Despite being an issue that is the heart of humanity, as documented by diverse religions and cultures (Lal[21], 2013; Lal[22], 2015), agriculture and FSs also have their ugly side (hunger and malnutrition) which must be addressed. The latter involves perpetuation of hunger and hidden hunger and adverse impacts of agriculture and FSs on environment (e.g., soil, water, air and biodiversity).
FSs are complex and all-inclusive. The first step of FSs, growing crops and raising livestock, involves agriculture, horticulture, forestry and fishery. In addition to growing food, other components of the FSs are transporting, processing, distributing, using, preparing, consuming and disposing of the food waste. The present FSs have severe limitations such as failing to end hunger and malnutrition, not being able to provide adequate amount of safe and nutritious food to all people, and being responsible for degrading soils, polluting water, aggravating global warming, dwindling biodiversity and denuding the landscape. Indeed, one-third of all soils are degraded (FAO & ITPS, 2015; IPBES, 2019)[23,24]. Furthermore, emissions from FSs (production and supply chains) account for 25%-30% of all anthropogenic emissions (IPCC, 2019)[3], and are increasing at the rate of 1% per year. Yet, prevalence of undernutrition affects 820 million and that of malnutrition 2 billion people, and the ever increasing number of soil and climate refugees is threatening the global peace and stability (Lal[22], 2015). Above all, the problem of inadequacy of FSs has been aggravated through the disruptions in all components (both production and supply chain) caused by the COVID pandemics (Lal et al.[25], 2020).
Being a major source of biomass for human needs, agriculture is a major factor affecting per capita national [Table 3] and global [Table 4] CFP. Weinzettel et al.[26] (2019) evaluated potential net primary productivity (NPPpot) of 186 agricultural crops in 236 countries, and found that human society appropriate 20% (13 Pg C) of global NPP, which may increase with growing and increasingly affluent world population.
Of the total CFP, agriculture and FSs constitute a large component, especially in developing countries [Table 3]. COP-26 in Glasgow (2021) identified five pillars to reduce CFP: (1) end waste; (2) use electricity prudently; (3) adopt bioenergy for circular economy; (4) use hydrogen; and (5) sequester carbon (C). The last pillar of C sequestration is important to agro-ecosystems, most of which are strongly depleted of their terrestrial C reserves (Lal[27], 2018), and have a large potential to sequester atmospheric CO2 in biomass (trees, forests, woodlands) and soil (Lal et al.[28], 2018). Sequestration of atmospheric CO2 in agroecosystems is an important option to reduce humanity’s CFP.A wide range of agricultural factors play an important role in CFP of agriculture production. Balogh[4] (2019) argued that CFP of agriculture depends on economic development and agricultural production such as arable land, agricultural machinery, fertilizer use, irrigation, and other inputs. Therefore, the strategy of reducing CFP of FSs is to identify factors affecting productivity and use-efficiency of agriculture, and to identify site-specific technological options, based on recommended and science-based proven practices, which can reduce the CFP of food products and other related commodities.
FACTORS AFFECTING CFP OF AGRICULTURE
The global FSs vary widely from production of chemicals (e.g., fertilizers, pesticides) and seed to food packaging, and diverse agronomic systems such as with or without tillage, irrigation, chemicals, residue retention, and genetically modified organisms (Lal[17], 2004a). Fertilizer use has drastically increased in Asia and Latin America. Total and rate of fertilizer use in India from 1950 to 2020 in Table 5 indicate drastic increase. Similar trends are observed in China, Brazil and elsewhere in emerging economies. Thus, treating soil as a factor of production or a finite resource, and crop residues as a resource or waste can make a strong difference in CFP. Developing methods for credible estimation of the CFP is important to identifying policies for promoting those food/agricultural systems which have low and discouraging those which have a high CFP. Such understanding is critical to making the environment-friendly choices in lifestyle of a community, region or a nation. Components of the life cycle analysis for FSs may include raw material acquisition (e.g., land, chemicals, energy for farm operations, irrigation water lift and application), processing, packaging, storage, transportation, consumption, along with disposal of food waste (Xu et al.[29], 2015). The CFP can be computed on the basis of footprint weight, sustainability measures, and % daily value (Leach et al.[30], 2016). It comprises of direct and indirect emissions of GHGs. Direct emissions are those GHGs which are released at each step of the process and indirect are CO2eq emissions caused by energy consumption in each process (Wu et al.[31], 2013). Identification and quantification of these components of CFP, outlined in Figure 1, is essential to developing strategies of optimizing the CFP. Thus, there is a need to develop methodology that permits assessment of foot print of diverse entities (e.g., water, biodiversity) into common units. Assessing footprint of each component is essential to developing strategies of reducing CFP and advancing practices which lead to sustainable development based on ecological principles of production and consumption.
Fertilizer (N + P2O5 + K2O) use in India and the world (FAO, 2021)[85]
| Year | Total (Mt/yr) | Rate (kg/ha) | India as % of World | |||
| India | World | India | World | Total | Rate | |
| 1950 | 0.069 | - | 0.49 | - | - | - |
| 1960 | 0.294 | 30.9 | 1.93 | 30.85 | 0.95 | 6.26 |
| 1970 | 2.257 | 68.61 | 13.61 | 68.61 | 3.29 | 19.84 |
| 1980 | 5.517 | 115.79 | 31.95 | 115.79 | 4.76 | 27.59 |
| 1990 | 12.539 | 136.95 | 67.55 | 136.95 | 9.16 | 49.32 |
| 2000 | 16.702 | 134.75 | 90.12 | 134.75 | 12.39 | 66.88 |
| 2010 | 28.124 | 173.76 | 141.93 | 173.76 | 16.18 | 81.88 |
| 2015 | 25.58 | 184.01 | 135.76 | 186.02 | 13.90 | 73.00 |
| 2018 | 27.2 | 194.39 | 160.8 | 120.9 | 14.5 | 133.0 |
| 2019 | 29.4 | 198.10 | 173.5 | 122.9 | 15.4 | 141.2 |
| 2020 | 32.512 | 201.66 | 161.01 | 188.52 | 16.1 | 85.4 |
CARBON SEQUESTRATION FOR REDUCING CFP OF A PRODUCT OR SERVICE
Carbon capture and storage (CCS) in soil and vegetation is called terrestrial sequestration. CCS in terrestrial ecosystems is a natural process and is based on the removal of atmospheric CO2 by photosynthesis and retention of biomass-C in soil and vegetation so that it is not re-emitted into the atmosphere but is retained in the terrestrial ecosystems for a longtime. In this context, a primary goal of sustainable systems of soil, crop, tree and livestock management is to protect, restore and manage the terrestrial C stocks so as to enhance or prolong their mean residence time (MRT). In this context, CCS in soil and vegetation involves different processes than those involved in CO2 injection into stable geological strata. The latter comprises of C capture from point sources (e.g., chimney of a coal-fired power plant, ethanol production from corn grains) and injection into stable and impermeable geological strata, old coal seams, oil wells or saline aquifers. CCS in land-based sinks is a natural process, based on photosynthesis and secure storage of biomass -C (above and below ground), soil organic C (SOC), and soil inorganic C (SIC) with a long MRT (Lal[17], 2004; 2010; Lal, et al.[32], 2021). Indeed, C sequestration in global cropland production is considered a viable option to reduce GHG emission while producing nutritious food for the growing human population (Lu et al.[33], 2018).
CARBON FOOTPRINT OF CROPS AND CROPPING SYSTEMS
Global arable land use, comprising of 1500 million hectare (M ha) has a strong impact on CFP of agriculture. Thus, improving cropping systems can reduce emission of GHGs from soil and farming operations. Total GHG emission from cropping systems involves all farm operations e.g., seedbed preparation, application of fertilizers (e.g., Table 5 for India) and pesticides, irrigation, harvesting, grain drying, etc. There are large hidden C costs of all inputs such as fertilizers, herbicides, pesticides) (Lal, 2004a). CFP also involves emission from decomposition of straw and roots, and those from mineralization of soil organic matter (SOM) (Lal[17], 2004a).
The CFP of agroecosystems is affected by increasing use of inputs such as fertilizers, pesticides, tillage and irrigation. Millar et al.[34] (2014) reported that in crop production,75% of total emissions are attributed to N fertilizer use (both organic and inorganic). Use of N fertilizer affects CFP from production, application and direct emission of N2O from soil following application of fertilizers. Millar et al. (2014)[34] also argued that once N is accounted for, there are no differences among organic, integrated, or conventional farming practices. Therefore, optimizing the use efficiency of inputs and enhancing productivity can spare the land. Vittis et al.[35] (2021) reported that the LFP of agroecosystems can be reduced by closing the yield gap, optimizing fertilizer inputs, and allocating 16 major crops across the global cropland. Vittis and colleagues estimated that global cropland area can be reduced by 50% of its current extent (1500 M ha) and spared land returned back to nature. Among numerous ecological benefits, the spared cropland would provide space for terrestrial C sequestration in soil and vegetation.
It is a high priority to reduce humanity’s LFP by optimizing the land use and returning some land back to nature (Lal[27], 2018). Sparing current forests from conversion is an effective strategy, but can only happen if adequate livelihood options are available to those involved in agricultural horizontal expansion. Furthermore, closing yield gaps may not always lead to closing efficiency gaps. For example, optimizing or minimizing CFP by managing rate of N fertilization in some crops may differ from economic mineralization.
AGRICULTURAL MANAGEMENT PRACTICES TO REDUCE CARBON FOOTPRINT
Adoption of site-specific and science-based and sustainable management practices are critical to reducing CFP of agriculture/FSs, and leading to adaptation and mitigation of climate change, reducing per capita land use, and attaining the operating space within the planetary boundaries (Rockström et al.[36], 2009). In addition to reducing emission from crop production, GHG emission from agroecosystems can be off- set by sequestration of C in soil as SOC and SIC. Some examples given below indicate the options of reducing CFP by using science-based management practices. Liu et al.[37] (2018) estimated the gross CFP of crop production in China from 2000 to 2015 at 133 Tg of CO2eq per year. However, soil C sequestration was estimated at 25 Tg CO2eq per year, and thus, the net CFP for crop production in China was 108 Tg of CO2eq per year. Liu and colleagues also observed that the farm CFP in China decreased by 9% because the proportion of crop residue retention increased by 26.4% and the improved use efficiency of N fertilization which also decreased the rate of input of N fertilizer by 8.4 Kg N/(ha.yr).
In India, total amount and rate of fertilizer use increased drastically between 1950 and 2020 [Table 5].Thus, emission from agriculture sector have increased since 1950s, partly because of low use efficiency of fertilizers (such as N) and unbalanced use of fertilizers. Sah and Devakumar[38] (2018) reported that emissions have increased 161% from 14.81 Tg Ceq /yr (0.12Mg C eq/(ha.yr) in 1960 to 38.71 Tg Ceq (0.28 Mg Ceq/(ha.yr)) in 2010.This increase is attributed to decrease in area of less C-intensive coarse cereals and 22% increase in rice cultivation. Among crops, emission was 23.71 Tg Ceq for rice compared with 2.98 Tg Ceq for red gram. Emission of N2O and CH4 were the major contributors.
Rather than sequestration, conversion of natural to agricultural ecosystems can lead to loss of soil C pool. For example, a study on the impact of land use conversion was conducted for the
U.S. Western Corn Belt by Lu et al.[33] (2018). In comparison with the baseline period of 1980-2005, Lu et al.[33] found that cropland expansion more than tripled in 2006-2016, and the resultant land use change led to soil C loss of 90.5 ± 14.7 Tg C. Thus, grain production in this region changed from C neutral to C loss of 2.3 Kg C/kg of grain produced. Conversion of C-rich soils from natural to agro-ecosystems can lead to a negative C budget and increase the CFP. On the contrary, adoption of bioeconomy can reduce emissions and also reduce CFP. For example, a study in EU by O’Brien et al.[39] (2015) evaluated CFP of EU-27 for the period of 2000 to 2011, and found that promotion of bioeconomy decreased the LFP by 1% annually reaching 0.29 ha/capita by 2011. O’Brien and colleagues suggested that bioeconomy could decrease per capita cropland at the rate of 2%per annum and achieve the safe operating space within planetary boundaries by 2030.
Cropping systems, based on cover cropping and use of legume-based rotations can also reduce CFP. Based on a study for determination of CFP of durum wheat (Triticum tugidum) in Saskatchewan, Canada, Gan et al.[40] (2011) observed that decomposition of crop straw accounted for 25% of total emissions; those from production, transportation, storage and delivery of (Gan et al.[40], 2011) fertilizers and pesticides to farm gates and their application 43%, and emission from other farming operations 32%. Gan and colleagues also observed that the durum wheat grown in rotation with an oilseed crop (Brassica spp.) had CFP of 0.33 kg CO2eq /kg of grain that was 7% lower than the cereal-cereal durum system. The CFP of durum was lowered by 17% when it was grown in rotation with N-fixing pulse crop, and by 34% in pulse-pulse-durum system (0.27 kg CO2eq/kg of grain). These studies raise questions on the accounting system boundaries used. For example, if straw decomposition is counted as a loss, it may be based on the assumption that aboveground productivity is counted as a “sequestration”. Therefore, it may be appropriate to use IPCC national accounting standards. It is also essential to develop a rule for partitioning system-level emissions to component crops.
Importance of crop rotations and residue management to reducing CFP of cropping systems has been reported in several studies. These practices are also called climate smart agriculture (FAO, 2013)[41]. Brankatschk and Finkbeiner[42] (2017) reported that ignoring crop rotation would lead to underestimation of the annual GHG savings of EU-28 rapeseed biodiesel by 1.67 TgCO2eq .Thus, they argued that crop rotations and straw harvest must be considered for the product CFP of bread, milk and first and second generation of biofuels, and these recommendations are relevant to all regions of the world.
In addition to cereals, soybean is an important crop as a source of protein, and oil. Castanheira and Freire[43] (2013) observed large variation in CFP of soybean ranging from 0.1 to 17.8 kg CO2eq/kg of soybean depending on original land use and soil/crop management. The highest GHG emissions were calculated for tropical moist region when rainforest is converted to soybean cultivation. Without considering the land use conversion, CFP varies from 0.3-0.6 Kg CO2eq/kg of soybean. Furthermore, all mechanical tillage systems have more GHG emission than a no-till (NT) system, and N2O emission is an important factor affecting CFP.
Horticultural crops (e.g., vegetables) have a different CFP than cereals and other crops because of differences in farm operations and in inputs. In rapidly urbanizing China, Hu et al.[44] (2019) estimated the CFP of urban agriculture in Beijing with the focus on vegetables. Based on production, transportation and distribution of 1 kg of fresh vegetables, Hu and colleagues estimated the CFP (CO2eq/kg of fresh vegetables) at 0.318 for conventional and 0.624-0.652 for home delivery systems.
TILLAGE SYSTEMS AND CFP OF CROPPING SYSTEMS
Global adoption of conservation agriculture (CA) is gaining momentum [Table 6]. Land area under CA is estimated at about 180 M ha or about 12.5% of global crop land (Kassam et al.[45], 2019), and it is widely adopted in South America (e.g., Brazil, Argentina, Chile, Paraguay ), and is also gaining popularity elsewhere. Among numerous merits of a system-based CA are soil and water conservation, reduction in use of energy for farm operations, and in saving of time in establishing a second crop with a short time between harvesting one crop and seeding the second crop such as in the case of rice-wheat system in the Indo-Gangetic Plains of South Asia. A system-based CA can enhance use efficiency of inputs, sustain agronomic productivity and lead to sequestration of SOC in the surface layers (Lal[22], 2015; Lal et al.[46], 2017). Above all, conversion of plow-based tillage to NT-based CA can lead to saving in energy needed to perform primary and secondary tillage operations [Table 7]. Thus, CFP of a cropping system can be drastically reduced by conversion of conventional tillage to CA and saving in fertilizers and pesticide use through adoption of integrated soil fertility management, integration of pest management, and integration of crops with trees and livestock (Lal[25], 2020).The latter involves complex systems such as agro-pastoral, silvo-pastoral, agri-silvo and agro-silvo-pastoral systems (Okigbo & Lal[47], 1977; Nair et al.[48], 2009; Rosenstock et al.[49], 2019).
Global adoptions of conservation agriculture (adapted from Kassam et al.[45], 2019)
| Region | Global Cropland Area Under CA (106 ha) |
| South America | 69.90 |
| North America | 63.18 |
| Australia and NZ | 22.67 |
| Asia | 13.93 |
| Russia + Ukraine | 5.70 |
| Europe | 3.56 |
| Africa | 1.51 |
| Total | 180.44 |
Carbon emission from diesel consumption for different tillage operations, fertilizers and pesticide use (adapted from Lal[17], 2004)
| Farm operations | Carbon footprint | Units | |
| I | Tillage Sub-soiling | 11.3 ± 2.8 | Kg Ceq/ha |
| Moldbourd Plowing | 15.2 ± 4.1 | ||
| Chisel Tillage | 7.9 ± 2.3 | ||
| Heavy Disc Plowing | 8.3 ± 2.5 | ||
| Chisel Tillage | 4.0 ± 1.9 | ||
| Heavy Disc Plowing | 8.3 ± 2.5 | ||
| Field Cultivation | 4.0 ± 1.9 | ||
| Rotary hoeing | 2.0 ± 0.9 | ||
| II | Fertilizer Nitrogen | 1.3 ± 0.3 | Kg Ceq/ Kg nutrient |
| Phosphorus | 0.2 ± 0.06 | ||
| Potassium | 0.15 ± 0.06 | ||
| Lime | 0.16 ± 0.11 | ||
| III | Pesticides Herbicides | 6.3 ± 2.7 | Kg Ceq/ Kg a.i. |
| Insecticides | 5.1 ± 3.0 | ||
| Fungicides | 3.9 ± 2.2 | ||
With tillage and inputs being important determinant of CFP of cropping systems, use of precision agriculture technology (PATs) can also impact the magnitude of CFP by savings of inputs (Brown et al.[50], 2016). Adoption of PATs in conjunction with CA and drip sub-fertigation can reduce CFP.
PLANTATION AND HORTICULTURAL CROPS
Similarly to cropland, coffee and horticultural crops also have a large CFP. Ratchawat et al.[51] (2020) reported CFP (kg CO2eq/kg) of Robusta coffee products at 0.40 ± 0.12 of coffee cherry, 0.55 ± 0.08 for roasted coffee and 0.56 ± 0.08 for ground coffee. Ratchawat and colleagues estimated that almost 70% of all GHG emission came from chemical fertilizers involving both production and application. WFP (m3/kg) was 10 for coffee cherries and 27 for roasted and ground coffee. Based on the data from 116 coffee farms in five Latin American countries, van Rikxoort et al.[52] (2014) evaluated CFP of four production systems: (1) traditional polyculture; (2) commercial polyculture; (3) shaded monoculture; and (4) unshaded monoculture. Rikxoort and colleagues found that polycultures have a lower mean CFP of 6.2-7.3 Kg CO2eq/kg of parchment coffee than monocultures of 9.0-10.8.kg.It was also found that traditional polycultures have a much higher C stock in the vegetation at 42.5 Mg/ha than the unshaded monoculture of 10.5Mg/ha. Martins et al.[53] (2018) computed the CFP of Brazilian coffee production from 2004-2005 to 2014-2015. Based on data of plantation area and coffee production, Martins and colleagues estimated that CFP and WFP were 19.79 Tg CO2eq and 49284 M m3 of water, respectively. Martins and colleagues computed CFP for total resource use and impacts, which differs than the way it is defined in this article as footprint per unit of product or human activity.
LIVESTOCK MANAGEMENT
Livestock are an important component of agriculture, especially in case of small land holders and resource-poor farmers. In comparison with crops, livestock management is resource-intensive and requires high energy, water, land, nutrient and infra-structure investment. Therefore, it is important to identify practices of sustainable management of livestock, and is also critical to educate the consumer about judicious use of animal-based products (i.e., meat, dairy). Globally, livestock sector is estimated to account for 15% of GHG emission, 80% of these emissions originate from ruminant animal systems involving enteric fermentation and manure management (Persson et al.[54], 2015). Thus, emissions from livestock sector have raised numerous questions regarding the possibility of reducing animal-based diet as a strategy to reduce emission of GHGs.
Livestock is an important component of India’s agriculture sector. In 2012, India’s livestock sector produced 304,31 and 4 Tg in CO2eq of enteric CH4, manure CH4,and N2O, respectively (Patra[55], 2017). The relative contribution (% of total) of different species to GHGs was 55, 37, 4, 2.1 and 1 for cattle, buffalo, sheep, goat, pig and other animals, respectively. Enteric fermentation was the major contributor and accounted for 89.7% of the total emissions from India’s livestock sector followed by manure CH4 (9.2%) and N2O (1.2%). The CFP (Kg CO2eq/kg of the produce) was estimated at 1.21 for cross-bred cattle to 2.96 for indigenous cattle. In Southern Australia, Ridoutt et al.[56] (2014) estimated the land area footprint of beef cattle. The land area needed (m2/kg of live weight) ranged from 86 to 172. Ridoutt and colleagues observed that these results were approximately 10 and 1000 times the normalized carbon and water scarcity footprint data, and highlight the importance of taking into account the land quality in the calculation of LFP.
In Mato Grosso, Brazil, Cerri et al.[57] (2016) assessed CFP of cattle farming for beef production. Evaluating 22 farms with cumulative pastureland area of 60,000 ha, Cerri and colleagues observed that the largest source (89%-98%) of GHG in extensive beef production is contributed by animals. Of these, 67-79% come from enteric fermentation followed by those from manure (20%-33%).Other sources of emission were agricultural inputs and energy. The CFP of a farm with herd size of 2000 cattle was 4.8-8.2 kg CO2eq per kg of the liveweight gain. For farms raised animals, CFP ranged from 5.0 to 72 kg of CO2eq per kg of the live weight gain. Therefore, herd size and management to reduce enteric fermentation are critical to reducing CFP of beef cattle. Rojas-Downing et al.[58] (2018) studied a representative farm based on grazing dairy practices in the state of Michigan, USA, and proposed a food footprint (FFP). Using FFP, Rojas-Downing and colleagues identified a most sustainable milk production level (8618 kg of milk per cow per year) which was 19.4% more than the average milk production (7215 kg per cow per year).
Furthermore, most sustainable pasture composition for the state of Michigan was found to be 90% for tall fescue with 10% for white clover. Thus, there is a strong need for identification of site-specific management and production standards. Yan et al.[59] (2013) evaluated GHG emissions from pasture-based milk production using fertilizer N or white clover at a research farm in Ireland between 2001 and 2006.The white clover based system had 11 to 23% lower CFP than fertilizer N system (0.86-0.87 vs. 0.97-1.13 kg CO2eq/kg of energy-corrected milk). Furthermore, emissions of both N2O and CO2 were lower in white clover system but those of CH4 were similar in both systems.
Because of its large foot print (LFP, WFP, CFP, FFP etc.), there is a strong need for development of a climate-neutral livestock production system .Thus, Ridoutt[60] (2021) proposed a radiative-forcing (RF) based livestock production system. Based on Australian sheep production for meat. Rideout reported that RF plateaued at 0.64 mV/m2, and is projected to decrease with better management. The new RF-based assessment of livestock may be adopted by the ISO for aligning food system with the Paris Accord.
OPTIMIZING HUMAN DIET FOR ADDRESSING CFP OF AGRICULTURE
The food system, being a major contributor to anthropogenic emissions (Röös et al.[15], 2014), must be critically assessed with regards to the source of GHGs [Figure 2]. Primary GHG involved in FSs are CO2 from deforestation, land use conversion, plowing, and erosional processes [Figure 2]. Erosion-induced transport of SOC can be a major source of all three gases (Lal[12], 2004; Lal et al.[61], 2021a; Lal et al.[32], 2021). N2O is primarily contributed by soil through use of inorganic and organic fertilizers. CH4 is contributed from livestock and rice paddies and wetlands [Figure 2]. The U.N. FSS of 2021 identified some specific strategies to advance SDGs or the Agenda 2030 of the United Nations (Lal et al.[12], 2021). The environmental footprint of the diet of 7.8 billion people, projected to be 9.7 B by 2050 and 11 B by 2100 (U.N., 2019)[6], is an important factor to sustainable management of soil and water resources but also to addressing the issues of global warming along with quality and renewability of water resources. Leach et al.[30] (2016) reported that the EFP of food production spans multiple dimensions including CFP based on GHG emission, nitrogen footprint (NFP) and water use (both green and blue, WFP), and land use (LFP). It is, thus, important to identify diet that can minimize each of these FP values, especially those diets which have synergies rather than tradeoffs among different low FP diets.
Beef production has received a considerable attention because of its high EFP (e.g., CFP, NFP, WFP, LFP). Buratti et al.[62] (2017) reported that organic systems (Kg CO2eq/kg of live weight) is 24.62 compared with 18.21 for the conventional systems because enteric fermentation is the primary factor in GHG emission with a range of the global CF value. Ibidhi and Ben Salem[63] (2020) computed WFP of a wide range of livestock, and reported that WFP of meat is higher than that of either milk or eggs. Ibidih and Salem reported that WFP of beef is much larger than WFPs from sheep, goat, pork and chicken. These differences in WFP are attributed to differences in the food conversion ratio among animals. Most ruminants (e.g., cattle, sheep and goat) have a poor food conversion ratio than those of the monogastric animals (e.g., poultry and swine).
Similar to beef production, milk production has also attracted a lot of attention. Velarde-Guillen et al.[64] (2022) reviewed CFP of milk production in Latin America. The range of CFP observed in the Latin American region was 1.54 to 3.57 kg CO2eq /kg of fat and protein corrected milk. Velarde-Guillen et al.[64] (2022) observed that, in Latin America, cattle system and region have a more significant impact on milk CFP than the feeding management (e.g., zero-grazing, semi-confinement, and pasture).
Espinoza-Oriaset al.[65] (2011) estimated the CFP of one loaf of slice bread (800 g) consumed at home on the basis of several parameters such as country of origin of wheat, type of flour, and type of packaging. The lowest CFP was observed for the whole wheat thick sliced bread wrapped in a plastic bag, and the highest for the wheat bread packed in a paper bag. Further, CFP could be reduced by 25% by avoiding toasting and refrigerated storage of bread.
Conventional vs. organic farming is another important factor affecting CFP of bread. Treu et al.[66] (2017) computed the CFP of conventional vs. organically grown food products. Treu and colleagues observed that CFP of the conventional vs. organic diets are essentially similar at ~1250 kg CO2eq per capita per year. However, the land area use to provide food is 40% greater for organic vs. conventional diet at 1900 and 2750 m2 of land per capita per year, respectively. Furthermore, the average conventional diet contains 45% more meat and organic diet 40% more vegetables, fruits and legumes (combined). Treu and colleagues also observed that animal-based food products dominate the CFP in both diets and land use and accounts for 70 to 75% of CFP in both diets. Treu et al.[66] concluded that diet-related CFP can be reduced by shifting towards diets with less animal-based food products, and there is not much difference in CFP among organic vs. conventional system of food production.
FOOD WASTE AND CFP OF AGRICULTURE
Agriculture is a resource-intensive enterprise and a lot of resources are consumed in agroecosystems (e.g., soil, water, energy, chemicals). Avoidable food waste incurs loss of resources with adverse impacts on environment. World wastes 1.4 Gt of food every year. Globally, as much as 931 Mt of food is wasted from retail, food service and household, and it is enough to feed 820 M food-insecure people (Pearson[67], 2021). The U.N. SDG #12.3 is aimed at reducing the food waste by 50% by 2030. (U.N., 2015)[11]. Food waste varies among nations, and the U.S discards food more than any other country (40 Mt). This is 30 to 40 % of the entire food supply and is equivalent to 99.3 kg/per person per year (RTS, 2020)[68]. Food waste in the U.S. comprises 22% of all municipal solid waste. Yet, a large number of population is also food-insecure. As many as 35 M people in the U.S. were food insecure prior to COVID 19, and the number of persons vulnerable to food insecurity has increased to 50 M in 2022 (RTS, 2022)[69]. In the U.S., Economic Research Service estimated that for the baseline year of 2010 the food loss was 31% of food supply, equaling 133 billion pounds (523 billion kg) at an estimated value of $161.6 billion. The 2030 SDGs aim to cut food loss at the retail and consumer level by half to 66 billion pound (261 billion kg), (EPA, 2016)[70]. Reutter et al.[71] (2017) estimated that Australian food waste represents 9% of total water use and 6% of GHG emissions.
Based on a case study on U.K., Tonini et al.[72] (2018) estimated the global warming impact of the avoidable food waste at 2000 to 3600 kg CO2eq per Mg of food waste. Schott and Cánovas[73] (2015) estimated from a study in Sweden that an average of 35% of household food waste can be avoided, which will reduce GHG emission of 800-1400 kg of CO2eq per Mg of food. Wasted food represents a high magnitude of energy, nutrient and virtual water rich stream with adverse effects on environment and resource use. In China, Song et al.[74] (2018) estimated average food waste at 12-33 kg per capita per year. With a CFP of 30-96 kg CO2eq per capita per year. Song and colleagues also observed that animal-based food accounts for 5%-18% in weight but 18%-40% in CFP because of the extra resources involved in animal-based food. A thorough understanding of economic and ecological costs involved of the food wasted is essential.
Therefore, reducing food waste, estimated at ~30% of food produced globally, can drastically decrease the CFP of agroecosystems. Globally, food waste contributes 11% (3.3 Gt of CO2eq) of all GHG emissions: 43% at home, 40% at restaurants,16% at farms and 2% at manufacturers (RTS 2022)[69]. If food waste is a country, it is the 3rd largest emitter of GHGs after China and U.S. The resource impact of food waste can drastically influence the CFP and must be accounted for especially in limited resources such as energy, water and prime agricultural land. In India, Kashyap & Agarwal[75] (2020) estimated total food loss in harvest and post-harvest stages for the food supply chain for some selected food items. They reported that food losses amounted to 58.3 ± 2.22 M Mg in 2013 with the highest losses in sugarcane and rice with a large loss of water resources. LFP and CFP associated with food loss were estimated at 9.58 ± 0.4 M ha and 64.1 ± 3.8 Tg CO2eq, respectively, with rice contributing substantially to both. In 2010, U.S. EPA estimated that food waste accounted for nearly 14% of total solid wastes (Golan[76], 2013). Nonetheless, a significant gap exists in the understanding of the food waste implications of the rapidly developing economies (Parfitt et al.[77], 2010).
The food-energy-water-soil or the FEWS nexus (Lal et al.[46], 2017) is an important concept to assess the impact of food waste on CFP. Kibler et al.[78] (2018) characterized food waste on the FEW when food produced is not consumed by human or animals. Kibler and colleagues observed that different food waste management options (e.g., landfilling, composting, anaerobic digestion, incineration, waste prevention) provide diverse pathways to manage CFP. These researchers proposed a “food-waste-system” approach to optimize resources and reduce the CFP.A similar approach was adopted by Sarker et al.[79] (2016) who proposed a conceptual methodology for characterizing inter-connected FEW components.
Because of large differences in RFP of foods, there are several options for the general public to modify lifestyle and make it more sustainable. Schanes et al.[80] (2016) proposed a novel framework for consumers to lower their CFP with the focus on food consumption.
SAVING LAND AND NATURAL RESOURCES BY AVOIDING FOOD WASTE
Global food waste aggravates global warming, and depletes the finite natural resource base while also polluting the environment. It is equivalent to 2.2 Gt of CO2eq of CFP in terms of GHG emissions. The per capita food wastage CFP ( Kg CO2eq/per person per year ) is estimated by (FAO, 2014)[81] at 860 for North America and Oceania, 810 for industrialized Asia, 680 for Europe, 540 for Latin America, 350 for North Africa and West Asia, 350 for South and South East Asia, and 210 for Sub-Saharan Africa (FAO,2014)[81]. The equivlent WFP is shown in Table 2, and the world average WFP for food waste is 38 m3/capita per year (FAO, 2013)[41].The food waste represents 4.4 M Km2 of land area on which food is produced and lost each year. This land area is larger than that of the Indian Sub-Continent (Pearson[67], 2021). Therefore, humanity must create a future where both nature and people thrive, flourish and live in harmony with one another.
CONCLUSION
Humanity’s unsustainable footprint is likely to increase with growing and progressively affluent world population. Humanity’s impact on planetary processes, referred to environmental or ecological footprint, comprises of a range of sub-components (i.e., land, water, energy, fertilizers, nitrogen, biodiversity).
EFP, and more specifically CFP, can vary widely because of using different reference systems of the studies and differences in system boundaries. Therefore, standardization of the methodologies following the ISO is critical to obtaining credible information for making sound decisions.
Humanity’s CFP can be reduced by making appropriate choices in food systems including production and supply chains, changing lifestyle and dietary preferences, and using agricultural systems which narrow the yield gap and can produce more from less.
The global warming impact of the avoidable food waste at 2000 to 3600 kg CO2eq per Mg of food waste. Globally, as much as 931 Mt of food is wasted from retail, food service and house hold, and it is enough to feed 820 M food-insecure people. Food waste, a heinous crime against nature, is not acceptable.
DECLARATIONS
Authors’ contributionsThe author contributed solely to the article.
Availability of data and materialsNot applicable.
Financial support and sponsorshipNone.
Conflicts of interestThe author declared that there are no conflicts of interest.
Ethical approval and consent to participateNot applicable.
Consent for publicationNot applicable.
Copyright© The Author(s) 2022.
REFERENCES
1. Lal R, Brevik EC, Dawson L, et al. Managing soils for recovering from the COVID-19 pandemic. Soil Syst 2020;4:46.
2. Grünberg J, Nieberg H, Schmidt T. G. Carbon footprints of food: a critical reflection. Landbauforsch. Available from: https://www.researchgate.net/publication/288777178_Carbon_footprints_of_food_A_critical_reflection [Last accessed on 14 Apr 2022].
3. IPCC. Climate change and land: an IPCC special report on climate change, desertification, land degradation, sustainable land management, food security, and greenhouse gas fluxes in terrestrial ecosystems. Available from: https://philpapers.org/rec/SHUCCA-2 [Last accessed on 13 Apr 2022].
4. Balogh J. M. Agriculture-specific determinants of carbon footprint. Available from: http://real.mtak.hu/105131/1/Studies-121-3-Balogh.pdf [Last accessed on 13 Apr 2022].
5. Khan S, Hanjra MA. Footprints of water and energy inputs in food production-global perspectives. Food Policy 2009;34:130-40.
6. U.N. World population prospects 2019: Highlights (ST/ESA/SER.A/423). Available from: https://population.un.org/wpp/publications/files/wpp2019_highlights.pdf [Last accessed on 13 Apr 2022].
7. FAO I, UNICEF and WHO. The state of food security and nutrition in the world 2020. Transforming food systems for affordable healthy diets. Available from: https://www.fao.org/publications/card/zh/c/CA9692EN/ [Last accessed on 13 Apr 2022].
8. Röös E, Bajželj B, Smith P, Patel M, Little D, Garnett T. Greedy or needy? Global Environmental Change 2017;47:1-12.
9. Fanzo J, Haddad L, Schneider KR, et al. Viewpoint: rigorous monitoring is necessary to guide food system transformation in the countdown to the 2030 global goals. Food Policy 2021;104:102163.
10. von Braun J, Afsana K, Fresco L.O, Hassan M, Torero M. Food system concepts and definitions for science and political action. Available from: https://www.nature.com/articles/s43016-021-00361-2 [Last accessed on 13 Apr 2022].
11. U.N. Transforming our world: the 2030 agenda for sustainable development, united nations summit on sustainable development. Available from: https://stg-wedocs.unep.org/bitstream/handle/20.500.11822/11125/unepswiosm1inf7sdg.pdf?sequence=1 [Last accessed on 13 Apr 2022].
12. Lal R, Bouma J, Brevik E, et al. Soils and sustainable development goals of the United Nations: An International Union of Soil Sciences perspective. Geoderma Regional 2021;25:e00398.
13. Wiek A, Tkacz K. Carbon footprint: an ecological indicator in food production. Available from: https://www.semanticscholar.org/paper/Carbon-footprint%3A-an-ecological-indicator-in-food-Wi%C4%99k-Tkacz/c332c4c4e5a4154f680fc90d50bbb643f695b390 [Last accessed on 13 Apr 2022].
14. Chen R, Zhang R, Han H. Where has carbon footprint research gone? Ecological Indicators 2021;120:106882.
15. Röös E, Sundberg C, Hansson P. -A. Carbon footprint of food products. In: Muthu, S.S. (Ed.), Assessment of carbon footprint in different industrial sectors, Vol 1. pp. 85-112. Available from: https://link.springer.com/chapter/10.1007/978-981-4560-41-2_4 [Last accessed on 13 Apr 2022].
16. IPCC. Climate change 1995: the IPCC second assessment report. Scientific-technical analysis of impacts, adaptations, and mitigation of climate change. Available from: https://www.ipcc.ch/report/ar2/wg2/ [Last accessed on 13 Apr 2022].
18. World Bank. CO2 emissions (metric tons per capita). Available from: https://data.worldbank.org/indicator/EN.ATM.CO2E.PC [Last accessed on 13 Apr 2022].
19. Tiseo I. Historical carbon dioxide emissions from global fossil fuel combustion and industrial processes from 1750 to 2020. Available from: https://www.statista.com/statistics/264699/worldwide-co2-emissions/ [Last accessed on 13 Apr 2022]
20. Hoekstra AY, Wiedmann TO. Humanity’s unsustainable environmental footprint. Science 2014;344:1114-7.
21. Lal R. Soil and sanskriti. Available from: https://www.semanticscholar.org/paper/Soil-and-Sanskriti-Lal/e152f6c25061149e116345d1f5f23925226c1785 [Last accessed on 13 Apr 2022].
23. FAO, ITPS. Status of the World’s Soil Resources (SWSR)-main report. Available from: https://www.fao.org/documents/card/zh/c/c6814873-efc3-41db-b7d3-2081a10ede50/ [Last accessed on 13 Apr 2022].
24. Bongaarts J. IPBES. Summary for policymakers of the global assessment report on biodiversity and ecosystem services of the intergovernmental science-policy platform on biodiversity and ecosystem services. Population and Development Review 2019;45:680-1.
26. Weinzettel J, Vačkářů D, Medková H. Potential net primary production footprint of agriculture: a global trade analysis. Journal of Industrial Ecology 2019;23:1133-42.
27. Lal R. Digging deeper: a holistic perspective of factors affecting soil organic carbon sequestration in agroecosystems. Glob Chang Biol 2018;24:3285-301.
28. Lal R, Smith P, Jungkunst H. F, et al. The carbon sequestration potential of terrestrial ecosystems. Available from: https://www.jswconline.org/content/73/6/145A.short [Last accessed on 13 Apr 2022].
29. Xu Z, Sun DW, Zeng XA, Liu D, Pu H. Research developments in methods to reduce the carbon footprint of the food system: a review. Crit Rev Food Sci Nutr 2015;55:1270-86.
30. Leach AM, Emery KA, Gephart J, et al. Environmental impact food labels combining carbon, nitrogen, and water footprints. Food Policy 2016;61:213-23.
31. Wu X, Hu S, Mo S. Carbon footprint model for evaluating the global warming impact of food transport refrigeration systems. Journal of Cleaner Production 2013;54:115-24.
32. Lal R, Monger C, Nave L, Smith P. The role of soil in regulation of climate. Philos Trans R Soc Lond B Biol Sci 2021;376:20210084.
33. Lu C. Q, Yu Z, Tian H.Q, Hennessy D.A, Feng H.L, et al. Increasing carbon footprint of grain crop production in the US Western Corn Belt. Available from: https://iopscience.iop.org/article/10.1088/1748-9326/aae9fe/meta [Last accessed on 13 Apr 2022].
34. Millar N. , Doll, J.E., Robertson, G.P., 2014. Management of nitrogen fertilizer to reduce nitrous oxide emissions from field crops (E3152). Available from: https://www.canr.msu.edu/resources/management_of_nitrogen_fertilizer_to_reduce_nitrous_oxide_emissions_from_fi [Last accessed on 13 Apr 2022].
35. Vittis Y, Folberth C, Bundle S. -C, Obersteiner M. Restoring nature at lower food production costs. Available from: https://www.leap.ox.ac. :uk/article/restoring-nature.
36. Rockström J, Steffen W, Noone K, et al. Planetary boundaries: Exploring the safe operating space for humanity. Available from: http://www.ecologyandsociety.org/vol14/iss2/art32/ [Last accessed on 13 Apr 2022].
37. Liu W, Zhang G, Wang X, Lu F, Ouyang Z. Carbon footprint of main crop production in China: magnitude, spatial-temporal pattern and attribution. Sci Total Environ 2018;645:1296-308.
38. Sah D, Devakumar A. The carbon footprint of agricultural crop cultivation in India. Carbon Management 2018;9:213-25.
39. O’brien M, Schütz H, Bringezu S. The land footprint of the EU bioeconomy: Monitoring tools, gaps and needs. Land Use Policy 2015;47:235-46.
40. Gan Y, Liang C, Wang X, Mcconkey B. Lowering carbon footprint of durum wheat by diversifying cropping systems. Field Crops Research 2011;122:199-206.
41. FAO. Climate smart agiculture source book. Available from: http://www.fao.org/climate-smart-agriculture-sourcebook/en/ [Last accessed on 13 Apr 2022].
42. Brankatschk G. , Finkbeiner M. Crop rotations and crop residues are relevant parameters for agricultural carbon footprints. Available from: https://link.springer.com/article/10.1007/s13593-017-0464-4 [Last accessed on 13 Apr 2022].
43. Castanheira ÉG, Freire F. Greenhouse gas assessment of soybean production: implications of land use change and different cultivation systems. Journal of Cleaner Production 2013;54:49-60.
44. Hu Y, Zheng J, Kong X, Sun J, Li Y. Carbon footprint and economic efficiency of urban agriculture in Beijing-a comparative case study of conventional and home-delivery agriculture. Journal of Cleaner Production 2019;234:615-25.
45. Kassam A, Friedrich T, Derpsch R. Global spread of conservation agriculture. International Journal of Environmental Studies 2018;76:29-51.
46. Lal R, Mohtar R. H, Assi A.T, Ray R, Baybil H, et al. Soil as a basic nexus tool: soils at the center of the food-energy-water nexus. Available from: https://link.springer.com/article/10.1007/s40518-017-0082-4 [Last accessed on 13 Apr 2022].
47. Okigbo B. N, Lal R. Role of cover crops in soil and water conservation. Available from: https://agris.fao.org/agris-search/search.do?recordID=XF8001981 [Last accessed on 13 Apr 2022].
48. Nair PK, Mohan Kumar B, Nair VD. Agroforestry as a strategy for carbon sequestration. Z Pflanzenernähr Bodenk 2009;172:10-23.
49. Rosenstock TS, Wilkes A, Jallo C, et al. Making trees count: measurement and reporting of agroforestry in UNFCCC national communications of non-Annex I countries. Agric Ecosyst ;284:106569.
50. Brown RM, Dillon CR, Schieffer J, Shockley JM. The carbon footprint and economic impact of precision agriculture technology on a corn and soybean farm. J Environ. Econ Polic 2016;5:335-48.
51. Ratchawat T, Panyatona S, Nopchinwong P, Chidthaisong A, Chiarakorn S. Carbon and water footprint of robusta coffee through its production chains in Thailand. Available from: https://link.springer.com/article/10.1007/s10668-018-0299-4 [Last accessed on 13 Apr 2022].
52. van Rikxoort H, Schroth G, Laderach P, Rodriguez-Sanchez B. Carbon footprints and carbon stocks reveal climate-friendly coffee production. Available from: https://link.springer.com/article/10.1007/s13593-014-0223-8 [Last accessed on 13 Apr 2022].
53. Martins L. D, Eugenio F.C, Rodrigues W.N, Tomaz M.A, dos Santos A.R, et al. Carbon and water footprints in Brazilian coffee plantations - the spatial and temporal distribution. Available from: https://novaresearch.unl.pt/en/publications/carbon-and-water-footprints-in-brazilian-coffee-plantations-the-s [Last accessed on 13 Apr 2022].
54. Persson U. M, Johansson D.J.A, Cederberg C, Hedenus F, Bryngelsson D. Climate metrics and the carbon footprint of livestock products: where’s the beef? Available from: https://iopscience.iop.org/article/10.1088/1748-9326/10/3/034005 [Last accessed on 13 Apr 2022].
55. Patra AK. Accounting methane and nitrous oxide emissions, and carbon footprints of livestock food products in different states of India. Journal of Cleaner Production 2017;162:678-86.
56. Ridoutt BG, Page G, Opie K, Huang J, Bellotti W. Carbon, water and land use footprints of beef cattle production systems in southern Australia. Journal of Cleaner Production 2014;73:24-30.
57. Cerri CC, Moreira CS, Alves PA, et al. Assessing the carbon footprint of beef cattle in Brazil: a case study with 22 farms in the State of Mato Grosso. Journal of Cleaner Production 2016;112:2593-600.
58. Rojas-Downing MM, Nejadhashemi AP, Elahi B, et al. Food footprint as a measure of sustainability for grazing dairy farms. Environ Manage 2018;62:1073-88.
59. Yan MJ, Humphreys J, Holden NM. The carbon footprint of pasture-based milk production: can white clover make a difference? J Dairy Sci 2013;96:857-65.
60. Ridoutt B. Climate neutral livestock production-a radiative forcing-based climate footprint approach. Journal of Cleaner Production 2021;291:125260.
61. Lal R. Soil carbon sequestration impacts on global climate change and food security. Science 2004;304:1623-7.
62. Buratti C, Fantozzi F, Barbanera M, Lascaro E, Chiorri M, Cecchini L. Carbon footprint of conventional and organic beef production systems: an Italian case study. Sci Total Environ 2017;576:129-37.
63. Ibidhi R, Ben Salem H. Water footprint of livestock products and production systems: a review. Anim Prod Sci 2020;60:1369.
64. Velarde-Guillen J, Arndt C, Gomez C. A. Carbon footprint in Latin American dairy systems. Available from: https://link.springer.com/article/10.1007/s11250-021-03021-6 [Last accessed on 13 Apr 2022].
65. Espinoza-Orias N, Stichnothe H, Azapagic A. The carbon footprint of bread. Available from: https://link.springer.com/article/10.1007/s11367-011-0271-0 [Last accessed on 13 Apr 2022].
66. Treu H, Nordborg M, Cederberg C, et al. Carbon footprints and land use of conventional and organic diets in Germany. Journal of Cleaner Production 2017;161:127-42.
67. Pearson P. Driven to waste: designing a better global food system. Available from: https://www.wwf.or.th/?369116/Driven-to-Waste-Designing-a-Better-Global-Food-System [Last accessed on 13 Apr 2022].
68. RTS. Food waste in America in 2021: statistics + facts. Available from: https://www.rts.com/wp-content/uploads/2021/04/RTS_Food_Waste_Guide_2021.pdf [Last accessed on 14 Apr 2022].
69. RTS. Food Waste in America in 2022: statistics & facts. Available from: https://www.rts.com/resources/guides/food-waste-america/ [Last accessed on 14 Apr 2022].
70. EPA. United States 2030 food loss and waste reduction goal. Available from: https://www.epa.gov/sustainable-management-food/united-states-2030-food-loss-and-waste-reduction-goal [Last accessed on 13 Apr 2022].
71. Reutter B, Lant P, Reynolds C, Lane J. Food waste consequences: environmentally extended input-output as a framework for analysis. Journal of Cleaner Production 2017;153:506-14.
72. Tonini D, Albizzati PF, Astrup TF. Environmental impacts of food waste: learnings and challenges from a case study on UK. Waste Manag 2018;76:744-66.
73. Saraiva Schott A, Cánovas A. Current practice, challenges and potential methodological improvements in environmental evaluations of food waste prevention-a discussion paper. Resour Conserv Recycl 2015;101:132-42.
74. Song G, Semakula HM, Fullana-i-palmer P. Chinese household food waste and its’ climatic burden driven by urbanization: a bayesian belief network modelling for reduction possibilities in the context of global efforts. Journal of Cleaner Production 2018;202:916-24.
75. Kashyap D, Agarwal T. Food loss in India: water footprint, land footprint and GHG emissions. Available from: https://link.springer.com/article/10.1007/s10668-019-00325-4 [Last accessed on 13 Apr 2022].
76. Golan E. The US food waste challenge. Available from: https://www.ncsl.org/documents/statefed/SarahEckhouseUSDA.pdf [Last accessed on 13 Apr 2022].
77. Parfitt J, Barthel M, Macnaughton S. Food waste within food supply chains: quantification and potential for change to 2050. Philos Trans R Soc Lond B Biol Sci 2010;365:3065-81.
78. Kibler KM, Reinhart D, Hawkins C, Motlagh AM, Wright J. Food waste and the food-energy-water nexus: a review of food waste management alternatives. Waste Manag 2018;74:52-62.
79. Sarker T, Kibler K, Reinhart D. Concept mapping of food waste management alternatives within the food-energy-water nexus. Available from: https://ascelibrary.org/doi/abs/10.1061/9780784479865.016 [Last accessed on 13 Apr 2022].
80. Schanes K, Giljum S, Hertwich E. Low carbon lifestyles: a framework to structure consumption strategies and options to reduce carbon footprints. Journal of Cleaner Production 2016;139:1033-43.
81. FAO. Food Wastage Footprint: Full-Cost Accounting. Available from: https://www.fao.org/3/i3991e/i3991e.pdf [Last accessed on 13 Apr 2022].
82. Friedlingstein P, Jones M. W, O’Sullivan M, et al. Global carbon budget 2021. Available from: https://essd.copernicus.org/preprints/essd-2021-386/ [Last accessed on 13 Apr 2022].
83. Ramaswamy V, Boucher O, Haigh J, et al. Radiative forcing of climate change. Available from: https://www.osti.gov/biblio/899821 [Last accessed on 13 Apr 2022].
84. Worldometer, 2022. CO2 Emissions per Capita. Available from: https://www.worldometers.info/co2-emissions/co2-emissions-per-capita/ [Last accessed on 14 Apr 2022].
85. FAO. FAOSTAT statistical database. Available from: https://www.fao.org/faostat/en/ [Last accessed on 13 Apr 2022].
Cite This Article
Export citation file: BibTeX | RIS
OAE Style
Lal R. Reducing carbon footprints of agriculture and food systems. Carbon Footprints 2022;1:3. http://dx.doi.org/10.20517/cf.2022.05
AMA Style
Lal R. Reducing carbon footprints of agriculture and food systems. Carbon Footprints. 2022; 1(1): 3. http://dx.doi.org/10.20517/cf.2022.05
Chicago/Turabian Style
Lal, Rattan. 2022. "Reducing carbon footprints of agriculture and food systems" Carbon Footprints. 1, no.1: 3. http://dx.doi.org/10.20517/cf.2022.05
ACS Style
Lal, R. Reducing carbon footprints of agriculture and food systems. Carbon. Footprints. 2022, 1, 3. http://dx.doi.org/10.20517/cf.2022.05
About This Article
Copyright

Data & Comments
Data


 Cite This Article 78 clicks

 Like This Article 26
likes
Like This Article 26
likes


Comments
Comments must be written in English. Spam, offensive content, impersonation, and private information will not be permitted. If any comment is reported and identified as inappropriate content by OAE staff, the comment will be removed without notice. If you have any queries or need any help, please contact us at support@oaepublish.com.