INTRODUCTION
Much progress has been made in tobacco control since the 1950s, but tobacco use remains the leading preventable cause of disease and premature death1. There are more than 1 billion people in the world who smoke2. Evidence-based behavioral (e.g. counseling, motivational interviewing) and pharmacological (e.g. nicotine replacement therapy, varenicline, bupropion) interventions are available for clinical, personal, family and community based tobacco cessation, but these interventions achieve only a small to moderate effect if delivered in practice3. Even with additional assistance, the majority of smokers still experience difficulties quitting with success rates of self-quit attempts as low as 3%4.
Smokers experience difficult quitting primarily because of nicotine addiction4. Measuring nicotine dependence with high reliability and validity is critical to tailor treatment to individual patients and to evaluate treatment progress5. However, obtaining good measures has been challenging, in part due to a lack of methods to acquire objective data6. Instruments commonly used to assess dependence including the Fagerström Test for Nicotine Dependence (FTND)7, the Diagnostic and Statistical Manual-IV (DSM-IV) and now DSM-58,9, and the International Statistical Classification and Related Health Problems-10 (ICD-10)10. Although these instruments are widely used in research and clinical practice, all of them are based on self-reported data and rarely validated against biomarkers6. The validity of FTND has been supported by its significant correlations with success in smoking cessation11 and urine cotinine levels12. However, there are some studies showing relatively low validity of the DSM-IV and ICD-10 scales5,13.
Due to limitations with self-report data, researchers have developed objective measures related to nicotine dependence. Changes in the metabolism of nicotine and the upregulation of nicotine receptors in the brain can be assessed objectively as indicators of nicotine dependence. Nicotine metabolites, including cotinine14 and nicotine metabolic ratio (NMR, derived from genetic studies)15 have been reported. Neuroimaging techniques such as positron emission tomography (PET), single photon emission computed tomography (SPECT), and functional magnetic resonance imaging (fMRI)16 can also provide objective assessment of nicotine receptors indicative of nicotine dependence. However, none of these methods is readily available to individual smokers who make quit attempts. Furthermore, many of these measures are invasive and expensive, and thus, difficult to incorporate into routine cessation practice17.
Research has repeatedly shown that dependent smokers adjust the dosage of nicotine intake by changing their smoking behaviors, known as selftitration18. For example, smokers tend to take longer, deeper puffs with greater puffing speed, and shorter durations between puffs when they have a stronger craving. While nicotine receptors in the brain form the biological basis of craving19, the number of receptors is associated with nicotine dependence as demonstrated in both brain imaging and postmortem research16. The linkage from numbers of nicotine receptors to dependence and self-titrating behavior provides an impetus to objectively assess nicotine dependence based on information derived from puffing behavior measures or smoking topography.
Smoking topography is a well-established method to measure smoking behavior in both natural and laboratory settings. Data can be obtained objectively and non-invasively through a special topography device and/or by videotaping. While topography devices have the potential to provide highly accurate measures, they tend to be expensive and challenging to operate (e.g. difficult to calibrate), thus a video-assisted approach offers potential advantages. Information on individual puffs with high precision (up to 1/100 second) can be extracted from topographic data, including total puffs, puff duration, inter-puff interval, frequency and speed of inhalation, hold, exhalation and rest. Topography measures are shown to be reliable in distinguishing different smokers20, and associated with nicotine dependence measures, such as cotinine levels21. These prior findings provide impetus to explore the utility of smoking topography in assessing nicotine dependence22.
Despite its potential, smoking topography is typically considered a tool to measure smoking behaviors rather than nicotine dependence. To address this gap in the literature, we explored a video-assisted topographic method under the assumption that the measured self-titration behavior is a reflection of the magnitude of nicotine receptors in the brain for nicotine dependence. The primary goal of this study was to provide data supporting the establishment of an objective and non-invasive tool to promote tobacco cessation practice.
METHODS
Participants
A total of 10 participants were recruited, including eight smokers who smoked on a daily basis for at least one month and two social smokers who smoked only occasionally in social settings (e.g. parties and gathering). To obtain data for participants with potentially different levels of nicotine dependence, we purposefully recruited two smokers for each of the following four categories: 1) smoked daily for less than one year, 2) smoked daily for 1–6 years, 3) smoked daily for 7–14 years, and 4) smoked daily for 15 years or more. Those who could not communicate in English, did not have transportation to the laboratory, or were actively seeking tobacco cessation treatment were excluded from the study.
Recruitment was conducted using flyers on a university campus in Detroit, Michigan. Among those who expressed intention to participate, a screening was conducted to ensure they met either the criterion for regular or social smoker. After consenting, the research assistant scheduled an appointment for participants to come to the Behavioral Testing Laboratory for interview and questionnaire completion, and for another appointment for the videotaping procedure the following day after the interview. The study protocol was approved by the Institutional Review Board (IRB) at Wayne State University. IRB approval was also obtained from the University of Florida for further analysis and manuscript preparation. After completing the data collection, a brief counseling was provided to encourage the participants to quit smoking.
Procedures
Interview procedure
Data were collected through in-person interview one day prior to the videotaping session to minimize potential interference between the videotaping and survey procedures. It typically took 25–35 minutes to complete the interview. Information on demographics, smoking history, current smoking and nicotine dependence were collected using structured questionnaires adapted from prior research23. Scales were used to assess the following three instruments of nicotine dependence: the Diagnostic and Statistical Manual of Mental Disorder 4th Revision (DSM-IV), the International Statistical Classification of Diseases and Related Health Problems 10th Revision (ICD-10) and the Fagerström Test of Nicotine Dependence (FTND). The 14-item DSM-IV scale , the 6-item ICD-10 scale23, and the 6-item FTND7 scale were used. We included all three scales because they provide complementary self-report information regarding nicotine dependence24.
Videotaping procedure
To capture the smoking behavior patterns that best reflected participants’ nicotine dependence level, we videotaped only the first cigarette smoked during the first smoking episode of the day. Participants were instructed to arrive at the lab as scheduled and keep abstinent after waking up before the videotaping session. Prior to videotaping, the level of carbon monoxide (CO) in participants’ breath was tested using a Smokerlyzer CO monitor (Bedfont Scientific USA, Medford, NJ). A criterion of CO ≤ 9 ppm was used for regular smokers and CO ≤ 6ppm for social smokers as criterion of abstinence with optimal sensitivity and specificity25. The CO criterion was imposed to ensure a participant did not smoke during the day before the lab session to best measure the self-titration process.
After a participant passed the CO test, he or she was instructed to sit down in front of a table and relax for about 3–5 minutes while the research assistant introduced the process for smoking and videotaping. When a participant was ready, he or she was instructed to start smoking. The participant was first asked to light up a cigarette (the brand the participant most often smoked for better self-titration) by simply burning the tip of the cigarette with a lighter, and not puffing. After the cigarette was lighted, the participant started smoking according to the following instructions: ‘Please relax and smoke just like you usually do. No one will be around while you smoke. Simply let us know after you complete smoking’. In addition, a standard protocol was used to ensure that participants mimic the way they usually smoke. This includes asking participants to arrive early during the schedule day to allow adequate amount of rest time before videotaping, comfortable lab space with a table mimicking a section in a living room at home, and adequate training of the research staff to ensure participants feel comfortable communicating with them and do not feel judged.
To obtain video smoking topography data, a Digital Camcorder (JVC Everio GZ-HD40, available in many stores) was used. This camcorder is small in size and quiet, therefore less likely to distract the participant. It has a recording speed up to 40 frames per second, adequate for assessing smoking topography up to 1/40 second. The research assistant set up the camcorder and made sure it was working normally before each videotaping session. The camcorder was set up in the left front (approximately 20–25 degree), 1.5 to 2 meters away from the smoker, and was zoomed to cover the mouth and the hand of the smoker so that all smoking actions were captured. Although all participants in our research knew that they were videotaped while smoking, none of them reported any significant disturbance from the videotaping after completion of data collection.
Two participants had to be rescheduled for videotaping. One became very emotional after receiving a call on her cellular phone during the videotaping process. The procedure was thus interrupted; another participant was informed of a family emergency during the trip to our lab and could not complete data collection as scheduled, so he was rescheduled.
Data processing
Survey data were manually entered into a computer using double entry protocol to minimize data entry errors. Video data were viewed and coded independently by two trained researchers blinded from accessing any other data. Data coding was conducted on computer using the Software Windows Movie Maker (Microsoft Corp.). A coding scheme was developed and used as guidance for the coding process (Figure 1). After lighting up the cigarette, the smoker starts a puff by moving the hand that holds the cigarette from rest position to the mouth. Inhalation begins when the butt of the cigarette touches the mouth and ends when the butt of the cigarette leaves the mouth. When the cigarette leaves the mouth, the smoker often holds smoke for a while and then starts exhaling. After exhalation ends, the smoker will rest for a while and prepare for the next puff. The same process repeats until the whole cigarette is smoked. With reference to the scheme, various actions of smoking behaviors (e.g. inhalation begins, exhalation begins, exhalation ends) were identified by viewing the video frame-by-frame. The exact timing (up to two decimal points) of a specified action was recorded for analysis.
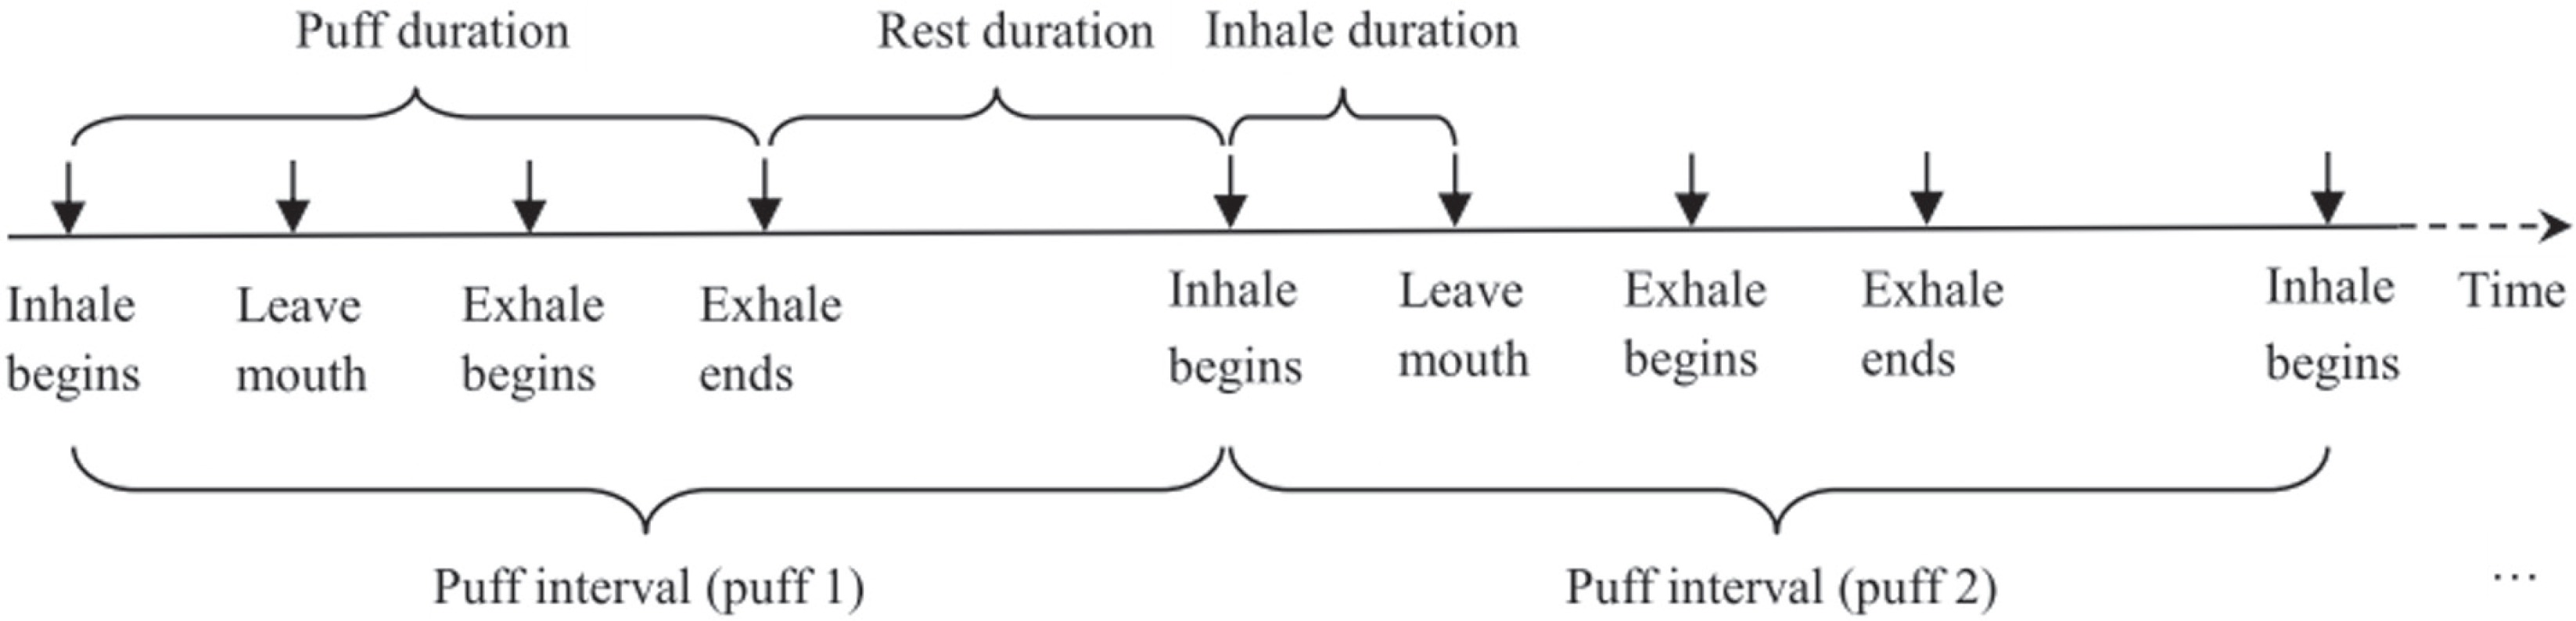
(We note that inhale and exhale are used in our Figures for inhalation and exhalation)
After the survey data and derived video data were computerized, one research assistant checked the data quality by comparing the two independently entered datasets. Any discrepancies identified through the comparison were resolved by referring back to the originally completed interview questionnaire or the recorded smoking video.
Statistical analysis
Derivation of topographic measures
With the precise timing for each smoking action defined above, the following smoking topographic measures were derived for each participant:
Puff Interval (PI): The time from the beginning of the inhalation of one puff to the beginning of the inhalation of the next puff. With this definition, the number of puffs to complete a cigarette was computed as the number of PIs.
Puff Speed (PS): The speed (number of puffs per minute) at which a person puffs while smoking. The PS is computed as the reciprocal of PI. This is a key indicator because it reflects the process by which a dependent smoker adjusts nicotine intake during the course of smoking one cigarette.
Puff Duration (PD): The time from the beginning of the inhalation of one puff to the end of exhalation of the same puff. Compared to the PI described above, PD provides a net measure of time used for nicotine intake through smoking. This is because PI is affected by the rest time between two consecutive puffs while PD is not.
Inhalation Duration (ID): The time from the beginning of an inhalation to the beginning of exhalation during the same puff. By definition, ID is part of PD and is always smaller than PD. In addition to assessing the amount of nicotine intake, longer IDs may indicate stronger craving for nicotine.
Rest Duration (RD): The time from the end of an exhalation of one puff to the beginning of inhalation of the next puff. In contrast to PD and ID, shorter RDs between individual puffs may indicate more nicotine intake and stronger craving for nicotine.
Modeling temporal patterns of topographic measures for individual participants
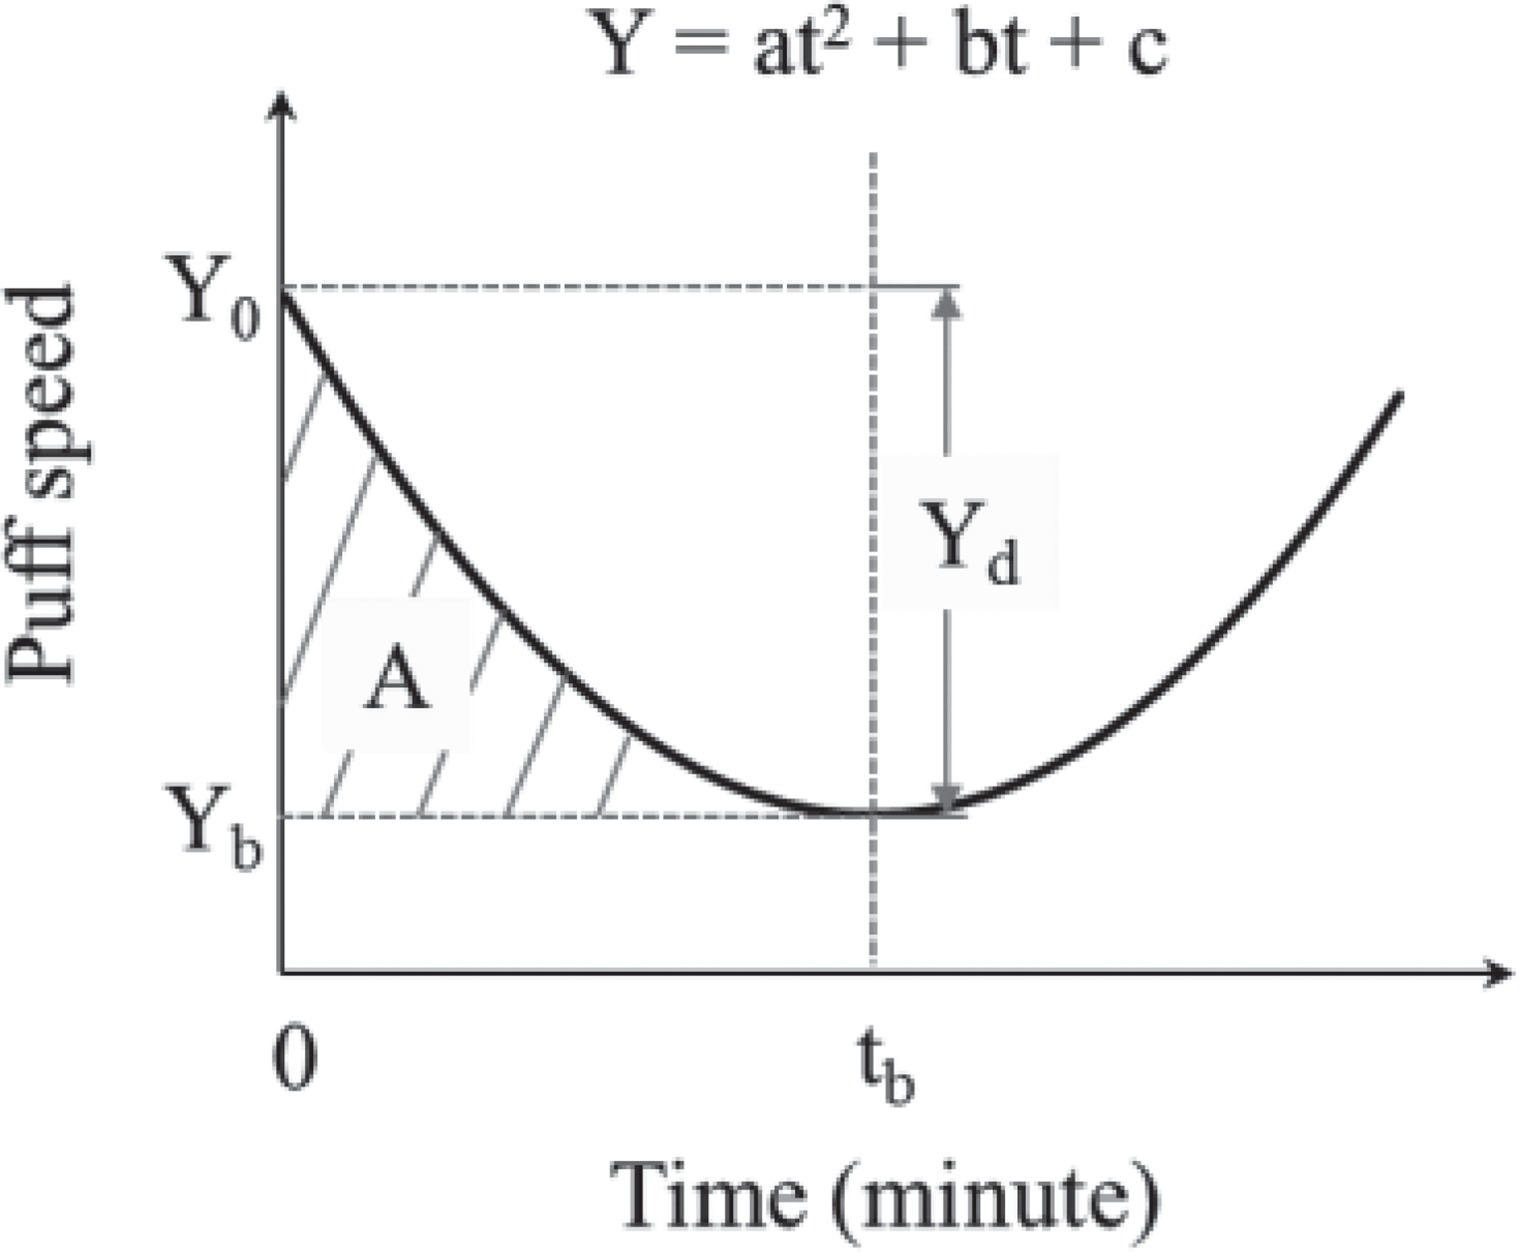
Individual topographic measures were plotted against time to examine the temporal patterns of these measures. For each measure, both linear and non-linear models were fitted to the data. For the non-linear model, we specifically focused on the fold catastrophe model26 because the number of empty receptors in the brain follows a dynamic balance formula that has also a quadratic form:
Y=ax2+bx+c,
consistent with the fold catastrophe, where a, b, c are parameters associated with the nicotine-receptor kinetics27.
Figure 2 presents the hypothetic model of the temporal pattern of puff speed as an example. The parameters of the fitted curve including Y0, tb, Yb, Yd, A and ΔS = A/tb were used as topographic indicators to quantify nicotine dependence. Y0 and Yb are the puff speeds at the beginning when t = 0 and at the turning point (i.e. lowest speed point) when t = tb, respectively; Yd = Y0 – Yb, indicates the maxium reduction in puff speed during the whole period from t0 to tb; and ΔS, computed as A/tb, represents the average speed (number of puffs per minute) of smoking from the beginning (t0) to the turning point (tb). The statistic R2 was used as an indiator of model-data fit and index to compare which one, linear or non-linear models was more appropriate to describe individual topographic measures.
Correlation between topographic indicators and self-reported dependence scores
To explore the potential of the derived topographic measures (i.e. Y0, tb, Yb, Yd, and ΔS) in indicating nicotine dependence level, a series of correlational analyses was conducted using data from all 10 participants to test the association between these measures and self-reported scores on DSM-IV, ICD-10 and FTND measures, respectively.
RESULTS
Sample characteristics
A total of 10 participants (4 males, mean age = 27.0 years, SD = 7.2) from diverse racial groups (3 White, 4 Black, 2 Middle-Eastern, and 1 Asian) were included. Six were nicotine dependent based on DSM-IV criteria (≥ 3 score points). Eight were nicotine dependent based on ICD-10 criteria (≥ 3 score points), and three were nicotine dependent based on FTND score (≥ 3 score points). Table 1 summarizes detailed demographic information, smoking history, and nicotine dependence scores on the three scales.
Table 1
Characteristics of the study sample
[i] Subj: subject number. The number of addictive symptoms was derived from the information included in the standard Diagnostic and Statistical Manual of Mental Disorders-IV (DSM-IV) scale, the International Statistical Classification of Diseases and Related Health Problems-10 (ICD-10) scale, and the Fagerström Test for Nicotine Dependence (FTND) scale. # = number.
Video topography of individual participant’s smoking behaviors
Data in Table 2 indicated that overall, these smokers puffed 7–16 times within 2.48 – 8.56 minutes to smoke one cigarette completely. The average PI to smoke one cigarette varied from 16.45 to 34.23 seconds, the average PS varied from 1.83 to 3.95 puffs per minute, the average PD varied from 3.66 to 8.67 seconds, the average ID varied from 0.98 to 3.64 seconds, the average ED varied from 0.72 to 4.14 seconds, and the average RD varied from 12.16 to 29.06 seconds.
Table 2
Summary statistics of key topographic measures for individual participants
Linear modeling of temporal patterns for topographic measures
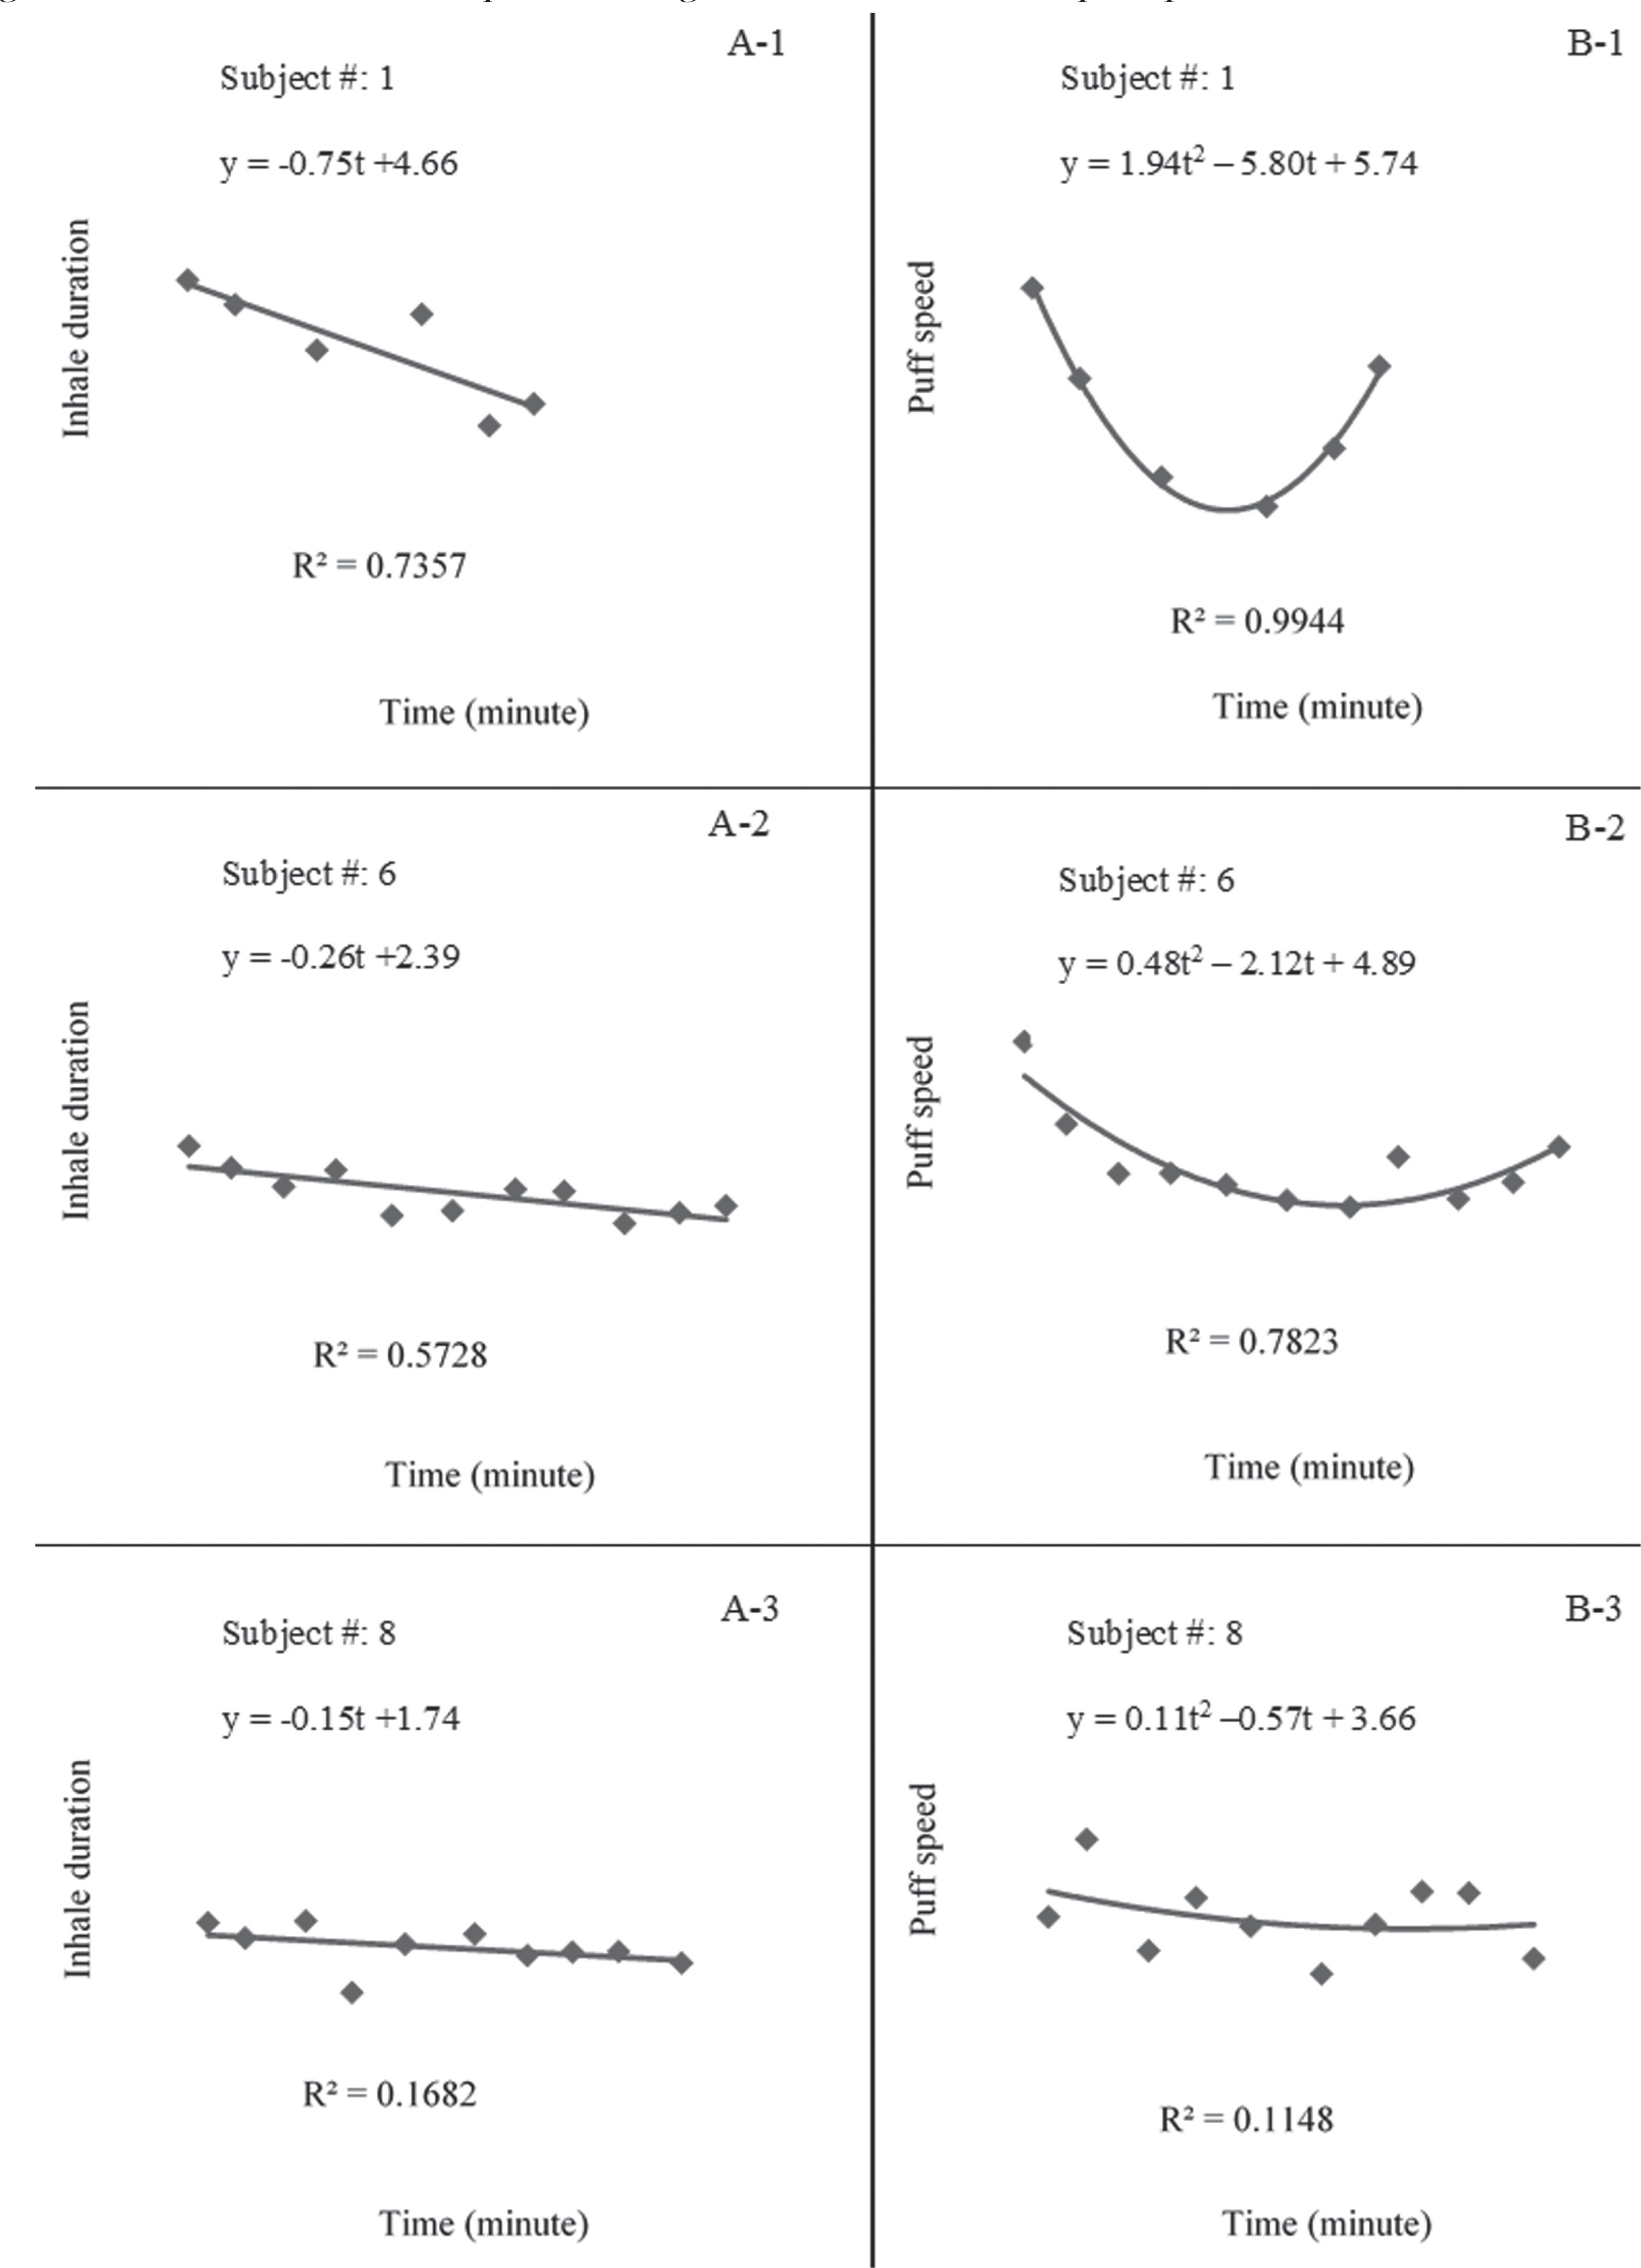
When we fitted linear models for the derived topographic measures, only ID showed a relatively good fit. Most of the participants had longer inhalations at the beginning and decreased gradually.
The slopes of the fitted models varied from 0.01 to -0.75, while R2 varied from 0.003 to 0.74. Figure 3 (A1–A3) presents three examples of the fitted linear model for highly nicotine dependent, moderately dependent, and non-dependent participants (DSM-IV criteria), respectively.
Catastrophe modeling of temporal pattern for topographic measures
We also fitted the fold catastrophe to the topographic data for each participant and found that the change of puff speed over time fitted the model better than all other topographic measures. The temporal pattern of puff speed for the majority of participants followed a U-shaped pattern, especially among those with higher self-reported nicotine dependence scores. Figure 3 (B1–B3) presents three examples of the fitted catastrophe model for subject #1 with DSM-IV score = 7, subject #6 with DSM IV score = 4, subject #8 with DSM IV score = 2 (non-dependent), respectively. The U-shape was much more curved for more severely dependent participants whereas it was almost flat for non-dependent participants.
Association between derived topographic indicators and nicotine dependence scores
Table 3 presents: a) the modeling results for individual participants, including model parameters a, b and c of the quadratic forms, data-model fit index R2, topographic indicators Y0, tb, Yb, Yd, and ΔS (Figure 1), and b) their correlations with DSM-IV, ICD-10 and FTND scores. Overall, the derived topographic indicators were larger for participants with higher self-reported dependence scores and smaller for those with lower scores, with one exception for tb (time taken from beginning to the turning point of puff speed to increase again). These indicators were significantly associated with at least one of the self-reported dependent scores, with the exceptions of tb and Yb. The correlations between the indicators were the strongest with DSM-IV scores (r from 0.64 to 0.93), whereas none of them was significanly associated with FTND scores.
Table 3
Topographic indicators derived from fold catastrophe model and their correlations with dependence scores
| Catastrophe modeling and correlation | Smoking topographic indicators | ||||||
|---|---|---|---|---|---|---|---|
| R2 | Y0 | tb | Yb | Yd | ΔS | ||
| Subj | Estimated catastrophe model | ||||||
| 1 | y = 1.94t2 – 5.80t + 5.74 | 0.99 | 5.74 | 1.49 | 1.40 | 4.34 | 1.45 |
| 2 | y = 1.73t2 – 5.74t + 6.51 | 0.66 | 6.51 | 1.66 | 1.75 | 4.76 | 1.59 |
| 3 | y = 1.02t2 – 4.56t + 6.65 | 0.87 | 6.65 | 2.24 | 1.55 | 5.10 | 1.70 |
| 4 | y = 0.26t2 – 1.52t + 4.63 | 0.68 | 4.63 | 2.92 | 2.41 | 2.22 | 0.74 |
| 5 | y = 0.23t2 – 1.37t + 4.29 | 0.45 | 4.29 | 2.98 | 2.25 | 2.04 | 0.68 |
| 6 | y = 0.48t2 – 2.12t + 4.89 | 0.78 | 4.89 | 2.21 | 2.55 | 2.34 | 0.78 |
| 7 | y = 0.04t2 – 0.35t + 2.42 | 0.33 | 2.42 | 4.38 | 1.65 | 0.77 | 0.26 |
| 8 | y = 0.11t2 – 0.57t + 3.66 | 0.11 | 3.66 | 2.59 | 2.92 | 0.74 | 0.25 |
| 9 | y = 0.16t2 – 0.87t + 3.43 | 0.66 | 3.43 | 2.72 | 2.25 | 1.18 | 0.39 |
| 10 | y = 0.19t2 – 0.84t + 3.47 | 0.42 | 3.47 | 2.21 | 2.54 | 0.93 | 0.31 |
| Correlation coefficient r | |||||||
| DSM-IV score | 0.64* | 0.90** | -0.50 | -0.63 | 0.93** | 0.93** | |
| ICD-10 score | 0.38 | 0.63 | -0.13 | -0.71* | 0.73* | 0.74* | |
| FTND score | 0.16 | 0.17 | -0.13 | -0.04 | 0.15 | 0.15 | |
DISCUSSION
In this study, we reported our work exploring the potential of establishing a non-invasive and objective nicotine dependence measure using video-assisted smoking topography. This method was built upon the established nicotine-receptor kinetics and nicotine receptors-nicotine dependence relationship at the biochemical level4 and nicotine-dependence and self-titration relationship at the behavioral level18. Self-titration behavior was measured using high resolution, 40 frames per second, videotaping of the first whole cigarette of the day. Several topographic measures were derived and used in analysis, including puff duration, puff speed, inhalation duration and exhalation duration. Prior research has documented the importance of the first cigarette of the day, particularly to highly nicotine dependent smokers28.
Topographic measures were analyzed using both linear models and non-linear catastrophe models. The non-linear fold catastrophe models for puff speed performed the best of all others in assessing nicotine dependence, including several derived indicators from the fitted model (e.g. intercept, speed change rate). Many prior studies assessed smoking topography29-31, including videotaping of a single cigarette32. However, our study is the first to explore the utility of smoking topography in assessing nicotine dependence with an advanced modeling approach.
Fold catastrophe adequately captures the nature of self-titrating behavior
An important finding of our study is that the temporal pattern of puff speed followed a U-shaped pattern, reflecting a self-titrating process that is the theoretical basis of this video topography method. Smokers started with a relatively high puff speed for the first few puffs, then slowed down to the lowest speed after about 2–3 minutes, and speeded up again after the turning point. Moreover, several characteristics of the U-shaped pattern were significantly associated with levels of nicotine dependence, since a curved ‘U’ shape was observed among more nicotine dependent smokers.
The U-shaped pattern of puff speed could be explained by the nicotine-receptor kinetics in the brain4. When an addicted smoker wakes up in the morning, the number of active nicotine receptors reaches its peak, showing a strong craving for nicotine. The smoker will thus start with high speed puffs to rapidly desensitize upregulated nicotinic receptors and relieve the craving33. After the first several puffs, over 75% of the empty brain receptors will bind with nicotine34. Smokers may slow down their puffing because of quick relief of withdrawal symptoms and a significant reduction in unbound nicotine receptors. As time evolves, the nicotine-receptor complex will become dissociated and release the receptors as unbound. Smokers may speed up again in order to keep the effective level of nicotine-receptor complex.
In addition to the overall U-shaped pattern, the topographic indicators derived from the fitted fold catastrophe, including beginning puff speed (Y0), difference between beginning speed and lowest speed (Yd), and the average speed (ΔS) of smoking from the beginning to the turning point all had significant positive associations with self-reported dependence scores. In our study, the average initial puff speed of dependent smokers was 67% higher than that of non-dependent smokers. The initial speed may reflect the number of unbound receptors in the brain with much greater numbers in nicotine dependent smokers than in non-dependent smokers due to receptor upregulation35.
Furthermore, reduction in puff speed (Yd) for participants with DSM IV scores = 7 (highly dependent) was approximately four times that of the participants with DSM IV scores < 3 (non-dependent) and two times that of the participants with DSM IV score = 4 (moderately dependent). Similarly, the average speed (ΔS) for highly dependent smokers was about five times that of non-dependent smokers and two times that of moderately dependent smokers. These two indicators may reflect the equilibrium process of bounded and unbound nicotine receptors from overnight abstinence. It is from this evidence we believe that our method could be developed into a valid objective assessment for nicotine dependence.
Video topography as an objective measure of nicotine dependence
To date, the determination of nicotine dependence has been based primarily on subjective evidence, e.g. self-reported addictive symptoms. These methods include DSM-IV criteria8, ICD-10 criteria10 and the Fagerström Test for Nicotine Dependence (FTND)7. Data from this study indicate low concordance among these subjective measures. Given their inherent limitations, if subjective self-report dependence measures are to be used, they should be alongside a gold standard objective measure. While other objective measures, such as brain imaging provide such opportunity, they are more expensive and invasive and do not directly assess smoking behaviors that may be indicative of nicotine dependence.
Smoking topography has been widely adopted as a method to characterize smoking behaviors in fine-grained detail. However, no prior research has examined how the pattern of puffing behaviors over time may be analyzed to provide objective measures of nicotine dependence. The videotaping approach employed here represents an advantage over traditional topography devices, which are expensive and difficult to operate with calibration. This approach can be used to provide objective smoking behavior measures in brain imaging, genetic and epigenetic studies to advance the biobehavioral mechanisms of nicotine dependence for more effective smoking prevention and tobacco use cessation.
The present video-assisted topography approach has a number of research potentials. The procedure is non-invasive, the equipment camera costs only several hundred US dollars, and the software for video editing is free and widely available. It could be a cost-effective method for improving nicotine dependence measurement, if an instrument tool can be developed based on this procedure. In addition to cigarette smoking, the same approach may also be utilized to study electronic cigarette smoking. Further, this approach may be adapted to objectively evaluate the level of dependence for a number of substances beyond tobacco, including alcohol, marijuana and other illicit drugs.
The present video-assisted topography approach has a wide range of clinical and public health applications, potentially. For instance, if a device is produced using this approach, it could be used as a measure of nicotine dependence at repeated time points in epidemiologic studies. Clinicians could use the topography approach as part of personalized feedback in a motivational interview-based cessation intervention. There are also mobile health possibilities whereby smokers could video record themselves smoking a single cigarette and upload the video to a website where it could be analyzed with summary measures indicative of their level of nicotine dependence. Smokers aiming to quit or cut down could subsequently record themselves smoking again and have the recording analyzed for potential reductions in nicotine dependence.
Limitations
This study has several limitations. First, although a diverse sample was used, the small sample size limits the generalizability of the research findings. More research is needed to confirm the findings in larger populations. Second, the modeling of temporal patterns of most topographic measures was more suitable for nicotine dependent than non-dependent smokers, suggesting that this method may be relying upon a biochemical mechanism (i.e. significant upregulation of nicotine receptors in the brain).
CONCLUSIONS
This study is the first to explore a video-assisted topographic method to quantify nicotine dependence, built upon the theoretical frameworks of nicotine-receptor kinetics and self-titration. Results suggest video-assisted topography with fold catastrophe modeling may be a non-invasive objective alternative to other methods for evaluating cigarette smoking behavior and nicotine dependence.