K. Hachemi* | F. Grecu | G. Ioana-Toroimac | Ş. Grigorie (Omrani) | A. Ozer | C. Kuzucuoglu
OPEN ACCESS
SAR radar imagery allows spatial and temporal, regular and precise tracking of surfaces. The response of the radar signal is particularly sensitive to the topography, the roughness and the humidity of the grounds, thus making it possible to detect possible changes occurring between different acquisitions. The surface of the islands is formed especially of alluvial materials and covered by vegetation. The latter contributes greatly to the stability of the islands. The aim of this work is to show the contribution of radar imagery in the study of the dynamics of the Danube island system, Giurgiu-Călăraşi sector, in Romania. This study, based on amplitude images, showed the possibility of determining, locating, inventorying and mapping 11 islands (including 19 sub-islands). The radar images delimit perfectly the latter due to their sensitivity to roughness. Their surface is very rough and wet represented by a strong radiometry. On the other hand, the water surface is smooth thus giving values of low radiometry. The first results obtained show that over this period between 1995 and 2009, the changes are due mainly to weather conditions, precipitation and very high wind speeds. They also reveal an increase in sediment over this 14-year period.
DIACHRONIC, SAR radar, Danube, islands, Giurgiu-Călăraşi sector, Romania
The Synthetic Aperture Radar (SAR) is an efficient and fast way to study the surface changes, thanks to its functioning (all weather) and its capacity to exploit the radar wave from several methods. This tool allows us to obtain two types of information: energetic (radiometry), which is the power emitted and received due to the signal amplitude; temporal, which is the distance between the radar receiver and the target, given by the phase parameter of the recorded wave. The amplitude characterizes the reflectivity of the pixel. It is exploitable directly and comparable to the optical image. The use of SAR radar imagery allows spatial and temporal, regular and fine tracking of the surfaces, due to the sensitivity of the radar signal to the types and properties of the terrain. The response to radar signal is particularly sensitive to the topography, roughness and humidity of the surface, which allows determining the potential changes that can occur between different image acquisitions. These images of radar amplitude, single or composed, represent a very efficient way in monitoring multiple natural phenomena in Romania. They were very important in detecting and analyzing changes in the Buzau region [1]. By associating them with a DEM (Digital Altitude Model), they have also shown great efficiency for a better interpretation of the landscape changes in the very complex region of the Carpathians [2].
The Danube drains 93% of the Romanian territory and it flows into the Black Sea. The dynamics of the river channel is under the effect of the almost uncontrollable interdependency relations between water, relief and sediments, and of their effects on the fluvial system. The geomorphologic, geological, hydrological and climatic context of the Danube along the Giurgiu-Călăraşi sector in Romania is characterized by islands formed on pre-Quaternary sedimentary deposits (Mesozoic, Cainozoic). Therefore, the island is formed almost exclusively by alluvial materials originating from the Quaternary, but due to the fact that vegetation is present, the island is stabilised [3]. We are going to analyse all the emerged spaces found in the channel of the Danube regardless of the degree of vegetation cover. This paper presents the dynamics of the fluvial islands of the Danube between Giurgiu and Călărași localities. This sector corresponds to the lower part of the Danube that also makes the border between Romania and Bulgaria. The islands are fixed and stabilized sedimentary deposits, with vegetation cover depending on the degree of solidification. The main objective of this work is to show the utility of SAR radar imagery of the ERS1/2 satellites in the detection, monitoring, mapping and analysis of the islands and of their changes between different acquisition dates in this sector of the Danube. The aim of this study is defined by the main work phases: identifying and mapping the islands based on multi-date satellite images; obtaining a global and generalized view of the islands system; to get insight of the islands evolution. In order to accomplish this, we will produce multi-date images, calibrated, filtered, geo-referenced and ortho-rectified within several meters of resolution. We will also make coloured composition images of couples of radar images.
2.1 General characteristics of the Danube river
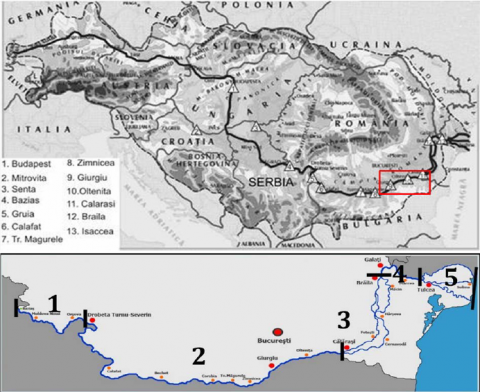
The Danube is considered the second longest river in Europe with a length of 2850 km after Volga (3690 km). The surface of its catchment area is of 805300 km2 and it crosses the centre of Europe from West to East, passing through 10 countries, from its source localized in the Black-Forest Mountains, in Germany (Figure 1). In Romania (the lower sector), the Danube has a length of 1075 km between Baziaș and Sulina localities, of which 800 km forms the border with Serbia, Bulgaria, Moldavia and Ukraine. The remaining 275 km situated in Romania, include the largest islands, cultivated with heterogeneous crops. The river drains 93% of the Romanian territory and flows into the Black Sea through a delta well-known as a reservation of the biosphere. The lower Danube has important local particularities for the economy: the Carpathian defile; the fluvial sector; the fluvio-maritime and maritime sectors. The width of its major channel is variable, from less than 1 km to more than 10 km, and its maximum value is more than 30 km on the ramification sector between Călărași and Brăila. The altitude diminishes along the Danube River. Upstream of Oltenița it surpasses by 3 m the average level of the Danube. It is delimited by the terraces, the number of which decreases from West to East. The lowest terrace develops along the river from Baziaș to Brăila; its altitude varies from 5-6 m to 12-13 m, being occupied by towns and villages, which have also extended in the major channel and are exposed to flood risk [4].
Figure 1. Sectors of the Romanian Danube (modified according to commons.wikimedia.org)
2.2 Localization of the study area
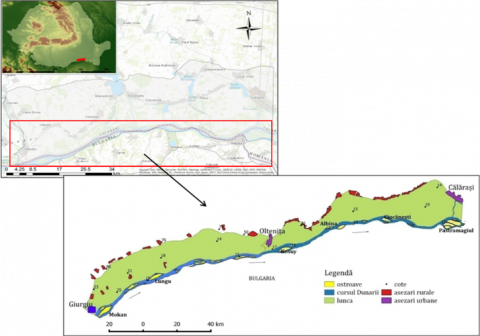
The study area is situated between the Romanian Plain at North and the pre-Balkanic Plateau at the South, in Bulgaria, more precisely in the South-West part of the Danube basin, between Giurgiu and Călărași towns. This sector is delimited by the latitudes of 43.61° to 44.36° North and the longitudes 25.57° to 26.91° East (Figure 2).
Figure 2. Map of the region and location of the Danube study area (Giurgiu-Călăraşi sector, Romania)
2.3 Geological, geomorphologic and climatic characteristics of the study area
From geological and geomorphologic points of view, the islands show similar characteristics with the major channel of the Danube and with the Romanian plain to which they are connected genetically, and which influences them tectonically [5]. The relative altitude of the islands rarely surpasses 4-5 m (in respect to the general level of the Danube). The small islands with reduced altitudes are often flooded. The surface alluvial deposits belong to the upper Quaternary (upper and actual Holocene) being formed of gravels, sand, loess deposits with variable grain-size depending on the position towards the great tributaries of the Danube or on the position of the island towards the banks [6].
In the south of the Romanian plain, the pre-Quaternary is found at depths more and more reduced, in the major bed of the Danube, while Pliocene deposits revealed by erosion and also Cretaceous deposits (limestone, marls, sands, sandstones up to depths of -400 m) occur isolated below the Quaternary [7].
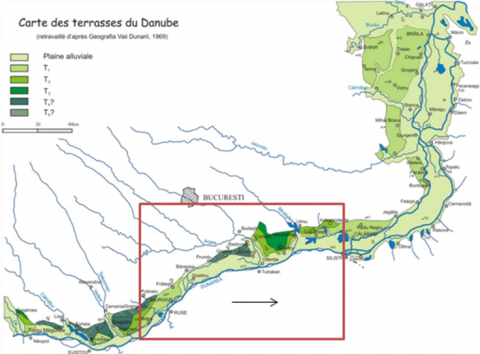
The analysed sector individualizes by the reduced number of terraces compared to the upstream sector (Figure 3). The lower 1-3 terraces are found discontinuously until the confluence with Mostiștea River, and downstream can be observed only terrace 1. It is the proof of the unitary formation of the Danube at the level of the lower terraces with influences on the genesis of the islands also. At the confluence with the Argeș occur confluence terraces Argeș-Danube as well, clearly evidenced [8].
The climate presents important contrasts between summer and winter; the relatively flat relief enhances the fast displacement of air masses, the high wind speed, snow storms, the excessive heating during summer [9]. The natural vegetation on the islands is partially replaced. Chernozem soils are found on the terraces and in the plain and alluvial soil are found in the major river bed [10].
The social-economic context has influenced the transformation of the steppe and the deforestation for the construction of localities, the construction of roads and the industrialization of the landscapes (Figure 3).
Figure 3. Map of the Danube terraces
3.1 Methodology
The methodology selected in this study is based on the following steps: (1) Producing the radar SAR images of amplitude (intensity) given by a series of acquisition dates (1995, 1996, 1997, 1999, 2000, 2002, 2004, 2005, 2007, 2008, 2009) at 12.5 m resolution; (2) Inventory, mapping and maps design of the Danube islands system in the sector Giurgiu-Călăraşi; (3) These produced images must be calibrated, filtered, geo-referenced and ortho-rectified; (4) Comparison of these images for creating colour compositions at different intervals going from several days to several years; (5) Detecting and analysing the observed changes; (6) Assessment of the islands system dynamics between 1995 and 2009.
3.2 SAR radar data used
The acquisition of SAR images has been covered by ESA (European Space Agency) in the framework of a project on the detection and monitoring of the islands system in the Giurgiu-Călăraşi sector of the Danube in Romania.
For this study we used 23 images of ascendant passage, PRI (PRecision Image) of the ERS-1/2 satellites (Table 1). These images cover a surface of (100 km (carried) x 102.5 km (azimuth)). The acquisition is nocturnal (ascendant) of an azimuthally direction upwards. The scene is illuminated towards the right in lateral perspective, with an incidence angle of 23°, within the « C » wavelength band (5.65 cm), and a vertical polarisation (VV).
3.3 Data processing
We were able to extract and produce 23 images of amplitude (intensity) resolution of 12.5 m, dated from 1999 to 2009 from the Giurgiu-Călărași sector of the Danube. We have calibrated, filtered, geo-referenced and ortho-rectified these images. We have also produced diachronic images of the area with time intervals running from one day to 14 years. The following steps are indispensible for better exploitation of the information given by the displayed pixel and for a more accurate interpretation. These steps are also necessary for developing a diachronic analysis and the detection of changes: (1) the radiometric calibration consisted in putting together the produced image (amplitude) and its real representation (terrain); (2) the geo-referencing allows the use of the produced images in the same cartographical projection system (UTM, zone 35-N, WGS84); (3) the ortho-rectification consists in correcting the image following the shape of the terrain model (MNT); this step has been ensured by using a DEM-SRTM of 30 m; (4) the filtering consists in eliminating the Speckele effect until increasing the readability of the image. Thanks to the performed processing, we were able to obtain different results.
Table 1. Data used from the ERS-1/2 satellites
|
N° |
Date (dd/mm/yyyy) |
Hour |
Satellite |
Orbit |
Track |
Frame |
Centre Lat°/Lon° |
Incidence Angle |
|
1 |
06/07/1995 |
20:26:40 |
ERS-2 |
01099 |
243 |
873 |
43.98/26.26 |
23.247° |
|
2 |
28/12/1995 |
20:26:39 |
ERS-2 |
03604 |
243 |
873 |
43.99/26.25 |
23.247° |
|
3 |
15/05/1996 |
20:26:39 |
ERS-1 |
25281 |
243 |
873 |
43.98/26.27 |
22.931° |
|
4 |
16/05/1996 |
20:26:39 |
ERS-2 |
05608 |
243 |
873 |
43.99/26.28 |
22.939° |
|
5 |
25/07/1996 |
20:26:33 |
ERS-2 |
06610 |
243 |
869 |
43.92/26.31 |
22.942° |
|
6 |
05/06/1997 |
20:26:34 |
ERS-2 |
11119 |
243 |
873 |
43.99/26.30 |
22.929° |
|
7 |
18/08/1999 |
20:26:17 |
ERS-2 |
42315 |
243 |
873 |
43.99/26.30 |
22.922° |
|
8 |
16/11/2000 |
20:26:35 |
ERS-2 |
29155 |
243 |
873 |
43.98/26.28 |
22.921° |
|
9 |
10/05/2001 |
20:26:19 |
ERS-2 |
31660 |
243 |
873 |
43.99/26.28 |
23.247° |
|
10 |
14/02/2002 |
20:24:46 |
ERS-2 |
35668 |
243 |
873 |
43.98/26.28 |
23.247° |
|
11 |
15/01/2004 |
20:25:02 |
ERS-2 |
45688 |
243 |
873 |
43.98/26.27 |
22.931° |
|
12 |
03/06/2004 |
20:25:06 |
ERS-2 |
47692 |
243 |
873 |
43.99/26.28 |
22.939° |
|
13 |
12/08/2004 |
20:25:14 |
ERS-2 |
48694 |
243 |
873 |
44.04/26.28 |
22.942° |
|
14 |
30/12/2004 |
20:25:12 |
ERS-2 |
50698 |
243 |
873 |
43.99/26.27 |
22.929° |
|
15 |
10/03/2005 |
20:25:00 |
ERS-2 |
51700 |
243 |
873 |
43.99/26.28 |
22.922° |
|
16 |
19/05/2005 |
20:25:09 |
ERS-2 |
52702 |
243 |
873 |
43.99/26.28 |
23.247° |
|
17 |
28/07/2005 |
20:25:12 |
ERS-2 |
53704 |
243 |
873 |
43.99/26.28 |
23.247° |
|
18 |
06/10/2005 |
20:25:03 |
ERS-2 |
54706 |
243 |
873 |
43.99/26.29 |
22.931° |
|
19 |
23/02/2006 |
20:24:56 |
ERS-2 |
56710 |
243 |
873 |
43.98/26.29 |
22.939° |
|
20 |
13/07/2006 |
20:25:11 |
ERS-2 |
58714 |
243 |
873 |
43.98/26.28 |
22.942° |
|
21 |
28/06/2007 |
20:25:02 |
ERS-2 |
63724 |
243 |
873 |
43.98/26.28 |
22.929° |
|
22 |
12/06/2008 |
20:26:27 |
ERS-2 |
68734 |
243 |
873 |
43.99/26.32 |
22.922° |
|
23 |
28/05/2009 |
20:27:40 |
ERS-2 |
73744 |
243 |
873 |
43.98/26.24 |
22.921° |
3.3.1 Amplitude images of the Giurgiu-Călărași sector of the Danube
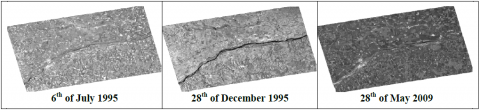
The active SAR sensors set on orbiting satellites measure two components of the backscattered signal, which are the amplitude and the phase, respectively. The amplitude of the signal is a function of the physical and dielectric characteristics of the image element. The phase depends on the geometrical characteristics containing the information of distance between the radar and the target. The radar images have the advantage of being able to be captured all the time, during both the day and the night, regardless of the cloud coverage, unlike the platforms that operate in the domain of the visible. The amplitude characterizes the reflectivity of the pixel. It can be directly exploited and compared with the optical image. The amplitude is in direct relation with the surface condition; thus, the surfaces with high roughness and humidity are represented by a high radiometry; on the contrary, the smooth and dry surfaces appear with very low radiometry values (Figure 4). The following images are calibrated, geo-referenced, ortho-rectified and filtered at a resolution of 12.5 m.
Figure 4. Amplitude image of the Giurgiu-Călăraşi sector of the Danube, different dates
3.3.2 Completion of coloured composites between different dates
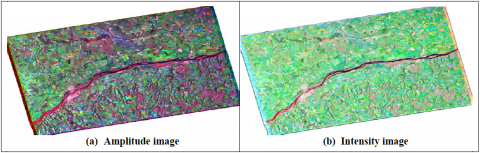
A radar amplitude image allows having instant information from the region in the image and, as the radar is a tool available all the time and in any meteorological conditions, the colour composition enables the detection of changes occurred between two dates. We have made several couples of colour composition at different intervals. With the purpose of monitoring the changes of the study sector between 1995 and 2009, we here show the making of two colour compositions starting from three images from the same date, one of amplitude (Figure 5, (a)) and the other of intensity (Figure 5, (b)). We have attributed the (Blue) to the date of July 6, 1995, the (Green) to December 12, 1995 and the (Red) colour to the date of May 28, 2009.
Figure 5. Colour composition of three radar SAR (ERS-2) images, with the resolution of 12.5 m, calibrated, geo-referenced, ortho-rectified and filtered
The radar images delimit perfectly the islands due to their sensibility of roughness. The surface of the river islands is very rough and humid, therefore they are represented by a strong radiometry, appearing very clear in colour; on the opposite, the water surface is smooth and is described by very low radiometry values, therefore presenting a dark colour. The first results that were obtained can be resumed by: (1) the output of 23 amplitude (intensity) images at a 12.5 m resolution, calibrated, filtered, geo-referenced and ortho-rectified, showing the morphology of the area for the years 1995, 1996, 1997, 1999, 2000, 2001, 2002, 2004, 2005, 2006, 2007, 2008 and 2009; (2) the production of diachronic maps of the entire area of the islands system within the sector, showing the changes at different time intervals; (3) identifying, localizing and indexing of 11 islands (including 19 sub-islands); (4) mapping of these islands and sub-islands at different dates; (5) monitoring the evolution of the island system between 1995 and 2009.
4.1 Inventorying and mapping the islands system between 1995 and 2009
This process can be resumed in 3 steps:
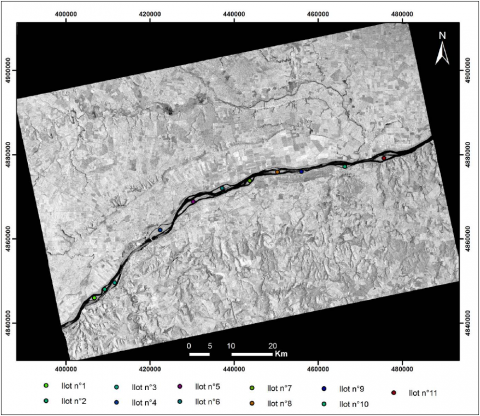
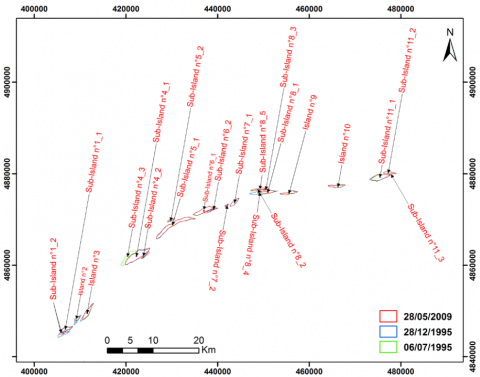
- Localization and identification of the islands situated in the Giurgiu-Călăraşi sector of the Danube. The objective of this phase was to detect all the emerged surfaces from the riverbed of the Danube and to classify them into islands and secondary islands (sub-islands). The term "sub-island" signifies the components localized in the same entity of the islands. We have indexed 11 islands including 19 sub-islands in this sector (Figure 6). Islands 1, 2 and 3 are located before Giurgiu and after the Vedea-Danube confluence; island 11 is located downstream Oltenița and the confluence of the Argeș-Danube rivers. The respective names of these islands are: (1) Cama 1 (Vedea), (2) Cama 2 (Malu), (3) Liuliak (Prista), (4) Mocanu, (5) Aleko, (6) Lungu, (7) Miska, (8) Goliam, (9) Kalimok, (10) Tutrakan and (11) Kosui (Pozharevo).
Figure 6. Map of localization of the island system
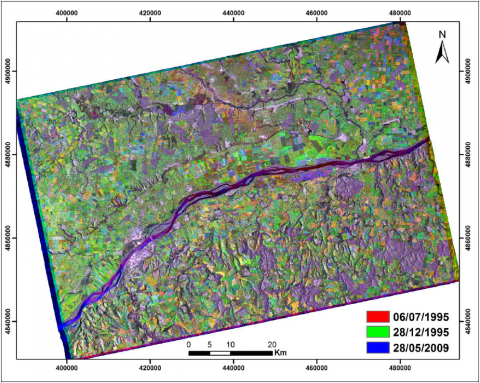
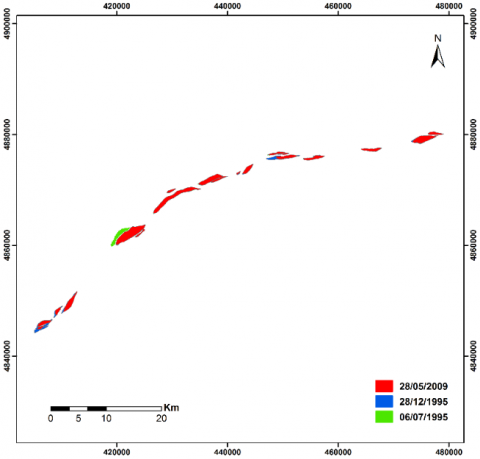
- Development of the diachronic maps of the islands system from the studied sector and the neighbouring areas. The designed colour composition map (Figure 7) shows the changes of the landscape in the entire area, between the three dates, 06/07/1995, 28/12/1995 and 28/05/2009. The interest of these maps, which cover the fields, the farmlands, etc., is to try to differentiate between the seasonal changes (precipitation, winds) and the sedimentary accumulation changes.
Figure 7. Diachronic map showing the changes
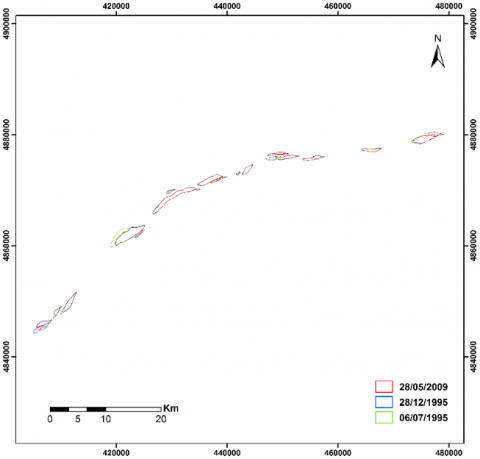
Figure 8. Map of the islands contours at different dates 06/07/1995, 28/12/1995 and 28/05/2009
Figure 9. Map of the islands surfaces at different dates 06/07/1995, 28/12/1995 and 28/05/2009
Figure 10. Map of the numeration of the islands and sub-islands in the studied sector
- Mapping of the islands system at different dates. This last phase is resumed to the design of the maps in UTM coordinates that show the contours and the surfaces of each island and sub-island at different dates, 06/07/1995, 28/12/1995 and 28/05/2009 (Figures 8 and 9). We have also made a map presenting the numeration of all the islands and sub-islands from this studied sector (Figure 10).
4.2 The evolution of the island system between 1995 and 2009
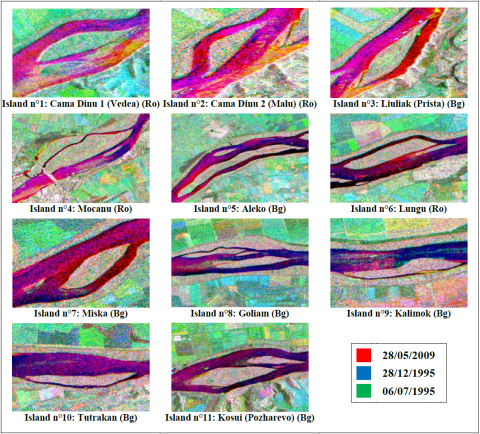
Figure 11. Colored composition of each island and sub-island of the study area, between 1995 and 2009 (Bg: Bulgaria; Ro: Romania)
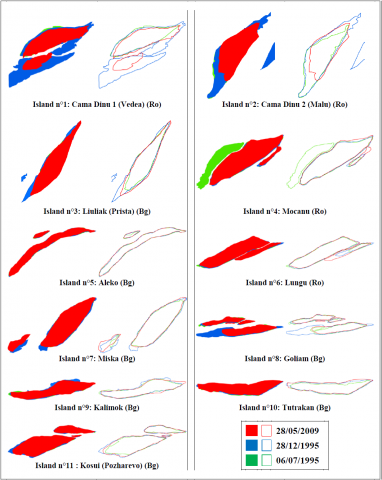
The multi-temporal analysis of the radar SAR images allowed the detection, monitoring and analysis of the changes occurred on the islands from the Giurgiu-Călărași sector of the Danube. These amplitude images made it possible to list 11 islands including 19 sub-islands in this study sector. The diachronic maps showed changes which are mainly due to weather conditions, humidity, precipitation (fine drizzle, rain, torrential rain, sleet, hail, …) and the very high wind speed, respectively. They show the appearance and disappearance of small sub-islands due to variations in the water level. They also show a roughness of water surfaces due to wind effects (Figure 11). The surface maps and contours show us small accumulations of sediments (Figure 12). This accumulation can be justified by the phenomenon of flooding produced in the region. During the July 2005 floods, the average annual sediment load in tributary river accumulation was 5838 kg/s [11]. In 2006, the flooding of the Danube led to a maximum amount of sediment volumes corresponding to a maximum liquid flow of 16500 m3/s in this Giurgiu-Călăraşi sector [4] [12].
From the geomorphological point of view, we have not noticed major phenomena, but on the opposite, the islands system has been rather stable in this very well delimited time interval.
Figure 12. Surfaces and contours of each island and sub-island of the study area, between 1995 and 2009 (Bg: Bulgaria; Ro: Romania)
This work, conducted by multi-temporal analysis of SAR radar amplitude images, enabled the detection, monitoring and analysis of changes in the islands and sub-islands of the Danube, sector Giurgiu-Călăraşi.
These images also made it possible, not only to study one island at a time but the whole system of islands, thanks to the global and generalized view of SAR radars, range 100 km. This helps to understand the evolution of the entire river system.
Over this period from 1995 to 2009, the changes are mainly due to weather conditions, humidity, precipitation and very high wind speeds. We also noted a small increase in the land area and sediment accumulation during this 14-year period. This can be explained by the floods produced in 2005 on tributary rivers, but especially those produced in 2006 on the Danube; a situation that we will analyze in another complementary study.
We thank the European Space Agency (ESA) for providing us with the SAR images from the ERS satellites in the framework of a research project on the survey and monitoring of the Danube islands in the Giurgiu-Călăraşi sector, Romania.
[1] Kamel, H., Abdelkader, A., André, O., Florina, G., Gheorghe, V. (2009). Apport de l’imagerie radar SAR (Images d’Amplitude) pour l’analyse du changement dans la région de Buzau (Roumanie). Revista de Geomorfologie, 11: 63-72. http://hdl.handle.net/2268/249774
[2] Hachemi, K., Abdellaoui, A., Grecu, F., Ozer, A., Visan, M. (2010). Association d’images diachroniques avec un MNA pour une meilleure interprétation des changements de paysage dans la région de Buzau (Roumanie). Revista de Geomorfologie, 12: 53-65. http://hdl.handle.net/2268/248815
[3] Grecu, F., Ioana-Toroimac, G., Hachemi, K. (2017). Morphometrical parameters of the fluvial islands in the Danube River channel Romania (paleogeographical evolution). New Technologies, Hazards and Geoarchaeology, 3 November 2017, Athens, Greece, 67-68.
[4] Grecu, F., Zaharia, L., Loana-Toroimac, G., Dobre, R. (2007). Risque météo-hydrologique dans la vallée du Danube roumain. Le cas des inondations d’avril – mai 2006. Climat, Tourisme, Environnement, Actes du XXème Colloque de l’Association Internationale de Climatologie, 3-8, Carthage, Tunis, 277-282.
[5] Bandrabur, T. (1966). Harta geologica, 1:200 000, 44. Bucuresti, Nota explicativa. Comitetul de Stat al Geologiei, Bucuresti, 1-26.
[6] Grecu, F., Ioana-Toroimac, G., Grigorie, S., Ghita, C., Ilfov, I.S.J. (2017). The dynamics of the Danube channel over the last 150 years. Proceedings of Romanian Geomorphology Symposium, Ed. Universităţii Alexandru Ioan Cuza din Iaşi, 56-69. https://doi.org/10.15551/prgs.2017.56
[7] Murgeanu, G., Liteanu, E., Bandrabur, T. (1966). Harta geologica Scara 1:200 000, 44 Bucuresti, Comitetul Geologic. Institutul Geologic, Bucuresti, 1-26.
[8] de Geografie, I. (1969). Geografia văii Dunării româneşti. Editura Academiei, Bucuresti, XXVI planse, Bucureşti, 1-782.
[9] Grecu, F. (2010). Geografia campiilor României. Editura Universității din Bucuresti, Bucuresti, 1-260.
[10] Omrani, S.G., Grecu, F. (2015). Fluvial landforms seen as causes of the Danube floods. Case study: Olteniţa-Călăraşi sector. Journal of Engineering Studies and Research, 21(1): 1-12.
[11] Grecu, F. (2010). The dynamic factors of hydrogeomorphic vulnerability in the central sector of the Romanian plain. Metalurgia International, XV(9): 139-148.
[12] Grecu, F. (2016). Hazarde si riscuri naturale. Editura Universitara, Bucuresti, 1-354. https://doi.org/10.5682/9786062803926