


Abstract
The precise biological characteristics of human mesenchymal stem cells (hMSCs), including growth regulatory mechanisms, have not yet been defined. Using 29 strains of hMSCs isolated from bone marrow, we have performed extensive analyses of the growth profiles of hMSCs in vitro. All 29 strains stopped proliferating with a mean population doubling (PD) of 28, although there was a considerable difference among strains. The mean telomere restriction fragment length of the cells passaged twice correlated well with the final number of PDs in each strain, suggesting the value of this measurement to be predictive of the growth potential of hMSCs. The expression level of the p16INK4A gene was associated closely with the PD number of each strain (p = .00000001). Most of the p16INK4A-positive cells were Ki67-negative and senescence associated β-galactosidase-positive, and the suppression of p16INK4A gene expression by small interfering RNA in senescent hMSCs reduced the number of senescent cells and endowed them with the ability to proliferate. Twenty-five of the 29 strains showed a steady gradual increase in the expression of p16INK4A. The remaining four strains (13.8%) showed different profiles, in which DNA methylation in the promoter region occurred in vitro. One of the four strains continued to proliferate for much longer than the others and showed chromosomal aberrations in the later stages. These results indicated p16INK4A to be a key factor in the regulation of hMSC growth, and, most importantly, careful monitoring of DNA methylation should be considered during the culture of hMSCs, particularly when a prolonged and extended propagation is required.
Disclosure of potential conflicts of interest is found at the end of this article.
Introduction
Mesenchymal stem cells are defined as plastic-adherent fibroblastic cells with the potential to differentiate into multiple mesenchymal tissues. Human mesenchymal stem cells (hMSCs) isolated from bone marrow are able to proliferate in vitro and differentiate along multiple lineages including bone, cartilage, adipose, and muscle cells [1]. Thus, hMSCs are being tested in clinical trials for tissue regeneration and engineering [2, 3]. Although infinite growth ability is one definition of stem cells, most hMSCs cease proliferating after 20–40 population doublings (PDs) [4], although precisely why has not yet been elucidated. The proliferative capacity of primary mammalian cells in vitro is finite, a concept known as the Hayflick limit [5]. In vitro cultured cells undergo a limited number of PDs before entering a state of premature growth arrest, referred to as senescence, in which cells remain alive and metabolically active but are completely refractory to mitogenic stimuli [5]. As telomere shortening, oxidative stress, DNA damage, and aberrant mitogenic signaling can all induce senescence in human primary cells, senescence is now considered to be a form of biological protection from neoplastic transformation [6].
Telomeres, tandem TTAGGG repeats that cap the ends of eukaryotic chromosomes, are forced to shorten at each DNA replication. The shortening of telomeres plays an important role in cell aging and is regulated by a protein complex associated with telomere end [7, 8]. The maintenance of telomere ends is one of the mechanisms for self-renewal of stem cells. In undifferentiated hESCs, many proteins of the telomerase complex, including TERT, are expressed, and telomere length (8–11 kilobase [kb]) is maintained [9, 10]. In most characterized tissue stem cell subtypes such as hematopoietic stem cells (HSCs) and epidermal stem cells, telomeric shortening occurs with age despite the presence of telomerase activity [11].
Proteins regulating cell cycles are also involved in the cellular senescence process, among which p16INK4A has been studied extensively. p16INK4A was identified as a causative factor for familial melanomas and, simultaneously, as an inhibitor for the cell cycle kinases CDK4 and CDK6, indicating its properties as a tumor suppressor negatively regulating the cell cycle [12]. Subsequent investigations, however, have proved that the essential role of p16INK4A is actually in the regulation of cellular senescence. p16INK4A was found to be accumulated in many aged cells and tissues [13], and the age-induced increase in p16INK4A contributed to a reduction in the size of reservoirs of self-renewing tissue stem cells [14, 15]. The precise profile of p16INK4A gene expression during the in vitro culture of hMSCs has yet to be reported, and it is also unknown whether the shortening of telomere or the upregulation of p16INK4A expression is critical for senescence in hMSCs.
The activity of p16INK4A is regulated under both physiological and nonphysiological conditions. Under physiological conditions requiring the repression of p16INK4A such as in tissue stem cells, the transcription of the p16INK4A gene is downregulated by BMI1, a polycomb group (PcG) protein that affects stem cell fate, including self-renewal, senescence, and aging [16]. BMI1 is necessary for efficient self-renewing cell division in adult murine HSCs and neural stem cells (NSCs) [17, 18]. BMI1 represses the transcription of p16INK4A as well as p14ARF, which is another inhibitor of cell proliferation sharing part of the coding sequence at the INK4A-ARF locus [19].
Under nonphysiological conditions such as in cancer cells, the most frequent event inactivating p16INK4A function is transcriptional downregulation by DNA methylation in the core promoter region [20]. In higher eukaryotes, DNA is methylated at cytosines located 5′ to guanosine in the CpG dinucleotide [21]. This modification has important regulatory effects on gene expression and also triggers de novo methylation in unmethylated lesions [22]. Therefore, the mapping of methylation patterns in CpG islands is an important tool for understanding both normal and pathologic gene expression events [23]. De novo methylation of the p16INK4A promoter regions in vitro was reported in spontaneously immortalized rodent cells, suggesting the important role of p16INK4A in bypassing the senescence. In this sense, it is interesting that the hMSCs transformed spontaneously in vitro lacked expression of the p16INK4A gene [24].
Here, we investigated the role of two critical factors, telomere length and the expression of p16INK4A, during life span of hMSCs in vitro and found that both are involved in different phases. Also, we found that the prolonged propagation of hMSCs may induce inactivation of the p16INK4A gene by DNA methylation with chromosomal aberrations.
Materials and Methods
Study Population
Primary hMSCs were isolated from the bone marrow taken from iliac crests of 29 donors, who received orthopedic operative procedures requiring autologous bone grafts from iliac crests (supplemental online Table 1). The donors had no history of concurrent illness or of medication that could affect bone metabolism. There were 13 males and 16 females. The median donor age was 49.1 years (range, 10–84 years). The Ethics Committee of the Faculty of Medicine, Kyoto University, approved the procedure and informed consent was obtained from each donor.
Cell Culture
Primary hMSC cultures were established by means of a previously described method [25]. Mononuclear cells were suspended in α-minimal essential medium with GlutaMAX (Invitrogen Co., Carlsbad, CA, http://www.invitrogen.com) supplemented with 10% fetal bovine serum (HyClone, South Logan, UT, http://www.hyclone.com), 100 U/ml penicillin, and 100 mg/ml streptomycin and seeded at a density of 2.5 × 10⁵cells per cm2 in 5% CO2 at 37°C. At 80% confluence, cells were counted and reseeded at a dilution of 1:3, as cells in the first passage. From this point, the number of PDs was calculated based on the total cell number at each passage. This procedure was repeated until the cells stopped proliferating. At this point, cell numbers were counted to calculate the final PD.
Induction of Differentiation
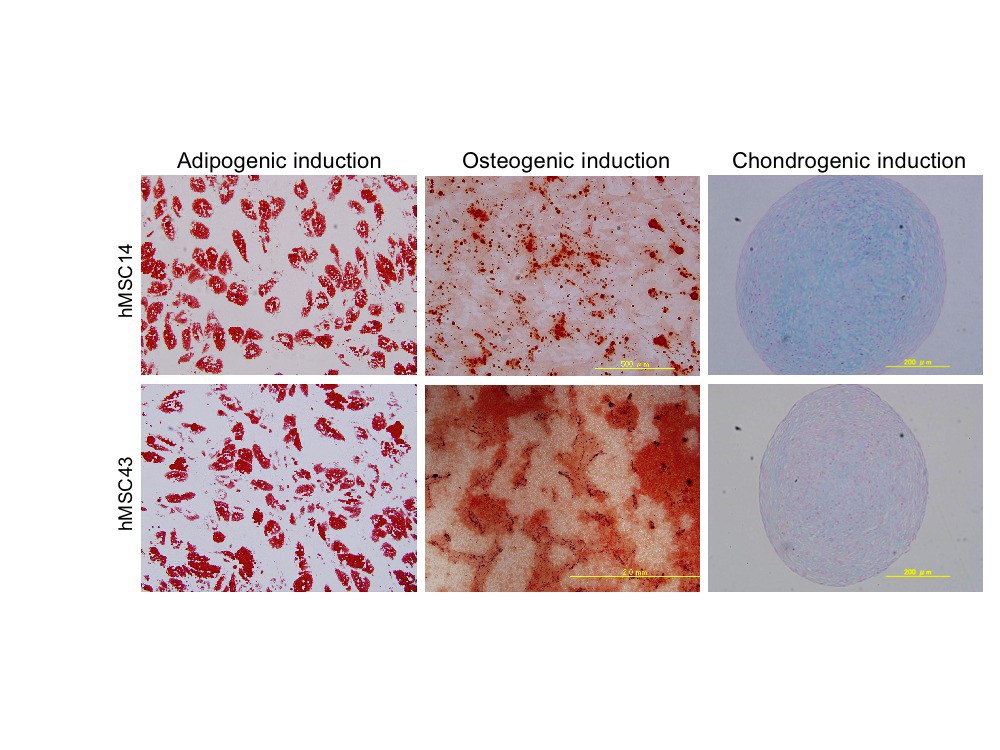
The potential for differentiation in the osteogenic, adipogenic, and chondrogenic directions was examined using the differentiation-induction protocol provided by Cambrex (East Rutherford, NJ, http://www.cambrex.com) in each hMSC strain at the second passage. After 14 days of osteogenic differentiation, the cells were stained with 40 mM PH4.2 Alizarin Red S (Sigma-Aldrich, St. Louis, MO, http://www.sigmaaldrich.com). After 21 days of adipogenic differentiation, cells were stained with 0.3% oil red O (Nacalai Tesque, Kyoto, Japan, http://www.nacalai.co.jp/en/index.html). After 21 days of chondrogenic differentiation, the pellets were stained with Alcian Blue (Muto Pure Chemicals Co., LTD, Tokyo, http://www.mutokagaku.com).
Telomere Length Assay
High molecular weight DNA was extracted from each hMSC at the second and final passage. Telomere restriction fragment length (TRFL) was determined using Southern blot analysis. Genomic DNA (2 μg) was digested by mixing HinfI and RsaI. The digested DNA was separated on 0.7% agarose gels. Gels were denatured and blotted onto a positively charged nylon membrane (Roche Diagnostics, Basel, Switzerland, http://www.roche-applied-science.com). Using the DIG Assay Kit (Roche Diagnostics), hybridization with a digoxigenin (DIG)-labeled telomere-specific probe (CCCTAA)3 was conducted. After hybridization, membranes were washed and incubated with a DIG-specific antibody covalently coupled to alkaline phosphatase (AP). Results were visualized using AP metabolizing chemiluminescent substrate (CSPD; Roche Diagnostics). Each assay was performed twice. Membranes were then scanned and the mean TRFL (mTRFL) was calculated.
Western Blot Analysis
Western blotting was performed as mentioned [26]. The primary antibodies used were as follows: DO-1 for p53; G175-405 for p16INK4A (BD Pharmingen, San Diego, http://www.bdbiosciences.com), F-5 for p21CIP1, C-19 for p27 (Santa Cruz Biotechnology, Santa Cruz, CA, http://www.scbt.com), and clone F6 for BMI1 (Upstate, Lake Placid, NY, http://www.upstate.com). Blots were probed with horseradish peroxidase-conjugated goat anti-mouse IgG or goat anti-rabbit IgG (Santa Cruz Biotechnology) and visualized using a chemiluminescence reagent ECL Plus Detection Kit (GE Healthcare UK Ltd, Little Chalfont, U.K., http://www.gehealthcare.com).
Reverse Transcription-Polymerase Chain Reaction
Total RNA was extracted using TRIzol reagent (Invitrogen) and 1 μg was reverse transcribed for single-stranded cDNAs using oligo(dT) primer and Superscript II reverse transcriptase (Invitrogen).
Quantitative Reverse Transcription-Polymerase Chain Reaction
The reaction mixtures for amplification contained 100 ng of cDNA and Universal TaqMan 2X Master Mix (Applied Biosystems, Foster City, CA, http://www.appliedbiosystems.com). The concentrations of primers and TaqMan probes (Biosearch Technologies Japan, Tokyo, http://www.btjkk.co.jp) were 900 and 250 nM. All reactions were performed in triplicate using the ABI PRISM 7700 Sequence Detection System (Applied Biosystems) under the following conditions: 2 minutes at 50°C and 10 minutes at 95°C followed by 40 cycles of 95°C for 15 seconds and 60°C for 1 minute. Expression of 18S was used as an internal control. Saos2, a human osteosarcoma cell line, expresses the p16INK4A gene at a high level due to a homozygous deletion of the retinoblastoma gene [27], and by setting the expression level of p16INK4A in Saos2 cells as a standard, the relative expression level of p16INK4A in hMSCs was calculated. A statistical analysis was done with the t test after logarithmic transformation. Primers and probes for p16INK4a are as described: sense, 5′-CCCAACGCACCGAATAGTTAC-3′; antisense, 5′-CACGGGTCGGGTGAGAGT-3′; probe, FAM-AGGCCGATCCAGGTCATGATGATGG-BHQ-1.
Methylation-Specific Polymerase Chain Reaction
The bisulfite modification of DNA samples was performed using the EpiTect Bisulfite Kit (Qiagen, Tokyo, http://www1.qiagen.com). Methylation-specific polymerase chain reaction (PCR) (MSP) for p16INK4a was performed as previously described [20, 28]. The methylation-specific primer sequences are as follows: sense, 5′-TTATTAGAGGGTGGGGCGGATCGC-3′; antisense, 5′-CAACCCCAAACCACAAC CATAA-3′. For the unmethylated region, the primers are: sense, 5′-TTATTAGAGGGTGGGGTGGATTGT-3′; antisense, 5′-CCACCTAAATCGACCTCCGACCG-3′.
Small Interfering RNA Assay
The optimum sequence for the small interfering (si)RNA targeting the p16INK4A gene was obtained as ready-annealed, purified duplexes from Dharmacon Research (Lafayette, CO, http://www.dharmacon.com). The control “scrambled” sequence was AAGCGC-GCUUUGUAGGAUUCG; the p16INK4A-targeted sequence was AAACCAGAGGCAGUAACCAUG. Transfection was carried out using the Amaxa electroporation system (Amaxa Biosystems, Cologne, MA, http://www.amaxa.com).
5-Bromo-2′-deoxyuridine Assay
Incorporated 5-bromo-2′-deoxyuridine (BrdU) was detected with a BrdU Detection Kit (Roche Diagnostics) according to the manufacturer's instructions. Experiments were done in triplicate.
Senescence Associated-β-Galactosidase Assay
Cells were cultured on eight-well chamber slides. The senescence associated-β-galactosidase (SA-β-Gal) assay was performed as described previously [29].
Immunocytochemistry
After SA-β-Gal staining, cells were washed with phosphate-buffered saline (PBS) and permeabilized with 0.5% Triton X-100, 1% bovine serum albumin in PBS. Slides were blocked with 10% nonfat milk in PBS, incubated with primary antibody for 16 hours and with secondary antibody for 1 hour in blocking solution, counterstained with 4,6-diamidino-2-phenylindole, and viewed by epifluorescence microscopy. The antibodies used were DCS-50.2, a mouse monoclonal antibody for p16INK4a (Progen, Heidelberg, Germany, http://www.progen.de), and ab27619, a fluorescein isothiocyanate-conjugated rabbit monoclonal antibody for Ki-67 (Abcam, Cambridge, U.K., http://www.abcam.com).
Statistical Analyses
Statistical analyses were performed using Statcel software. Data were assessed using the Pearson product-moment correlation coefficient, Student's t test, Spearman's rank-correlation coefficient analysis, a one-factor analysis of variance, a multiple regression analysis, and the Mantel-Haenszel chi-squared test.
Results
Long-Term Culture of Human MSCs
The primary culture of donor cells was successful in all 29 cases, and the adipogenic, chondrogenic, and osteogenic differentiation of early passage cells was confirmed in all strains (supplemental online Fig. 1). Growth profiles of hMSCs showed characteristics typical of the Hayflick model of cellular aging (Fig. 1A), and all strains stopped proliferating after a certain period in vitro, although the culture period (mean, 151.2 ± 47.7 days; range, 90–334 days) and the final PD number (mean, 28.1 ± 7.2; range, 13–54) differed considerably among strains (supplemental online Table 1). There was a significant correlation between the final PD number and the age of donors (p = .0042) with the Pearson product-moment correlation coefficient analysis. When each donor was classified by age into either a younger group (under 50 years, n = 13, mean, 28.5 ± 12.2 years) (Fig. 1B) or an older group (over 50 years, n = 16, mean, 66.6 ± 8.8 years) (Fig. 1C), the mean final PD number of the older group (24.8 ± 4.7) was found to be significantly less than that of the younger group (32.5 ± 7.5) (p = .0086) (Fig. 1D). This result was confirmed by an analysis with Spearman's rank-correlation coefficient (r = −.608, p = .00128) (Fig. 1E).
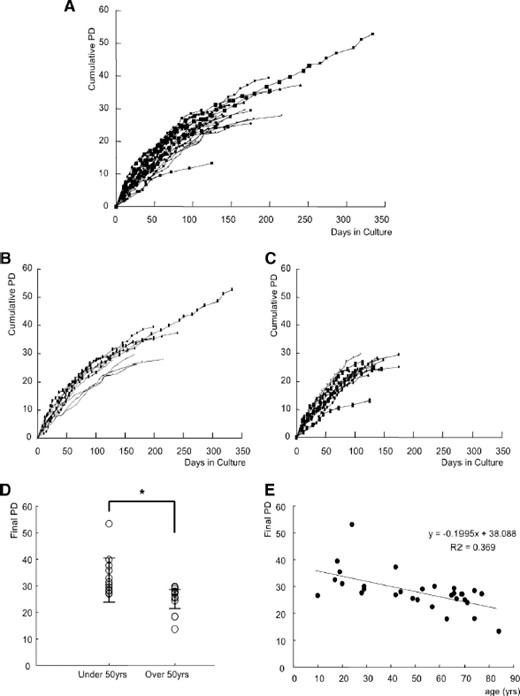
Growth profiles of human (h)MSCs in vitro. (A): Growth profiles of 29 hMSC strains in vitro. PD number is plotted against culture period. (B): Growth profiles of hMSCs from younger donors (<50 years, n = 13). (C): Growth profiles of hMSCs from older donors (≥50, n = 16). (D): Comparison of final PD between younger and older donors with Student's t test. There was a significant difference * p = .0086. (E): A Spearman's rank-correlation coefficient when age was plotted as a metric variable and final PD as an objective variable (r = −.608, p = .00128). Abbreviations: PD, population doubling; yrs, years.
Telomere Length
Most of the cells at the final passage were flattened and enlarged (Fig. 2Ab), compatible with cells entering senescence. The flattened cells were positive for SA-β-gal staining (Fig. 2Ac) but negative for the terminal deoxynucleotidyl transferase dUTP nick-end labeling staining (data not shown), suggesting that the senescence was why the proliferation ceased. It is well known that the length of telomeres contributes to cellular senescence [30], and therefore the mTRFL was determined in each hMSC strain at the second and final passage, designated as SP and FP, respectively (Fig. 2B) (supplemental online Table 1). The mTRFL of SP and FP cells was 9.4 ± 1.0 kb and 7.5 ± 0.6 kb, respectively, and the mean telomere-shortening rate was 109 ± 43 base pairs (bp) (Fig. 2B). A Pearson product-moment correlation coefficient analysis showed a positive correlation (p = .00048) between the mTRFL of SP and final PD. This result was confirmed with Spearman's rank-correlation coefficient (r = −.557, p = .00321) (Fig. 2C). These findings suggested that calculating the mTRFL of SP roughly predicts the expandability of the hMSC strain, which will be valuable information in expanding hMSC populations for clinical purposes. We then analyzed the correlation between the mTRFL of SP and donor age, but results of a Student's t test (p = .13) (Fig. 2D) and Spearman's rank-correlation coefficient analysis (r = −.28, p = .13) (Fig. 2E) indicated that there was no correlation.
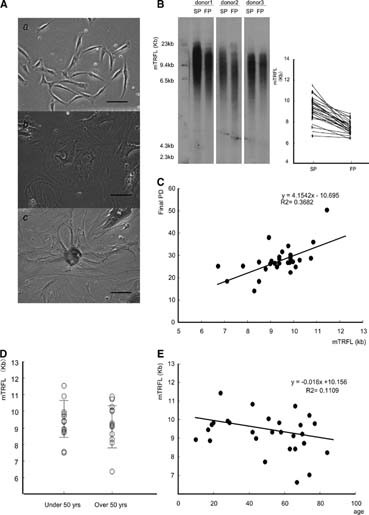
Telomere shortening during the in vitro life span of human (h)MSCs. (A): Phase-contrast photos of hMSC45 at (Aa) PD2 and (Ab) PD28. Most cells at PD28 were positive for SA-β-gal staining (Ac); ×400 magnification. Scale bar = 100 μm. (B): Detection of telomere restriction fragment by Southern blotting. The mTRFL in the second passage differed among donors (9.4 ± 1.0 kb) but that in late passages converged to almost the same value (7.5 ± 0.6 kb). (C): mTRFL at SP as a predictor of the final PD. A statistically significant association (r = −.557, p = .00321) was obtained with Spearman's rank-correlation coefficient when mTRFL at SP was plotted as a metric variable and final PD as an objective variable. (D): Donor age is not a denominator of the mTRFL at SP. No significant difference of mTRFL at SP was observed between younger and older donors (p = .13). (E): Spearman's rank-correlation coefficient when age was plotted as a metric variable and early mTRFL as an objective variable (r = −.28, p = .13). Abbreviations: FP, first passage; kb, kilobase; mTRFL, mean telomere restriction fragment length; PD, population doubling; SP, second passage; yrs, years.
PD Number-Dependent Increase of p16INK4A Gene Expression
The mTRFL of FP cells was 7.5 ± 0.6 kb, which is much longer than the critical size of the telomere (approximately 4.5 kb) [31], suggesting the involvement of other factors in the senescence of hMSCs. p16INK4A, a cell cycle regulator, is known to contribute to cellular senescence and also stem cell aging [13]. The mRNA expression of the p16INK4A gene was analyzed in all hMSC strains at several time points. In most cases, the expression level of the p16INK4A gene showed a gradual increase during propagation in vitro (Fig. 3A). Using the expression level of Saos2 as a reference, the expression level of the p16 gene at each point was digitalized by quantitative reverse transcription (RT)-PCR and plotted against PD number (Fig. 3B). The PD-dependent increase in p16INK4A gene expression was confirmed statistically by a multiple regression analysis (r = .78, p = .00000056). A tight association was observed in both younger (Fig. 3B, circle) and older (Fig. 3B, triangle) donors.
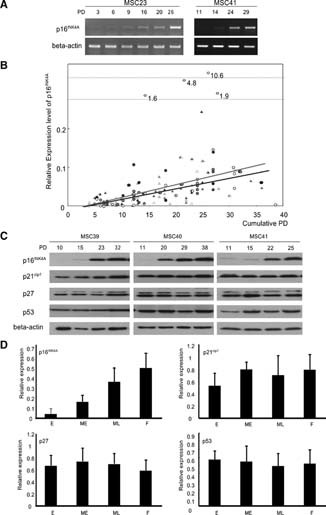
PD-dependent increase in the expression of p16INK4A. (A): mRNA expression of p16INK4A in vitro analyzed by semiquantitative reverse transcription-polymerase chain reaction. (B): Correlation of p16INK4A expression with PD number. Samples derived from younger and older donors were demonstrated with circles and triangles, respectively, and samples from each donor taken at different time points are indicated in the same color. PD-dependent expression of p16INK4A was confirmed by multiple regression analysis in human (h)MSC derived from both younger (red line, r = .59, p = .00000015) and older (blue line, r = .64, p = .0000001) donors. (C): Expression of cell cycle regulators during the in vitro life span of hMSCs. (D): Quantitative analyses of the expression of cell cycle regulators in vitro. The relative expression of the cell cycle regulators was quantified as described in Materials and Methods as well as the abbreviation of each time point (E, ME, ML, and F). A significant increase in the expression level of p16INK4A was observed toward the later stage of life (analyzed by one-factor analysis of variance, p = .00000001). There was no significant change in vitro in the expression of p21cip1 (p = .21), p27 (p = .36), and p53 (p = .87). Abbreviations: E, early; F, final; ME, middle early; ML, middle late; PD, population doubling.
The result of RT-PCR was confirmed by Western blotting. Seven cases were randomly selected, and proteins were extracted from cells at four time points based on the final PD number of each strain: the second passage (early); the PD number that is one third of the final PD number (early middle); the PD number that is two thirds of the final PD number (late middle); and the last passage (final). The expression of p16INK4A protein at each point was analyzed as well as that of p21cip1, p27, and p53 and quantified. As in the case of mRNA expression, the expression level of p16INK4A protein showed a PD-dependent increase (p = .000000001). As for the other cell cycle regulating genes, the p21cip1 gene showed a nonsignificant (p = .21) but slight increase in expression toward the end of the cells' life span. The expression level of p27 and p53 showed no significant change in vitro (Fig. 3C, 3D).
The Expression of p16INK4 Was Positively Correlated with SA-β-Gal Staining but Not Ki67
Expression of the p16INK4A gene was analyzed at the cellular level using immunocytochemical methods in three randomly selected cases (hMSC08, hMSC40, and hMSC45). The expression of SA-β-gal and Ki67 was also analyzed in these samples as a marker for senescence and proliferation, respectively. Cells positive for p16INK4A were negative for Ki-67 in hMSC08 at PD12, which was 50% of their life span in vitro (final PD number was 25) (Fig. 4Ac). Similar results were obtained in the case of hMSC45 at PD18 (final PD number was 29) (Fig. 4Af) and hMSC40 (data not shown). These data suggested that cells positive for p16INK4A lost their proliferating ability.
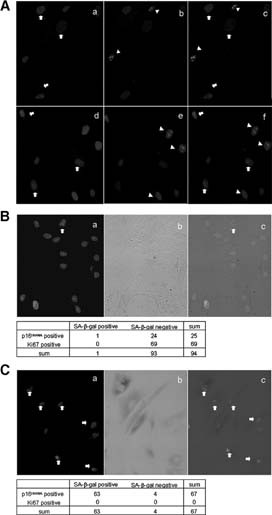
Association of p16INK4A with a marker of senescence but not that of proliferation. (A): Immunocytochemical staining of p16INK4A and Ki-67. (Aa–Ac): Human (h)MSC08 at population doubling (PD)23 (final PD was 25); (Ad–Af): hMSC45 at PD18 (final PD was 26). (Aa, Ad): p16INK4A staining. Signals are demonstrated as red dots in nuclei, and arrows indicate positive cells. (Ab, Ae): Ki-67 staining. Signals are demonstrated as blue dots in nuclei, and positive cells are indicated by arrowheads. (Ac, Af): Merged images. Note that most p16INK4A-positive cells were Ki-67-negative and vice versa. (B): Triple staining of p16INK4A, Ki-67, and SA-β-Gal in hMSC40 at PD6. (Ba), double staining of p16INK4A (red) and Ki-67 (green); (Bb), light field image of SA-β-Gal staining; (Bc), merged image of (Ba) and (Bb). Cells were classified by staining pattern, and the number of cells in each group is demonstrated in the table below the figures. (C): Identical experiments were performed using hMSC40 at a later passage (PD28). Abbreviation: SA-beta-gal, senescence associated-β-galactosidase.
Next, SA-β-Gal staining was performed before double staining of p16INK4A and Ki-67, and cells positive for each staining were counted. Among hMSC40 cells at PD6, only 1 of 94 cells (1%) was positive for SA-β-Gal, and it was also stained by p16INK4A (Fig. 4B). Among SA-β-Gal-negative cells (n = 93), 24 (25.8%) were stained with p16INK4A and 69 (73.4%) were stained with Ki67 (Fig. 4B). There were no cells that were double positive for p16INK4A and Ki-67. Among the late passage cells (PD26), 63 (94%) were positive for SA-β-Gal. Among SA-β-Gal-negative cells (n = 4), all were stained for p16INK4A and none were stained with Ki67 (Fig. 4C). Identical results were obtained for hMSC08 and hMSC45 (data not shown), and the Mantel-Haenszel chi-squared test with continuity correction in three strains showed a positive correlation between the expression of p16INK4A and SA-β-Gal (χ2 = 2.75, p = .046). These results suggested that p16INK4A expression induced senescence and loss of proliferating ability.
Knockdown of p16INK4A Rescued Cells from Senescence and Induced Cell Proliferation
To further investigate the role of p16INK4A, its expression was inhibited with siRNA. Twenty-four hours after a single transfection with p16-siRNA in p16INK4A positive hMSC (hMSC40 at PD24), effective knockdown of the gene expression was confirmed by RT-PCR, and the expression of the p14ARF gene, which shares exons 2 and 3 with the p16INK4A gene, was not affected by p16-siRNA (Fig. 5A). The knockdown effect at the protein level was confirmed by Western blot analysis (Fig. 5B); no change in the expression level of p21cip1 or p53 (Fig. 5B) was observed, indicating a specific effect on the p16INK4A gene.
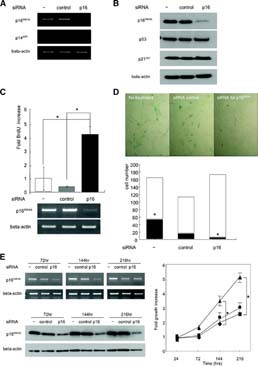
Knockdown of p16INK4A prevented senescence and restored proliferation. (A): Inhibition of p16INK4A gene expression by p16-siRNA. siRNA for a scramble sequence (control-siRNA) was used as a control. (B): Specific inhibition of p16 protein expression by p16-siRNA. (C): Incorporation of BrdU after siRNA treatment. Effective inhibition of p16INK4A expression by p16-siRNA was confirmed by reverse transcription-polymerase chain reaction shown in the lower part of the figure; *, p < .01. (D): Senescence associated-β-galactosidase (SA-β-Gal) staining after siRNA treatment. Representative data were shown in the upper part of the figure, and SA-β-Gal-positive (black square) and negative (white square) cells were counted as described in the Materials and Methods section and are shown in the lower part; *, p < .01. Note that total cell number was decreased in the control-siRNA-treated cells, whereas the number in the p16-siRNA-treated cells was equal to that in untreated cells. (E): Growth profile of human MSCs after siRNA treatment. Living cells of each group (▴, treated with p16-siRNA; •, treated with control-siRNA; ▪, no treatment) were numerated at each time point, and the fold increase compared with the number at 24 hours after siRNA treatment was demonstrated; *, p < .01. Abbreviations: BrdU, 5-bromo-2′-deoxyuridine; hr(s), hours; siRNA, small interfering RNA.
To investigate the effect of the downregulation of p16INK4A expression on the proliferating ability of hMSC strains that have an upregulated p16INK4A, p16-siRNA was introduced into hMSC39 at PD32 (final PD number was 35), and the incorporation of BrdU was assayed 24 hours later. Suppression of p16INK4A gene expression by p16-siRNA was confirmed by RT-PCR (Fig. 5C, lower panel). p16-siRNA treatment led to a 4.2- and 10.5-fold increase in BrdU incorporation compared with no treatment or treatment with control-siRNA, respectively (p < .01) (Fig. 5C, upper panel). The knockdown of p16INK4A also rescued cellular senescence. The ratio of SA-β-gal-positive cells treated with p16-siRNA (3.1% ± 0.6%) was significantly lower than that of cells not treated (31.8% ± 5.3%) or treated with control-siRNA (14.2% ± 3.0%) (Fig. 5D). The reason for the decrease in the SA-β-Gal-positive ratio in control-siRNA treated cells is probably due to the decrease in total cell number (nontreatment group: 164 ± 25.7, control-siRNA group: 112.7 ± 19.4, p16-siRNA group: 172.3 ± 38.6). Senescent cells expressing SA-β-Gal seemed to be vulnerable to the trypsinization process, which was required for the transfection experiments. Even in such a situation, the total cell number was increased in the p16-siRNA group. The growth stimulatory effect of p16-siRNA was confirmed by serial cell counting (Fig. 5E). The fold increase in cell number at 144 and 216 hours after transfection was higher in the p16-siRNA-treated cells than in cells without treatment or control-siRNA-treated cells (Fig. 5E).
The Expression Profile of p16INK4A Is Classified into Three Types
In almost all strains, the expression of p16INK4A gradually increased with the propagation in vitro (Fig. 3) of hMSC10, shown in Figure 6C. There were, however, some strains showing a different profile of expression. Based on the p16INK4A expression profile in vitro, 29 cases were divided into three groups and analyzed in detail (supplemental online Table 1).
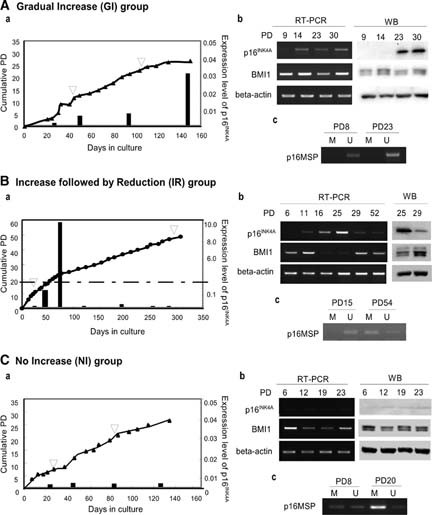
Classification of human (h)MSC strains by the expression of p16INK4A during cell expansion. (A): GI group. (Aa): Cumulative PD (line graph) and the relative expression of the p16INK4A gene (bar graph) in hMSC23. The arrowhead indicates the time point at which the methylation of the p16INK4A gene was analyzed. (Ab): Expression of the p16INK4A and BMI1 genes at the mRNA (left panel) and protein (right panel) levels. (Ac): MSP of the p16INK4A gene. (B): IR group. Samples were derived from hMSC17. (C): NI group. Samples were derived from hMSC10. Abbreviations: GI, gradual increase; IR, increase followed by reduction; M, fragments amplified by methylated sequence-specific primers; MSP, methylation-specific polymerase chain reaction; NI, no increase; PD, population doubling; RT-PCR, reverse transcription-polymerase chain reaction; U, fragments amplified by unmethylated sequence-specific primers; WB, western blotting.
Gradual Increase Group.
Twenty-five of 29 (86%) strains demonstrated this pattern of expression (Fig. 6A; hMSC23 shown in Fig. 6A). The expression level at the final passage was at least two times higher than at the first passage. The mean final PD of the gradual increase (GI) group was 28.1 ± 7.2 (18–39), and the mean culture period was 151.2 ± 47.7 days (90–240 days). The mTRFL of SP was 9.4 ± 1.0 kb (6.7–10.1 kb) and that of FP was 7.5 ± 0.6 kb (6.4–8.5 kb). The mean highest expression of p16INK4A was 0.06 ± 0.04 (0.019–0.24). The expression of p16INK4A was not increased more than 0.3 relative to the expression of Saos2. The expression level of the BMI1 gene showed no significant change in vitro (Fig. 6Ab).
Increase Followed by Reduction Group.
Two out of 29 (7%) strains showed a rapid reduction in p16INK4A gene expression after an extremely high level was reached (Fig. 6B; hMSC17 shown in Fig. 6B; hMSC14, data not shown). The donor age was relatively young (hMSC14, 17 years; hMSC17, 24 years). The final PD (hMSC14, 33; hMSC17, 54) and culture period (hMSC14, 147 days; hMSC17, 334 days) were lengthened. The mTRFL of SP was almost equal to the average of the GI group in hMSC14 (9.5 kb) but longer in hMSC17 (11.5 kb). The mTRFL of FP was equal to the average of the GI group in both strains (hMSC14, 7.6 kb; hMSC17, 6.9 kb). The highest value of p16INK4A expression was much higher than the mean value of the GI group in both strains (hMSC14, 4.8; hMSC17, 10.6). Interestingly, the expression of the BMI1 gene was repressed during the period in which the expression level of the p16INK4A gene was extremely high and returned to the initial level after the p16INK4A gene was downregulated (Fig. 6Bb).
No Increase Group.
In two out of 29 (7%) strains, the level of p16INK4A remained low throughout the culture (hMSC10 shown in Fig. 6C; hMSC24, data not shown). The final PD (hMSC10, 28; hMSC24, 27) and culture period (hMSC10, 138 days; hMSC24, 170 days) were almost equal to the average for the GI group. The mTRFL of SP was almost equal to the average of the GI group in both strains (hMSC10: 10.3 kb, hMSC24: 9.0 kb). The mTRFL of FP was longer in hMSC10 (8.5 kb) but equal in hMSC24 (7.1 kb). The highest expression of p16INK4A did not exceed 0.01 (hMSC10, 0.0063; hMSC25, 0.0028). The expression level of the BMI1 gene showed no significant change during the culture period.
Methylation of the Promoter of the p16INK4A Gene
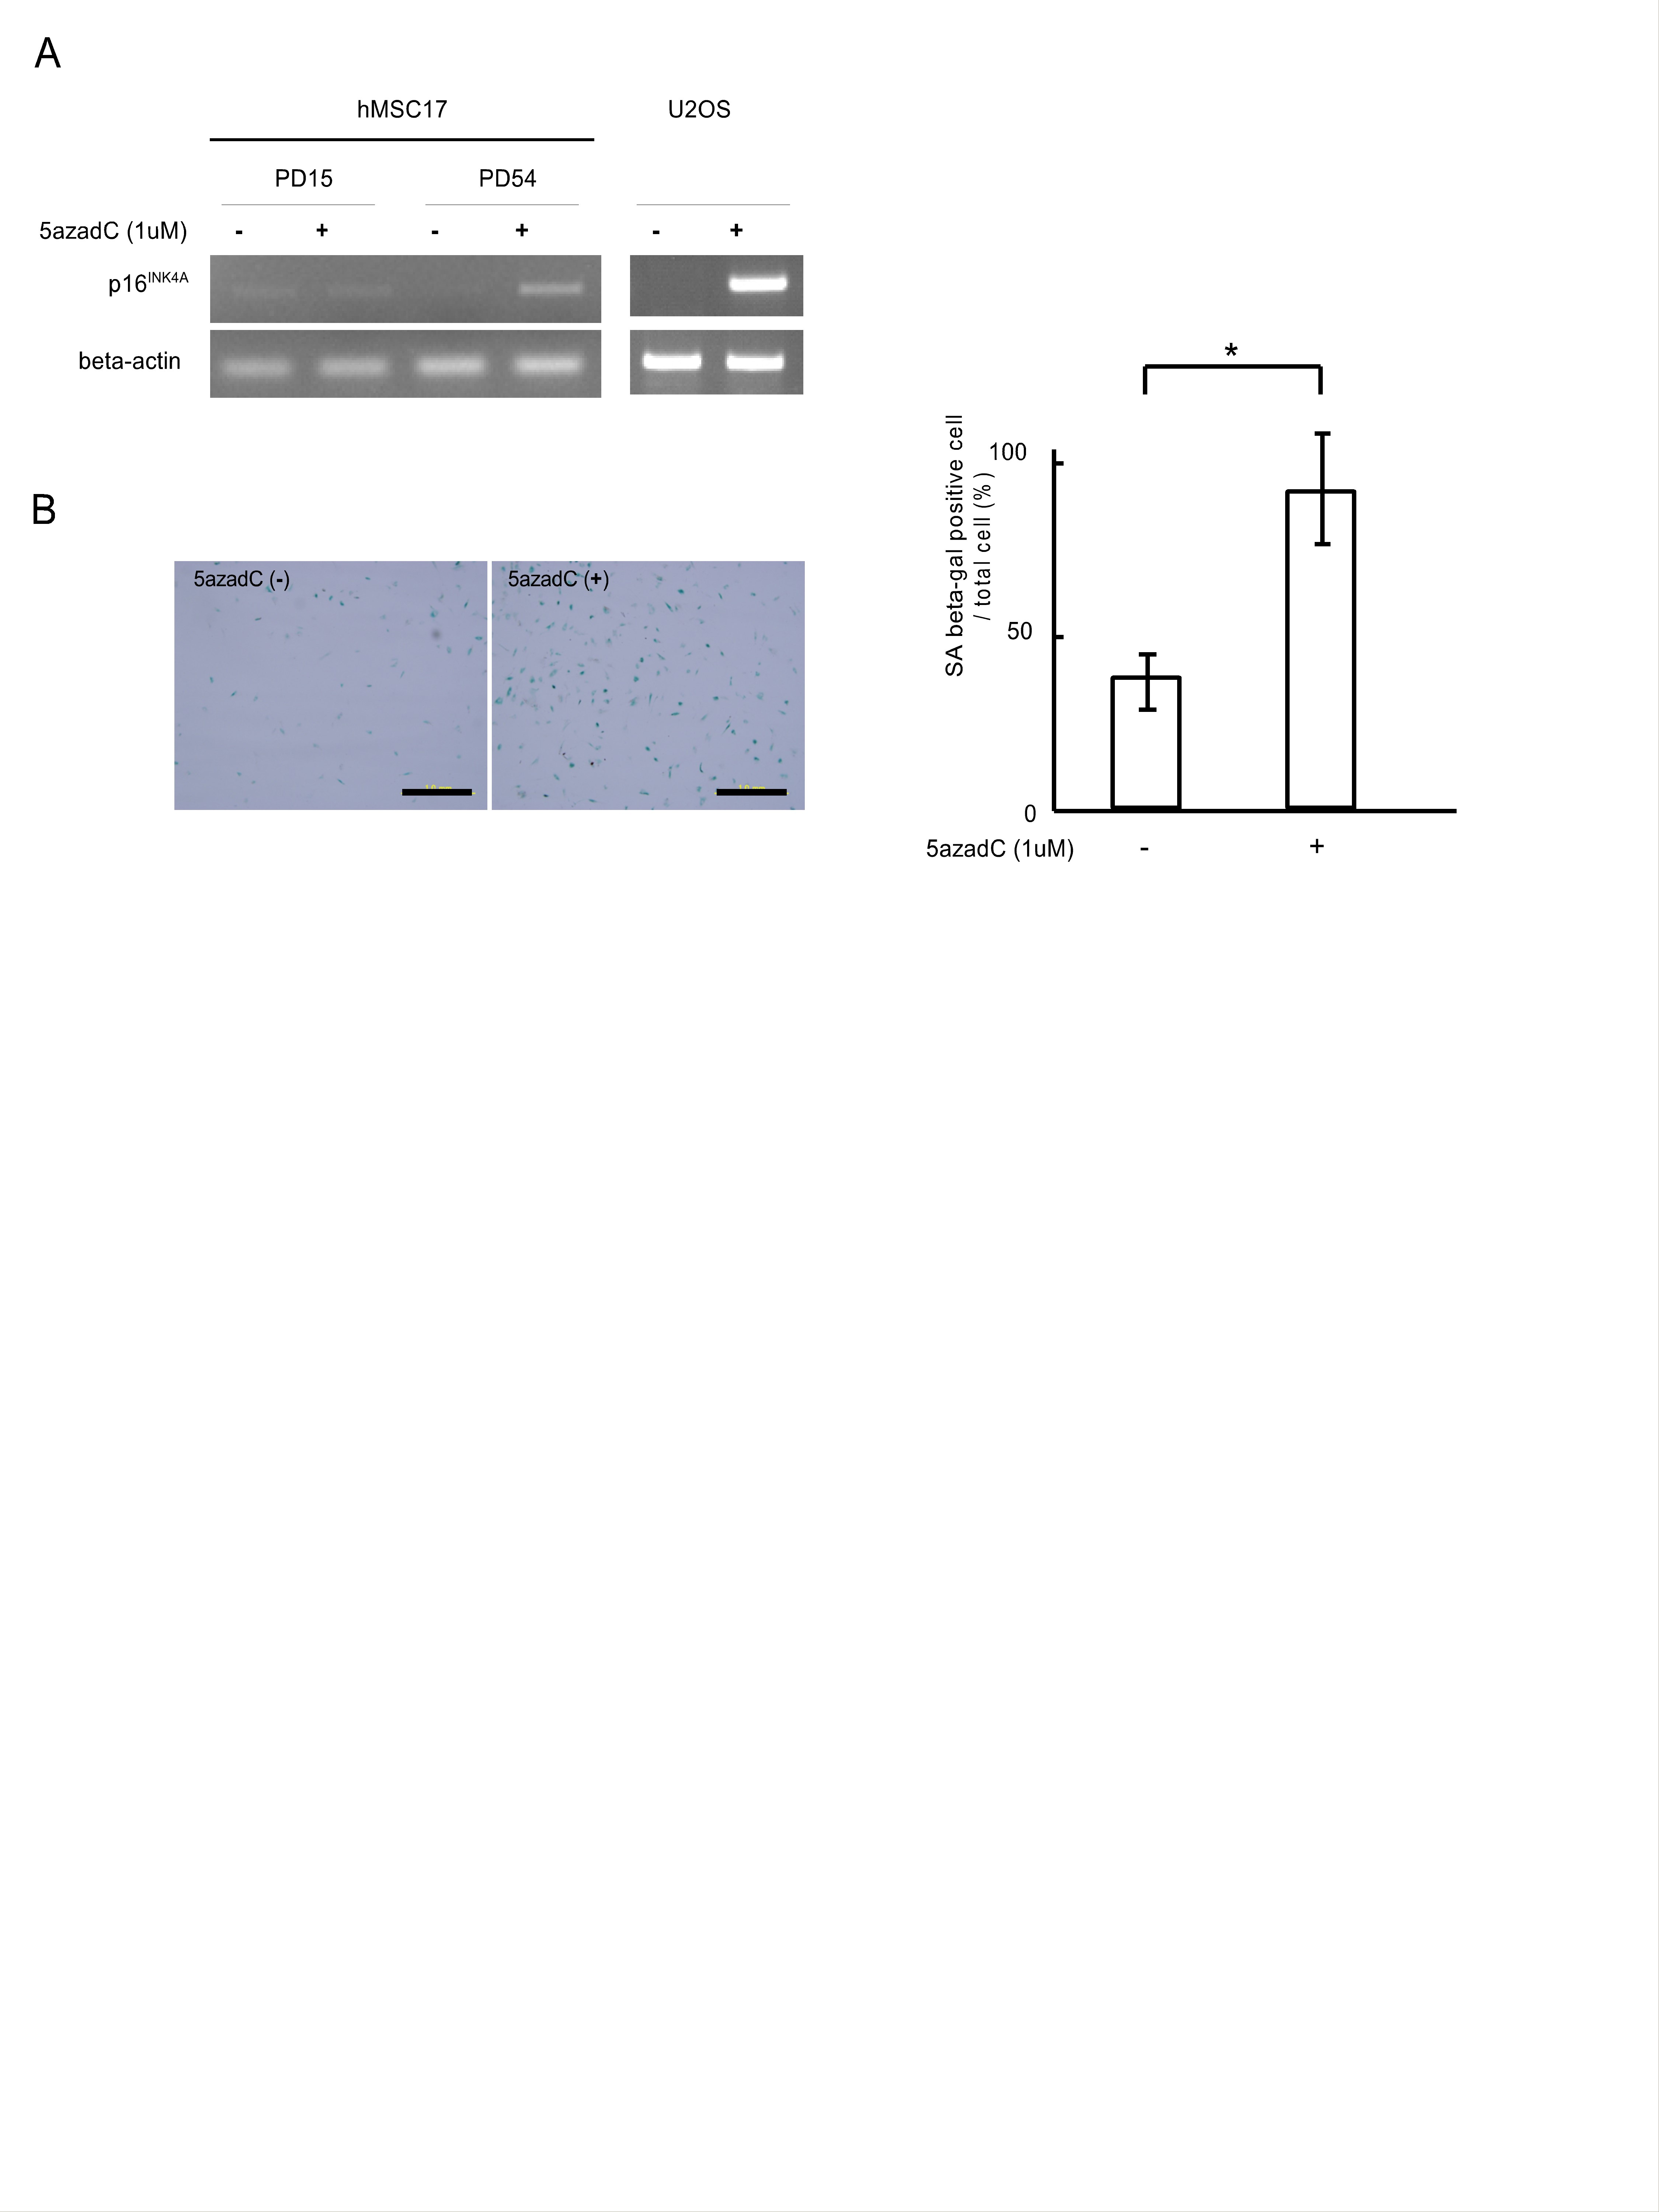
Several mechanisms were found as the cause of downregulation of the p16INK4A expression in cancer cells, the DNA methylation in the core promoter region being the most frequent event [28]. Several experiments were performed to investigate whether DNA methylation was involved in the downregulation of p16INK4A expression observed in certain hMSC strains. First, hMSC17 cells, one of two strains in the increase-followed-by-reduction (IR) group, were treated with the demethylation drug 5-aza-dC for 96 hours, and p16INK4A expression was checked by RT-PCR (supplemental Fig. 2). As seen in control U2OS cells, an osteosarcoma cell line in which p16INK4A expression is downregulated by DNA methylation [32], p16INK4A expression was induced in PD54 but not in PD15 (supplemental online Fig. 2A). 5-aza-dC treatment also induced a senescence phenotype in late passage hMSC17 (PD54) as SA-β-Gal-positive cells increased by twofold after 96 hours of treatment (supplemental Fig. 2B).
Next, the methylation status of the promoter region of p16INK4A was analyzed by the MSP assay. MSP was performed using the genomic DNA from early and late passage cells from 10 strains of the GI group, in two strains of the IR group, and in two strains of the no increase (NI) group (supplemental online Table 1). The methylated sequence-specific fragment of the p16INK4A gene was not amplified in 12 out of 12 group GI strains either in early or late passage cells, and unmethylated sequence-specific fragments were amplified (Fig. 6Ac). In the case of hMSC17 from the IR group, only unmethylated sequence-specific fragments were amplified using DNA extracted from cells at PD15, at which the level of p16INK4A expression remained low (Fig. 6Bc). When DNA extracted from cells at PD54 was used for MSP, however, methylated sequence-specific fragments were amplified, and the amount of unmethylated sequence-specific fragments decreased (Fig. 6Bc). In the NI group, the methylated sequence-specific fragment was observed even in the early passage cells in addition to the unmethylated sequence-specific fragment (Fig. 6Cc). The expression of the methylated sequence-specific fragment was increased in late passage, and unmethylated sequence-specific fragment was decreased. Methylation of the target region of MSP in these samples was confirmed by bisulfite sequencing (data not shown). These results indicated that DNA methylation in the core promoter region plays a role in downregulating the expression of the p16INK4A gene in vitro in hMSCs as observed in human cancers.
Chromosomal Rearrangement
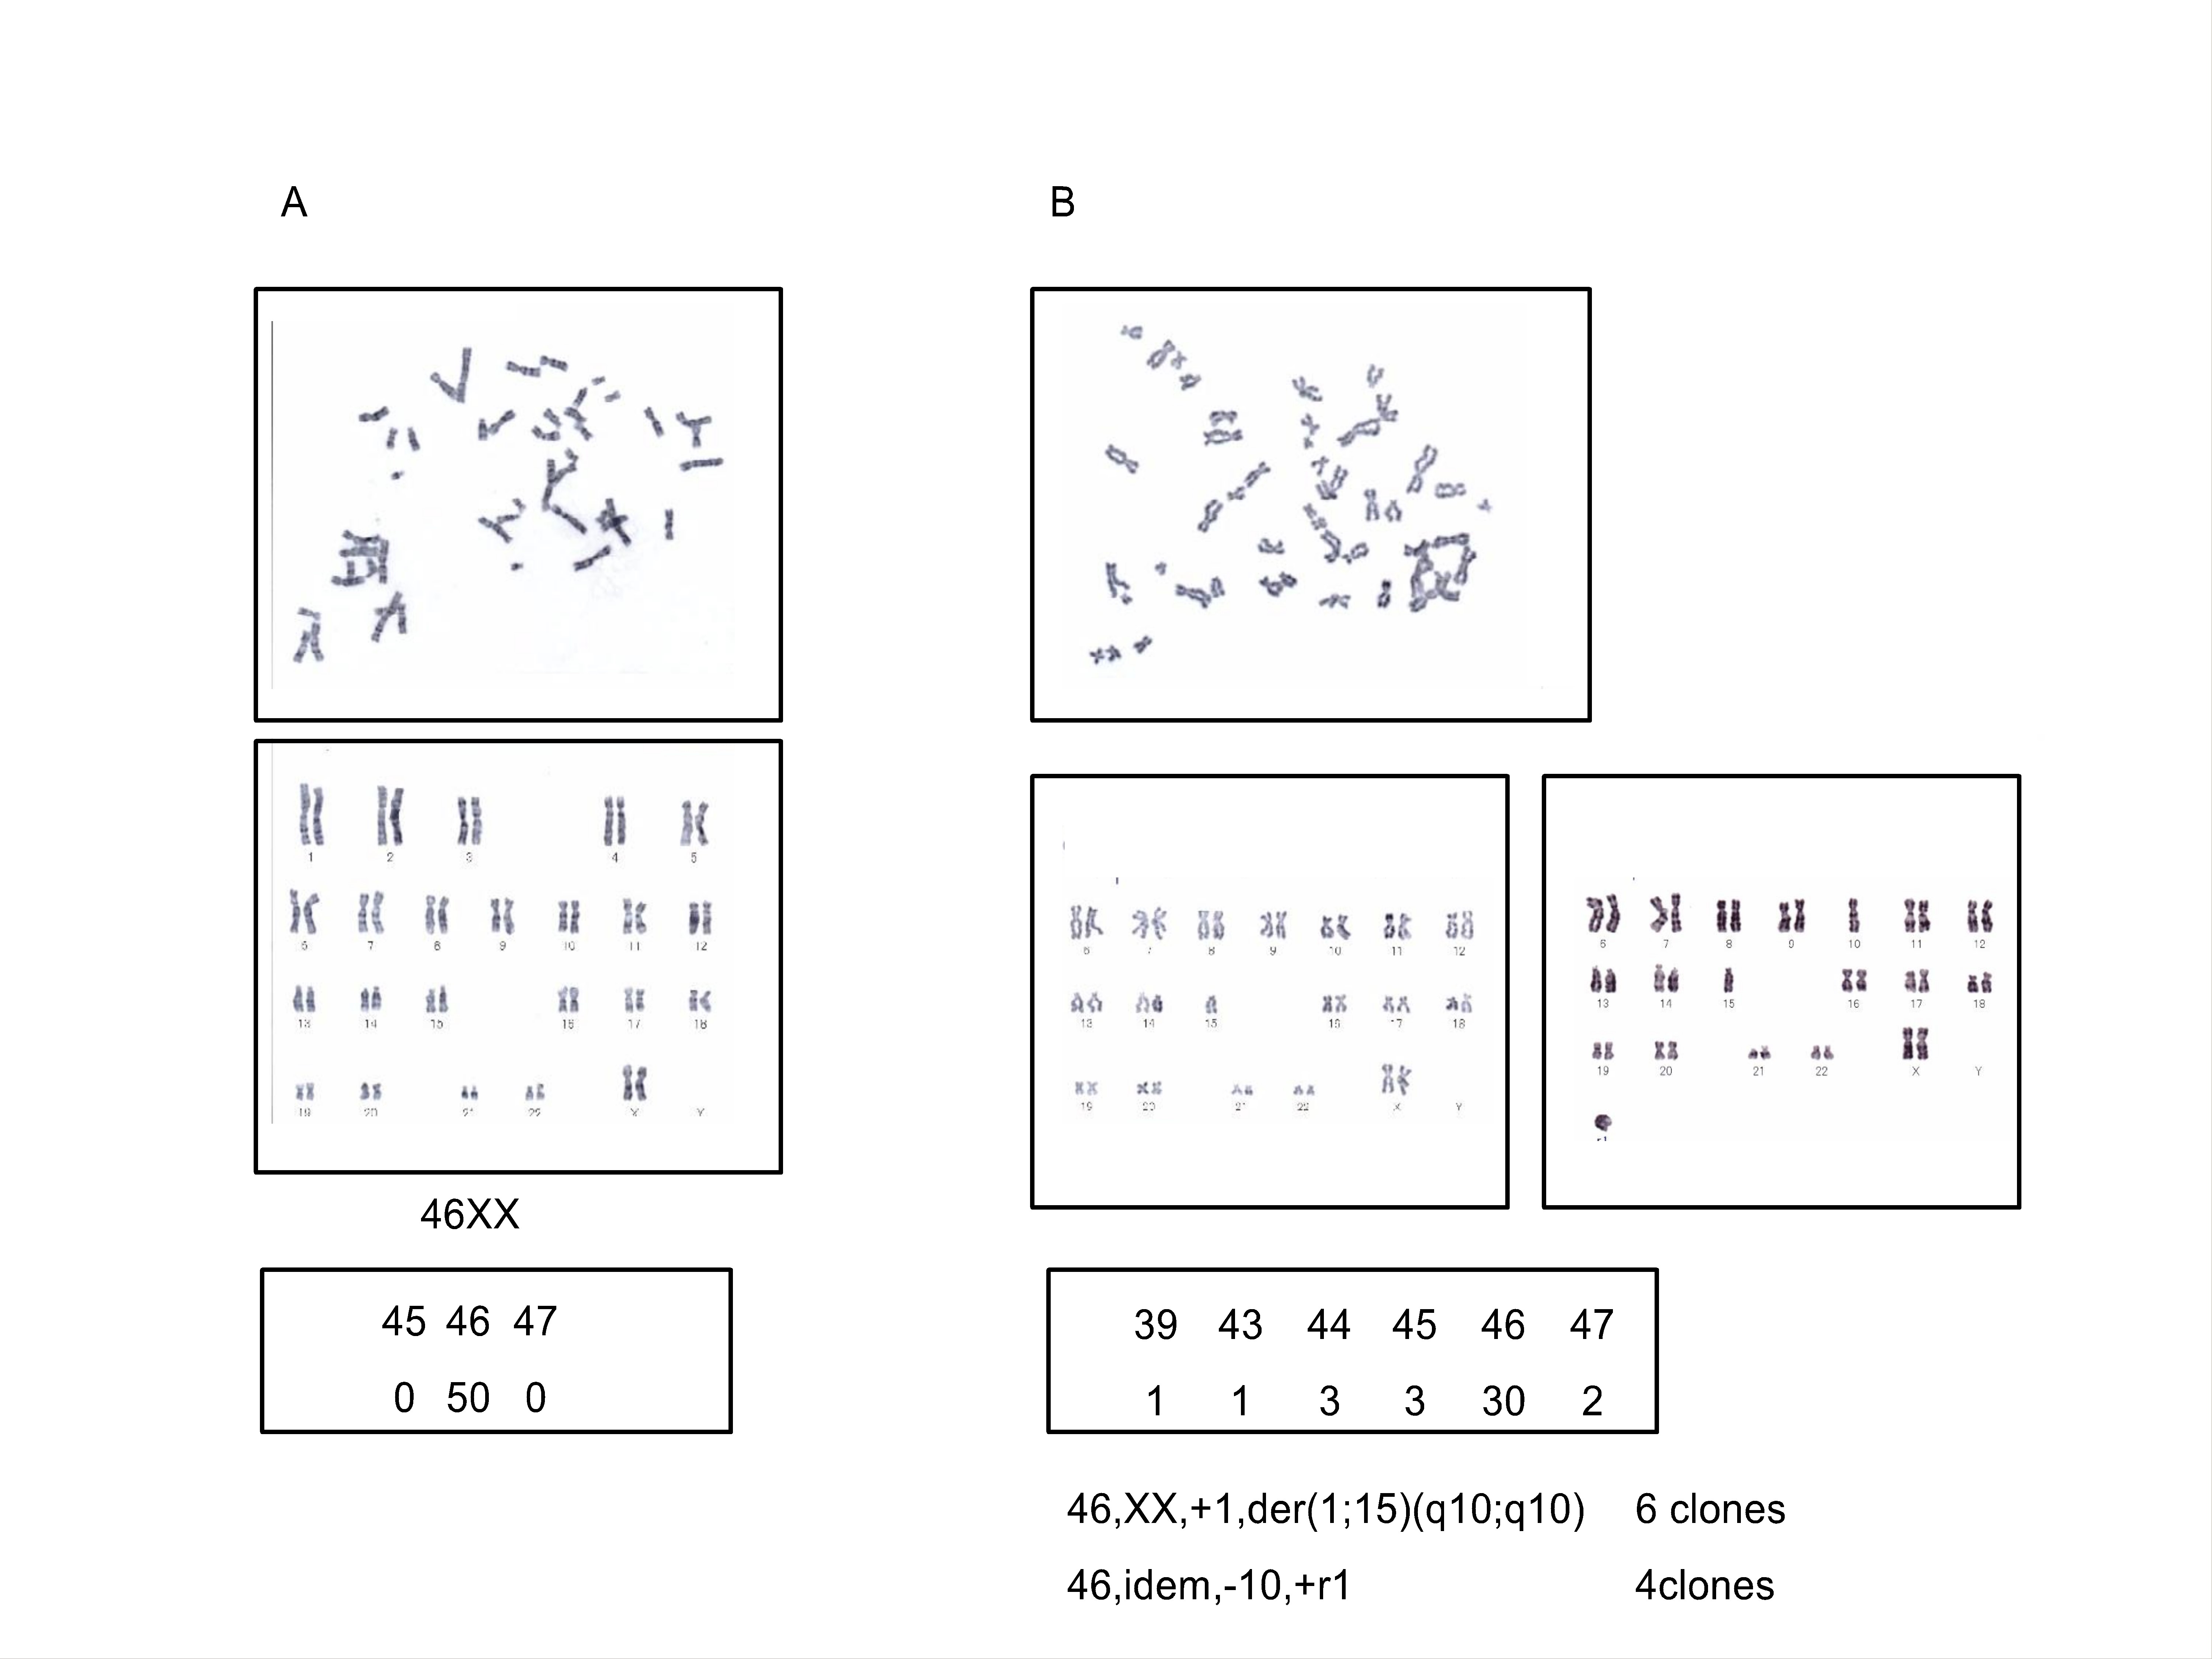
Because of the extraordinarily long culture period, the karyotype of hMSC17 was analyzed using the standard G-band method, and several samples from the GI and NI groups were also analyzed. No chromosomal aberrations were detected in samples from the GI and NI groups (data not shown). The chromosomal structure was also normal in hMSC17 at early passage (PD10) (supplemental online Fig. 3A). Cells of the same strain at the later passage (PD54), however, showed a number of numerical and structural aberrations including two clonal aberrations with the same reciprocal translocation (supplemental online Fig. 3B). Therefore, both epigenetic and genetic abnormalities existed in the late passage cells of hMSC17, which might be responsible for the prolonged culture of this strain.
Discussion
Unlimited self-renewal ability is a hallmark of embryonic stem cells, providing the potential to differentiate into cells of any type [33]. In the case of tissue stem cells including MSCs, however, the potential to proliferate is restricted in the Hayflick model of cellular aging. The molecular mechanism for inducing senescence in vitro has been extensively investigated, and recent reports suggested a cell specificity-dependent mechanism [33]. In this study, we have demonstrated that telomere length and p16INK4A expression are involved in different phases of cellular senescence in hMSC.
In human MSCs, telomerase activity was not detected [26, 34]. The mean telomere restriction fragment length in primary hMSCs was 9.4 ± 1.0 kb for early passage and 7.5 ± 0.6 kb for late passage cells, and the mean telomere shortening rate was 109 ± 43 bp (Fig. 2), which is close to the theoretical length of shortening in each DNA replication, suggesting that there is no mechanism to maintain telomere length in hMSCs. Therefore, it is rational that the initial mTRFL correlated well with the replicative capacity of hMSCs (r = .677, Fig. 2C). hMSCs transduced with the human telomerase gene hTERT exhibit a prolonged replicative capacity, evidence that the integrity of the telomere plays a vital role in regulating replicative capacity in vitro [26, 35]. However, the shortening of telomeres is not the sole factor inducing cellular senescence in hMSCs, and our current results indicated that the upregulation of the p16INK4A gene expression plays an essential role in this process. This may be relevant to our previous data that the introduction of hTERT was not sufficient to immortalize hMSC, and that the inactivation of the function of p16 either by the HPVE6/E7 or BMI1 genes was required [26, 36].
The relationship between growth capacity and donor age is not clear. Clearly, the hMSC strains isolated from younger donors on the average exhibited a longer life span in vitro (Fig. 1D, 1E), and the initial mTRFL correlated with the life span. There was, however, no clear relationship between the initial mTRFL and donor age (Fig. 2). Also, the expression profile of p16INK4A was not correlated with donor age. These issues should be further analyzed in detail.
p16INK4A is known as a biomarker of aging. This cell cycle regulator is not expressed in undifferentiated hESCs [37]. In mouse HSCs and NSCs, the expression of p16INK4A was repressed by the PcG protein BMI1 [15]. But in later life, this PcG protein failed to repress the expression of p16INK4A and the function of HSCs and NSCs declined [14, 15]. In the current study, BMI1 was expressed at the mRNA and protein levels in all the hMSC strains (Fig. 6). In some strains, the expression of BMI1 was negatively correlated with the expression of p16INK4A (Fig. 6B, 6C). The relationship between these two molecules in hMSCs remained to be investigated. The expression of p16INK4A was increased toward senescence (Fig. 3), and senescent cells expressed p16INK4A. The downregulation of p16INK4A expression resulted in escape from senescence and a restoration of the proliferating activity (Fig. 5). These results suggest that most hMSCs do not have a mechanism to repress the expression of p16INK4A in vitro.
We found three types of passage-dependent change of the p16 gene expression during in vitro life of hMSCs of which two were associated with the methylation-induced suppression. No clear differences were found among three groups in clinical characters of donors, and the procedures for the isolation and expansion of hMSCs were the same in all cases. Subtle changes in the culture condition such as the initial density, the concentration of CO2, and the timing of passage may influence the development of the methylation, which will be an important issue to be further investigated.
As far as we know, this is the first report to demonstrate the methylation of p16INK4A in hMSCs. This phenomenon was observed in 4 of 29 strains (13.8%), which is above the negligible frequency (Fig. 6, supplemental online Table 1). Methylation of the p16INK4A gene in normal cells in vitro is reported in the case of human mammary epithelial cells showing a prolonged life span in vitro [20]. In many cases, however, this phenomenon is seen in cancer cells [38].
A line of evidence has indicated a tight association between the inactivation of p16INK4A and transformation of hMSCs. The hMSCs immortalized with hTERT showed spontaneous transformation in vitro in association with the deletion of the p16INK4A gene and activation of the K-ras gene [39]. The hMSC strain transformed spontaneously in vitro lacked expression of the p16INK4A gene [24]. The BMI1-transduced immortalized hMSCs, which showed no detectable p16INK4A gene expression, became fully transformed after the introduction of an activated H-ras gene [36]. In this study, one case with an inactivated p16INK4A gene by DNA methylation (hMSC17) showed a prolonged life span (334 days in culture with a final PD of 54) in vitro far longer than the average (151 days and 28 PD) (Fig. 6Bb). Although no apparent phenotype of transformed cells was observed in this strain, and the growth ceased with telomere shortening, the association of chromosomal aberrations (supplemental online Fig. 3) may be considered a sign of pretransformation as reported in human and murine MSC cases [24, 40, 41]. This point should be seriously considered in the clinical use of hMSCs, particularly in cases requiring prolonged and extensive in vitro expansion. Monitoring of the DNA methylation of the p16INK4A gene will serve as surveillance for the transformation of hMSCs.
Acknowledgements
The authors thank Drs. Tohru Kiyono, Koichi Nishijo, Satoshi Teramukai, and Tatsuya Ishibe for advice and Drs. Takeshi Sakamoto and Hiromu Ito for clinical samples. This work was supported by the New Energy and Industrial Technology Development Organization (NEDO), with a project entitled Development of Evaluation Technology for Early Introduction of Regenerative Medicine, and also by Grants-in-aid for Scientific Research from the Japan Society for the Promotion of Science, from the Ministry of Education, Culture, Sports, Science, and Technology, and from the Ministry of Health, Labor, and Welfare.
Disclosure of Potential Conflicts of Interest
The authors indicate no potential conflicts of interest.
