Abstracts
This study evaluates the diagnostic value of morphometric magnetic resonance imaging (MRI) in the differential diagnosis among Parkinson's disease (PD), progressive supranuclear palsy (PSP) and multiple system atrophy (MSA). We studied 21 PD cases, 11 MSA-c, 8 MSA-p and 20 PSP cases. Midbrain area (Ams), pons area (Apn), middle cerebellar peduncle (MCP) and superior cerebellar peduncle (SCP) were measured using MRI. Comparisons were made between PD, MSA-p, MSA-c and PSP. Apn, MCP and SCP morphometry dimensions presented differences among groups. Ams below 105 mm² and SCP smaller than 3 mmwere the most predictive measures of PSP (sensitivity 95.0 and 80.0%, respectively). For the group of MSA-c patients, Apn area below 315 mm² showed good specificity and positive predictive value (93.8% and 72.7%, respectively). In conclusion, dimensions and cut off values obtained from routine MRI can differentiate between PD, PSP and MSA-c with good sensitivity, specificity and accuracy.
Parkinson; multiple system atrophy; progressive supranuclear palsy; magnetic resonance imaging; pons; midbrain
Morfometria pela ressonância magnética (RM) no diagnóstico diferencial entre doença de Parkinson (DP), paralisia supranuclear progressiva (PSP) e atrofia de múltiplos sistemas (AMS). Este estudo avaliou a RM no diagnóstico diferencial de 21 casos com DP, 11 AMS-c, 8 AMS-p e 20 com PSP. A área sagital do mesencéfalo (Ams), área sagital da ponte (Apn), largura do pedúnculo cerebelar médio (PCM) e pedúnculo cerebelar superior (PCS) foram medidas pela RM e realizadas comparações entre destes pacientes. A Ams <105 mm² e a largura média do PCS <3 mm foram preditivas para PSP (sensibilidade de 95,0 e 80,0%, respectivamente). Nos casos de AMS-c a área pontina <315 mm² apresentou boa especificidade e valor preditivo positivo para o diagnóstico (93,8% e 72,7%). Em conclusão, as dimensões e valores de cortes obtidos a partir da RM podem diferenciar PD, PSP e AMS-c, com sensibilidade, especificidade e precisão.
doença de Parkinson; atrofia de múltiplos sistemas; paralisia supranuclear progressiva; ressonância magnética; ponte; mesencéfalo
ARTICLE
Morphometry MRI in the differential diagnosis of parkinsonian syndromes
Morfometria por ressonância magnética no diagnóstico diferencial das síndromes parkinsonianas
Rômulo L. GamaI; Daniel F.G. TávoraI; Rodrigo C. BomfimI; Cruiff E. SilvaII; Veralice M. de BruinIII; Pedro F. de BruinIII
IDepartment of Radiology, Sarah Network of Hospitals for Rehabilitation, Fortaleza CE, Brazil
IIDepartment of Statistics, Sarah Network of Hospitals for Rehabilitation, Fortaleza CE, Brazil
IIIDepartment of Medicine, Federal University of Ceará, Fortaleza CE, Brazil
Correspondence Correspondence: Rômulo Lopes Gama Av. Presidente Juscelino Kubitschek 4500 60861-630 Fortaleza CE - Brasil E-mail: romuloggama@gmail.com
ABSTRACT
This study evaluates the diagnostic value of morphometric magnetic resonance imaging (MRI) in the differential diagnosis among Parkinson's disease (PD), progressive supranuclear palsy (PSP) and multiple system atrophy (MSA). We studied 21 PD cases, 11 MSA-c, 8 MSA-p and 20 PSP cases. Midbrain area (Ams), pons area (Apn), middle cerebellar peduncle (MCP) and superior cerebellar peduncle (SCP) were measured using MRI. Comparisons were made between PD, MSA-p, MSA-c and PSP. Apn, MCP and SCP morphometry dimensions presented differences among groups. Ams below 105 mm2 and SCP smaller than 3 mmwere the most predictive measures of PSP (sensitivity 95.0 and 80.0%, respectively). For the group of MSA-c patients, Apn area below 315 mm2 showed good specificity and positive predictive value (93.8% and 72.7%, respectively). In conclusion, dimensions and cut off values obtained from routine MRI can differentiate between PD, PSP and MSA-c with good sensitivity, specificity and accuracy.
Key words: Parkinson, multiple system atrophy, progressive supranuclear palsy, magnetic resonance imaging, pons, midbrain.
RESUMO
Morfometria pela ressonância magnética (RM) no diagnóstico diferencial entre doença de Parkinson (DP), paralisia supranuclear progressiva (PSP) e atrofia de múltiplos sistemas (AMS). Este estudo avaliou a RM no diagnóstico diferencial de 21 casos com DP, 11 AMS-c, 8 AMS-p e 20 com PSP. A área sagital do mesencéfalo (Ams), área sagital da ponte (Apn), largura do pedúnculo cerebelar médio (PCM) e pedúnculo cerebelar superior (PCS) foram medidas pela RM e realizadas comparações entre destes pacientes. A Ams <105 mm2 e a largura média do PCS <3 mm foram preditivas para PSP (sensibilidade de 95,0 e 80,0%, respectivamente). Nos casos de AMS-c a área pontina <315 mm2 apresentou boa especificidade e valor preditivo positivo para o diagnóstico (93,8% e 72,7%). Em conclusão, as dimensões e valores de cortes obtidos a partir da RM podem diferenciar PD, PSP e AMS-c, com sensibilidade, especificidade e precisão.
Palavras-chave: doença de Parkinson, atrofia de múltiplos sistemas, paralisia supranuclear progressiva, ressonância magnética, ponte, mesencéfalo.
The clinical recognition among the various parkinsonian syndromes cannot always be made with accuracy. Some characteristic clinical features are useful in the differential diagnosis.
Parkinson's disease (PD) can be clinically identified by the presence of bradykinesia, rigidity, tremor and postural instability with asymmetry of symptoms and good response to levodopa1,2. Progressive supranuclear palsy (PSP) manifests with early and severe postural instability, with falls in the first year of onset, supranuclear gaze palsy and slowing of vertical saccades. Other characteristics include fast rate of disease progression and poor response to levodopa1,2.Multiple system atrophy (MSA) is usually associated with fast rate of disease progression, autonomic dysfunction, cerebellar signs and upper motor neuron signs3. In MSA cases, patients have been classified as MSA-c or MSA-p depending on the predominance of cerebellar ataxia or parkinsonian features, with dysautonomia being a constant feature in both subtypes4. In spite of these suggestive features, in many cases, all these clinical findings are not as clear cut as it ideally could be and a great deal of overlap exists.
In this context, biological markers can be of utility for the differential diagnosis of these movement disorders. Previously, conventional magnetic resonance imaging (MRI) revealed important characteristic findings that can be used in clinical practice to differentiate among parkinsonian syndromes5.Objective quantifications of midbrain and pons using linear, surface and volumetric measurements have been reported before6-10. In these studies, two-point comparisons were made correlating each parkinsonian syndrome and PD. However, multiple comparisons including cases of PD, PSP and MSA-c and MSA-p have not been performed.
We hypothesized that morphometry MRI can be used clinically to distinguish among PD, PSP, MSA-c and MSA-p with good sensitivity, specificity and accuracy. The aim of this study was to evaluate the diagnostic value of structural anatomic changes identified by MRI and propose MRI-based criteria to help the clinician to recognize these parkinsonian syndromes.
METHOD
Patients
This is a cross-sectional study of sequential patients with clinical diagnosis of PD, PSP or MSA. Twenty-one consecutive patients with a clinical diagnosis of PD, defined according to the United Kingdom PD Brain criteria11, 11 consecutive patients with MSA-c, eight patients with MSA-p, according to MSA consensus3, and 20 patients with clinical criteria for PSP2 were examined. All patients were clinically evaluated by a neurologist and submitted to brain MRI. Cases with previous history of stroke, trauma, and signs of cerebrovascular pathology, brain tumor or severe unrelated neurological or physical disease were excluded. This study was approved by the Ethics Research Committee of the Sarah Network of Hospitals of Rehabilitation and written informed consent was obtained from all patients.
Magnetic resonance imaging protocol
MRI was performed with a high-field MR equipment Horizon Signa 1.5-T scanner (General Electric®, Milwaukee, USA), using a standard head coil. All MR imaging examinations included sagittal T1-weighted spin echo (SE), transverse T2-weighted fast spin echo (FSE), transverse fluid-attenuated inversion-recovery (FLAIR), transverse T2-weighted gradient-echo (GR), coronal T2-weighted FSE and T1-weighted volumetric spoiled gradient-echo (SPGR) sequences.
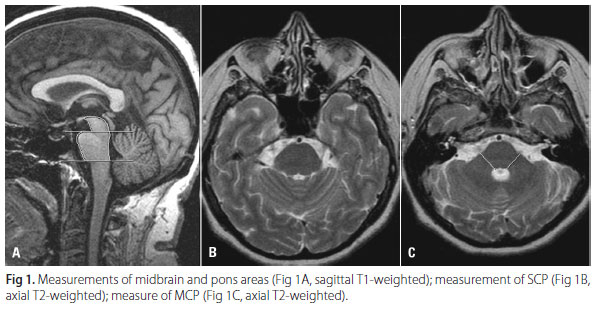
The mid-sagittal image of the T1-weighted SE sequence was used for measurements of the midbrain area (Ams) and pons area (Apn)12-14 (Fig 1). These areas were obtained according to the following parameters: two straight lines were drawn. The first line was drawn so as to pass through the superior pontine notch and the inferior edge of the quadrigeminal plate. The second line was drawn parallel to the first line so as to pass through the inferior pontine notch. The area of the midbrain was traced plotting the delta-shaped part above the first line. The area of the pons was traced as the area between the ventral margin of the pons, the dorsal margin of the pons, first and second lines. The transverse T2-weighted FSE sequence was used for the measurement of the diameter of the superior cerebellar peduncles (SCP) and middle cerebellar peduncles (MCP) (Fig 1). The linear distances between the right and left borders of the SCP and MCP were measured, delimited by the peripeduncular cerebrospinal fluid spaces of the pontocerebellar cisterns. Each SCP and MCP width (left and right) was measured, and a mean value for the two SCP and MCP was calculated. All measurements were performed using a workstation (GE Radworks 5.1).
Conventional brain MRI of MSA and PD patients were analyzed for the presence of putaminal atrophy, putaminal hypointensity, slitlike hyperintensity in the posterolateral margin of the putamen, hyperintensity of the MCP, and cruciform hyperintensity of the pons (Fig 2).
Statistical analysis
Results are given as means±standard deviation (SD) or as median values. In order to identify possible confounding variables, we used the chi-square in contingency tables, ANOVA, Tukey post test, and Student's t-test. For non-symmetric variables distribution, we used the Kruskall-Wallis; Mann-Whitney test and Bonferroni corrections when appropriate. In order to evaluate intraobserver agreement, the same operator performed all measurements twice in different days. They were also performed by two different operators and the interobserver agreement was calculated. The Cronbach's Alpha coefficient was used to evaluate the consistency of inter and intraobserver variability. Multiple logistic regressions were used to determine measures that were predictors of diagnosis.
After the determination of variables that were significant predictors, a Receiver Operating Characteristic (ROC) curve was built and took as reference the standard clinical diagnosis. A cut-off point for the differentiation between groups was determined by the ROC curve. Statistical analysis was performed with the Statistic Package for Social Sciences (SPSS-13) software for Windows.
The level of significance was set at p<0.05.
For differentiation between MSA-c and MSA-p using imaging findings, we used the chi-square test, or Fisher's exact test when indicated.
RESULTS
Twenty-one cases with clinical diagnosis of PD (12 female, mean age=62.1±11.06, disease duration=6.0±3.66), 11 cases with clinical diagnosis of MSA-c (7 female, mean age=59.0±6.00, disease duration=3.9±1.62), eight MSA-p (five female, mean age 61.2±4.79; disease duration 5.0±3.2) and 20 cases with clinical diagnosis of PSP (13 female, mean age=70.4±7.54, disease duration=5.6±2.28) were studied. In all cases, age varied from 39 to 84 (mean age 64±9). Patients with PSP were significantly (p<0.01) older than those with PD and MSA.
Table 1 depicts values of cerebral and midbrain structures according to clinical diagnosis. All morphometric dimensions were significantly different between groups (p<0.001). Generally, PD patients showed higher values for all measures including the Apn (median 556.6 mm2). This same measure of the pons was observed as the lowest in MSA-c patients (median 303.4 mm2). Half of the MSA-p cases presented Ams value below 117.8 mm2, in opposition to PD cases, that showed the higher values (median 154.8 mm2). The analysis of MCP dimensions showed that MSA-c and PD cases had the lowest and the highest median values (9.7 mm and 17.1 mm, respectively). The analysis of SCP dimensions showed that PSP and PD cases had the lowest and the highest median values (2.0 mm and 3.7 mm, respectively).
Measurements comparisons among groups are represented in Table 2. All values of PD cases were significantly higher than PSP cases. Except for Ams, this was also true in relation to MSA-c (p<0.01). Cases with PD presented lower values of Apn, Ams and MCP in relation to MSA-p cases. All comparisons between morphometric dimensions of PSP and MSA-c were significantly different (p<0.01). The majority of the measures, with the exception of MCP, were significantly different between cases with PSP and MSA-p (p<0.01). Most of the measured structures from cases with MSA-c and MSA-p did not differ. However, values of Ams was significantly different (p<0.05).
Logistic regression analysis represented in Table 3 showed that in PD cases all values were useful (p<0.01). In PSP, the Ams and SCP values significantly predicted the diagnosis (p<0.01). In MSA-c cases, the Apn, Ams and MCP measures were significantly different (p<0.05). In MSA-p cases none of the results were significant.
To differentiate between PD and other parkinsonian syndromes, Apn value over 477 mm2 showed the highest sensitivity value (80.0%), with good specificity (97.1%). The cutoff point of Ams was determined to be 133 mm2, with sensitivity of 65.5% and specificity of 93.5%. MCP and SCP cut off values showed negative predictive values of 79.5% and 74.4%, respectively.
The midbrain results most predictive of PSP were Ams and SCP. An Ams measure below 105 mm2 and SCP less than 3 mmshowed a major probability for the diagnosis of PSP with a sensitivity of 95.0 and 80.0%, respectively. The cutoff point of Ams was the best measure for PSP diagnosis with a probability of false negative of 2.5% and positive and negative predictive values of 95.0 and 97.5%, respectively.
For the group of MSA-c patients, a cutoff point of Ams >105 mm2 showed high specificity (100%) and a negative predictive value of 80.8%. An Apn value below 315 mm2 showed a positive predictive value of 72.7%. MCP measure <12 mm showed sensitivity and specificity (66.7% and 97.8%, respectively) to differentiate between MSA-c and all other diagnosis, and positive and negative predictive value of 90.9% and 89.8%, respectively.
Among MSA-p cases, four (50%) had cruciform hyperintensity, five (62.5%) had slitlike hyperintensity of the posterolateral margin of the putamen, six (75%) had atrophy of the putamen, seven (87.5%) had putaminal hypointensity, and five (62.5%) had hyperintensity of the MCP. These results were significantly different (p<0.05) from MSA-c cases. MSA-p cases showed more frequently hyperintensity of the posterolateral margin of the putamen, putaminal hypointensity and putaminal atrophy. MSA-c cases showed more frequently cruciform hyperintensity and hyperintensity of the MCP. One PD case showed slitlike hyperintensity of the posterolateral margin of the putamen, a second showed putaminal hypointensity and a third had both of these alterations.
DISCUSSION
Our data show that several MRI-derived brain measures may be useful for the differential diagnosis of the parkinsonian syndromes. Multiple comparisons were made among PD, MSA-p, MSA-c and PSP and demonstrated that Apn, Ams, MCP and SCP morphometric measurements have clear cut differences. These morphometric parameters were capable of accurately differentiating among these syndromes with good sensitivity and specificity. Of interest, we demonstrate that several cutoff points can be used to distinguish cases of PD, PSP and MSA-c. A sagittal midbrainarea <105 mm> 2 indicates the diagnosis ofPSPand a pons sagittal measure <315 mm2 indicates the diagnosis ofMSA-c with good sensitivity and specificity.
The most crucial measure differentiating PSP from PD, MSA-c and MSA-p was the Ams (median value 82.1 mm2). This is in agreement with other reports7. Also, in agreement with previous studies, we showed that SCP width was significantly reduced in PSP patients (p<0.01) and a cut off <3.0 mm demonstrated good sensibility and specificity (80% and 100%, respectively)12. We suggest a cut off of Ams <105 mm2, with good sensitivity and specificity (95% and 97.5%, respectively). In our study, the established cut off was higher than in other studies13. We postulate that this finding may contribute to identify suspected cases precociously; a higher cut-off or the identification of cases with less midbrain atrophy and early disease can be more useful for prompt diagnosis. In another study, a lower cut-off was found and this could potentially be a limitation such as the diagnosis would be restricted to cases with more advanced illness. It is worth pointing that we used similar parameters of measurement and our cases were of similar age and had similar disease duration comparing to previous reports.
Due to scarcity of data, the value of conventional MRI in early stages of these diseases, when the clinical diagnosis is even more uncertain, remain undetermined. Studies assessing morphometric parameters of midbrain, pons and middle and superior cerebellar peduncles at earlier stages of disease remain to be done and could be valuable, not only for the diagnosis, but also for supplementary assessment of disease progression.
In agreement with previous findings, PSP cases showed SCP values significantly different from PD, MSA-c and MSA-p10. Morphometric values of the middle cerebelar peduncles had the greatest practical value. They can be measured in a standard axial sequence as the width of the MCP at the level of the trigeminal nerve, tracing a line perpendicular to its longer axis. This measure failed only to differentiate between cases of MSA-c and MSA-p.
According to our results in MSA-c, most of the morphometric data did not show significant differences from MSA-p cases. The only exception was the midbrain area that was significantly different, with MSA-c showing lower values than MSA-p (p<0.01). In MSA-p cases, the measurements performed were not statistically satisfactory to differentiate from other parkinsonian patients, which is compatible with other studies15-17. Thus, MRI measures did not contribute for the differential diagnosis between MSA-c and other parkinsonian syndromes. Cases with both MSA-p and MSA-c presented abnormalities in conventional MRI that may contribute for an accurate diagnosis. The presence of cruciform hyperintensity, slitlike hyperintensity and hyperintensity of the MCP are very suggestive of MSA-c. Moreover, slitlike hyperintensity of the posterolateral margin of the putamen, putaminal hypointensity and atrophy of the putamen indicate the diagnosis of MSA-p. One important consideration is that some of these alterations are not promptly recognized in everyday medical care. More importantly, and in agreement with our findings, some PD cases present similar findings, adding difficulty to the diagnosis.
Some important aspects about the use of MRI in parkinsonian syndromes must be considered. For instance, in Parkinson's disease, diagnosis can frequently be assumed on clinical basis only and the overall ability for routine MRI to differentiate patients with PD from controls is modest. Thus, the major relevance of certain MRI findings is to discriminate among other parkinsonian disorders14-16. Other relevant consideration is the fact that the linear and morphometric measures employed here can be easily performed. More importantly, these measures were obtained by routine MRI and can be incorporated in everyday practice. Linear measures of the middle and superior cerebelar peduncles and simple sagittal measures of midbrain and pons areas can be easily obtained from routine MRI. Thus, these objective measures of the midbrain, pons and middle and superior cerebellar peduncles can be reproduced and compared.
There were some limitations to this study considering that the differentiation of these clinical entities may be challenging, particularly in the early stages of the illness. We used clinical criteria for the diagnosis of the diseases which are accepted in the absence of anatomopathological studies.
In conclusion, we demonstrate that measurements and cut off values obtained from routine MRI can differentiate among PD, PSP and MSA-c with good sensitivity, specificity and accuracy with data potentially applicable to our population. According to MRI results, the differential diagnosis between MSA-c and MSA-p remains a challenge. We suggest that the combination of morphological and conventional analyses could contribute for the differential diagnosis between MSA-c and MSA-p.
Received 11 November 2009
Received in final form 17 December 2009
Accepted 28 December 2009
- 1. Litvan I, Agid Y, Calne D, et al. Clinical research criteria for the diagnosis of progressive supranuclear palsy (Steele-Richardson-Olszewski syndrome): report of the NINDS-SPSP international workshop. Neurology 1996;47:1-9.
- 2. de Bruin VM, Lees AJ. Subcortical neurofibrillary degeneration presenting as Steele Richardson-Olszewski and other related syndromes: a review of 90 pathologically verified cases. Mov Disord 1994;9:381-389.
- 3. Gilman S, Wenning GK, Low PA, et al. Second consensus statement on the diagnosis of multiple system atrophy. Neurology 2008;71:670-676.
- 4. Bhidayasiri R, Ling H. Multiple system atrophy. Neurologist 2008;14:224-237.
- 5. Schrag A, Good CD, Miszkiel K, et al. Differentiation of atypical parkinsonian syndromes with routine MRI. Neurology 2000;54:697-702.
- 6. Cosottini M, Ceravolo R, Faggioni L, et al. Assessment of midbrain atrophy in patients with progressive supranuclear palsy with routine magnetic resonance imaging. Acta Neurol Scand 2007;116:37-42.
- 7. Nicoletti G, Fera F, Condino F, et al. MR imaging of middle cerebellar peduncle width: differentiation of multiple system atrophy from Parkinson's disease. Radiology 2006;239:825-830.
- 8. Paviour DC, Price SL, Jahanshahi M, et al. Longitudinal MRI in progressive supranuclear palsy and multiple system atrophy: rates and regions of atrophy. Brain 2006;129:1040-1049.
- 9. Righini A, Antonini A, De Notaris R, et al. MR imaging of the superior profile of the midbrain: differential diagnosis between progressive supranuclear palsy and Parkinson disease. AJNR Am J Neuroradiol 2004;25:927-932.
- 10. Paviour DC, Price SL, Stevens JM, et al. Quantitative MRI measurement of superior cerebellar peduncle in progressive supranuclear palsy. Neurology 2005;64:675-679.
- 11. Hughes AJ, Ben Shlomo Y, Daniel SE, et al. What features improve the accuracy of clinical diagnosis in Parkinson's disease: a clinicopathologic study. 1992. Neurology 2001;57:S34-S38.
- 12. Oba H, Yagishita A, Terada H, et al. New and reliable MRI diagnosis for progressive supranuclear palsy. Neurology 2005;64: 2050-2055.
- 13. Quattrone A, Nicoletti G, Messina D, et al. MR imaging index for differentiation of progressive supranuclear palsy from Parkinson's disease and the Parkinson variant of multiple system atrophy. Radiology 2008;246:214-221.
- 14. Asato R, Akiguchi I, Masunaga S, et al. Magnetic resonance imaging distinguishes progressive supranuclear palsy from multiple system atrophy. J Neural Transm 2000;107:1427-1436.
- 15. Yekhlef F, Ballan G, Macia F, et al. Routine MRI for the differential diagnosis of Parkinson's disease, MSA, PSP, and CBD. J Neural Transm 2003;110:151-169.
- 16. Seppi K, Schocke MF, Wenning GK, et al. How to diagnose MSA early: the role of magnetic resonance imaging. J Neural Transm 2005;112:1625-1634.
- 17. Bhattacharya K, Saadia D, Eisenkraft B, et al Brain magnetic resonance imaging in multiple system atrophy and parkinson disease. Arch Neurol 2002; 59:835-842.
Publication Dates
-
Publication in this collection
24 June 2010 -
Date of issue
June 2010
History
-
Received
11 Nov 2009 -
Accepted
28 Dec 2009 -
Reviewed
17 Dec 2009