
ABSTRACT:
Olive is one of the strategic products of Guilan province, northern Iran. Hence, it is very important to determine the optimal production pattern of olive, given the resources scarcity and the assessment of physical and Comparative Advantage (CA). In this study, three physical advantage indices for olive production in Guilan province during 2008-2016 were investigated. Also, the CA, protection and competitiveness indicators of olive production at Guilan province for 2016-17 cultivation years were calculated using the Policy Analysis Matrix (PAM). Results showed that Guilan province had scale advantage in olive production. The highest degree of olive plantation concentration was on 2008 with scale advantage index of 2.49. Also, results of efficiency advantage showed that, except for 2008, olive production had efficiency advantage over all under study years at Guilan province. Results of Domestic Resource Costs (DRC) and Social Cost Benefit ratio (SCB) indicators for both traditional and commercial olive plantations revealed the CA of olive production in Guilan province. Also, the competitiveness indices values (UCd and UCx) for both traditional and commercial olive plantations were less than 1. So, the olive production systems in Guilan province had the ability to compete with domestic and international competitors.
Key words:
comparative advantages; competitiveness; protections; olive; Iran
RESUMO:
A olivicultura é uma produção estratégica da província de Guilan, no Norte do Irã. Por isso, é muito importante determinar o padrão ótimo de produção olivícola, dada a escassez de recursos e a avaliação da vantagem física e comparativa. Neste estudo, foram investigados três índices de vantagem física para a produção olivícola na província de Guilan, durante o período de 2008 a 2016. Além disso, foram calculados os índices de vantagem comparativa, proteção e competitividade da produção olivícola, na província de Guilan, para os anos de agrícolas de 2016 e 2017, usando a Matriz de Análise de Políticas (PAM). Os resultados mostraram que a província de Guilan tinha vantagem de escala na produção olivícola. O maior grau de concentração de olival em 2008 com um índice de vantagem de escala de 2,49. Além disso, os resultados da vantagem de eficiência mostraram que, com exceção de 2008, a produção de azeitona teve vantagem de eficiência em todos os anos em estudo de Guilan. Os resultados dos índices dos Custos dos Recursos Internos (RDC) e do Rácio Custo Social (SCB) para os olivais tradicionais e comerciais revelaram a vantagem comparativa da produção olivícola na província de Guilan. Além disso, os valores de índices de competitividade (UCd e UCx) para olivais tradicionais e comerciais eram inferiores a 1. Assim, os sistemas de produção olivícola na província de Guilan tinham a capacidade de competir com concorrentes nacionais e internacionais.
Palavras-chave:
vantagens comparativas; competitividade; protecionismo; Olivicultura; Irã
INTRODUCTION:
Iran is among the 24 countries with significant olive production (FAO, 2018FAO. FAOSTAT Database. Available from: <Available from: http://www.fao.org/faostat
>. 2018. Accessed: Aug. 12, 2018.
http://www.fao.org/faostat...
). In Iran, the most important olive production centers are Fars, Zanjan, Guilan, Qazvin and Kermanshah provinces. Olive is an important part of agriculture in Guilan province, especially in Rudbar County. This region is located in the southernmost point of Guilan province and on the path of the permanent winds of the White River valley, known as Manjil Winds. Native olive cultivars with the highest priority are yellow, oilseed, veal, fescue, marie and bullet. The most important foreign cultivars in Rudbar’s olive orchards include Manzanilla, Arbikin, Kronaeki, Seylana and Amigodal, and have valuable products such as olive oil and soap. Olive orchards in Rudbar County are geographically located in the central part of Rudbar, including the southern Rostam Abad, Rahmat Abad (southern regions of Rahmat Abad, which are located on the edge of the White River River), Manjil, Aliabad plain and Lushan districts, which has Mediterranean climate. Guilan province has 7048 hectares of olive plantations with the average yield of 3 tons per hectare (IRAN’S MINISTRY OF AGRICULTURE JIHAD, 2017IRAN’S MINISTRY OF AGRICULTURE JIHAD. Production and cost of agricultural products database. Available from: <Available from: https://www.maj.ir/
>.2017 Aug. 12, 2018.
https://www.maj.ir/...
). Rudbar County has the largest olive oil processing plants in Iran. There are 10 oil-producing factories with a nominal capacity of 24 thousand tons and more than 100 canning and olive oil packaging workshops with a modern, semi-modern and traditional classification in this county. Over 85% of canned olive and over 90% of olive oil were supply in bulk or unpacked packaging form in Guilan province (INDUSTRY, MINE & TRADE ORGANIZATION OF GUILAN PROVINCE, 2017INDUSTRY, MINE & TRADE ORGANIZATION OF GUILAN PROVINCE. Report of industrial and agricultural productions in Guilan province. 2017.).
Iran is one of the main importers of edible oils in the world. So, the necessity of producing more oilseeds is inevitable. Achievement of self-sufficiency in the oilseeds production should not be limited to increase the level of cultivation, but also solutions to increase the efficiency and productivity of this product. In fact, after gaining efficiency physical advantage in a region, increasing the level of cultivation has a rational and economic justification.
Proper policy making, planning and optimal production of olive in Iran seems to be necessary. Study the Comparative Advantage (CA), supportive and competitiveness indices for products like olive can determine the components for future planning on the self-sufficiency of oilseeds, as well as the framework for markets supports and planning. The CA principle can draw a region crop pattern and optimally allocate resources to all activities. Therefore, we can determine the production and exporting capabilities and prepare the situation for the effective investments (ESHRAGHI SAMANI & POURSAEED, 2015ESHRAGHI SAMANI, R.; POURSAEED, A. Cropping pattern and CA of agricultural products in Ilam province. International Journal of Agricultural Economics and Development, v.5, n.3, p.235-243, 2015. Available from: <Available from: http://ijamad.iaurasht.ac.ir/article_515631.html
>. Accessed: Jun. 15, 2015. doi: 10.5455/ijamd.175988.
http://ijamad.iaurasht.ac.ir/article_515...
).
Several studies have been conducted on the comparative and physical advantages. Different methodologies have been used to determine the CA, such as Policy Analysis Matrix (PAM), CA indices and mathematical programming (ABEDI et al., 2011ABEDI, S. et al. Determining CAs of corn in optimal cultivation patter. International Journal of Agricultural Economics and Development, v.1, n.4, p.197-206, 2011. Available from: <Available from: http://ijamad.iaurasht.ac.ir/article_514166.html
>. Accessed: Aug. 12, 2018.
http://ijamad.iaurasht.ac.ir/article_514...
). ZHONG et al. (2002ZHONG, F., et al. Regional CA in China’s main grain crops. Adelaide university scientific report. 2002. Available from: <Available from: http:// www. Adelaide. Edu. Au/cies/Cerc/gmp1.Pdf
>. Aug. 12, 2018.
http:// www. Adelaide. Edu. Au/cies/Cerc...
) used physical advantages indices to investigate crops production advantage in different regions of China. Results showed that the advantage of major crops in different regions of China is significantly different and there is a high potential for improving resource allocation and production increase by reallocating resources in different sectors. The PAM is so prevalent to estimate the CAs indices and also to analyze the social benefit-cost of different agricultural crops (SANDERSON & AHMADI-ESFAHANI, 2009SANDERSON, T.; AHMADI-ESFAHANI, F. Testing CA in Australian broad acre agriculture under climate change: Theoretical and Empirical Models. Economic papers, v.28, n.4, p.346-354, 2009. Available from: <Available from: https://onlinelibrary.wiley.com/doi/10.1111/j.1759-3441.2010.00043.x
>. Aug. 12, 2018.
https://onlinelibrary.wiley.com/doi/10.1...
; HAJI-RAHIMI, 2014HAJI-RAHIMI, M. CA, self-sufficiency and food security in Iran: case study of wheat commodity. International Journal of Agricultural Economics and Development, v.4, n.3, p.203-210, 2014. Available from: <Available from: http://ijamad.iaurasht.ac.ir/article_513792.html
>. Accessed: Jun. 15, 2015.
http://ijamad.iaurasht.ac.ir/article_513...
). AL ASHKAR (2006AL ASHKAR, H. Olive Oil CAs. Ministry of Agriculture and Agrarian Reform, National Agriculture Policy Center. Working Paper No. 19, With the Support of Project GCP/SYR/006/ITA. 2006. Available from: <Available from: https://www.academia.edu/7146941/Comparative_advantages_of_olive_oil_in_Syria
>. Accessed: Aug. 12, 2018.
https://www.academia.edu/7146941/Compara...
) used the PAM to study the CA of olive oil in Syria. Results showed that the olive oil production system benefits from private prices and has a CA but despite the advantages of olive oil, its exports are still exacerbated. KARBASI et al. (2009KARBASI, A. R., et al. Determining CA of main cultivated production in Kerman. Agricultural Economic and Development, v.17, n.1, p.1-15. 2009. Available from: < Available from: https://www.agri-peri.ir
>. Aug. 12, 2018.
https://www.agri-peri.ir...
) analyzed the CA of main crops in Sistan and Baluchistan province of Iran. Results showed that wheat has no CA. MANE-KAPAJ et al., (2010Mane-Kapaj, A., et al. Assessing the CAs of Albanian olive oil production. International Food and Agribusiness Management Review, v.13, n.1, p.15-26, 2010. Available from: <Available from: https://www.ifama.org/Volume-13-Issue-1
>. Aug. 12, 2018.
https://www.ifama.org/Volume-13-Issue-1...
) investigated the CA of olive oil in Albania using PAM. The results showed that the production of olive oil in Albania is profitable for producers. RAHIMI (2011)RAHIMI, H. Determining olive production CA in compare with other crops at Fars province. Institute of Planning, Agricultural Economics and Rural Development Research, 2011. Available from: < Available from: http://www.agri-peri.ir
>. Aug. 12, 2018.
http://www.agri-peri.ir...
determined the CA of olive compared to other crops in Fars province of Iran. Results showed that olive production in this province had no advantage and producers pay indirect taxes. HATEF et al. (2016HATEF, H., et al. Determining optimal cultivation pattern of major crops in Khorasan Razavi province on the basis of production CA. Agricultural Economics Research, v.8, n.3, p.167-192, 2016. Available from: <Available from: http://jae.miau.ac.ir/article_2078.html
>. Accessed: Jun. 15, 2015.
http://jae.miau.ac.ir/article_2078.html...
) determined the optimal cultivation pattern based on CA in Khorasan Razavi province of Iran. Their results showed that irrigated lentil, beans and corn should be removed from cultivation pattern due to lack of CAs. SOUZA et al. (2017SOUZA, A. R. L. et al. Economics and accounting evaluation of rice milled production chains in Rio Grande do Sul (Brazil) and Uruguay with application of the Policy Analysis Matrix. Ciência Rural, v.47, n.4, p.1-7, 2017. Available from: <Available from: http://www.scielo.br/scielo.php?script=sci_issuetoc&pid=0103-847820170004&lng=en&nrm=iso
>. Aug. 12, 2018.
http://www.scielo.br/scielo.php?script=s...
) used PAM to assess the economic efficiency, competitiveness, and effects of public policies of milled rice chain in Brazil relative to Uruguay. Their results indicated that the chains in both regions were competitive under the existing market and policy conditions. Also revealed CA, transferred a high load of resources to other sectors of the economy, and remunerated the domestic production factors, sufficiently. However, the competitiveness and CA of both regions were not due to the encouraging intervention policies, as both chains pay high taxes.
The main purpose of this study was to analyze the comparative advantages and competitiveness of olive production as well as investigating the impacts of government’s policy on olive producers at Guilan Province, Northern Iran.
MATERIALS AND METHODS:
Physical comparative advantages indicators
In this study, the physical indicators of CA included Physical Advantage Scale (SAI), Efficiency Advantage Index (EAI) and Aggregate Advantages Index (AAI) were studied as comprehensive indicators of physical relative advantage of olive product in Guilan province of Iran. SAI is presented by Eq. (1) (AMIRNEZHAD & RAFIEE, 2010AMIRNEZHAD, H.; RAFIEE, H. Investigation of physical CA of irrigated crops and the affectability of aggregate advantage index from its components in Mazandaran province. Agricultural Economics and Development, v.17, n.3, p.23-46. 2010. Available from: <Available from: http://www.agri-peri.ir
>. Accessed: Aug. 12, 2018.
http://www.agri-peri.ir...
):
(1)
Where GSio is the olive orchards area in Guilan province, GSi is total cultivated area of semi-tropical fruits of Guilan province, GSo is the olive orchards area of Iran and GS is the total cultivated area of semi-tropical fruits of Iran. If the SAIio is greater than one, the degree of concentration of olive in Guilan province would be bigger than the whole country, indicating that the Guilan province had scale physical CAs for olive production.
The EAIio was calculated based on the yield level as the following equation (AMIRNEZHAD & RAFIEE, 2010AMIRNEZHAD, H.; RAFIEE, H. Investigation of physical CA of irrigated crops and the affectability of aggregate advantage index from its components in Mazandaran province. Agricultural Economics and Development, v.17, n.3, p.23-46. 2010. Available from: <Available from: http://www.agri-peri.ir
>. Accessed: Aug. 12, 2018.
http://www.agri-peri.ir...
):
(2)
Where APio is the yield of olive in Guilan province, APi is the average yield of semi-tropical fruits in Guilan province, APo is the average yield of olive in Iran and AP is the average yield of semi-tropical fruits in Iran. If the EAIio index is greater than one, the olive production in Guilan Province had efficiency physical CAs.
The AAIio index is the geometric mean of the two SAI and EAI indicators. This physical CAs index is presented by Eq. (3) (AMIRNEZHAD & RAFIEE, 2010AMIRNEZHAD, H.; RAFIEE, H. Investigation of physical CA of irrigated crops and the affectability of aggregate advantage index from its components in Mazandaran province. Agricultural Economics and Development, v.17, n.3, p.23-46. 2010. Available from: <Available from: http://www.agri-peri.ir
>. Accessed: Aug. 12, 2018.
http://www.agri-peri.ir...
):
(3)
AAIio is a comprehensive benchmark of CAs. If the value is greater than one, then the olive product in Guilan province had advantage over the average of the country.
Policy Analysis Matrix (PAM)
PAM calculated the impact of market deviations by comparing the difference between market and social profitability of products (MONK & PEARSON, 1989MONKE, E. A.; PEARSON, S. R. The policy analysis matrix for agricultural development. Ithaca and London: Cornell University Press, 1989. 201p. Available from: <Available from: https://www.cepal.org/sites/default/files/courses/files/03_3_pambook.pdf
>. Aug. 12, 2018.
https://www.cepal.org/sites/default/file...
). PAM is developed by MONK & PEARSON (1989)MONKE, E. A.; PEARSON, S. R. The policy analysis matrix for agricultural development. Ithaca and London: Cornell University Press, 1989. 201p. Available from: <Available from: https://www.cepal.org/sites/default/files/courses/files/03_3_pambook.pdf
>. Aug. 12, 2018.
https://www.cepal.org/sites/default/file...
and enhanced by MASTER & WINTER-NELSON (1995MASTER, W. A.; WINTER-NELSON, A. Measuring the CA of agricultural activities: Domestic resource cost and the social cost-benefit Ratio. American Journal of Agricultural Economics, v.19, n.1, p.243-250. 1995. Available from: <Available from: https://academic.oup.com/ajae/article-abstract/77/2/243/47964?redirectedFrom=fulltext
>. Accessed: May, 01, 1995. doi: 10.2307/1243534.
https://academic.oup.com/ajae/article-ab...
), for measuring production efficiency, CA among products, and the degree of government interventions. It is basically a double-counting technique which summarized the budgeting information. In the current study, PAM was used for two types of traditional and commercial olive orchards to determine the CAs of olive production in Guilan province. Traditional and commercial orchards have different status in terms of inputs such as pesticides and chemical fertilizers and etc (Table 1).
The entries for the first row of a PAM, which contains measures of prices in the observed market prices called private prices. These are sometimes called domestic, market or financial prices. Revenue and cost categories in private prices (A, B, and C elements) are based on data from farm budgets where ; ; ; Pid = domestic price of output i; Pjd = domestic price of tradable input j; Pnd = market price of non-tradable input n; Qi = quantity of output; Qj = quantity of tradable input; Qn = quantity of non-tradable input (RAHMAN et al., 2016RAHMAN, S. et al. Competitiveness, Profitability, Input Demand and Output Supply of Maize Production in Bangladesh. Agriculture, v.6, n.2, p. 1-14, 2016. Available from: <Available from: https://www.mdpi.com/2077-0472/6/2/21/htm
>. Aug. 12, 2018. doi: 10.3390/agriculture6020021.
https://www.mdpi.com/2077-0472/6/2/21/ht...
). Profits in private prices (D), is reported by applying the profitability identity (D = A - (B+C)). Private profits in PAM thus are a residual discovered by subtracting private costs from private revenues (PEARSON & MONKE, 1987PEARSON, S. R.; MONKE, E. A. The Policy Analysis Matrix: A Manual for Practitioners. Pragma Corporation, Washington, D.C., U. S. A., 1987.). Calculation of private profits, from data in farm budgets, measures the competitiveness of agricultural systems. One key result for agricultural policy thus is obtained from the first row of the PAM matrix (MONK & PEARSON, 1989MONKE, E. A.; PEARSON, S. R. The policy analysis matrix for agricultural development. Ithaca and London: Cornell University Press, 1989. 201p. Available from: <Available from: https://www.cepal.org/sites/default/files/courses/files/03_3_pambook.pdf
>. Aug. 12, 2018.
https://www.cepal.org/sites/default/file...
).
The entries for the second row of a PAM, which contains measures of prices that would result in the best allocation of resources and thus the highest generation of income called social or world prices. These are sometimes called shadow prices, efficiency values, or opportunity costs. Revenue and cost categories in social prices (E, F, and G elements) are based on estimates of the social opportunity costs of commodities produced and inputs used in production where ; ; ; Pib = international price of output i; Pjb = international price of tradable input j; Pns = shadow price of non-tradable input n (RAHMAN et al., 2016RAHMAN, S. et al. Competitiveness, Profitability, Input Demand and Output Supply of Maize Production in Bangladesh. Agriculture, v.6, n.2, p. 1-14, 2016. Available from: <Available from: https://www.mdpi.com/2077-0472/6/2/21/htm
>. Aug. 12, 2018. doi: 10.3390/agriculture6020021.
https://www.mdpi.com/2077-0472/6/2/21/ht...
). These estimated social prices then are applied to the original quantities of outputs and inputs (those used in the calculation of private profits in the top row of PAM). Social profits in PAM (H) are a residual discovered by subtracting social costs (F + G) from social revenues or E (PEARSON & MONKE, 1987PEARSON, S. R.; MONKE, E. A. The Policy Analysis Matrix: A Manual for Practitioners. Pragma Corporation, Washington, D.C., U. S. A., 1987.).
To estimate social prices, the inputs used were divided into two categories: (a) tradable inputs; and (b) non-tradable inputs. Different inputs have differing levels of tradability: the higher the cost of transportation and the shorter the shelf life, the less tradable the input is (RAHMAN et al., 2016RAHMAN, S. et al. Competitiveness, Profitability, Input Demand and Output Supply of Maize Production in Bangladesh. Agriculture, v.6, n.2, p. 1-14, 2016. Available from: <Available from: https://www.mdpi.com/2077-0472/6/2/21/htm
>. Aug. 12, 2018. doi: 10.3390/agriculture6020021.
https://www.mdpi.com/2077-0472/6/2/21/ht...
). Usually, the tradable inputs were different types of fertilizers and pesticides. Base on PAM information, three groups of indicators including advantage, support, and competitiveness could be calculated and analyzed, separately.
CA Indices
Net Social Profit (NSP): The social profitability is a measure of CA and efficiency which inputs and outputs are valued in social prices and reflect scarcity values (MAMZA et al., 2014MAMZA, A. O., et al. Competitiveness of beef processing in Borno state of Nigeria: a policy analysis matrix approach. Journal of Agriculture and Sustainability, v.6, n.2, p.132-147. 2014. Available from: <Available from: https://infinitypress.info/index.php/jas/issue/view/58
>. Aug. 12, 2018.
https://infinitypress.info/index.php/jas...
). The NSP shows the difference between social revenue (E) and social costs of inputs (F+G).
(4)
The positive value of NSP shows the social profitability of olive production, while negative ones indicated that the olive production and exports are unprofitable in the region under free competition conditions.
Domestic Resource Cost (DRC): DRC is an indicator that measures the ratio of domestic factors to the value-added of the system at social prices (UGOCHUKWU & EZDINMA, 2011UGOCHUKWU, A. I.; EZEDINMA, C. I. Intensification of rice production systems in South-eastern Nigeria: a policy analysis matrix approach. International Journal of Agricultural Economics and Development, v.1, n.2, p.89-100, 2011. Available from: <Available from: http://ijamad.iaurasht.ac.ir/article_514195.html
>. Aug. 12, 2018.
http://ijamad.iaurasht.ac.ir/article_514...
). This ratio compares costs of domestic factors (G) with difference of social revenue and social costs of tradable inputs (E-F).
(5)
DRC less than 1 indicates that olive production had CA in Guilan province.
Social Cost Benefit (SCB): This ratio compares total social costs of inputs (F+G) with social revenue (E) (PAKRAVAN & KAVOOSI-KALASHAMI, 2011PAKRAVAN, M. R.; KAVOOSI-KALASHAMI, M. Determination of target exchange rate for CA of Iran crops (a case of Sari Township). International Journal of Agricultural Economics and Development, v.1, n.2, p.101-106, 2011. Available from: <Available from: http://ijamad.iaurasht.ac.ir/article_514197.html
>. Aug. 12, 2018.
http://ijamad.iaurasht.ac.ir/article_514...
).
(6)
If SCB <1, olive production has CA in Guilan province.
Protection (Support) Indices
Nominal Protection Coefficient on Inputs (NPCI): the value of NPCI represented the existence of possible indirect taxes on tradable inputs. NPCI is a simple indicator of the incentives or disincentives in place and is defined as the ratio of domestic price (B) to a comparable world (social) price (F) (ESHRAGHI SAMANI & POURSAEED, 2015ESHRAGHI SAMANI, R.; POURSAEED, A. Cropping pattern and CA of agricultural products in Ilam province. International Journal of Agricultural Economics and Development, v.5, n.3, p.235-243, 2015. Available from: <Available from: http://ijamad.iaurasht.ac.ir/article_515631.html
>. Accessed: Jun. 15, 2015. doi: 10.5455/ijamd.175988.
http://ijamad.iaurasht.ac.ir/article_515...
).
(7)
The domestic price used in this computation could be either the procurement price or the farm level price, while the world reference price is the international price adjusted for transportation, marketing and processing costs (ESHRAGHI SAMANI & POURSAEED, 2015ESHRAGHI SAMANI, R.; POURSAEED, A. Cropping pattern and CA of agricultural products in Ilam province. International Journal of Agricultural Economics and Development, v.5, n.3, p.235-243, 2015. Available from: <Available from: http://ijamad.iaurasht.ac.ir/article_515631.html
>. Accessed: Jun. 15, 2015. doi: 10.5455/ijamd.175988.
http://ijamad.iaurasht.ac.ir/article_515...
).
Nominal Protection Coefficient on Outputs (NPCO): The value of NPCO indicates that if there is a direct subsidy on the olive producer or not. This ratio compares private revenue (A) with social revenue (E) (PAKRAVAN & KAVOOSI-KALASHAMI, 2011PAKRAVAN, M. R.; KAVOOSI-KALASHAMI, M. Determination of target exchange rate for CA of Iran crops (a case of Sari Township). International Journal of Agricultural Economics and Development, v.1, n.2, p.101-106, 2011. Available from: <Available from: http://ijamad.iaurasht.ac.ir/article_514197.html
>. Aug. 12, 2018.
http://ijamad.iaurasht.ac.ir/article_514...
):
(8)
NPCO measures the extent of policy intervention on the output and indicates the impact of policy and any market failure that causes a divergence between the private and social prices (UGOCHUKWU & EZDINMA, 2011UGOCHUKWU, A. I.; EZEDINMA, C. I. Intensification of rice production systems in South-eastern Nigeria: a policy analysis matrix approach. International Journal of Agricultural Economics and Development, v.1, n.2, p.89-100, 2011. Available from: <Available from: http://ijamad.iaurasht.ac.ir/article_514195.html
>. Aug. 12, 2018.
http://ijamad.iaurasht.ac.ir/article_514...
).
The NPCI or NPCO greater than 1 indicates implicit nominal protection or subsidy by producers, while less than 1 implicit nominal tax (KANAKA & CHINNADURAI, 2013KANAKA, S.; CHINNADURAI, M. The policy analysis matrix of rice cultivation in India. European Journal of Physical and Agricultural Sciences, v.1, n.1, p.8-19, 2013. Available from: <Available from: https://www.idpublications.org/wp-content/uploads/2013/11/THE-POLICY-ANALYSIS-MATRIX-OF-RICE CULTIVATION-IN-INDIA.pdf
>. Aug. 12, 2018.
https://www.idpublications.org/wp-conten...
).
Effective Protection Coefficient (EPC): This index compares the value added in private prices (A-B) to value added in social prices (E-F) for olive production. This coefficient measures the degree of policy transfer from product market-output and tradable-input policies (MAMZA et al., 2014MAMZA, A. O., et al. Competitiveness of beef processing in Borno state of Nigeria: a policy analysis matrix approach. Journal of Agriculture and Sustainability, v.6, n.2, p.132-147. 2014. Available from: <Available from: https://infinitypress.info/index.php/jas/issue/view/58
>. Aug. 12, 2018.
https://infinitypress.info/index.php/jas...
). EPC is an indicator used to assess whether government policy tends to tax or protect consumers and producers (UGOCHUKWU & EZDINMA, 2011UGOCHUKWU, A. I.; EZEDINMA, C. I. Intensification of rice production systems in South-eastern Nigeria: a policy analysis matrix approach. International Journal of Agricultural Economics and Development, v.1, n.2, p.89-100, 2011. Available from: <Available from: http://ijamad.iaurasht.ac.ir/article_514195.html
>. Aug. 12, 2018.
http://ijamad.iaurasht.ac.ir/article_514...
).
(9)
EPC more than 1 shows positive protection of value added by producers or government policies which provide positive incentives to producers, while effective taxation of value added by producers is determined when EPC is less than 1 (KANAKA & CHINNADURAI, 2013KANAKA, S.; CHINNADURAI, M. The policy analysis matrix of rice cultivation in India. European Journal of Physical and Agricultural Sciences, v.1, n.1, p.8-19, 2013. Available from: <Available from: https://www.idpublications.org/wp-content/uploads/2013/11/THE-POLICY-ANALYSIS-MATRIX-OF-RICE CULTIVATION-IN-INDIA.pdf
>. Aug. 12, 2018.
https://www.idpublications.org/wp-conten...
).
Subsidy indicator
Subsidy Ratio to Producers (SRP): This ratio is the net policy transfer as a proportion of total social revenues (MAMZA et al., 2014MAMZA, A. O., et al. Competitiveness of beef processing in Borno state of Nigeria: a policy analysis matrix approach. Journal of Agriculture and Sustainability, v.6, n.2, p.132-147. 2014. Available from: <Available from: https://infinitypress.info/index.php/jas/issue/view/58
>. Aug. 12, 2018.
https://infinitypress.info/index.php/jas...
). The SRP shows the proportion of revenues in world prices that would be required if a single subsidy or tax were substituted for the entire set of commodity and macroeconomic policies (CHRISTO, 2010CHRISTO, J. The competiveness and efficiency of the South African Broiler Industry. National Agricultural Marketing Council, South Africa. June, 2010. . Available from: <https://www.idc.co.za>.
https://www.idc.co.za...
).
(10)
Competitiveness Indices
Profitability Coefficient (PC): This coefficient shows the impact of all transfers on profitability (UDE et al., 2013UDE, M., et al. Competitiveness of rice processing and marketing in Ebonyi state: A policy analysis approach. International Journal of Agricultural Sciences, v.3, n.2, p.410-418, 2013. Available from: <Available from: https://www.iaras.org/iaras/journals/ijas
>. Aug. 12, 2018.
https://www.iaras.org/iaras/journals/ija...
).
(11)
This index is more complete than the EPC, because it generally takes into account the effect of policies (MAMZA et al., 2014MAMZA, A. O., et al. Competitiveness of beef processing in Borno state of Nigeria: a policy analysis matrix approach. Journal of Agriculture and Sustainability, v.6, n.2, p.132-147. 2014. Available from: <Available from: https://infinitypress.info/index.php/jas/issue/view/58
>. Aug. 12, 2018.
https://infinitypress.info/index.php/jas...
).
Private Cost Ratio (PCR): This ratio is similar to the DRC but for the PCR the values in private prices are used (MAMZA et al., 2014MAMZA, A. O., et al. Competitiveness of beef processing in Borno state of Nigeria: a policy analysis matrix approach. Journal of Agriculture and Sustainability, v.6, n.2, p.132-147. 2014. Available from: <Available from: https://infinitypress.info/index.php/jas/issue/view/58
>. Aug. 12, 2018.
https://infinitypress.info/index.php/jas...
). PCR shows the private efficiency of the olive producers and able to describe the amount which can afford to pay domestic factors (including a normal return to capital) and hold is competitiveness.
(12)
This ratio demonstrated the ability of a production system to cover the costs of the domestic factors and continue its competitiveness. It’s important for investors because they can optimize their profits by minimizing the costs of tradable inputs (MANE-KAPAJ et al., 2010Mane-Kapaj, A., et al. Assessing the CAs of Albanian olive oil production. International Food and Agribusiness Management Review, v.13, n.1, p.15-26, 2010. Available from: <Available from: https://www.ifama.org/Volume-13-Issue-1
>. Aug. 12, 2018.
https://www.ifama.org/Volume-13-Issue-1...
). If 0 <PCR<1, then the value added is greater than the resource cost. So the production of olive could be profitable, where if the ratio is greater or less than this range the farmer makes no profit.
Domestic unit cost (UCd): it determines whether the producer, in the current situation and despite the deviation in the prices of output and inputs, can compete in the domestic markets or not.
(13)
If UC d is less than 1, the olive producer in Guilan province has the ability to compete in domestic markets.
Export unit cost (UCX): This ratio indicates whether the olive producer in Guilan province can compete in international markets in current situations of output and inputs markets or not.
(14)
If UC X is less than 1, the olive producer in Guilan province will have the opportunity to compete in international markets and benefit from exporting of this product (Table 2).
Social (shadow) values (prices) of inputs and olive
Social values reflect the value to society as a whole rather than to private individuals, and were the values used in economic analysis when the purpose is maximization of national income (KANAKA & CHINNADURAI, 2013KANAKA, S.; CHINNADURAI, M. The policy analysis matrix of rice cultivation in India. European Journal of Physical and Agricultural Sciences, v.1, n.1, p.8-19, 2013. Available from: <Available from: https://www.idpublications.org/wp-content/uploads/2013/11/THE-POLICY-ANALYSIS-MATRIX-OF-RICE CULTIVATION-IN-INDIA.pdf
>. Aug. 12, 2018.
https://www.idpublications.org/wp-conten...
).
World prices were used to compute the social prices of tradable inputs and output. For importable inputs and output, social prices are computed by adding all marketing costs to the Cost, Insurance and Freight (CIF) prices. In addition, Free On Board (FOB) prices are used for exportable inputs and output. Olive and inputs such as fertilizers, pesticides, acids and oils are importable. Hence, the CIF prices at port plus the domestic transportation cost, port charges, handling cost, etc. were used as social prices for olive and the mentioned input items.
Determining social prices for domestic inputs, which are not tradable, would be difficult. Market prices of non-tradable inputs in olive production include land, water, machinery, labour, seedlings and animal manure were considered as competitive prices. Therefore, private and social prices for the mentioned inputs would be equal.
For converting CIF prices to Iranian national currency (IRR), it is necessary to calculate shadow exchange rate. According to the theory of equality, purchasing power of exchange rates can be calculated in both absolute and relative terms. In this study, shadow exchange rate was calculated using the relative method and the following formula (BAYAZIDNEZHAD, 2017BAYAZIDNEZHAD, D. Determining optimal cultivation pattern of major crops in Urmia County on the basis of CA. Thesis submitted in partial fulfillment of the requirements for the degree of Master of Science in Agricultural Economics, Faculty of Agriculture, University of Urmia. 2017.):
(15)
Where, E is the shadow exchange rate, E0 is market exchange rate in base year, Pd is consumer price index in Iran and Pw is the consumer price index in China (as the biggest trade partner).
The required data set for olive input-output quantities and their domestic prices during the 2016-2017 cultivation years were obtained through reports conducted by Agriculture-Jihad Organization of Guilan province. Olive acreages, yield and production during 2008-2016 were obtained through the database of production and cost of agricultural products, conducted by the Ministry of Agriculture Jihad. The CIF prices of the tradable inputs were collected through the non-published statistics of Iran Customs Office; also we took benefit of using data from World Bank and FAO databases.
RESULTS AND DISCUSSION
Physical CAs of olive production in Guilan province
During 2008-2016, three physical advantage indicators including SAI, EAI and AAI as a comprehensive indicators of the physical CA of olive production at Guilan province were investigated. Results showed that olive production at this province had scale advantage during studied period. The highest olive concentration ratio was equals to 2.49 on 2008 (Figure 1).

The results showed that the SAI index does not have a stable trend, and till 2011 there was a downward trend while upward trend had been observed after 2013. The range of SAI over this period was 1.1. The maximum value of SAI was in 2008 and its minimum level was in 2013. One of the reasons for the SAI downward trend during 2008-2011 was the increase in Iran’s olive plantations. Olive plantations in Iran increase from 29683 hectares in 2008 to 53571 hectares in 2009. The 25% growth of SAI in 2012 (in compare with 2011) caused by olive plantations increase of Guilan province from 4211 hectares in 2011 to 5952 hectares in 2012. SAI has been increasing since 2013, due to the increase in olive and semi-tropical fruits plantations in Guilan province and the decrease in the level of olive and semi-tropical fruits of Iran during 2013-2016.
Results of EAI during 2008-2016 showed that, except for 2008, the olive production in Guilan province has efficiency advantage during all understudy years. The highest level of EAI was in 2014 with a value of 2.61 and the range statistics for this index equals to 1.69 (Figure 2).
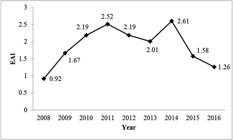
The EAI trend for understudy time period was not stable. Form 2008 till 2011, EAI had an increasing trend and from 2014 till 2016, the trend of EAI for olive production in Guilan province had become decreasing. Comparing EAI of 2014 to 2013, it was revealed that one of the reasons for 30% growth in EAI of 2014 was 28% increase of olive yield in Guilan province during 2013-2014 periods. Also, in 2014, semi-tropical fruits yield was decreased both in the country and province levels.
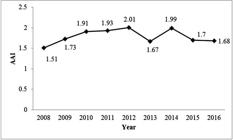
Results of calculating the AAI index showed that the olive production in Guilan province has physical aggregate advantage over the time period of 2008-2016. The results showed that the AAI index does not have a stable trend and has an increasing trend from 2008 until 2012 and after that the considerable fluctuations observed in this index levels. The range statistics for AAI was 0.5 with maximum and minimum value in 2012 and 2008, respectively. Using AAI, SAEIDIFAR & AKHANI (2014SAEIDIFAR, A.; AKHANI, Z. Determining Comparative advantages of crops and horticultures in Iran’s Provinces. Economic Journal, v.13, n.11&12, p.47-64, 2014. Available from: <Available from: http://ejip.ir/article-1-676-fa.html
>. Aug. 12, 2018.
http://ejip.ir/article-1-676-fa.html...
) showed that olive production in Guilan and 10 other Provinces of Iran have physical comparative advantage (Figure 3).
To convert the FOB or CIF prices of output and tradable inputs to national currency (IRR), the shadow exchange rate was used. In 2016, the average nominal market exchange rate for a USA $ was 36,440 IRR, the average consumer price index of Iran was 31.65%, and the average consumer price index of China (which is Iran’s biggest trade partner) was 11.17%. Thus, the shadow exchange rate for 2016 equals to 103726 IRR.
CAs, Support Indices and Competitiveness of olive production in Guilan province
Average consumption of tradable and non-tradable inputs per hectare of traditional and commercial olive plantations in Guilan province were reported in table 3.
Comparing the amount of inputs usage in commercial and traditional olive plantations showed that the amount of chemical fertilizers per hectare in commercial olive plantations of Guilan province is 200% more than the traditional ones. Also, amounts of non-tradable inputs usage in traditional and commercial plantations were the same (Table 4).
The results showed that the market revenue per hectare in commercial plantation was 67% more than the traditional ones. Also, social revenue was 67% higher in commercial plantation in compare with traditional olive orchards. Private profit in commercial plantation was 145% higher than traditional one. Conversely, social profit of commercial orchards was 105% more in compare with traditional olive plantation.
The market value of tradable inputs costs in commercial plantation was 234% higher than traditional ones. Social price of tradable input costs in commercial plantation was 227% higher than traditional one. Costs of non-tradable (domestic) inputs were the same in both commercial and traditional plantations.
The private profit for traditional and commercial plantations was equal to 7.53 and 18.43 million IRR, respectively, which indicated that production in domestic market is in the interests of the producers. Shadow profit for traditional and commercial plantations was equal to 8.41 and 17.21 million IRR, respectively. This finding showed that olive producer in Guilan province could benefit under trade liberalization. The policy effect of revenue for both commercial and traditional plantations (-3 and -5 Million IRR) showed that in compare with trade liberalization situation the government receives indirect taxes from domestic olive producers. The policy effect of tradable inputs costs for both commercial and traditional plantations (-1.82 and -5.92 Million IRR) indicated that domestic producers buy tradable inputs below their international prices and therefore receive indirect subsidies. The policy effect of domestic inputs costs for both commercial and traditional plantations (-0.3 and -0.3 Million IRR) revealed that the market price of these factors in domestic market is lower than their international prices; and therefore, domestic olive producers received indirect subsidy.
Base on the private and social values of revenue, tradable inputs cost and domestic inputs cost for commercial and traditional olive plantations in PAM matrix (Table 4), three groups of indices included CA, support and competitiveness were calculated (Table 5).
Values of CA indices (DRC, SCB and NSP) showed that olive production in traditional and commercial plantations of Guilan province has CA. The DRC values were less than 1, which indicated that olive production is cheaper in the interior than its imports. As a result, olive production increase should be a policy priority in agriculture sector of Guilan province. Such indicator showed that both production systems use the domestic resources efficiency but commercial plantations act more efficient. Values of SCB in traditional and commercial plantations were less than 1. So, olive production systems in Guilan province had private and social profitability. The NSP showed that commercial producers of olive create 105% more of social profit in compare with traditional producers in Guilan province. AL-HIARY (2015AL-HIARY, M.A.H. Assessing competitiveness of Jordanian olive production a policy analysis matrix (PAM). Journal for Studies in Management and Planning, v.1, n.2, p.19-29. 2015. Available from: <Available from: http://internationaljournalofresearch.org
>. Accessed: Aug. 12, 2018.
http://internationaljournalofresearch.or...
) showed that olive production does not enjoy a comparative advantage in all districts of Jordan (DRC > 1 for all governorates).
The NPCI values showed that olive producers receive indirect subsidy because of lower tradable inputs prices in compare with international prices. Also, the NPCO levels revealed that olive producers in Guilan province pay indirect tax because of higher olive price in international market in compare with domestic market. EPC value for traditional olive producers showed that these producers are not protected through policy interventions but this index value for commercial olive producers revealed that outcome of domestic policies in both output and inputs markets were in favor of this group of producers. So, it seems that government promotes and supports commercial production of olive in Guilan province. AL-HIARY (2015AL-HIARY, M.A.H. Assessing competitiveness of Jordanian olive production a policy analysis matrix (PAM). Journal for Studies in Management and Planning, v.1, n.2, p.19-29. 2015. Available from: <Available from: http://internationaljournalofresearch.org
>. Accessed: Aug. 12, 2018.
http://internationaljournalofresearch.or...
) revealed high protection for olive production in Jordan (NPCO and EPC greater than one for all districts).
The PC values indicated that olive commercial plantation had more desirable performance in competitiveness aspect. The PCR values showed that the value added is greater than the domestic resource costs thus, it is profitable to produce olive under traditional and commercial plantation systems. The UCd and UCx values for both traditional and commercial plantations were less than 1, which indicated that the olive producers in Guilan province had the ability to compete with domestic and international competitors.
CONCLUSION:
Physical and comparative advantages analysis showed that the production in both traditional and commercial forms had CA. Such indicator showed that both olive plantations methods uses the domestic resources with efficiency but commercial plantations had more efficiency and higher level of CA. Developing olive processing and packaging centers at Guilan province, branding and improving marketing strategies would help producers to sustain and benefit from these advantages. Exchange rate variation affected the competitive potentials and prevented Guilan olive producers to express their competitive potential. For this reason, olive production at this province becomes more competitive in the external market when the USA currency is valued in Iran. Analysis of the internal support of olive producers was performed on the basis of the conducted calculations. Obtained results confirmed that the internal support mechanism of the olive producers needs improvement. Also for traditional olive producers the supports should be changed, partly. Olive producers need more support to reach international markets and then be able to improve their efficiency. Producers also need to access cheap resources for their production.
PAM is static and this is the main limitation of current study. To overcome this constraint, its highly recommended to consider the changes in the variables of possible scenarios and perform the sensitivity analysis for further researches. Finally, extending the case studies to all olive production areas in Iran and expanding the analysis with focus on environmental impacts are also suggested for future studies.
REFERENCES
- ABEDI, S. et al. Determining CAs of corn in optimal cultivation patter. International Journal of Agricultural Economics and Development, v.1, n.4, p.197-206, 2011. Available from: <Available from: http://ijamad.iaurasht.ac.ir/article_514166.html >. Accessed: Aug. 12, 2018.
» http://ijamad.iaurasht.ac.ir/article_514166.html - AL ASHKAR, H. Olive Oil CAs. Ministry of Agriculture and Agrarian Reform, National Agriculture Policy Center. Working Paper No. 19, With the Support of Project GCP/SYR/006/ITA. 2006. Available from: <Available from: https://www.academia.edu/7146941/Comparative_advantages_of_olive_oil_in_Syria >. Accessed: Aug. 12, 2018.
» https://www.academia.edu/7146941/Comparative_advantages_of_olive_oil_in_Syria - AL-HIARY, M.A.H. Assessing competitiveness of Jordanian olive production a policy analysis matrix (PAM). Journal for Studies in Management and Planning, v.1, n.2, p.19-29. 2015. Available from: <Available from: http://internationaljournalofresearch.org >. Accessed: Aug. 12, 2018.
» http://internationaljournalofresearch.org - AMIRNEZHAD, H.; RAFIEE, H. Investigation of physical CA of irrigated crops and the affectability of aggregate advantage index from its components in Mazandaran province. Agricultural Economics and Development, v.17, n.3, p.23-46. 2010. Available from: <Available from: http://www.agri-peri.ir >. Accessed: Aug. 12, 2018.
» http://www.agri-peri.ir - BAYAZIDNEZHAD, D. Determining optimal cultivation pattern of major crops in Urmia County on the basis of CA. Thesis submitted in partial fulfillment of the requirements for the degree of Master of Science in Agricultural Economics, Faculty of Agriculture, University of Urmia. 2017.
- CHRISTO, J. The competiveness and efficiency of the South African Broiler Industry. National Agricultural Marketing Council, South Africa. June, 2010. . Available from: <https://www.idc.co.za>.
» https://www.idc.co.za - FAO. FAOSTAT Database. Available from: <Available from: http://www.fao.org/faostat >. 2018. Accessed: Aug. 12, 2018.
» http://www.fao.org/faostat - ESHRAGHI SAMANI, R.; POURSAEED, A. Cropping pattern and CA of agricultural products in Ilam province. International Journal of Agricultural Economics and Development, v.5, n.3, p.235-243, 2015. Available from: <Available from: http://ijamad.iaurasht.ac.ir/article_515631.html >. Accessed: Jun. 15, 2015. doi: 10.5455/ijamd.175988.
» http://ijamad.iaurasht.ac.ir/article_515631.html - HAJI-RAHIMI, M. CA, self-sufficiency and food security in Iran: case study of wheat commodity. International Journal of Agricultural Economics and Development, v.4, n.3, p.203-210, 2014. Available from: <Available from: http://ijamad.iaurasht.ac.ir/article_513792.html >. Accessed: Jun. 15, 2015.
» http://ijamad.iaurasht.ac.ir/article_513792.html - HATEF, H., et al. Determining optimal cultivation pattern of major crops in Khorasan Razavi province on the basis of production CA. Agricultural Economics Research, v.8, n.3, p.167-192, 2016. Available from: <Available from: http://jae.miau.ac.ir/article_2078.html >. Accessed: Jun. 15, 2015.
» http://jae.miau.ac.ir/article_2078.html - INDUSTRY, MINE & TRADE ORGANIZATION OF GUILAN PROVINCE. Report of industrial and agricultural productions in Guilan province. 2017.
- IRAN’S MINISTRY OF AGRICULTURE JIHAD. Production and cost of agricultural products database. Available from: <Available from: https://www.maj.ir/ >.2017 Aug. 12, 2018.
» https://www.maj.ir/ - KANAKA, S.; CHINNADURAI, M. The policy analysis matrix of rice cultivation in India. European Journal of Physical and Agricultural Sciences, v.1, n.1, p.8-19, 2013. Available from: <Available from: https://www.idpublications.org/wp-content/uploads/2013/11/THE-POLICY-ANALYSIS-MATRIX-OF-RICE CULTIVATION-IN-INDIA.pdf >. Aug. 12, 2018.
» https://www.idpublications.org/wp-content/uploads/2013/11/THE-POLICY-ANALYSIS-MATRIX-OF-RICE CULTIVATION-IN-INDIA.pdf - KARBASI, A. R., et al. Determining CA of main cultivated production in Kerman. Agricultural Economic and Development, v.17, n.1, p.1-15. 2009. Available from: < Available from: https://www.agri-peri.ir >. Aug. 12, 2018.
» https://www.agri-peri.ir - MAMZA, A. O., et al. Competitiveness of beef processing in Borno state of Nigeria: a policy analysis matrix approach. Journal of Agriculture and Sustainability, v.6, n.2, p.132-147. 2014. Available from: <Available from: https://infinitypress.info/index.php/jas/issue/view/58 >. Aug. 12, 2018.
» https://infinitypress.info/index.php/jas/issue/view/58 - Mane-Kapaj, A., et al. Assessing the CAs of Albanian olive oil production. International Food and Agribusiness Management Review, v.13, n.1, p.15-26, 2010. Available from: <Available from: https://www.ifama.org/Volume-13-Issue-1 >. Aug. 12, 2018.
» https://www.ifama.org/Volume-13-Issue-1 - MASTER, W. A.; WINTER-NELSON, A. Measuring the CA of agricultural activities: Domestic resource cost and the social cost-benefit Ratio. American Journal of Agricultural Economics, v.19, n.1, p.243-250. 1995. Available from: <Available from: https://academic.oup.com/ajae/article-abstract/77/2/243/47964?redirectedFrom=fulltext >. Accessed: May, 01, 1995. doi: 10.2307/1243534.
» https://doi.org/10.2307/1243534.» https://academic.oup.com/ajae/article-abstract/77/2/243/47964?redirectedFrom=fulltext - MONKE, E. A.; PEARSON, S. R. The policy analysis matrix for agricultural development. Ithaca and London: Cornell University Press, 1989. 201p. Available from: <Available from: https://www.cepal.org/sites/default/files/courses/files/03_3_pambook.pdf >. Aug. 12, 2018.
» https://www.cepal.org/sites/default/files/courses/files/03_3_pambook.pdf - PAKRAVAN, M. R.; KAVOOSI-KALASHAMI, M. Determination of target exchange rate for CA of Iran crops (a case of Sari Township). International Journal of Agricultural Economics and Development, v.1, n.2, p.101-106, 2011. Available from: <Available from: http://ijamad.iaurasht.ac.ir/article_514197.html >. Aug. 12, 2018.
» http://ijamad.iaurasht.ac.ir/article_514197.html - PEARSON, S. R.; MONKE, E. A. The Policy Analysis Matrix: A Manual for Practitioners. Pragma Corporation, Washington, D.C., U. S. A., 1987.
- RAHIMI, H. Determining olive production CA in compare with other crops at Fars province. Institute of Planning, Agricultural Economics and Rural Development Research, 2011. Available from: < Available from: http://www.agri-peri.ir >. Aug. 12, 2018.
» http://www.agri-peri.ir - RAHMAN, S. et al. Competitiveness, Profitability, Input Demand and Output Supply of Maize Production in Bangladesh. Agriculture, v.6, n.2, p. 1-14, 2016. Available from: <Available from: https://www.mdpi.com/2077-0472/6/2/21/htm >. Aug. 12, 2018. doi: 10.3390/agriculture6020021.
» https://doi.org/10.3390/agriculture6020021.» https://www.mdpi.com/2077-0472/6/2/21/htm - SAEIDIFAR, A.; AKHANI, Z. Determining Comparative advantages of crops and horticultures in Iran’s Provinces. Economic Journal, v.13, n.11&12, p.47-64, 2014. Available from: <Available from: http://ejip.ir/article-1-676-fa.html >. Aug. 12, 2018.
» http://ejip.ir/article-1-676-fa.html - SANDERSON, T.; AHMADI-ESFAHANI, F. Testing CA in Australian broad acre agriculture under climate change: Theoretical and Empirical Models. Economic papers, v.28, n.4, p.346-354, 2009. Available from: <Available from: https://onlinelibrary.wiley.com/doi/10.1111/j.1759-3441.2010.00043.x >. Aug. 12, 2018.
» https://onlinelibrary.wiley.com/doi/10.1111/j.1759-3441.2010.00043.x - SOUZA, A. R. L. et al. Economics and accounting evaluation of rice milled production chains in Rio Grande do Sul (Brazil) and Uruguay with application of the Policy Analysis Matrix. Ciência Rural, v.47, n.4, p.1-7, 2017. Available from: <Available from: http://www.scielo.br/scielo.php?script=sci_issuetoc&pid=0103-847820170004&lng=en&nrm=iso >. Aug. 12, 2018.
» http://www.scielo.br/scielo.php?script=sci_issuetoc&pid=0103-847820170004&lng=en&nrm=iso - UDE, M., et al. Competitiveness of rice processing and marketing in Ebonyi state: A policy analysis approach. International Journal of Agricultural Sciences, v.3, n.2, p.410-418, 2013. Available from: <Available from: https://www.iaras.org/iaras/journals/ijas >. Aug. 12, 2018.
» https://www.iaras.org/iaras/journals/ijas - UGOCHUKWU, A. I.; EZEDINMA, C. I. Intensification of rice production systems in South-eastern Nigeria: a policy analysis matrix approach. International Journal of Agricultural Economics and Development, v.1, n.2, p.89-100, 2011. Available from: <Available from: http://ijamad.iaurasht.ac.ir/article_514195.html >. Aug. 12, 2018.
» http://ijamad.iaurasht.ac.ir/article_514195.html - ZHONG, F., et al. Regional CA in China’s main grain crops. Adelaide university scientific report. 2002. Available from: <Available from: http:// www. Adelaide. Edu. Au/cies/Cerc/gmp1.Pdf >. Aug. 12, 2018.
» http:// www. Adelaide. Edu. Au/cies/Cerc/gmp1.Pdf
-
CR-2019-0322.R2
Publication Dates
-
Publication in this collection
14 Nov 2019 -
Date of issue
2019
History
-
Received
25 Apr 2019 -
Accepted
22 Aug 2019 -
Reviewed
03 Oct 2019


