


Abstract
Transposable elements (TEs) are considered to be genomic parasites and their interactions with their hosts have been likened to the coevolution between host and other nongenomic, horizontally transferred pathogens. TE families, however, are vertically inherited as integral segments of the nuclear genome. This transmission strategy has been suggested to weaken the selective benefits of host alleles repressing the transposition of specific TE variants. On the other hand, the elevated rates of TE transposition and high incidences of deleterious mutations observed during the rare cases of horizontal transfers of TE families between species could create at least a transient process analogous to the influence of horizontally transmitted pathogens. Here, we formally address this analogy, using empirical and theoretical analysis to specify the mechanism of how host–TE interactions may drive the evolution of host genes. We found that host TE-interacting genes actually have more pervasive evidence of adaptive evolution than immunity genes that interact with nongenomic pathogens in Drosophila. Yet, both our theoretical modeling and empirical observations comparing Drosophila melanogaster populations before and after the horizontal transfer of P elements, which invaded D. melanogaster early last century, demonstrated that horizontally transferred TEs have only a limited influence on host TE-interacting genes. We propose that the more prevalent and constant interaction with multiple vertically transmitted TE families may instead be the main force driving the fast evolution of TE-interacting genes, which is fundamentally different from the gene-for-gene interaction of host–pathogen coevolution.
HOST–PATHOGEN interactions affect the population dynamics and the evolutionary trajectories of both species. In particular, coevolutionary dynamics will affect the pattern of polymorphism and divergence of genes underlying host–parasite interactions either through an arms race (Van Valen 1973; Dawkins and Krebs 1979) or through balancing selection (Haldane 1949; Hughes et al. 1990; Takahata et al. 1992; Hughes and Yeager 1998; Rose et al. 2004). In either case, accelerated rates of protein evolution and/or recurrent adaptive substitutions are expected in genes engaged in these interactions, which has been observed in both immunity genes (Schlenke and Begun 2003; Jiggins and Kim 2007; Sackton et al. 2007; Obbard et al. 2009b) and antivirus siRNA genes (Obbard et al. 2006, 2009a,b, 2011) in Drosophila.
Transposable elements (TEs) are ubiquitous genomic constituents that increase their copy number (the number of TEs in a host genome) by replicative transposition (copying to new genomic locations). Like Drosophila, most host genomes are occupied by multiple TE families, which are defined by sequence similarity (homology) and by replication and transposition mechanisms. Even though incidences of potentially adaptive individual TE insertions with high population frequencies have been reported (Daborn et al. 2002; Aminetzach et al. 2005; González et al. 2008; Schmidt et al. 2010), the mutagenic effects of TE insertions are typically deleterious because they disrupt gene structure and function (Finnegan 1992) and can lead to deleterious chromosomal rearrangement (Montgomery et al. 1987, 1991; Langley et al. 1988). Supporting this, TEs in natural populations of Drosophila are generally found in intergenic regions (Aquadro et al. 1986; Kaminker et al. 2002; Bergman et al. 2006) and present at low population frequencies (reviewed in Charlesworth and Langley 1989; Le Rouzic and Deceliere 2005; Lee and Langley 2010). Drosophila melanogaster strains with a larger copy number of several TE families surveyed also have lower fitness (Mackay 1989; Pasyukova et al. 2004).
Because of these deleterious fitness impacts of TEs on their hosts, the interaction between host and TEs has been suggested to be analogous to an arms race between host and other more familiar pathogens (Kidwell and Lisch 2001; Aravin et al. 2007; Siomi et al. 2008; Obbard et al. 2009a; Blumenstiel 2011). Surprisingly, there has been no systematic comparison of the evolution of host genes interacting with TEs and those interacting with pathogens to examine this analogy. Furthermore, no specific models for the evolutionary impact of antagonistic interactions between host and TEs on protein evolution have been analyzed.
Due to the horizontal transmission of pathogens, there can be strong associations between specific host alleles and the level of pathogen load, leading to large selective benefits for host alleles that can effectively suppress pathogen infections. On the contrary, TE families are inherited vertically as part of the host parental genome. Vertical inheritance of TE insertions, random mating, and recombination lead to weak associations between selectively favored, TE-suppressive host variants and any net reduction in TE replication. Indeed, in organisms with random mating and weak linkage disequilibrium (e.g., Drosophila), a host variant suppressing a single TE family will enjoy only weak adaptive advantage (Charlesworth and Langley 1986). If the suppression of TE transposition involves specific associations between host alleles and TE variants, this is unlikely to drive the fast evolution of host genes involved in TE suppression.
In rare cases, TEs are observed to have been horizontally transferred between host species (reviewed by Silva et al. 2004; Loreto et al. 2008; Schaack et al. 2010). In these cases, the evolutionary impacts of TEs on the host may be more analogous to those of nongenomic pathogens. During the spread of a newly invaded TE family, the transposition rate can be exceptionally high (Kidwell et al. 1988; Good et al. 1989; reviewed in Silva et al. 2004). This is usually associated with a high incidence of deleterious insertions and sterilities, imposing a strong selective pressure on the host. However, the spread of horizontal transfer of TE families to all genomes of the new host species is found to happen on a short timescale, generally within thousands of generations (Daniels et al. 1990; Simmons 1992). After the initial horizontal transfer, copies of the new TE family appear to follow the typical TE mode of vertical transmission. A quantitative analysis of the hypothesis that horizontal transferred TE families are able to impose strong enough selection to elicit specific adaptive evolution in host genes remains unaddressed.
One of the best-studied examples of a TE horizontal transfer is the P element (reviewed in Engels 1997; Rio 2002), which invaded D. melanogaster from the distantly related D. willistoni <100 years ago (Brookfield et al. 1984; Anxolabéhère et al. 1988; Daniels et al. 1990; Clark et al. 1994). While virtually all more recently surveyed D. melanogaster populations have P elements, D. melanogaster strains collected early last century, and maintained in the laboratory since that time, are still free of P elements (Kidwell et al. 1983; Anxolabéhère et al. 1988). Matings between females lacking P elements (the M strains, said to have M cytotype) and males with P elements (the P strains, said to have P cytotype) result in progeny with “hybrid dysgenesis” syndrome, which consists of high rates of male recombination, sterility, mutation, and chromosomal rearrangement (Hiraizumi 1971; Kidwell et al. 1973, 1977; Engels 1979). These dysgenic effects are attributed to the high rate of P-element transposition (Bingham et al. 1982; Rubin et al. 1982). P elements of D. melanogaster thus provide a rare opportunity to investigate the evolutionary impacts of horizontally transferred TE families on the host genes interacting with them.
Our systematic comparisons demonstrate that the molecular evolution of TE-interacting genes exhibits comparable evidence of recurrent adaptive fixations to that of genes mediating the interactions between Drosophila and horizontally transferred pathogens. We took two approaches to investigate whether horizontally transferred TEs have discernable selective impacts and can contribute to the observed long-term adaptive evolution of TE-interacting genes. We developed and analyzed a model of TE invasion after horizontal transfer and we used the recently invaded P element as a system to empirically contrast the genetic differentiation of candidate host genes between D. melanogaster populations before and after P-element invasions. Both our analytical modeling and empirical observations suggest that the selective pressure imposed by horizontally transferred TE families is limited. We proposed a hypothesis other than the gene-for-gene host–TE coevolutionary model to explain our observations.
Materials and Methods
D. melanogaster variation of post–P-element invasion population and Drosophila divergence data
We used the release 1.0 assembly of 44 D. melanogaster genome sequences generated by the Drosophila Population Genomic Project [DPGP, www.dpgp.org (Langley et al. 2012)]. The DPGP data consist of 7 strains from Malawi, Africa, and 37 strains from North Carolina, which were all collected after P-element invasions and have P elements. Coding regions of each candidate gene were defined according to the D. melanogaster reference genome annotation (version 5.16) and parsed out from the above genomic sequences, using Perl scripts. Bases with quality scores <30 and regions that appeared as identical by descent (IBD) or exhibited residual heterozygosity (Langley et al. 2012) were treated as missing data. We also removed alleles when >50% of the bases were missing data. To compare the evolution of candidate genes with immunity genes, we used 236 immunity genes included in Sackton et al. (2007) and follow the categorization of the immunity genes of this previous study. Retrieval of coding sequences and population genetics analysis (see below) of these immunity genes were the same as those of candidate genes.
D. simulans (Begun et al. 2007) and D. yakuba (Clark et al. 2007) alleles were retrieved according to D. melanogaster coordinates from the DPGP multispecies alignment, which includes D. melanogaster, D. simulans, D. yakuba, and D. erecta genomes (Langley et al. 2012). When a D. simulans allele was used as an outgroup in statistical inferences (see below), we chose the allele with the smallest proportion of missing data and alignment gaps (or highest base coverage) among the mosaic D. simulans genome (Clark et al. 2007) and six D. simulans genomes (Begun et al. 2007). For Ago3, all D. simulans alleles from the above seven genomes had low coverage. We used D. melanogaster exon sequences of Ago3 to blast against the trace reads generated from the D. simulans population genomics project (Begun et al. 2007) and assembled retrieved reads, using the codoncode aligner (http://www.codoncode.com/aligner/). We removed reads whose alignment outside exons was incongruent with the majority of other reads. Consensus sequence was called if there were at least three reads covering the region.
Population genetics and molecular evolution analysis of candidate genes
π was estimated as average pairwise differences (Nei 1987). Lineage-specific divergences were estimated by maximum likelihood, using PAML version 4 (Yang 2007) on the branch leading to D. melanogaster and D. simulans, with D. yakuba as the outgroup. Genes with <100 sites included in the PAML analysis or with a dS value <0.0001 were excluded. We used both D. melanogaster and D. simulans within-species polymorphism to carry out McDonald–Kreitman tests [two-species McDonald–Kreitman (MK) test (McDonald and Kreitman 1991)]. Codons having more than two states within species were removed. Codons that are both polymorphic within species and divergent between species were counted as both polymorphism and divergence. We used the mutational path minimizing the number of nonsynonymous differences. P-values of MK tests were determined by Fisher’s exact tests (FET). For genes without D. simulans variation (Ago3 and mael), we carried out one-species MK tests, using D. melanogaster polymorphism and the D. simulans allele with highest base coverage to count the number of fixations. For candidate genes with significant MK test results, we used Pfam (Finn et al. 2009) with an E-value cutoff of 10−5 to annotate known domains and perform a MK test on each annotated domain. We estimated average α (the proportion of amino acid fixations driven by positive selection) for different classes of genes, using Welch (2006) with default parameters. We also used the likelihood-ratio test to investigate whether a single-α or a two-α model better fits the data when we included both candidate and immunity/all genes in the analysis, testing whether there are differences in α between classes of genes.
When comparing population genetic estimates or statistics of candidate genes with genome-wide distribution, we used a conservative gene set used by DPGP (Langley et al. 2012), which consists of genes whose D. melanogaster alleles of DPGP data and outgroup alleles all have the same gene model as the reference annotations (canonical initiation codon, splice junction, and termination codon).
D. melanogaster variation data before P-element invasions
Variation data from pre–P-element D. melanogaster populations were collected by resequencing the coding regions of candidate genes from laboratory-maintained strains collected before the 1960s and previously identified as M strains (Kidwell et al. 1983). PCR with primers amplifying the second exon of P-element transposase (O’Hare and Rubin 1983; Clark et al. 1998) was used to confirm the absence of P elements. To have comparable sampling locations to those of the DPGP data, we first used four African strains (CA1, KSA2, KSA3, and KSA4) and four North and South Carolina strains (Wild 10E, Wild 11A, Wild 11C, and Wild 11D) in the initial survey for unusual temporal differentiation. Five candidate genes (Irbp, squ, Spn-E, Krimp, and Hen1) showed significant differentiation between alleles from the above eight strains and post–P-element alleles from DPGP data. Additional alleles were then collected on these five genes, using 4 Asian, 5 European, 1 South American, and 11 North American strains. Details of D. melanogaster strains used in this study can be found in supporting information, File S1, Table S1. For control genes near Hen1, we sequenced only the 15 North American M strains.
Despite exhaustive efforts to locate M strains collected before P-element horizontal transfer, the available pre–P-element strains are far from ideal. Within North America, where there is the largest set of pre–P-element strains, spatial locations are disperse: strains were collected on the West and the East Coast as well as in the northern and southern latitudes. Latitudinal clines for various loci have been observed in D. melanogaster (reviewed in Schmidt et al. 2005; Hoffmann and Weeks 2007). Unfortunately, this may increase the possibility of falsely concluding that there is temporal genetic differentiation while the actual difference would be a result of the geographic heterogeneity of between-time samples. Accordingly, we also examined other aspects of the data (heterozygosity and haplotypes) in addition to temporal differentiation and included control genes near candidate genes showing strong temporal differentiation before drawing conclusions (see below).
DNA samples were prepared from 30 flies from each D. melanogaster M strain. PCR and sequencing primers for coding regions of candidate genes were designed using the Primer3 program (Rozen and Skaletsky 2000) and the D. melanogaster reference genome. PCR products were purified and sequenced directly. Most of the D. melanogaster strains used in this study have been maintained in the laboratory for >50 years and are highly inbred. For targeted regions with residual heterozygosity within lines, PCR products were cloned with TOPO-TA cloning (Invitrogen, Carlsbad, CA) and one clone of each PCR product was sequenced.
Analysis of temporal differentiation between pre-P and post–P-element populations
Sequences of pre–P- and post–P-element populations were aligned using ClustalW (Chenna et al. 2003), followed by manual curation. We estimated Fst according to Weir and Cockerham (1984) and used permutations to determine the P-values (Hudson et al. 1992). To further test for unusual haplotypic structures, we used methods based on the frequency of major haplotypes (Hudson et al. 1994), the number of haplotypes, and the heterozygosity of haplotypes (Depaulis and Veuille 1998) and used coalescent simulation without recombination to determine the P-values (Hudson 2002). Although these three haplotype-based tests are related conceptually, their power to detect deviations from the same null hypothesis varies with the alternatives and thus is not fully redundant (Depaulis and Veuille 1998). It is worth noting that the significance of haplotype tests was based on coalescent simulations without recombination, which is especially conservative, and our observation of strong evidence for a 20-kb haplotypic structure around Hen1 is highly unusual (see Results).
For analysis of the upstream and downstream regions of Hen1, we used a sliding window of size 5 kb incremented every 100 bp to depict the divergence between D. melanogaster and D. simulans, the polymorphism within D. simulans, and the polymorphism of D. melanogaster African and North American populations separately.
Analytical model for the dynamics of host alleles that can reduce transposition during the spread of an invading transposable element such as the P element
We considered a panmictic population of diploid hosts with infinite population size and initially devoid of the invading TE. After invasion of the TE, each host genome carries a number (n ≥ 0) of TEs and zero, one, or two suppressive alleles at the host locus of interest. We assumed that there is complete linkage equilibrium among the invading TEs, and the TEs and the host resistance locus. The low frequency of virtually all TE insertions in natural populations of D. melanogaster (Aquadro et al. 1986; Montgomery et al. 1987; Charlesworth and Langley 1989; Lee and Langley 2010) coupled with the small scale of linkage disequilibrium between SNPs with more intermediate frequency in D. melanogaster (Miyashita and Langley 1988; Long et al. 1998; Langley et al. 2000, 2012) ensures that the magnitude of linkage disequilibrium among elements is small and our assumption is reasonable. The assumption of no linkage disequilibrium and low TE frequencies motivates the further modeling of distribution of TE copy number as Poisson. The use of the Poisson distribution of TE copy number among individuals of a population has been developed as an approximation and successfully applied in theoretical analyses of TEs (Charlesworth and Charlesworth 1983; Langley et al. 1983). As mentioned above, it has an empirical basis in studies of specific TE families and surveys of genomic variation (reviewed in Charlesworth and Langley 1989). The transposition of TEs was also modeled following a Poisson process.
Results
Candidate genes
We took a candidate gene approach and focused on two groups of genes (Table 1). The first group consists of genes known to be involved in the piwi-RNA (piRNA) biogenesis [hereafter termed piRNA genes (reviewed in Klattenhoff and Theurkauf 2008)]. piRNA is a class of small RNAs that has been implicated in TE transposition rate regulation. Generation of piRNAs is disrupted in piRNA gene mutants (Aravin et al. 2004; Lim and Kai 2007; Pane et al. 2007 Klattenhoff et al. 2009; Li et al. 2009), leading to elevated expression levels of >10 TE families (Aravin et al. 2004; Vagin et al. 2004; Lim and Kai 2007; Pane et al. 2007; Klattenhoff et al. 2009; Li et al. 2009; Lu and Clark 2010). We also included vasa (vas), whose mutant phenotypes also include piRNA generation disruptions and elevated transcription of several TE families (Vagin et al. 2004; Lim and Kai 2007). piRNAs corresponding to P-element sequences have been observed in P strains but not in M strains, suggesting P elements are a common target of the piRNA pathway (Brennecke et al. 2008).
Information of candidate genes
| Category | Flybase ID | Symbol | Gene name | Chra | CDs lengthb | Gene functions |
|---|---|---|---|---|---|---|
| piRNA genes | FBgn0004872 | piwi | piwi | 2L | 2532 | piRNA generation |
| FBgn0000146 | aub | aubergine | 2L | 2601 | piRNA generation | |
| FBgn0250816 | AGO3 | Argonaute 3 | 3L | 2604 | piRNA generation | |
| FBgn0041164 | armi | armitage | 3L | 3825 | RNA helicase | |
| FBgn0003483 | spn-E | spindle E | 3R | 4305 | RNA helicase | |
| FBgn0002652 | squ | squash | 2L | 726 | Nuclease | |
| FBgn0261266 | zuc | zucchini | 2L | 762 | Nuclease | |
| FBgn0033686 | Hen1 | PIMET/DmHen1 | 2R | 1176 | piRNA methyltransferase | |
| FBgn0016034 | mael | maelstrom | 3L | 1389 | Nuage component | |
| FBgn0034098 | krimp | krimper | 2R | 2241 | Nuage component | |
| FBgn0262526 | vas | vasa | 2L | 661 | Nuage component | |
| FBgn0004400 | rhi | rhino | 2R | 1257 | HP1 paralog, heterochromatin binding | |
| P-element–specific genes | FBgn0014870 | Psi | P-element somatic inhibitor | 2R | 2394 | P-element somatic inhibitor; mRNA splicing factor |
| FBgn0004838 | Hrb27C | Heterogeneous nuclear ribonucleoprotein at 27C | 2L | 1266 | mRNA splicing factor | |
| FBgn0011774 | Irbp | Inverted repeat-binding protein | 3R | 1897 | Recombination repair protein | |
| FBgn0041627 | Ku80 | Ku80 | 2L | 2100 | Recombination repair protein |
chromosome
length of coding regions (bp)
| Category | Flybase ID | Symbol | Gene name | Chra | CDs lengthb | Gene functions |
|---|---|---|---|---|---|---|
| piRNA genes | FBgn0004872 | piwi | piwi | 2L | 2532 | piRNA generation |
| FBgn0000146 | aub | aubergine | 2L | 2601 | piRNA generation | |
| FBgn0250816 | AGO3 | Argonaute 3 | 3L | 2604 | piRNA generation | |
| FBgn0041164 | armi | armitage | 3L | 3825 | RNA helicase | |
| FBgn0003483 | spn-E | spindle E | 3R | 4305 | RNA helicase | |
| FBgn0002652 | squ | squash | 2L | 726 | Nuclease | |
| FBgn0261266 | zuc | zucchini | 2L | 762 | Nuclease | |
| FBgn0033686 | Hen1 | PIMET/DmHen1 | 2R | 1176 | piRNA methyltransferase | |
| FBgn0016034 | mael | maelstrom | 3L | 1389 | Nuage component | |
| FBgn0034098 | krimp | krimper | 2R | 2241 | Nuage component | |
| FBgn0262526 | vas | vasa | 2L | 661 | Nuage component | |
| FBgn0004400 | rhi | rhino | 2R | 1257 | HP1 paralog, heterochromatin binding | |
| P-element–specific genes | FBgn0014870 | Psi | P-element somatic inhibitor | 2R | 2394 | P-element somatic inhibitor; mRNA splicing factor |
| FBgn0004838 | Hrb27C | Heterogeneous nuclear ribonucleoprotein at 27C | 2L | 1266 | mRNA splicing factor | |
| FBgn0011774 | Irbp | Inverted repeat-binding protein | 3R | 1897 | Recombination repair protein | |
| FBgn0041627 | Ku80 | Ku80 | 2L | 2100 | Recombination repair protein |
chromosome
length of coding regions (bp)
The second group of candidates contains genes known to interact with P elements via other pathways. The double-stranded breaks left after P-element transpositions in the germline are repaired by host recombination–repair machinery of heterodimers formed by Irbp and Ku80 (Rio and Rubin 1988; Beall et al. 1994). Double-stranded breaks generated by other DNA-based TEs may be repaired using a similar mechanism. Splicing factor Psi is shown to specifically bind to the 5′-splice site of the P-element third intron, suppressing the proper splicing of mRNA of P-element transposase and thereby repressing the somatic transposition of P elements (Siebel and Rio 1990; Siebel et al. 1992, 1994, 1995; Adams et al. 1997). Hrb27C is a nuclear protein that forms an mRNA splicing complex with Psi (Siebel et al. 1992, 1994).
Genes interacting with transposable elements show evidence of positive selection
Recurrent directional selection can lead to an accelerated rate of protein divergence relative to synonymous site divergence. We used maximum-likelihood methods (Yang 2007) to estimate the dN/dS ratios on both the D. melanogaster and the D. simulans branches with D. yakuba as an outgroup. We then rank dN/dS estimates of candidate genes among other D. melanogaster annotated genes (see Table 2 for dN/dS ratio and Table S2 for separate dN and dS values). Consistent with a previous report (Vermaak et al. 2005), rhi has a dN/dS ratio that is larger than one and is among the fastest-evolving genes in D. melanogaster (dN/dS = 1.415, rank = 0.31% genome-wide). Two nuage component genes, krimp and mael, both rank in the top 5% genome-wide while aub and zuc are among top 10%. Estimates of the dN/dS ratios on the D. simulans branch, except for that of zuc, gave similar results. Our inferences are generally in agreement with previous reports that used a branch-site model to detect recurrent amino acid substitutions on the phylogeny of 12 Drosophila species (Heger and Ponting 2007; Kolaczkowski et al. 2011). Even though Spn-E was identified as the RNA interference gene showing the most extensive signal of recurrent adaptation on the phylogenetic tree (Heger and Ponting 2007; Kolaczkowski et al. 2011), the branch leading to D. melanogaster was not significant (Kolaczkowski et al. 2011). The differences between studies are not surprising given the fundamental differences in methodology (comparing relative rates of amino acid substitutions of entire coding sequences among all genes vs. identification of a subset of sites or branches that recurrently substituted across the phylogeny).
Linage-specific relative rates of protein evolution
| mel | sim | |||
|---|---|---|---|---|
| Gene | dN/dS | Percentilea | dN/dS | Percentilea |
| AGO3 | 0.261 | 12.67 | 0.265 | 18.79 |
| armi | 0.297 | 10.22 | 0.391 | 10.88 |
| aub | 0.382 | 6.60 | 0.530 | 6.31 |
| Hen1 | 0.246 | 13.64 | 0.266 | 18.66 |
| Hrb27C | 0.176 | 21.99 | 0.019 | 82.02 |
| Irbp | 0.101 | 38.42 | 0.164 | 32.83 |
| krimp | 0.471 | 4.71 | 0.964 | 2.09 |
| Ku80 | 0.181 | 21.28 | 0.245 | 20.80 |
| mael | 0.902 | 1.05 | 0.491 | 7.17 |
| piwi | 0.081 | 45.87 | 0.194 | 27.71 |
| Psi | 0.091 | 42.12 | 0.027 | 78.55 |
| rhi | 1.415 | 0.31 | 0.508 | 6.77 |
| spn-E | 0.219 | 16.28 | 0.281 | 17.42 |
| squ | 0.240 | 14.25 | 0.338 | 13.72 |
| vas | 0.243 | 14.05 | 0.306 | 15.63 |
| zuc | 0.359 | 7.48 | 0.207 | 25.73 |
dN/dS for each candidate gene was ranked among 9172 (D. melanogaster) and 9051 (D. simulans) genes that have PAML results. Candidate genes that ranked among the top 10% among all the genes with PAML results are in boldface type.
| mel | sim | |||
|---|---|---|---|---|
| Gene | dN/dS | Percentilea | dN/dS | Percentilea |
| AGO3 | 0.261 | 12.67 | 0.265 | 18.79 |
| armi | 0.297 | 10.22 | 0.391 | 10.88 |
| aub | 0.382 | 6.60 | 0.530 | 6.31 |
| Hen1 | 0.246 | 13.64 | 0.266 | 18.66 |
| Hrb27C | 0.176 | 21.99 | 0.019 | 82.02 |
| Irbp | 0.101 | 38.42 | 0.164 | 32.83 |
| krimp | 0.471 | 4.71 | 0.964 | 2.09 |
| Ku80 | 0.181 | 21.28 | 0.245 | 20.80 |
| mael | 0.902 | 1.05 | 0.491 | 7.17 |
| piwi | 0.081 | 45.87 | 0.194 | 27.71 |
| Psi | 0.091 | 42.12 | 0.027 | 78.55 |
| rhi | 1.415 | 0.31 | 0.508 | 6.77 |
| spn-E | 0.219 | 16.28 | 0.281 | 17.42 |
| squ | 0.240 | 14.25 | 0.338 | 13.72 |
| vas | 0.243 | 14.05 | 0.306 | 15.63 |
| zuc | 0.359 | 7.48 | 0.207 | 25.73 |
dN/dS for each candidate gene was ranked among 9172 (D. melanogaster) and 9051 (D. simulans) genes that have PAML results. Candidate genes that ranked among the top 10% among all the genes with PAML results are in boldface type.
We used the MK test (McDonald and Kreitman 1991) to detect genes whose evolution does not follow the neutral model of evolution. Rejection of the null hypothesis due to the presence of more than the expected number of amino acid fixations has been interpreted as evidence supporting adaptive protein evolution. To have greater statistical power, we considered polymorphisms from both D. melanogaster (Langley et al. 2012) and D. simulans (Begun et al. 2007). We identified aub and armi as significant while spn-E, krimp, vas, and Ku80 were marginally significant (Table 3). All of these genes rejected the null hypothesis of neutral evolution in the direction of an excess of amino acid divergence (Table 3), consistent with a history of positive selection acting on these genes. To further localize protein domains showing signals of positive selection, we performed MK tests on Pfam-annotated domains. We found the PAZ domain of aub (P-value = 0.011) and the DEAD domain of vas (P-value = 0.0007) showed significant enrichment of amino acid substitutions. When considering only within D. melanogaster polymorphism, we did not find evidence of adaptive evolution for spn-E, vas, and Ku80 (Table 3), perhaps due to a generally lower level of variation in D. melanogaster than in D. simulans (Aquadro et al. 1988; Andolfatto 2001; Andolfatto et al. 2011) and thus lower statistical power.
McDonald–Kreitman test on candidate genes
| Two-species MK testa | mel MK testb | |||
|---|---|---|---|---|
| Gene | No. codons | P-value | No. codons | P-value |
| AGO3 | NA | NAc | 689 | 0.351 |
| armi | 1186 | <0.001 | 1231 | <0.001 |
| aub | 835 | <0.001 | 855 | <0.001 |
| Hen1 | 389 | 0.837 | 391 | 1.000 |
| Hrb27C | 421 | 0.095 | 421 | 0.532 |
| Irbp | 628 | 0.189 | 628 | 0.069 |
| krimp | 712 | 0.020 | 690 | 0.001 |
| Ku80 | 694 | 0.012 | 699 | 0.156 |
| mael | NA | NA | 459 | 0.390 |
| piwi | 837 | 0.732 | 843 | 0.267 |
| Psi | 796 | 0.189 | 797 | 1.000 |
| rhi | 413 | 0.396 | 413 | 0.535 |
| spn-E | 1427 | 0.021 | 1433 | 0.731 |
| squ | 130 | 0.493 | 233 | 1.000 |
| vas | 634 | 0.022 | 639 | 0.151 |
| zuc | 253 | 1.000 | 253 | 1.000 |
MK tests with significant p-values and positive α are in bold type.
MK tests using both D. melanogaster and D. simulans polymorphism (see Materials and Methods).
MK tests using only D. melanogaster polymorphism.
Not available due to lack of D. simulans polymorphism data.
| Two-species MK testa | mel MK testb | |||
|---|---|---|---|---|
| Gene | No. codons | P-value | No. codons | P-value |
| AGO3 | NA | NAc | 689 | 0.351 |
| armi | 1186 | <0.001 | 1231 | <0.001 |
| aub | 835 | <0.001 | 855 | <0.001 |
| Hen1 | 389 | 0.837 | 391 | 1.000 |
| Hrb27C | 421 | 0.095 | 421 | 0.532 |
| Irbp | 628 | 0.189 | 628 | 0.069 |
| krimp | 712 | 0.020 | 690 | 0.001 |
| Ku80 | 694 | 0.012 | 699 | 0.156 |
| mael | NA | NA | 459 | 0.390 |
| piwi | 837 | 0.732 | 843 | 0.267 |
| Psi | 796 | 0.189 | 797 | 1.000 |
| rhi | 413 | 0.396 | 413 | 0.535 |
| spn-E | 1427 | 0.021 | 1433 | 0.731 |
| squ | 130 | 0.493 | 233 | 1.000 |
| vas | 634 | 0.022 | 639 | 0.151 |
| zuc | 253 | 1.000 | 253 | 1.000 |
MK tests with significant p-values and positive α are in bold type.
MK tests using both D. melanogaster and D. simulans polymorphism (see Materials and Methods).
MK tests using only D. melanogaster polymorphism.
Not available due to lack of D. simulans polymorphism data.
Genes interacting with transposable elements show more prevalent evidence of positive selection than immunity genes
The fundamental differences in the mechanism of transmission between TE families and other nongenomic pathogens raised the question regarding the relative intensity of evolutionary impacts they imposed on hosts. To address this question, we compared the proportion of genes exhibiting evidence of positive selection between our candidate genes and immunity genes, using the same population genetic and molecular evolution analysis.
We found 5 of 12 piRNA genes (41.67%) have D. melanogaster dN/dS estimates among the top 10% genome-wide, which is significantly greater than that of immunity genes (24 of 214 genes, 11.21%, FET P = 0.01, Figure 1A and Table S2). Studies have found that the rates of adaptive evolution vary with respect to the function of immunity genes (Sackton et al. 2007; Obbard et al. 2009b; reviewed in Lazzaro 2008). We categorized immunity genes into “recognition,” “signaling,” and “effector” categories and still found piRNA genes have a higher proportion of fast-evolving genes than all categories of immunity genes. However, we found statistical significance only when comparing piRNA genes to either signaling or effector categories (Figure 1A). Comparisons considering all candidate genes (both piRNA genes and genes known to interact with P elements; Figure 1A) or focusing on relative rates of amino acid evolution on the D. simulans lineage (data not shown) are consistent with our findings using piRNA pathway gene evolution along the D. melanogaster lineage.
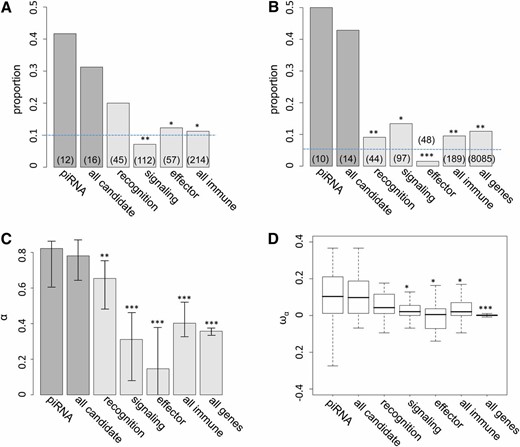
Proportion of candidate and immunity genes showing evidence of positive selection. (A) Proportions of candidate and immunity genes having D. melanogaster dN/dS among the top 10% genome-wide. (B) Proportions of candidate genes, immunity genes, and all genes having significant two-species MK tests (P-value < 0.05) and positive α. Dashed lines are the expectations assuming uniformity. The Number of genes with MK test and PAML results in each category is shown in parentheses. (C and D) Maximum-likelihood estimates of averaged α (C) and boxplots (25th, 50th, and 75th percentiles) of estimated ωα (D) for different classes of genes. Error bars represent the 95% bootstrapping intervals around each estimate. Significant comparisons between piRNA genes and other classes of genes are denoted by * (P-value <0.05), ** (P-value <0.01), and *** (P-value <0.001). Comparisons of proportions (A and B) were based on Fisher’s exact test, comparisons of maximum-likelihood estimated α (C) were based on permutations, and comparisons of ωα (D) were based on a Mann–Whitney U-test.
We observed even more dramatic enrichment in the proportion of genes showing evidence of recurrent adaptive protein evolution (rejection of MK tests with overabundant amino acid fixation) of piRNA genes (5 of 10 genes, 50%) than that of immunity genes (18 of 180 genes, 9.52%, FET P-values = 0.002; Figure 1B) and the genome-wide proportion (888 of 8085 genes, 10.98%, FET P-values = 0.003). Signaling genes have the largest proportion of genes showing adaptive evolution among three immunity gene categories (13 of 97 genes, 10.92%), which is still significantly lower than that of piRNA genes or all candidate genes (FET P-values = 0.012). We found a consistent pattern when including all candidate genes in the comparisons.
We used the maximum-likelihood method proposed by Welch (2006) to formally test whether averaged α (the proportion of amino acid substitution fixed by positive selection) is different between classes of genes. When comparing either “piRNA vs. immunity genes” or “piRNA vs. all genes,” we found a two-α model consistently fitted the data better [Λ = 446.46 (vs. immunity genes) and 613.82 (vs. all genes); P < 0.001 for both comparisons]. Comparisons between piRNA genes and a specific subset of immunity genes were also highly significant (P < 0.001). Permutation analysis also found the maximum-likelihood estimated α of piRNA genes (α = 0.82) is significantly higher than that of immunity genes (α = 0.40 for all immunity genes) and all genes (α = 0.36), except for recognition immunity genes (Figure 1C). Again, comparisons considering all candidate genes gave consistent results. Another estimate of adaptive protein evolution ωα, the rate of adaptive substitution relative to the rate of neutral substitutions (Gossmann et al. 2010), supports the same conclusion based on α (Figure 1D). Either piRNA genes or all candidate genes have larger ωα than immunity genes except for recognition immunity genes (Mann–Whitney U-test, P < 0.05) and all genes (Mann–Whitney U-test, P < 0.001), suggesting that the larger α of TE-interacting genes is not due to differences in proportion of effectively neutral mutations.
Horizontal transfer of TE families does not impose enduringly strong selection on host beneficial variants
We used a deterministic model to analyze the dynamics of host alleles that can reduce the transposition rate of a newly horizontally transferred TE family by a fixed proportion (referred to as “beneficial allele”) during the spread of that TE family in a panmictic host population (see Materials and Methods and Appendix for model details). We specifically considered the well-documented horizontal transfer of P elements, which provided the biological context needed to specify details of the model. The model considered both epistatic selections against increases in P-element copy number (Charlesworth and Charlesworth 1983; Dolgin and Charlesworth 2006, 2008) and host sterility caused by too many double-stranded chromosomal breaks generated through P-element transposition. We set individuals with more than nHD new P-element transpositions (and thus double-stranded breaks) to be completely sterile. This sterility effect would most likely occur in the M(female) × P(male) hybrid dysgenic cross, as the transposition rate of P elements in the dysgenic cross (u0) is several orders of magnitude higher than in the nondysgenic cross (u1) (Eggleston et al. 1988). The host beneficial allele will especially enjoy strong fitness advantages in the dysgenic crosses because hosts with this allele will be more likely to have fewer than nHD double-stranded breaks and therefore higher expected fertility. Of course, the degree of sterility elicited by P-element transposition can be a continuous phenotype. The usage of the truncation selection model will maximize the selective benefit of a host allele that can reduce the transposition rate of P element, making our overall conclusion conservative.
The increase in frequency of the host beneficial allele (l) is dependent on how fast P elements spread through the population and, during their spread, how likely hybrid dysgenesis is to occur. We found that the spread of P elements is fast in most cases (Figure 2A for u0 = 1 and nHD = 5; see Appendix for discussions of other cases tested), a finding that is consistent with several caged experiments introducing P elements into M strain populations (Kidwell et al. 1988; Good et al. 1989). This quick spread leads to the host beneficial allele having selective advantage only during a narrow period (Figure 2B). We found that the largest selective advantage occurs when the proportion of P cytotype individuals (r) is intermediate and the probability of a hybrid dysgenic cross is high (Figure 2C). This is also reflected in the dynamics of l, which has a phase of rapid increase followed by a longer phase of slow increase (Figure 2D).
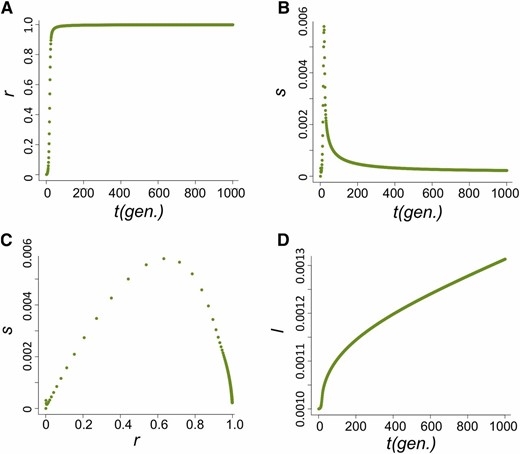
The dynamics of the host population during the spread of P elements. (A–D) The change of proportion of P-cytotype individuals, r (A); the selection coefficient against the nonbeneficial host allele, s (B); the relationship between s and r (C); and the allele frequency of the host beneficial allele, I (D) when u0=1 and nHD=5.
The combined effects of u0 and nHD had the most notable influence on the dynamics of the host beneficial allele. With increased nHD, it takes fewer generations until the P element is found in nearly all genomes (r > 0.99) in the population (t0.99) (Figure 3A) and host beneficial allele frequency at generation 1000 (l1000) because of the decreased duration during which the probability of hybrid dysgenesis is high (Figure 3B). Generally, P elements spread faster when u0 is larger (except for nHD = 2, see below). Yet, the probability of hybrid dysgenesis is also higher, leading to larger l1000 (Figure 3, A and B). For all cases examined except one (see Appendix for all parameters tested), the difference between l0 and l1000 (<2%) would hardly be detected with the regular size of samples.
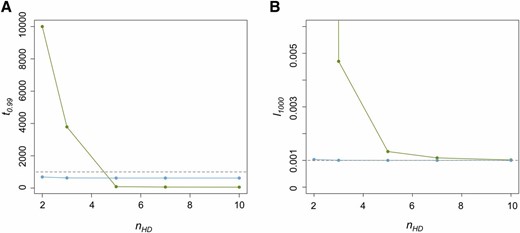
The influences of u0 and nHD on the time for near fixation of P elements and host beneficial allele frequency. (A) The generations until the P element is nearly fixed in the population (t0.99) for different u0 and nHD. Green dots are when u0 = 1 and blue dots are when u0 = 10−1. The dashed line denotes generation 1000. (B) The allele frequencies of the host beneficial allele (l1000) at generation 1000 for different u0 and nHD. The dashed line denotes 0.001, which equals l0.
The only exception is when u0 = 1 and nHD=2 in which the temporal Fst can be as large as 0.15. However, it takes >10,000 generations for the P element to become nearly fixed in the population due to the still high probability of hybrid dysgenesis even when the majority of the hosts have P cytotype. This is much longer than the timescale of actual P-element spread. Furthermore, the tolerance of nonprogrammed double-stranded breaks in the germline can be much higher than this threshold (nHD = 2; Orsi et al. 2010).
It is worth noting that we modeled the distribution of P-element copy number as approximately Poisson. The derivation and previous application of the Poisson approximation were focused on situations where the TE population is near equilibrium and the mean copy number of TEs is much larger than one (Charlesworth and Charlesworth 1983; Langley et al. 1983). However, the critical aspect of our analytical modeling here is the initial phase of the invasion of a new TE family (the P element), which may lead to a copy number distribution different from Poisson. We thus used Monte Carlo simulations (see File S1 for details of simulations) to investigate how the distribution of TE copy number reaches a Poisson distribution. We found that soon after the P cytotype is common in the population, the TE copy number distribution is close to Poisson (Figure S5 in File S1). More importantly, these simulations show that the estimated change of host beneficial allele frequency from the analytical approximation is within 2% of the simulated results (Figure S3 and Figure S4 in File S1), supporting our overall conclusions.
Recent horizontal transfer of the P element does not have widespread evolutionary impacts on candidate genes
To empirically investigate the short-term evolutionary impacts of TE horizontal transfer on hosts, we compared the genetic differentiation between pre–P-element invasion (pre-P) and current (post-P) populations (temporal differentiation). For five candidate genes that showed strong temporal differentiation in our initial survey with a smaller number of M strains (Irbp, krimp, Hen1, spn-E, and squ; see Materials and Methods and Table S3), only Hen1 and squ still showed highly significant temporal differentiation with increased size of pre–P-element samples (Table 4). However, we observed strong genetic differentiation between North American and African contemporary post-P populations for our candidate genes (geographic differentiation, Table 4). If the geographic differentiation of the current population was also present in the pre-P population, the wide geographic distribution of M strains used may lead to false conclusions about the temporal differentiation (see Materials and Methods and Table S1). We further restricted our analysis to the North American population, which has the largest number of alleles for both pre-P (15) and post-P (37) samples and still found strong temporal differentiation of Hen1 (Fst = 0.173, P = 0.003; Table 4). Such differentiation may reflect divergence in protein functions, as Fst estimated using amino acid sequences also showed significant temporal differentiation (Fst = 0.261, P < 0.001; Table 4).
Temporal differentiation of a subset of candidate genes
| Geographic differentiationa | Temporal differentiationb | |||||||
|---|---|---|---|---|---|---|---|---|
| All samples | Only North American samplesc | |||||||
| nucleotide differentiationd | nucleotide differentiation | nucleotide differentiation | amino acid differentiatione | |||||
| Fst | P-value | Fst | P-value | Fst | P-value | Fst | P-value | |
| Irbp | 0.144 | 0.111 | 0.170 | 0.038 | 0.000 | 0.334 | −0.010 | 0.455 |
| krimp | 0.143 | 0.004 | 0.011 | 0.262 | −0.009 | 0.635 | 0.006 | 0.345 |
| Hen1 | 0.632 | <0.001 | 0.303 | 0.001 | 0.173 | 0.003 | 0.261 | <0.001 |
| Spn-E | 0.459 | <0.001 | 0.053 | 0.08 | 0.031 | 0.097 | 0.071 | 0.033 |
| squ | 0.028 | 0.25 | 0.202 | 0.001 | 0.071 | 0.036 | 0.039 | 0.103 |
All the significant results are in boldface type.
Genetic differentiation between current (post–P-element) African and North American populations.
Genetic differentiation between pre–P- and post–P-element invasion populations.
The temporal differentiation was estimated considering only North American samples of both populations (before and after P-element invasions).
Genetic differentiation estimated using nucleotide sequences.
Genetic differentiation estimated using amino acid sequences.
| Geographic differentiationa | Temporal differentiationb | |||||||
|---|---|---|---|---|---|---|---|---|
| All samples | Only North American samplesc | |||||||
| nucleotide differentiationd | nucleotide differentiation | nucleotide differentiation | amino acid differentiatione | |||||
| Fst | P-value | Fst | P-value | Fst | P-value | Fst | P-value | |
| Irbp | 0.144 | 0.111 | 0.170 | 0.038 | 0.000 | 0.334 | −0.010 | 0.455 |
| krimp | 0.143 | 0.004 | 0.011 | 0.262 | −0.009 | 0.635 | 0.006 | 0.345 |
| Hen1 | 0.632 | <0.001 | 0.303 | 0.001 | 0.173 | 0.003 | 0.261 | <0.001 |
| Spn-E | 0.459 | <0.001 | 0.053 | 0.08 | 0.031 | 0.097 | 0.071 | 0.033 |
| squ | 0.028 | 0.25 | 0.202 | 0.001 | 0.071 | 0.036 | 0.039 | 0.103 |
All the significant results are in boldface type.
Genetic differentiation between current (post–P-element) African and North American populations.
Genetic differentiation between pre–P- and post–P-element invasion populations.
The temporal differentiation was estimated considering only North American samples of both populations (before and after P-element invasions).
Genetic differentiation estimated using nucleotide sequences.
Genetic differentiation estimated using amino acid sequences.
The strong temporal differentiation of Hen1 is likely the result of genetic hitchhiking from a nearby, strongly selected gene
Given that the spread of P elements is fairly recent and fast, any associated directional selection on suppressive host variants is expected to result in reduced genomic polymorphism around the selected SNPs and increased linkage disequilibrium due to genetic hitchhiking (Maynard Smith and Haigh 1974; Kim and Nielsen 2004; Stephan et al. 2006). Consistent with the analysis of temporal differentiation, we observed marginally significant haplotypic structures for the Hen1 gene region for post-P North American populations [frequency of major haplotypes = 15, P = 0.042 (Hudson et al. 1994) and haplotype heterozygosity = 0.759, P = 0.031 (Depaulis and Veuille 1998)]. This strong haplotypic structure was extended at least 10 kb upstream and downstream of Hen1 (frequency of major haplotypes = 10, P = 0.003 and haplotype heterozygosity = 0.290, P = 0.001). We also observed a dramatic reduction of post–P-element North American variation for an almost 100-kb genomic segment around Hen1 when compared with polymorphism in post–P-element African D. melanogaster, polymorphism in closely related D. simulans, and divergence between D. melanogaster and D. simulans (Figure 4A).
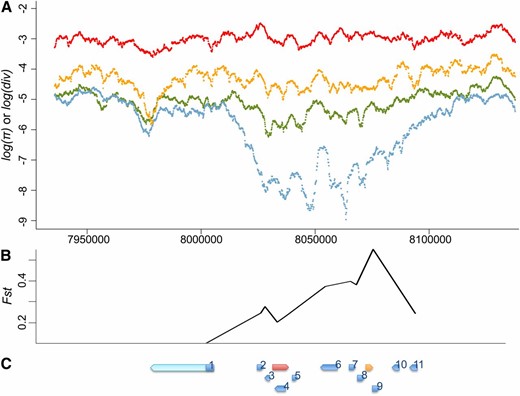
Polymorphism, divergence, and temporal differentiation around Hen1. (A) Divergence between D. melanogaster and D. simulans (red), polymorphism of D. simulans (orange), polymorphism of the post–P-element African D. melanogaster population (green), and polymorphism of the post–P-element North American D. melanogaster population (blue) of 100 kb upstream and downstream of Hen1 (from 8,033,215 to 8,040,257) are shown on a log scale. There is a dramatic drop of polymorphism in the North American D. melanogaster populations around Hen1. (B and C) Temporal differentiation between pre–P- and post–P-element North American populations of control genes (B), and their relative position (C). Genes in (C) are Hen1 (red), Cyp6g1 (orange), jeb (1), CG8378 (2), CG13178 (3), CG8878 (4), CG8407 (5), Oda (6), wash (7), CG33964 (8), Cyp6t3 (9), RpS11 (10), and Sr-CII (11). Sequenced regions of each control gene are shown in blue while unsequenced regions are in light blue. The coordinates of three figures are aligned.
However, the genomic region around Hen1 is highly gene rich, with >20 genes, including Cyp6g1. Studies have identified a recent selective sweep associated with the Cyp6g1 allele that has an Accord transposable element inserted upstream (Daborn et al. 2002; Catania et al. 2004; Chung et al. 2007; Schmidt et al. 2010). Functional analysis confirmed that this Accord insertion confers insecticide resistance (Daborn et al. 2002; Chung et al. 2007), which is the most likely force driving the strong, recent selective sweep on Cyp6g1. The Accord inserted allele was found fixed in non-African populations, yet it was intermediate in African populations (Catania et al. 2004), which may also explain why the reduction of heterozygosity around Hen1 was most apparent in the North American populations while the P element is virtually fixed worldwide.
To further investigate whether the strong temporal differentiation observed on Hen1 is the result of genetic hitchhiking from strongly selected Cyp6g1 or any other genes in the nearby region, we estimated the temporal differentiation of coding regions for another 11 genes that are within 30 kb to either Hen1 or Cyp6g1 and have functions unrelated to either TE suppression or insecticide resistance (“control genes,” Table S4 and Figure 4C). Compared with the observed strong temporal differentiation of these control genes, Hen1 (Fst = 0.173) is no longer exceptional (Table 5 and Figure 4B). We also found that the closer a gene is to Cyp6g1, the stronger the temporal differentiation was (Table 5 and Figure 4B). The geographic differentiation was also strong for these 11 genes (Table 5), which is consistent with the scenario that application of insecticide in the non-African regions is leading to strong genetic hitchhiking on genes around Cyp6g1 in the post-P North American population we studied.
Temporal and geographic differentiation of control genes
| Distance to Hen1c | Distance to Cyp6g1d | M strain π | Temporal differentiationa | Geographic differentiationb | ||||
|---|---|---|---|---|---|---|---|---|
| Nonsyn | Syn | Fst | P-value | Fst | P-value | |||
| jebe | −31,911 | −69,718 | 0.0021 | 0.0145 | 0.089 | 0.037 | 0.084 | 0.085 |
| CG8378 | −7,273 | −45,080 | 0.0000 | 0.0013 | 0.239 | 0.001 | 0.372 | 0.011 |
| CG13178 | −5,378 | −43,185 | 0.0007 | 0.0044 | 0.271 | 0.002 | 0.689 | <0.001 |
| CG8878 | 0 | −37,807 | 0.0001 | 0.0013 | 0.195 | 0.001 | 0.365 | <0.001 |
| CG8407 | 4,426 | −33,381 | 0.0000 | 0.0143 | 0.230 | 0.005 | 0.057 | 0.226 |
| Oda | 21,177 | −16,630 | 0.0012 | 0.0007 | 0.369 | 0.001 | 0.669 | <0.001 |
| wash | 32,266 | −5,541 | 0.0010 | 0.0029 | 0.393 | <0.001 | 0.583 | <0.001 |
| CG33964 | 34,832 | −2,975 | 0.0009 | 0.0010 | 0.377 | <0.001 | 0.654 | <0.001 |
| Cyp6t3 | 42,227 | 4,420 | 0.0021 | 0.0059 | 0.549 | <0.001 | 0.329 | 0.007 |
| RpS11 | 50,683 | 12,876 | 0.0000 | 0.0027 | NA | NA | 0.648 | <0.001 |
| Sr-CII | 60,799 | 22,992 | 0.0025 | 0.0151 | 0.238 | 0.001 | 0.368 | <0.001 |
NA, not available due to no SNP differences between pre–P- and post–P-element North American populations. The differentiations were estimated using nucleotide sequences.
Comparisons between pre– and post–P-element invasion populations with samples from North American populations only.
Comparisons between North American and African post–P-element invasion populations.
Distance in base pairs between the midpoints of the focused gene and Hen1. CG8878 has zero distance because it is nested within Hen1.
Distance in base pairs between the midpoints of the focused gene and Cyp6g1.
Only the coding region of the first exon of jeb was sequenced.
| Distance to Hen1c | Distance to Cyp6g1d | M strain π | Temporal differentiationa | Geographic differentiationb | ||||
|---|---|---|---|---|---|---|---|---|
| Nonsyn | Syn | Fst | P-value | Fst | P-value | |||
| jebe | −31,911 | −69,718 | 0.0021 | 0.0145 | 0.089 | 0.037 | 0.084 | 0.085 |
| CG8378 | −7,273 | −45,080 | 0.0000 | 0.0013 | 0.239 | 0.001 | 0.372 | 0.011 |
| CG13178 | −5,378 | −43,185 | 0.0007 | 0.0044 | 0.271 | 0.002 | 0.689 | <0.001 |
| CG8878 | 0 | −37,807 | 0.0001 | 0.0013 | 0.195 | 0.001 | 0.365 | <0.001 |
| CG8407 | 4,426 | −33,381 | 0.0000 | 0.0143 | 0.230 | 0.005 | 0.057 | 0.226 |
| Oda | 21,177 | −16,630 | 0.0012 | 0.0007 | 0.369 | 0.001 | 0.669 | <0.001 |
| wash | 32,266 | −5,541 | 0.0010 | 0.0029 | 0.393 | <0.001 | 0.583 | <0.001 |
| CG33964 | 34,832 | −2,975 | 0.0009 | 0.0010 | 0.377 | <0.001 | 0.654 | <0.001 |
| Cyp6t3 | 42,227 | 4,420 | 0.0021 | 0.0059 | 0.549 | <0.001 | 0.329 | 0.007 |
| RpS11 | 50,683 | 12,876 | 0.0000 | 0.0027 | NA | NA | 0.648 | <0.001 |
| Sr-CII | 60,799 | 22,992 | 0.0025 | 0.0151 | 0.238 | 0.001 | 0.368 | <0.001 |
NA, not available due to no SNP differences between pre–P- and post–P-element North American populations. The differentiations were estimated using nucleotide sequences.
Comparisons between pre– and post–P-element invasion populations with samples from North American populations only.
Comparisons between North American and African post–P-element invasion populations.
Distance in base pairs between the midpoints of the focused gene and Hen1. CG8878 has zero distance because it is nested within Hen1.
Distance in base pairs between the midpoints of the focused gene and Cyp6g1.
Only the coding region of the first exon of jeb was sequenced.
Discussion
TEs are selfish genetic elements in the genome. Their interactions with their hosts are often analogized to the molecular arms race between hosts and other nongenomic pathogens, such as bacteria, viruses, fungi, and protozoa. This analogy deserves further mechanistic specification and analysis because of the fundamental differences in transmission mode between TEs and horizontally transmitted pathogens.
To address this analogy, we first systematically compared the long-term evolution of host TE-interacting genes to that of immunity genes. We found the proportion of TE-interacting genes with evidence of positive selection is at least as large as, if not greater than, that of genes in pathways conferring immunity to pathogens. aub, which showed strong evidence of adaptive protein evolution, is a key component in piRNA-mediated TE silencing (Brennecke et al. 2007; Gunawardane et al. 2007) and its PAZ domain, known to mediate the binding of single-strand RNAs associated with Argonaute/Piwi proteins (Lingel et al. 2003; Song et al. 2003; Yan et al. 2003), also showed an excess of amino acid fixations. Both RNA helicases surveyed, armi and spn-E, showed evidence of adaptive evolution, although the detailed mechanism of their involvement in piRNA biogenesis and TE suppression is still not clear. Most interestingly, all three nuage component genes (mael, krimp, and vas) showed strong evidence of positive selection. The nuage, where many proteins encoded by piRNA genes localize (reviewed in Klattenhoff and Theurkauf 2008), is considered the major battleground for the host–TE arms race (Blumenstiel 2011). In addition, vas is involved in the formation of pole plasm (the future germline) and is essential for the proper localization and translational control of maternally deposited mRNAs at the rear of developing embryos (Lasko and Ashburner 1990; Styhler et al. 1998; Johnstone and Lasko 2004). The RNA genome of TEs that can be preferentially incorporated into the pole plasm and have its RNA tertiary structure be detangled and translated will have large fitness benefits from increased transmission. The DEAD box of VAS, the key domain mediating the unwinding of RNAs with self-annealed structure (reviewed in Linder 2006; Arkov and Ramos 2010), had a strong enrichment of amino acid fixations under the McDonald–Kreitman framework.
Our analytical model found that host alleles suppressing P-element transposition enjoy strong selective benefits only during a limited time frame due to the fast spread of P elements through strict vertical parent–offspring inheritance. This led to negligible host allele frequency differences between pre– and post–P-element populations with all biologically reasonable parameters tested. This theoretical prediction may be extended to other known cases of horizontally transferred TEs in Drosophila, such as I-element, hobo, and mariner (reviewed in Silva et al. 2004). For DNA-based TE families that also transpose with the cut-and-paste mechanism (hobo and mariner), our model should be readily applicable. RNA-based TE families, such as I-element, transpose through a “copy-and-paste mechanism” (replicating through insertions of reversed transcribed cDNA into another position in the genome). The hybrid dysgenic syndrome observed for I-element is caused by the catastrophic meiosis of eggs, which includes failure to produce functional female pronucleus and developmental abnormalities after fertilization (Orsi et al. 2010). If such a meiotic defect is initiated with a higher than tolerable threshold of I-elements transposition activity and is also responsible for the hybrid dysgenic syndromes of other unobserved horizontal transfer of RNA-based TEs, our model could be a reasonable generalization for all TE families.
Consistent with our quantitative analysis, we found no strong evidence supporting recent selection imposed by P elements on host candidate genes. The significant temporal differentiation and haplotypic structures of Hen1, our only strong candidate, are likely the result of the strong genetic hitchhiking effects from the nearby insecticide-resistant gene, Cyp6g1. Certainly it is possible that other types of alleles or loci may have responded to the P-element invasion. We did not find a strong reduction in polymorphism of the post–P-element population 10 kb upstream and downstream of each candidate gene, providing no support for the alternative that selection has acted on polymorphisms of local cis-acting elements (data not shown). Yet, the possibility of strong selection on cis-regulatory elements outside the surveyed region or of trans-acting regulatory variation cannot be ruled out. The possibility that there was instead strong selection for a P-element variant that can reduce the deleterious impact on its host is not plausible because there is only a 1-base difference observed between D. willistoni and D. melanogaster canonical P elements (Daniels et al. 1990). Still another alternative is that prevalent D. melanogaster variants of host genes segregating in the pre–P-element population were already similar to those of D. willistoni, which coevolved with P elements and can thus effectively reduce P-element transposition and minimize their deleterious effects. We found that the amino acid sequence divergence between D. melanogaster and D. willistoni orthologs (Clark et al. 2007) for most candidate genes is greater than the genome-wide median (Figure 5). The only two exceptions [Hrb27C (1.7%) and Psi (16.4%)] both have other essential host functions (Hammond et al. 1997; Labourier et al. 2002; Goodrich et al. 2004; Huynh et al. 2004; Yano et al. 2004; Blanchette et al. 2005) and their evolution is expected to be strongly constrained. These observations therefore do not support the scenario of D. melanogaster preadaptation to P elements.
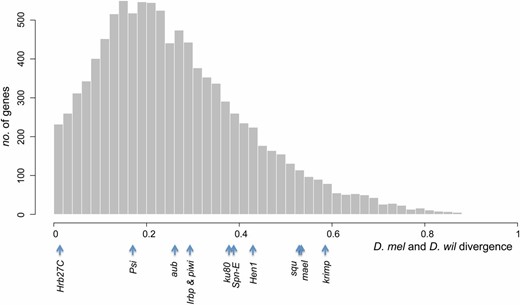
Divergence between D. melanogaster (D. mel) and D. willistoni (D. wil) of candidate genes among other genes. Amino acid sequence divergences were estimated for genes with an annotated D. willistoni ortholog (11 candidate genes and 10,029 other genes) and the genome-wide distribution of the divergence is shown. The divergences of the 11 candidate genes on the x-axis are shown at the bottom.
Parameters and varables used in the model
| Parameters | |
|---|---|
| a, b | Selection coefficient against P elements through synergistic epistasis |
| d | Proportional reduction of P-element transposition rate in homozygotes of host beneficial allele |
| h | Dominance coefficient for host beneficial allele |
| u0 | P-element transposition rate per copy per generation in dysgenic cross |
| u1 | P-element transposition rate per copy per generation in nondysgenic cross |
| nHD | Maximum number of new P-element insertions an individual can tolerate before becoming completely sterile |
| Variables | |
| n | P-element copy number in a given individual |
| m | Mean copy number of P element of parents |
| u | P-element transposition rate per copy per generation |
| δ | Proportional reduction of P-element transposition rate due to the host genotype |
| rt | Proportion of individuals with P cytotype in the population at generation t |
| lt | Allele frequency of the host beneficial allele in the population at generation t |
| μt | Average P-element copy number among individuals with P cytotype at generation t |
| Mean fitness of the population at generation t | |
| s | Selection coefficient against host nonbeneficial allele |
The effects of change in μ0 and u1 on r0.99, l1000, μ1000, and max(s)
| μ0 | u1 | ||||||
|---|---|---|---|---|---|---|---|
| μ0 or u1 | 5 | 10 | 20 | 30 | 10−3 | 10−4 | 10−5 |
| r0.99 (gen) | 87 | 87 | 88 | 88 | 78 | 87 | 88 |
| l1000 (10−3) | 1.312 | 1.331 | 1.331 | 1.313 | 1.189 | 1.331 | 1.349 |
| μ1000 | 6.650 | 6.451 | 6.451 | 6.650 | 9.698 | 6.451 | 6.297 |
| max(s) (10−3)a | 5.776 | 5.788 | 5.777 | 5.776 | 5.804 | 5.788 | 5.786 |
Other not varied parameters are set as a = 10−5, b = 10−6, d = 0.5, h = 0.5, u0 = 1, u1 = 10−4, μ0 = 10, and nHD = 5.
The largest s within 1000 generations.
| μ0 | u1 | ||||||
|---|---|---|---|---|---|---|---|
| μ0 or u1 | 5 | 10 | 20 | 30 | 10−3 | 10−4 | 10−5 |
| r0.99 (gen) | 87 | 87 | 88 | 88 | 78 | 87 | 88 |
| l1000 (10−3) | 1.312 | 1.331 | 1.331 | 1.313 | 1.189 | 1.331 | 1.349 |
| μ1000 | 6.650 | 6.451 | 6.451 | 6.650 | 9.698 | 6.451 | 6.297 |
| max(s) (10−3)a | 5.776 | 5.788 | 5.777 | 5.776 | 5.804 | 5.788 | 5.786 |
Other not varied parameters are set as a = 10−5, b = 10−6, d = 0.5, h = 0.5, u0 = 1, u1 = 10−4, μ0 = 10, and nHD = 5.
The largest s within 1000 generations.
The effects of change in d on r0.99, l1000, μ1000, and max(s)
| h = 0.5 | hd = 0.5 | ||||||||
|---|---|---|---|---|---|---|---|---|---|
| d | 0.2 | 0.3 | 0.5 | 0.7 | 0.9 | 0.3 | 0.5 | 0.7 | 0.9 |
| r0.99 (gen) | 87 | 87 | 87 | 87 | 87 | 87 | 87 | 87 | 87 |
| l1000(10−3) | 1.066 | 1.201 | 1.331 | 1.448 | 1.543 | 1.331 | 1.331 | 1.331 | 1.331 |
| μ1000 | 6.454 | 6.451 | 6.451 | 6.451 | 6.451 | 6.451 | 6.451 | 6.451 | 6.451 |
| max(s)(10−3)a | 1.850 | 4.476 | 5.788 | 6.189 | 6.229 | 4.475 | 5.788 | 6.190 | 6.232 |
Other not varied parameters are set as a = 10−5, b = 10−6, u0 = 1, u1 = 10−4, μ0 = 10, and nHD = 5.
The largest s within 1000 generations.
| h = 0.5 | hd = 0.5 | ||||||||
|---|---|---|---|---|---|---|---|---|---|
| d | 0.2 | 0.3 | 0.5 | 0.7 | 0.9 | 0.3 | 0.5 | 0.7 | 0.9 |
| r0.99 (gen) | 87 | 87 | 87 | 87 | 87 | 87 | 87 | 87 | 87 |
| l1000(10−3) | 1.066 | 1.201 | 1.331 | 1.448 | 1.543 | 1.331 | 1.331 | 1.331 | 1.331 |
| μ1000 | 6.454 | 6.451 | 6.451 | 6.451 | 6.451 | 6.451 | 6.451 | 6.451 | 6.451 |
| max(s)(10−3)a | 1.850 | 4.476 | 5.788 | 6.189 | 6.229 | 4.475 | 5.788 | 6.190 | 6.232 |
Other not varied parameters are set as a = 10−5, b = 10−6, u0 = 1, u1 = 10−4, μ0 = 10, and nHD = 5.
The largest s within 1000 generations.
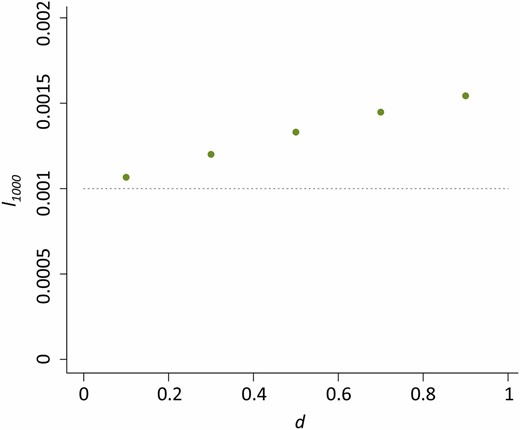
The impact of d on the allele frequency of the host beneficial allele at generation 1000 ( l1000). The dashed line is the beneficial allele frequency of host beneficial allele at generation zero (l0).
The effects of change in a and b on r0.99, l1000, μ1000, and max(s)
| a | b | |||||
|---|---|---|---|---|---|---|
| a or b | 10−5 | 5 × 10⁻⁵ | 10−4 | 10−6 | 5 × 10⁻⁶ | 10−5 |
| r0.99 (gen) | 87 | 92 | 100 | 87 | 93 | 102 |
| l1000(10−3) | 1.331 | 1.413 | 1.521 | 1.331 | 1.450 | 1.564 |
| μ1000 | 6.451 | 5.867 | 5.423 | 6.451 | 5.677 | 5.2829 |
| max(s)(10−3)a | 5.788 | 5.784 | 5.779 | 5.788 | 5.786 | 5.783 |
Other not varied parameters are set as u0 = 1, u1 = 10−4, μ0 = 10, and nHD = 5.
The largest s within 1000 generations.
| a | b | |||||
|---|---|---|---|---|---|---|
| a or b | 10−5 | 5 × 10⁻⁵ | 10−4 | 10−6 | 5 × 10⁻⁶ | 10−5 |
| r0.99 (gen) | 87 | 92 | 100 | 87 | 93 | 102 |
| l1000(10−3) | 1.331 | 1.413 | 1.521 | 1.331 | 1.450 | 1.564 |
| μ1000 | 6.451 | 5.867 | 5.423 | 6.451 | 5.677 | 5.2829 |
| max(s)(10−3)a | 5.788 | 5.784 | 5.779 | 5.788 | 5.786 | 5.783 |
Other not varied parameters are set as u0 = 1, u1 = 10−4, μ0 = 10, and nHD = 5.
The largest s within 1000 generations.
The effects of change in u0 and nHD on r0.99, l1000, μ1000, and max(s)
| u0 = 1 | |||||
|---|---|---|---|---|---|
| nHD | 2 | 3 | 5 | 7 | 9 |
| r0.99 (gen) | >10,000 | 3,787 | 87 | 64 | 57 |
| l1000(10−3) | 592.2 | 4.701 | 1.331 | 1.093 | 1.016 |
| μ1000 | 3.441 | 4.637 | 6.451 | 6.994 | 7.261 |
| max(s)a | 2.590 × 10⁻² | 1.688 × 10⁻² | 5.788 × 10⁻³ | 1.503 × 10⁻³ | 1.380 × 10⁻⁴ |
| u0 = 0.1 | |||||
| nHD | 2 | 3 | 5 | 7 | 9 |
| r0.99 (gen) | 687 | 628 | 621 | 621 | 621 |
| l1000(10−3) | 1.032 | 1.003 | 1.000 | 1.000 | 1.000 |
| μ1000 | 5.138 | 5.240 | 5.255 | 5.255 | 5.255 |
| max(s)a | 1.366 × 10⁻⁴ | 1.093 × 10⁻⁵ | 7.066 × 10⁻⁸ | 1.092 × 10⁻⁹ | 1.337 × 10⁻¹² |
Other not varied parameters are set as a = 10−5, b = 10−6, d = 0.5, h = 0.5, u1 = 10−4, and μ0 = 10.
The largest s within 1000 generations.
| u0 = 1 | |||||
|---|---|---|---|---|---|
| nHD | 2 | 3 | 5 | 7 | 9 |
| r0.99 (gen) | >10,000 | 3,787 | 87 | 64 | 57 |
| l1000(10−3) | 592.2 | 4.701 | 1.331 | 1.093 | 1.016 |
| μ1000 | 3.441 | 4.637 | 6.451 | 6.994 | 7.261 |
| max(s)a | 2.590 × 10⁻² | 1.688 × 10⁻² | 5.788 × 10⁻³ | 1.503 × 10⁻³ | 1.380 × 10⁻⁴ |
| u0 = 0.1 | |||||
| nHD | 2 | 3 | 5 | 7 | 9 |
| r0.99 (gen) | 687 | 628 | 621 | 621 | 621 |
| l1000(10−3) | 1.032 | 1.003 | 1.000 | 1.000 | 1.000 |
| μ1000 | 5.138 | 5.240 | 5.255 | 5.255 | 5.255 |
| max(s)a | 1.366 × 10⁻⁴ | 1.093 × 10⁻⁵ | 7.066 × 10⁻⁸ | 1.092 × 10⁻⁹ | 1.337 × 10⁻¹² |
Other not varied parameters are set as a = 10−5, b = 10−6, d = 0.5, h = 0.5, u1 = 10−4, and μ0 = 10.
The largest s within 1000 generations.
The effects of change in a and b on r0.99, l1000, μ1000, and max(s)
| a | |||
|---|---|---|---|
| a or b | 10−5 | 5 × 10⁻⁵ | 10−4 |
| R0.99 | 621 | >1000 | >1000 |
| l1000(10−3) | 1.000 | 1.000 | 1.000 |
| μ1000 | 5.255 | 4.259 | 3.139 |
| max(s) | 7.066 × 10⁻⁸ | 7.060 × 10⁻⁸ | 7.018 × 10⁻⁸ |
| b | |||
| a or b | 10−6 | 5 × 10⁻⁶ | 10−5 |
| r0.99 | 621 | 741 | >1000 |
| l1000(10−3) | 1.000 | 1.000 | 1.000 |
| μ1000 | 5.255 | 4.973 | 4.237 |
| max(s)a | 7.066 × 10⁻⁸ | 7.063 × 10⁻⁸ | 7.053 × 10⁻⁸ |
Other not varied parameters are set as u0 = 0.1, u1 = 10−4, μ0 = 10, and nHD = 5.
The largest s within 1000 generations.
| a | |||
|---|---|---|---|
| a or b | 10−5 | 5 × 10⁻⁵ | 10−4 |
| R0.99 | 621 | >1000 | >1000 |
| l1000(10−3) | 1.000 | 1.000 | 1.000 |
| μ1000 | 5.255 | 4.259 | 3.139 |
| max(s) | 7.066 × 10⁻⁸ | 7.060 × 10⁻⁸ | 7.018 × 10⁻⁸ |
| b | |||
| a or b | 10−6 | 5 × 10⁻⁶ | 10−5 |
| r0.99 | 621 | 741 | >1000 |
| l1000(10−3) | 1.000 | 1.000 | 1.000 |
| μ1000 | 5.255 | 4.973 | 4.237 |
| max(s)a | 7.066 × 10⁻⁸ | 7.063 × 10⁻⁸ | 7.053 × 10⁻⁸ |
Other not varied parameters are set as u0 = 0.1, u1 = 10−4, μ0 = 10, and nHD = 5.
The largest s within 1000 generations.
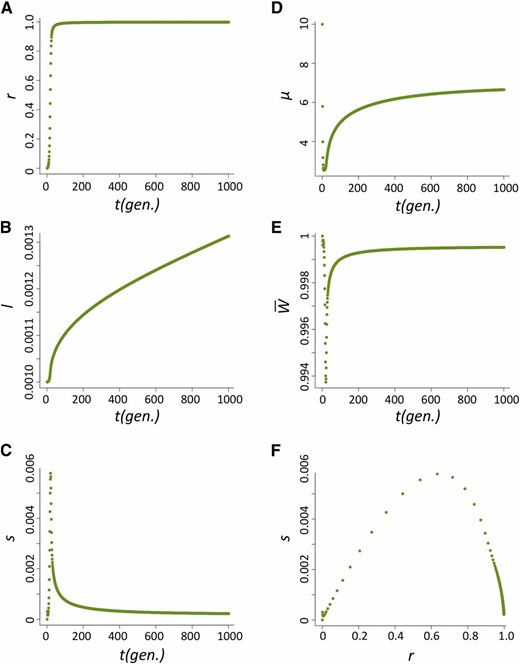
The dynamics of r (A), l (B), s (C), μ (D), and (E) over generations when u0 = 1 and nHD = 5. (F) describes how s changes as r varies.
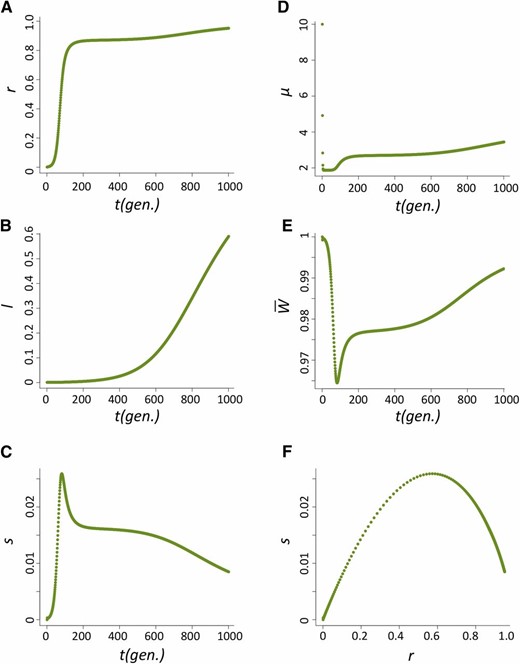
The dynamics of r (A), l (B), s (C), μ (D), and (E) over generations when u0 = 1 and nHD = 2. (F) describes how s changes as r varies.
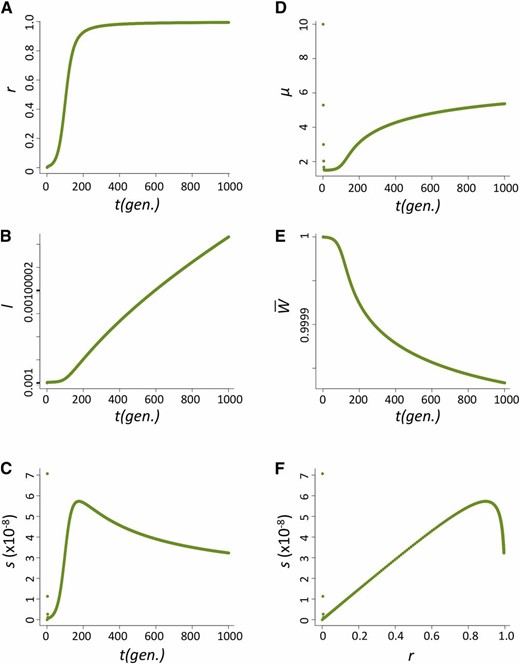
The dynamics of r (A), l (B), s (C), μ (D), and (E) over generations when u0 = 0.1 and nHD = 5. (F) describes how s changes as r varies.
Acknowledgments
We thank the Bloomington Drosophila Stock Center and M. Itoh for providing M strains. We appreciate D. J. Begun and M. T. Levine for extensive discussion of the project and D. J. Begun, M. T. Levine, P. L. Ralph, M. Turelli, James A. Chandler, and E. I. Dietrich for critical reading of the manuscript. We also thank D. J. Obbard for helpful discussion and kindly sharing unpublished results regarding MK tests for piRNA genes. We thank C. M. Cardeno, P. Saelao, and T. Trejo-Cantwell for experimental assistance. Finally, we acknowledge the thoughtful, constructive, and patient criticism of two anonymous reviewers. This work was supported by National Science Foundation Doctoral Dissertation Improvement Grant, Daphne and Ted Pengelley Award in Evolutionary Biology, and Center for Population Biology of University of California, Davis, Research Award to Y.C.G.L.
Appendix
In this section, we describe the derivations of r, l, and μ. Parameters and variables used in the model are listed in Table A1.
We iterated over (A4), (A6), and (A9) over 1000–10,000 generations for each set of parameters chosen. With the assumption that D. melanogaster can have ∼10 generations per year, there are ∼1000 generations between when D. melanogaster was first collected as M strains and now. We thus mainly reported r, l, and μ at generation 1000 for most cases. One aspect of the model we are interested in is the time until P-element fixed in the population. As our model is deterministic, we set when r ≥ 0.99 as the approximate time of fixation of the P cytotype in the population (r0.99). In a finite population, genetic drift can expediate the fixation when r is nearly fixed in the population.
μ0 (the average P-element copy number among individuals with P cytotype at generation zero) was tested for several values (5, 10, 20, and 30; Table A2), which did not influence the population dynamics or l1000 significantly. This is because only individuals with low copy number will have low probability of hybrid dysgenesis during the initial spread of the P elements. Transposition rates estimated for other TE families range from 10−5 to 10−4 (Nuzhdin and Mackay 1995; Nuzhdin et al. 1997; Maside et al. 2000) while old estimates for P-element transposition rate in a dysgenic cross are ∼10−3 (Eggleston et al. 1988). Similarly, for μ1 tested (10−5, 10−4, and 10−3), no dramatic differences in population dyanmics were observed (Table A2). We tested the effect of changing d, the proportional reduction of P-element transposition rate in the homozygotes of host beneficial allele, with fixed h and fixed hd (Table A3). With fixed h, l increases as d increases (Table A3 and Figure A1), yet the change is slight. a and b were set as 10−5 and 10−6, respectively, according to previous studies (Dolgin and Charlesworth 2006, 2008). Increasing these two parameters, and thus increasing the deleterious effects of P-element insertions, does not have significant effects on l1000 either (Table A4).
To sum up, for all a, b, d, h, u1, and μ0 tested, there were no significant changes in the dynamics of r, l, μ, and s over generations and the relationship between r and s. In neither case tested is there temporal allele frequency change of the host beneficial allele (l0 and l1000) that will be detectable with the usual size of samples. We thus fixed a, b, d, h, u1, and μ0 to 10−5, 10−6, 0.5, 0.5, 10−4, and 10.
On the other hand, the combined effects of u0 and nHD did show strong impacts on the dynamics of the host beneficial allele as discussed in the main text and shown in Table A5. When either u0 or nHD and other parameters are changed at the same time, u0 or nHD is the determining factor of the population dynamics observed. For example, when the same values of a and b are tested with u0 = 0.1, the observed population dynamics follow Case 3 below instead of Case 1 (see below and Tables A4 and A6). We discussed the three most characteristic cases in terms of the dynamics of r, l, μ, and s over generations and the relationship between r and s in the following.
Case 1: u0 = 1, nHD ≥ 3 (Figure A2, case of nHD = 5 is shown)
The dynamics of r, l, s, μ, and (population mean fitness) over generations and the relationship between r and s are shown in Figure A2. The spread of the P element is fast (Figure A2A), even though it did lower the population mean fitness during its spread (Figure A2E). started to bounce back when the proportion of P cytotype is intermediate due to the much reduced probability of hybrid dysgenesis. The change of s increased dramatically during the initial spread of P elements and then dropped as P cytotype is in high frequency in the population (Figure A2, C and F). This is also reflected in the dynamics of l, which has two phases of increase, with the former having a faster rate (Figure A2B).
Case 2: u0 = 1, nHD = 2 (Figure A3)
This is the exception of Case 1. The spread of P elements in the population is slowed due to the high probability of hybrid dysgenesis even when the majority of the population has P cytotype (Figure A3A). Because of this delay in P-elements spread, there is an extended period when the host repressing allele has large s (Figure A3C). However, several aspects of the population dynamics under this parameters are not consistent with known P-element biology (see main text). In a finite population, genetic drift may shorten the time of fixation for P cytotype, resulting in a shorter period for the repressing allele to have large selective benefits from lingering incidences of hybrid dysgenesis.
Case 3: u0 = 0.1 and nHD ≥ 2 (Figure A4, case of nHD = 5 is shown)
Because of the lower u0, the spread of the P element is slower than the case when u0 = 1 (Figure A4A) and the duration for the host beneficial allele to have large selective benefit is therefore longer (Figure A4C). However, the absolute magnitude of the host allele selection benefit is much lower due to the much reduced probability of hybrid dysgenesis. The increase of μ is also delayed until the proportion of P cytotype is intermediate in the population (Figure A4D), which may explain why the largest s happened when r is relatively large (Figure A4E). The population mean fitness does not bounce back, suggesting that the increase in P-element copy number after fixation of P cytotype led to stronger fitness reduction than hybrid dysgenesis during the P-element spread.
Literature Cited
Footnotes
Communicating editor: R. Nielsen
Author notes
Supporting information is available online at http://www.genetics.org/lookup/suppl/doi:10.1534/genetics.112.145714/-/DC1.
Sequences generated from this article have deposited with the EMBL/GenBank Data Libraries under accession nos. JX974565–JX974572 and KC115855–KC116217.
