

Abstract
The fovea dominates primate vision, and its anatomy and perceptual abilities are well studied, but its physiology has been little explored because of limitations of current physiological methods. In this study, we adapted a novel in vivo imaging method, originally developed in mouse retina, to explore foveal physiology in the macaque, which permits the repeated imaging of the functional response of many retinal ganglion cells (RGCs) simultaneously. A genetically encoded calcium indicator, G-CaMP5, was inserted into foveal RGCs, followed by calcium imaging of the displacement of foveal RGCs from their receptive fields, and their intensity-response functions. The spatial offset of foveal RGCs from their cone inputs makes this method especially appropriate for fovea by permitting imaging of RGC responses without excessive light adaptation of cones. This new method will permit the tracking of visual development, progression of retinal disease, or therapeutic interventions, such as insertion of visual prostheses.
- calcium imaging
- in vivo adaptive optics imaging
- intrinsic signal imaging
- primate fovea
- retinal ganglion cells
Introduction
Among mammals, a fovea only exists in diurnal primates (Hendrickson, 1994, 2005). Primate fovea provides very high acuity, which falls off continuously >70-fold toward the periphery (Anderson et al., 1991). The visual brain of the primate also emphasizes foveal vision by devoting many more neurons to its analysis while providing limited brain resources to periphery (Perry and Cowey, 1985; Wässle et al., 1989), and this allocation results in substantially greater ability to recognize shapes and read near the fovea (Strasburger et al., 2011). Understanding primate fovea is critical to vision research because an important goal is to develop linking hypotheses relating visual perception to the anatomy and physiology of the visual system, and most data on visual perception have been collected from human fovea (Schaeffel, 2007). Anatomical studies have shown that the fovea of macaques and humans are very similar (Dacey, 2004; Hendrickson, 2005).
However, despite the wealth of perceptual and anatomical data on nonhuman primate fovea, little is known about its physiology because it is so hard to study. The physiology of macaque fovea has been examined in vivo by measuring presynaptic potentials of retino-recipient neurons in lateral geniculate nucleus (Kaplan and Shapley, 1984; e.g., Derrington and Lennie, 1984; Blakemore and Vital-Durand, 1986) or by recording directly from RGCs in the living eye (e.g., Lee et al., 1993; Martin et al., 2001; Lee et al., 2012), but both methods are limited to recording one cell at a time. A more efficient technique is to remove macaque retina from the eye and record from patches of retina in vitro. This approach has been used to relate intracellular and extracellular recordings of cells to RGC types, identified by the unique physiological properties and morphology of the cells (Crook et al., 2008a, b). This method can record large numbers of cells simultaneously using multielectrode arrays, making it possible to examine information coding by multiple cells (e.g., Field et al., 2010). However, in vitro recording has not been used to study near foveal macaque RGCs, likely because (1) fovea is badly distorted in the excised, flattened retina; (2) the dense packing of RGCs makes recording difficult; and (3) the thick inner limiting membrane limits access to RGCs. Thus, all presently available physiological methods are limited by being unable to image large numbers of foveal RGCs repeatedly.
Functional adaptive-optics cellular imaging in the living eye (FACILE) was initially developed in mouse retina (Yin et al., 2013) and modified in this study to examine visual activity in the macaque fovea. This optical method provides significant advantages over electrophysiological recording techniques as it permits simultaneous study of many neurons, the ability to compare the RGC responses to that of upstream visual neurons, and the potential to make longitudinal recordings of light responses from RGCs for prolonged periods (weeks to months) in studies of retinal development or degeneration. Optical methods are less invasive than recording directly from the retina with electrodes and offer the potential to examine the response characteristics of foveal RGCs in macaques, for studies of the long-term restoration of visual responses to RGCs by visual prostheses, and to track the course of retinal damage in nonhuman primate models of eye diseases, such as glaucoma.
Materials and Methods
Adeno-associated virus (AAV)-mediated gene delivery to macaque inner retina
AAV vector used to transduce macaque foveal ganglion cells was produced in the laboratory of Dr. John G. Flannery (University of California at Berkeley, Berkeley, CA). The vector is packaged in an AAV serotype 2 (AAV2) variant capsid called 7m8 (Dalkara et al., 2013) and carries a genetic construct containing a CMV immediate early promoter and G-CaMP5 gene (Plasmid 31788; Addgene) (Akerboom et al., 2012). G-CaMP5 was substituted for G-CaMP3, which was used in the previous study (Yin et al., 2013) for its higher sensitivity, thus reducing imaging time and increasing the signal-to-noise ratio (SNR) of imaging. Titer of the vector was 1.33e+14 vg/ml. AAV vector was delivered to one eye of a female macaque (5-year-old Macaca fascicularis) by intravitreal injection. The detailed injection procedure has been described previously (Yin et al., 2011) and followed the guidelines of Biosafety Level 2. Injection volume was 80 μl, with 10% surfactant (Pluronic F-68; Sigma-Aldrich) added. All animal procedures were conducted according to the ARVO Statement for the Use of Animals and the guidelines of the Office of Laboratory Animal Care at the University of Rochester. All protocols were approved by the University Committee on Animal Resources of the University of Rochester.
Evaluation of the progress of transduction
We used a fundus camera (model TRC-50DX; Topcon) and confocal scanning laser ophthalmoscope (cSLO; Spectralis HRA) to capture both reflectance and fluorescence images of the macaque retina for monitoring retinal health, and to evaluate the level of G-CaMP5 expression. A narrow-band filter (445–580 nm) was placed between the macaque eye and the objective lens of the cSLO to attenuate background autofluorescence (see Fig. 1A). Low-resolution retinal images were used for navigation to place the adaptive optics (AO) field at the correct retinal location.
As reported by Dalkara et al. (2013), we observed inflammation in the posterior chamber in this animal after intravitreal injection of the AAV vector, with the first occurrence observed at 2 months after injection. This uveitic response could be the result of immune reaction to the AAV capsid proteins or expression of the G-CaMP5 protein. Inflammation reduced the clarity of the vitreous, interfering with high-resolution AO imaging, and was treated by injection of triamcinolone acetate (Kenalog; Bristol-Myers Squibb) when needed, at a 5 week interval. In most cases, inflammation was suppressed and vitreal clarity restored within 2 weeks of each treatment.
In another eye of a second macaque, intravitreal injection of a different AAV serotype, AAV9, carrying the same transgene insert-AAV9-CAG (hybrid CMV early enhancer/chicken β-actin)-G-CaMP5 (titer of 5.04e+12 vg/ml; produced by the Penn Vector Core at the University of Pennsylvania, Philadelphia) produced substantial G-CaMP5 expression, shown by fundus photography. However, because we did not use immune suppression to maintain expression, G-CaMP5 expression was short-lived in this animal, and we were not able to use that eye for this study.
Anesthesia and animal preparation for AO imaging
After induction with ketamine, the monkey was intubated and anesthetized with inhaled isoflurane to effect (1–3%). During anesthesia, heart rate, electrocardiogram, blood oxygenation, and respiratory rate were continuously monitored. Intravenous infusion of vecuronium bromide was used to induce paralysis after anesthesia was stable and maintained for the duration of the imaging session because retrobulbar block was found insufficient to reduce eye movement. Glycopyrrolate and neostigmine were given intravenously to reverse paralysis at the conclusion of the imaging session, and the monkey appeared fully recovered within minutes. The speed of recovery may have been aided by the lower concentration of isoflurane required to maintain deep anesthesia during paralysis. A rigid gas-permissible contact lens was fitted to the imaged eye to protect the cornea and correct spherical aberration of the imaged eye. Pupils were dilated with 1–2 drops each of phenylephrine hydrochloride (2.5%) and Tropicamide (1%). Imaging was performed no more often than once per week.
AO imaging
FACILE was done with the primate fluorescence AO SLO (AOSLO) at the University of Rochester. This system has been previously used for imaging retinal structures in single or two-photon fluorescence mode (Hunter et al., 2010; Yin et al., 2011). A detailed description of this system has been previously published (Gray et al., 2006, 2008).
The AOSLO has three imaging light sources: a 488 nm laser (Air-cooled Argon-Krypton laser; CVI Melles Griot), and two infrared light sources with center wavelength at 790 nm (Broadlighter; Superlum) and 850 nm (QFLD-850–75S; QPhotonics). All imaging lights were scanned over the retina in one of two spatial configurations: 1.9 × 2.1 degree, or a 2.2 × 3.1 degree scanning field (see Fig. 1C,D). The second configuration was developed specifically for the retinotopic study to cover the displacement between foveal ganglion cells and the foveal cones that drive them (Perry and Cowey, 1988; Schein, 1988; Drasdo et al., 2007). To convert retinal distance measured in degree to micrometers, we used a scaling factor of 223 μm/degree (Perry and Cowey, 1985).
During imaging, we captured two channels of images simultaneously at a 25 Hz frame rate: a reflectance image of the cone mosaic, using the 790 nm light; and a fluorescence image of ganglion cells expressing G-CaMP5, using the 488 nm light as excitation (emission: 525 ± 17.5 nm; FF01-520/35-25, Semrock). The 850 nm light was used for wavefront sensing to correct the optical aberrations of the eye. The intensities of the imaging lights at pupil were 20–40 μW (488 nm), ∼300 μW (790 nm), and ∼20 μW (850 nm). The gain of the fluorescence channel was set to fully use the dynamic range of the system without saturating pixel intensity.
The 488 nm image light was coupled with an acousto-optic modulator (AOM; Brimrose), to modulate the light intensity reaching the eye at a clock rate of 20 MHz. This allowed us to use the same 488 nm imaging light for simultaneously imaging ganglion cell somas in one portion of the 2.2 × 3.1 degree scanning field while presenting visual stimuli to foveal cones that drive the imaged ganglion cells in another portion (see example in Fig. 4). The laser was extinguished elsewhere to minimize the visual impact to cones at those locations. In the improved system design, we installed a fourth light source, a 568 nm laser (Air-cooled Argon-Krypton laser; CVI Melles Griot), coupled with an AOM. This provided us an independent channel for visual stimulation (see example in Fig. 6A). In this condition, the 488 nm light was only used for imaging. Both 488 and 568 nm lasers could be attenuated ∼2.6–3 log10 units by the AOMs.
Correcting eye motion
We calculated eye motion from high SNR reflectance images of cones and applied motion correction to both reflectance and fluorescence images. For the patterned stimuli described later, which were spatially anchored to the scanning field, we used the calculated motion to estimate positional precision of stimulation on retina.
Configuration of visual stimuli
We used two types of visual stimuli to evoke light responses from ganglion cells: uniform-field stimuli and patterned stimuli, to characterize, respectively, the temporal and spatial properties of ganglion cell receptive fields.
Uniform-field stimuli.
Uniform-field stimuli used long-wavelength (590 nm) light. We generated the stimuli using an LED with a peak wavelength at 590 nm (M590L2-Amber, Thorlabs), filtered by a narrow-band filter (585 ± 20 nm) (FF01–585/40–25, Semrock), and presented to the eye in Maxwellian view over a circular region of 7.6 degree diameter on the retina, centered on the scanning field (see Fig. 1C). The intensity of the 590 nm light was modulated temporally with an LED driver (LEDD1B, Thorlabs), in synchrony with the imaging frames. Maximal intensity at pupil was 134 μW, and intensities ranging from 0% to 100% of the maximum were used.
Patterned stimuli.
Patterned stimuli were made by AOM modulation of middle-wavelength (488 or 568 nm) lasers. The intensity of the imaging laser (488 nm) focussed on ganglion cells was held constant, to have a steady read out of the G-CaMP5 fluorescence. A second laser (568 nm) for visual stimulation was focused on cones.
Visual impact of imaging and visual stimulation lights
We compared the visual impact on cones of imaging and stimulation, to do so, we calculated approximate isomerization rates for L- and M-cones using parameters for living human fovea. This approximation is proper because of the similarity between the spectral sensitivity of macaque L- and M-cones and those of the human eye (Schnapf et al., 1988). Calculation was directly from functions included in Psychophysics Toolbox extensions for MATLAB (Brainard, 1997; Pelli, 1997) and has been described previously (Garrigan et al., 2010). Briefly, prereceptoral transmission was calculated from the product of lens transmission (Stockman et al., 1999) and macular transmission (Bone et al., 1992) (see CVRL database: http://www.cvrl.org).
Experimental paradigm
For the uniform-field stimuli, a typical stimulus cycle was 6 s. Two experimental paradigms were used: (1) bright flash (light increment), 1 s of steady 590 nm light followed by no light for 5 s, to allow the calcium response of ganglion cells to recover; and (2) dark flash (light decrement), 1 s decrease to no light, followed by 5 s steady 590 nm light adapting background. Data from the last 2 s of each stimulus cycle were used as baseline for the next one.
For the patterned stimulus, two experimental paradigms were used: (1) static bar, a bright bar was presented for 1 s and then extinguished for the last 5 s of the 6 s cycle; and (2) drifting bar, bar was presented for the 10 s cycle duration. For the static bar, data from the last 2 s in each stimulus cycle were used as baseline for the next one.
To improve the SNR, the visual stimulus was repeated within each imaging block of 3–4 min and repeated over several imaging blocks. Between each imaging block, we blocked the 488 nm and/or 568 nm lights to minimize retinal exposure to visible light. We typically waited at least 1 min between imaging blocks for cones to dark-adapt. We did not notice any decrease in the baseline fluorescence of ganglion cells within an imaging block or over the many repeated blocks in the same imaging session.
Measurements of responses
Fluorescence (calcium) responses of ganglion cells.
Fluorescent measurements were made from registered fluorescence videos, with motion correction, using the procedure described previously (Yin et al., 2013). Briefly, for each registered fluorescent video, we manually placed an ellipsoidal region of interest (ROI) on each ganglion cell soma that was visible in the summed image (see example in Fig. 2A), and measured the mean pixel intensities of each ROI in all frames of the video, generating the temporal sequences of measurements for all cells. As a measure of background, we also placed a rectangular ROI larger than a typical ganglion cell soma at a location where there were neither visible ganglion cell somas nor significant background fluorescence (see example in Fig. 2A). The intensity of the background ROI was subtracted from the measurements of ganglion cells. The above procedure was done using Fiji (Schindelin et al., 2012), a distribution package of ImageJ (Rasband, W.S., ImageJ, National Institutes of Health, Bethesda, Maryland; http://imagej.nih.gov/ij/, 1997–2011). Further processing of the measurement was done using customized code in MATLAB (MathWorks).
Measurements from individual ganglion cell soma in each imaging frame have low SNR, as the photon rate for each pixel was on the order of 0.001 photon/pixel (pixel time = 29 ns). To improve SNR, we binned data from every 12–15 successive frames, which effectively reduced the sampling rate to ∼2 Hz, a rate sufficient to capture the rise and fall of the calcium response of ganglion cells. We tracked the timing of each imaged frame, so we could align the measured responses to the correct phase of the visual stimulus cycle.
We used the peak amplitudes of the ratiometric data (ΔF/F0) to quantify the responses of each ganglion cell to visual stimuli. First, we averaged the measured fluorescence over all analyzed stimulus cycles. Then, we normalized the averaged fluorescence (F) to the mean baseline value (F0) obtained from the time preceding the onset of the 590 nm flash (1.8 to 0 s before onset), or static bars (1.9 to 0.5 s before onset) for each good stimulus cycle. Peaks were identified from the smoothed ratiometric data (F/F0) with a three-sample moving boxcar average, and the peak response amplitude was determined as the mean of two consecutive time points, both statistically different from baseline (F/F0 = 1), using a one-tailed t test. Time to peak was calculated as the middle point of the two time points. We also calculated SNR from the baseline data (F0) for each ganglion cells and used the values as a measure of detection limits for significant response (ΔF/F0) (see Fig. 2C).
Intrinsic signal responses of cones.
Upon visual stimulation, cones change their reflectivity, making their reflectance slightly brighter or dimmer (Grieve and Roorda, 2008). This reflectance change is termed the intrinsic signal responses of cones. We speculate that this intrinsic signal response reflects a subtle change in the length of cone inner and outer segments, which alters the interference of the 790 nm imaging light. Indeed, the coherence length of the 790 nm imaging light is similar to the length of cone inner and outer segments. To measure intrinsic signal response, we calculated a difference image by subtracting the reflectance image after onset of visual stimulation from that before the onset (see example in Fig. 4). Strength of the intrinsic signal response is quantified by the SD of each imaging pixel summed over the area of the difference image. The intrinsic signal response precisely reveals the spatial location of stimulated cones.
Phase-encoded map.
To generate phase-encoded maps of ganglion cells and cone mosaic in response to drifting bars (see examples in Fig. 6B,C), fluorescence and intrinsic signal response were analyzed differently as described above. For each time point, fluorescence responses were first measured as the sum of pixel values in the fluorescent imaging along each line orthogonal to bar drifting direction, then normalized by the maximal measurement along all lines. Intrinsic signal responses were measured and normalized in the same way as the fluorescence responses, but based on the absolute pixel values of the difference imaging, calculated by subtracting the reflectance images at each time point from the average value of the entire stimulus cycle. To improve the SNR of the phase-encoded maps of ganglion cells and cones, data were smoothed with 20 and 5 sample moving boxcar average along the bar drifting direction. The radon transformation was used to fit a line to the maximal intensity pixels in phase-encoded maps.
Evaluation of light safety with repeated imaging
Repeated imaging of G-CaMP5-expressing cells was conducted both to determine whether expression of calcium indicator was damaging to the cells and to permit development of optimal imaging and visual stimulation methods. To calculate the total light exposure for retinal locations in the whole imaging session, we took into account all imaging lights used (488, 790, and 850 nm) and the light used for visual stimulation (568 or 590 nm). Total light exposure did not exceed the American National Standards Institute (American National Standard for the Safe Use of Lasers ANSI Z136.1–2007) maximum permissible exposure for human retina (Delori et al., 2007) scaled by the ratio of the numerical aperture (NA) of human to nonhuman primate eyes (NAHuman2/NANon-human primate2 = 0.78) (Geng et al., 2012). Although such an exposure level was considered unlikely to be damaging, given that the maximum permissible exposure is set 10-fold below minimum damage thresholds to ensure safety, such exposure could cause autofluorescence dimming in retinal pigment epithelium cells (Morgan et al., 2009) and reduction in melanin infrared autofluorescence (B.M., unpublished observations). Because the minimal interval between imaging sessions was at least 5 d, accumulation of exposure over sessions was not considered.
Results
G-CaMP5 expression in macaque foveal ganglion cells
We used 7m8, an engineered variant of AAV serotype 2 (Dalkara et al., 2013), to deliver the cDNA encoding G-CaMP5, a genetically encoded calcium indicator (Akerboom et al., 2012), to foveal ganglion cells in the living macaque eye (Fig. 1A,B). Vector was injected intravitreally into the eye (see Materials and Methods), and expression of G-CaMP5 reached a level suitable for AO imaging 1 month after injection (Fig. 1B). Imaging studies were performed for the duration of ∼6 months. Expression of G-CaMP5 started to decline 7 months after injection, and we stopped imaging in the eighth month.

G-CaMP5 expression in foveal ganglion cells in the living macaque eye. A, Fluorescent cSLO image showing the central retina of a macaque eye 2.5 months after intravitreal injection of 7m8 viral vector, carrying CMV-G-CaMP5 gene construct (see Materials and Methods). The optic disc is to the left, visible as the source of dark blood vessels shadowed against the autofluorescent retina, and the fovea is to the right outlined by a white box. G-CaMP5 expression is visible as a fluorescent ring centered on the fovea. Scale bar, 2 degree. B, Montage of fluorescent AO images acquired from the region of the white box shown in A, 3 months after vector injection. The ring in A was comprised of somas and processes of densely transduced ganglion cells. Two ganglion cells had very high G-CaMP5 expression, making their axons (arrows) and out-of-focus dendrites (arrowheads) distinctively visible among the transduced ganglion cell population. Alignment of fluorescence AO images within the montage was based on the simultaneously imaged reflectance AO images of cones (data not shown). Scale bar, 0.5 degree. C, D, Spatial configuration of the two types of visual stimulus arrangements used shown with respect to the G-CaMP expressing foveal ring (gray). C, Imaged 1.9 × 2.1 degree field (dashed box) centered on 1 s presentation of a 7.6 degree diameter uniform-field stimulus of 590 nm light (yellowish red spot). D, The 2.2 × 3.1 degree imaging field (dashed box) in which the 488 nm imaging laser was presented only in the half field over RGCs, whereas the other half (green) was used for 488 or 568 nm spatial patterns (see Materials and Methods). Scale bar, 2 degree.
Use of uniform-field flash to evaluate the efficiency of FACILE
To examine calcium imaging of the light responses of ganglion cells, we first used a 1 s presentation of a 590 nm uniform-field light, with the experimental configuration shown in Figure 1C. Ganglion cells somas on the foveal ring were imaged within a 1.9 × 2.1 degree scanning field (Figs. 1C and 2A). The spatial extent of the uniform-field flash (spot) was 7.6 degrees in diameter, large enough to cover the foveal cones driving the imaged ganglion cells (Schein, 1988; Drasdo et al., 2007). Because foveal cones outside of the scanning field might also be light adapted from scattered imaging light, we initially used a bright flash intensity that produced an isomerization rate of ∼7.3 log10 Rh*/cone/s in L cones (see Materials and Methods).

Calcium responses of ganglion cells to uniform-field flash stimuli. A, Fluorescence AO image of G-CaMP5 expression within the region shown in Figure 1C (dashed box). An arrow indicates the direction of the fovea center. Ellipsoidal gray ROIs (n = 98) were manually placed over subjectively identified ganglion cell somas. A rectangular ROI was placed in a region devoid of ganglion cell somas, to provide a measurement of background intensity, which was subtracted from ganglion cell soma intensity. Temporal response profiles of some of these ganglion cells (numbered cells) are shown in Figure 3A (left column). Scale bar, 0.1 degree. B, Normalized peak amplitude and polarity of responses of the 98 ganglion cells selected in A. Responses were evoked by 1 s presentation every 6 s of the 590 nm spot illustrated in Figure 1C with an intensity of 7.3 log10 Rh*/L-cone/s. ROIs of each ganglion cell are labeled with a grayscale face color, which shows the square root of the relative response amplitude of each cell, normalized by the largest response amplitude of the population. Edge color indicates the polarity of response of each cell to the 1 s presentations: red represents increased response (n = 78); green represents decreased response (n = 7); gray represents no significant change (n = 13). C, Peak fluorescence responses of the 98 cells as a function of baseline fluorescence. Gray vertical lines indicate detection limits calculated from measured SNR of the baseline fluorescence for the ganglion cells, which equal 2/SNRCell. All significantly measured responses (red and green dots) are above or close to these limits.
With this intermediate intensity, we recorded significant responses from 87% (n = 85 of 98) of the ganglion cells outlined with ROIs in Figure 2A. Most cells (80%; n = 78) showed increased fluorescence (positive peak) to the uniform-field stimulus presentation (cell somas outlined in red in Fig. 2B), and a small number (7%; n = 7) showed decreased fluorescence (negative peak) (cell somas outlined in green in Fig. 2B). The 13% of cells (n = 13) in which we could not measure a significant response at this light level (no peak) are outlined in gray (Fig. 2B). Figure 2C shows that peak responses of ganglion cells were above or close to the detection limit calculated from the baseline fluorescence of each cell (see Materials and Methods).
Examples of response profiles of 12 of these ganglion cells (numbered in Fig. 2A) are shown in Figure 3. Cells 1–9 showed increased fluorescence to a 1 s step of light increment (Fig. 3A, left column), characteristic of 80% of cells in Figure 2, and decreased fluorescence to a 1 s step of light decrement (Fig. 3A, right column). Responses reached peak in ∼1 s and returned to the baseline level by approximately 3 s. Across the entire population, the amplitude (ΔF/F0) of positive peaks to light increment was 0.4 ± 0.3 (mean ± SD), and the largest amplitude was 1.5 (Fig. 2C). The spread of the response amplitudes was similar to that previously shown for in vitro mouse retina (Akerboom et al., 2012). Clear responses to the dark flash show how intracellular activity of ganglion cells is visible in calcium responses.

Examples of the time course and intensity-response functions of 12 of the 98 ganglion cells in Figure 2A to uniform-field flash stimuli. A, Temporal profile of the response of 12 of the 98 ganglion cells shown in Figure 2A to 1 s steps of light increment (first column; same data as Fig. 2B) or light decrement (second column) of the large 590 nm stimuli. Waveforms of the stimuli are shown in the first row. Intensity of the 590 nm stimulus was 7.3 log10 Rh*/L-cone/s. In each plot, mean fluorescence responses (red) and individual responses (gray) from each stimulus cycle (n = 93, 122, or 124 cycles) are shown, at a sampling rate of 1.7 Hz. The vertical dotted line indicates mean latency of the two samples identified as initial significant peak (see Materials and Methods). B, Intensity-response functions of the ganglion cells shown in A. Left column, Time course of responses to 1 s presentations of the six tested intensities. Right column, Peak amplitudes to the six intensities. Error bars show the standard errors of the measurements, which were typically smaller than the symbol size. B, Lines and dots are color-encoded to indicate stimulus intensities. Black lines and data points indicate the same data as in the left column of A. A, B, Data were collected in two imaging sessions 5 d apart, ∼5 months after vector injection.
Cells 10 and 11 shown in Figure 3 represent the 7% of cells in Figure 2 that responded to a light increment with decreased fluorescence, and both showed no significant response to a light decrement. Across the population, the amplitude (ΔF/F0) of negative peaks to light increment was small with a mean ± SD of −0.2 ± 0.1 and maximal amplitude of 0.3 (Fig. 2C). We are not clear why the proportion of ganglion cells that had negative peak responses was small. It is possible that these are OFF cells and the low proportion reflects functional lamination of the macaque retina with OFF cells less visible to en face imaging (Perry and Silveira, 1988), or a higher efficiency of transduction by the 7m8 viral vector for ON- RGCs. Cell 12 represents 13% of cells that had no significant response to light increment in Figure 2.
Intensity-response function of ganglion cells
In addition to the single flash intensity shown in Figure 3A, we also measured the responses of each cell to higher and lower intensities (over an ∼2 log10 unit range) to identify the optimal flash intensity to use for each cell (Fig. 3B). Flashes of high intensity may drive ganglion cell responses to saturation, whereas flashes of low intensity might be below our detection limit. As shown in Figure 3B, ganglion cells with positive peaks to light increment (cells 1–9) showed peak responses that generally increased with flash intensity. At the lowest light intensity (6.2 log10 Rh*/cone/s in L cones), many ganglion cells (e.g., Fig. 3B, cells 5 and 8) showed no peak response. This indicates that the adapting background was lower than, but close to, the lowest light intensity. At the highest light intensity (8.4 log10 Rh*/cone/s in L cones), many ganglion cells (e.g., Fig. 3B, cells 1–8) showed reduced responses, suggesting bleaching of cones. Some ganglion cells (e.g., Fig. 3B, cells 9 and 10) changed their polarity across flash intensities.
Use of pattern stimulus for retinotopic mapping
We used two types of pattern stimuli to find the spatial locations of cones that drove the imaged ganglion cells (retinotopic mapping): (1) static bars placed at different retina locations; and (2) drifting bars. We also took advantage of intrinsic signal response of cones to the visual stimuli (Fig. 4, bottom, examples), to empirically determine the spatial location and extent of the visual stimuli in the cone mosaic (see Materials and Methods).

Spatial configuration of imaging and visual stimulation in the experiments to map the spatial location of cone inputs to the G-CaMP5-transduced ganglion cells. The AO imaged region is that shown by the dashed box in Figure 1D. Cones were imaged over the entire imaging region, but the intense 488 nm visible light used to image RGC calcium responses was present only in the left portion of the field, which is shown as an elevated RGC image. A red dot indicates the estimated foveal center. The same 488 nm laser was used to present a static vertical bar for 1 s every 6 s at one of the three locations in the cone mosaic, centered at 0, 0.3, or 0.6 degree eccentricities. The exact locations of the bars were measured from intrinsic signal change of cones, shown in the bottom. The average width of the bars was 0.3 degree, or ∼70 μm. The time courses of calcium responses of numbered ganglion cells are shown in Figure 5. Scale bars: top, 0.1 degrees; bottom, 0.25 degrees. Data were collected ∼5.2 months after vector injection.
Retinotopic response to static bars
In the experiments illustrated in Figures 4 and 5, we placed ROIs over somas of 69 ganglion cells, and 50 cells (including the 11 numbered cells) responded to static bars presented at one or more of three locations: centered on the fovea and at mean eccentricities of 0.3 and 0.6 degree (Fig. 4). The approximate spatial location of the receptive field center of each ganglion cell was determined from the relative responses to each of the three stimulus bars. Cells 1–10 in Figure 5 are arranged in retinotopic order from those showing more response to the most foveal stimulus, to those that responded primarily to the eccentric stimuli. Comparing data of cells 1–10 in Figure 5 with the soma locations of those ganglion cells shown in Figure 4, a retinotopic pattern can be seen that is consistent with that previously reported from anatomical data (Schein, 1988). Because cells 3–6 responded most strongly to the middle bar shown in Figure 4, we can obtain a clear estimate of their receptive field center location. For these 4 cells, the average displacement between their soma and their cone inputs was 480 ± 20 μm (mean ± SD). Cell 11 in Figure 5 showed negative responses to the most foveal and middle bars. We speculate that the receptive field center of cell 11 may be at a greater eccentricity than the 0.6 degree bar and that the negative responses could represent surround inhibition.
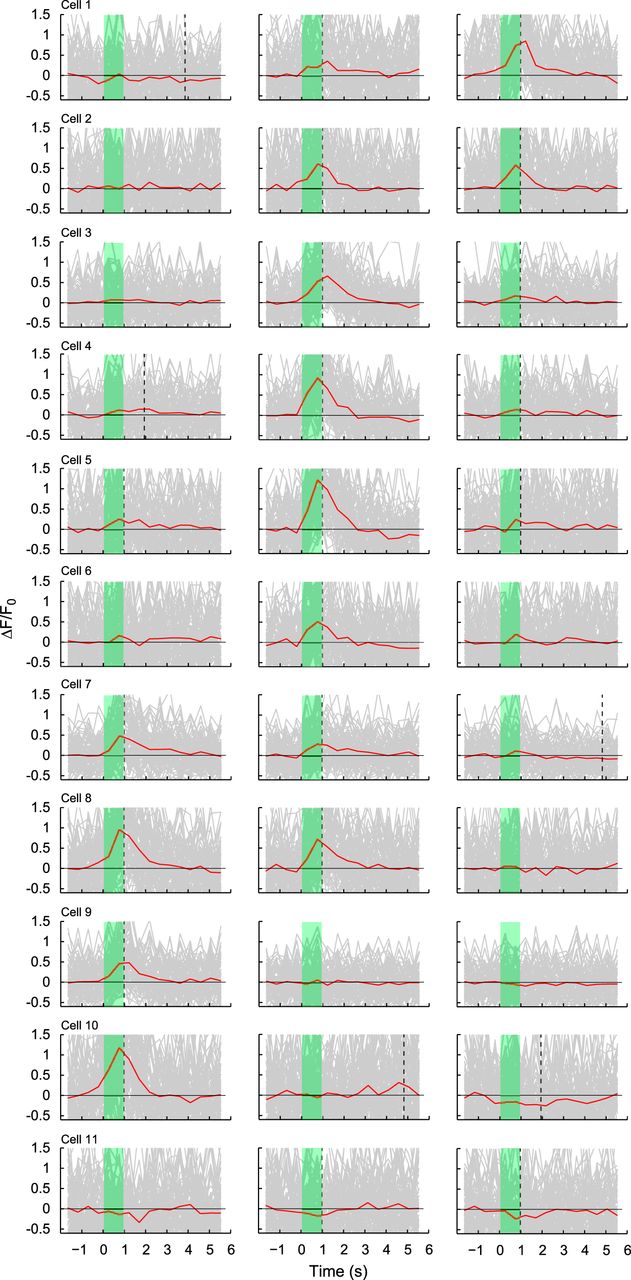
Examples of temporal responses to static bars for the 11 ganglion cells numbered in Figure 4. Temporal response profiles of 11 ganglion cells are shown to the three bars depicted in Figure 4 at eccentricities of 0.6, 0.3, and 0 degrees, from left to right. Each plot represents the mean fluorescence response in red, as well as individual responses in gray from each stimulus cycle (n = 86–88 cycles), at a sampling rate of 2.1 Hz. The green-shaded region represents stimulus presentation. The vertical dotted line indicates the time of the initial significant peak of the fluorescence response (see Materials and Methods). Cells 1–10 are arranged to show positive responses that move progressively from response to the most central stimulus to response to the most eccentric. Cell 11 responded with decreased fluorescence, which, like other negative responses shown for other cells (e.g., cell 10), could represent surround inhibition. Data were collected ∼5.2 months after vector injection.
Retinotopic response to drifting bars
In the experiments described in Figure 6, a similar spatial configuration of imaging and visual stimulation was used as those shown in Figure 4. The data (phase-encoded maps) shown in Figure 6B were determined by recording the fluorescence responses of all ganglion cells while a bright horizontal bar was drifted vertically (downward), or a bright vertical bar was drifted horizontally (leftward) across the visual field (Fig. 6A). The calculated responses of ganglion cells were based on all pixels in the fluorescence image and ignored cellular details (Fig. 6B). Simultaneously, the location of responsive cones across time was determined by recording the intrinsic signal response (Fig. 6C). From the phase-encoded map of ganglion cell responses (Fig. 6B), we estimated the time when the ganglion cells were activated by the drifting bars, which was the time spanned by the fitted line through maximal ganglion cell responses (see Materials and Methods). Using the estimated time for ganglion cell activation, we then estimated the spatial locations of cones that were activated at the same time as ganglion cells (Fig. 6C, red circles on the fitted lines), ignoring the temporal delay between the types of responses. Combining these estimates of vertical and horizontal location of cones, we determined the retinotopic relation of ganglion cells to their receptive fields. The rectangular region of the retinal location of cones that drove the imaged patch of ganglion cells is shown in Figure 6A (red box). This method to visualize receptive fields of foveal ganglion cells across time and space (distance) is similar to the use of phase-encoded response maps to determine retinotopic mapping by fMRI studies in human visual cortex (Engel et al., 1994, 1997). Using the center-to-center distances between the fluorescence image and the red box in Figure 6A, we estimated the average displacement between ganglion cells and their cone inputs as 390 μm.

Use of drifting bars to map the spatial location of cone inputs to transduced ganglion cells. A, Spatial configuration of imaging and visual stimulation. The region of fluorescence RGC imaging is shown elevated above the left portion of the cone mosaic. In the right portion of the field, either a horizontal yellow (568 nm) bar was moved vertically, or a vertical yellow bar was moved horizontally. Data for RGC (fluorescence) and cone (intrinsic signal) responses to the drifting bars are calculated from the fluorescence RGC image and the reflectance cone image outlined with white dotted lines (see Materials and Methods), and shown in B and C. Width of the bar was 0.11 degree, drift velocity was 0.11 degree/s, and each stimulus cycle lasted 10 s. The red rectangle represents the cone region that provided input to the substantially larger region of RGC calcium imaging. Scale bar, 0.2 degree. Data were collected 7.6 months after vector injection. B, C, Phase-encoded maps of ganglion cell (fluorescence) responses and cone (intrinsic signal) responses to drifting bars. In each map, normalized ganglion cell or cone responses across either vertical or horizontal locations were plotted for each time point (see Materials and Methods). Scaling of the maps was identical for cones and RGCs, and scaling along the x-axis for time was equated to that along the y-axis, by multiplying time and bar drift velocity. Straight lines were fitted to the maximal response pixels in the maps (see Materials and Methods). Times for the red circles on the fitted lines for cones are the same as the two ends of the fitted lines for ganglion cells. The four red circles set the vertical and horizontal limits of the cone region that provides input to the imaged RGC region, illustrated by the red rectangle in A. Scale bar, 0.2 degree. Smallest time division = 0.48 s.
Discussion
This study examined, for the first time, the stimulus-induced calcium response of macaque foveal RGCs over a period of several months. The calcium indicator used, G-CaMP5, remained active over an extended period, and repeated imaging did not damage G-CaMP5-expressing cells. Responses of foveal RGCs were imaged with a high-resolution, fluorescence AOSLO, which provides subcellular resolution (Gray et al., 2006; Gray et al., 2008). A spatiotemporal response mapping method was developed that used multicell phase-encoded responses to relate the intrinsic signal response of cones to the calcium response of foveal RGCs, an approach that can be used in future studies to measure the receptive fields of individual RGCs. Measures of the luminance increment response of individual RGCs showed a graded light response of many cells over a 2 log10 unit range of full-field intensity, and many cells showed saturated responses at the highest measured luminance. The study presented here extended the FACILE method first developed in the mouse eye by Yin et al. (2013), to macaque fovea.
Physiological characterization of macaque foveal RGCs
This study demonstrated the capacity of FACILE to physiologically characterize macaque foveal RGCs. First, we showed that response dynamics of the majority of foveal RGCs extended ∼2 log10 units of intensity (intensity-response function). Future studies may use this measurement to differentiate between ganglion cells that have different response dynamics. Second, we showed, for the first time, that displacement between somas of foveal RGCs and their cone inputs can be measured physiologically. Our measurements are in close agreement with estimates from anatomical studies in macaque (Perry and Cowey, 1988; Schein, 1988) and human (Drasdo et al., 2007). Future studies may use this methodology to map the receptive field profile (center/surround), and spatial coverage of different classes of RGCs, a type of data that is not possible to determine in anatomical studies.
Minimal light adaptation of photoreceptors
A challenge of retinal imaging studies is that the imaging field itself can provide unwanted stimulation of photoreceptors lying beneath imaged ganglion cells. In an earlier study in mice (Yin et al., 2013), this problem was minimized by imaging G-CaMP3 with a 488 nm laser and stimulating UV-sensitive cones with a 365 nm light. However, UV light cannot be used in the macaque because it does not penetrate the optics of the eye. A future alternative method for studying primate light responses might be the use of 2-photon imaging of calcium indicators using 920 nm light, which could provide less activation of mouse or primate photoreceptors (Sharma et al., 2013). Although investigators in our group are developing this method, it is not currently available. In the present study, we avoided intense light adaptation of photoreceptors by the imaging light by spatially separating imaging and visual stimulation lights, taking advantage of ∼300–400 μm spatial displacement of foveal RGCs from the cones that provide their input.
Advantages of this approach over presently available methods for retinal recording
The method described here permits the repeated imaging of individual RGCs over months, the simultaneous imaging of large numbers of cells, and the ability to image in the living eye. The method also should be minimally selective, making it valuable for examining rare and unusual RGC classes, such as the putative directional selective ganglion cells (Borst and Euler, 2011). The AO imaging system can also be used to deliver precisely focused stimuli to the retina, bypassing optical degradation, and stimulating individual cones, and could be combined with electrophysiological recording from single neurons in visual brain nuclei, such as the lateral geniculate nucleus (Sincich et al., 2009). For future optogenetic experiments, it may be worthwhile to compare the response of foveal RGCs to psychophysical responses of the monkey to the same stimuli, given that both CNS physiological responses and perceptual responses can depend as much on context as on the stimuli presented (Fournier et al., 2011).
Challenges in obtaining reliable and persistent transduction
This study demonstrates the feasibility of using FACILE to optically record physiological responses in macaque foveal RGCs in vivo. However, broader use of this method will require improvements in (1) consistency of transduction and (2) long-term expression of fluorescent sensor proteins in macaque inner retina. The first challenge can be illustrated by our overall success rate with initial transduction: when injected with AAV-CMV or AAV-CAG vectors, carrying either G-CaMP5 or G-CaMP6 genes (Chen et al., 2013), 2 of 3 eyes without prior AAV injection showed expression, but the rate was much lower in eyes with prior injections. We speculate that failure to transduce may be the result of preexisting inactivating antibodies against AAV capsids (Yin et al., 2011) or simply inconsistencies between viral batches. The second challenge is that AAV vector with small ubiquitous promoters, such as CMV, and CAG, which are currently needed to package large transgenes, such as G-CaMP5 into vector, can trigger an inflammatory response that eliminates gene expression (Dalkara et al., 2013) (see Materials and Methods). The mechanism of this inflammatory response is not entirely clear, but it can be effectively suppressed using immunosuppressive agents, such as triamcinolone. Development of new vectors with novel serotypes for nonhuman primate (e.g., with the directed-evolution method) (Dalkara et al., 2013), as well as the use of cell-specific (i.e., nonubiquitous) promoters could increase the duration of transduction and may make anti-inflammatory therapy unnecessary. Indeed, we have observed long-lasting gene expression using the large, neuron-specific promoter hCx36 (human connexin 36) in the past (Yin et al., 2011).
Future improvements to the method
Although the method described in this report recorded high signal-to-noise responses of large numbers of foveal RGCs, there are many ways in which it can be improved. First, all applications will be improved by analysis of the type of RGC being studied. Three methods can potentially be used to determine RGC types: (1) measuring receptive field size with high precision; (2) testing RGC responses with visual stimuli known to selectively activate certain cell types, such as color-opponent RGCs; and (3) combining retrograde transport of fluorescent markers from distinctive retino-recipient nuclei, such as the nucleus of the optic tract (NOT) (Telkes et al., 2000). In addition, more uniform expression of the calcium indicator across individual RGCs will reduce sampling bias against dimly labeled or nonlabeled cells. As shown in Figure 2C, the intensity of baseline fluorescence is correlated with the minimal response amplitude that can be detected from a cell. Second, residual eye movements slightly decrease the precision with which receptive fields can be mapped by moving the visual stimulus across the cone matrix. Methods now being developed will reduce variation in stimulus position on the retina to approximately the size of individual cones (Sincich et al., 2009). The background light level that cones adapt to within the imaging field is the minimal intensity of both imaging and visual stimulus lasers after the maximal attenuation by acoustic optical modulators (see Materials and Methods). Dimmer background with less cone bleaching can be achieved by using AOMs with higher extinction coefficients. Finally, it will be helpful to axially separate the responses of RGCs at different depths within the RGC layer because different RGC types are present at different depths (Perry and Silveira, 1988). This future study will explore the apparently greater number of ON than OFF RGCs recorded in the present study.
Footnotes
This work was supported by National Institutes of Health Grants EY014375 and EY01319, National Science Foundation Science and Technology Center for Adaptive Optics (Cooperative Agreement AST-9876783 with University of California Santa Cruz), National Eye Institute Training Grant EY07125, and the Foundation Fighting Blindness and Research to Prevent Blindness. We thank Jennifer Strazzeri for assistance with eye injection; William Fischer and Lee Anne Schery for assistance with cSLO or AO imaging, respectively; Kamran Ahmad and Keith Parkins for assistance with imaging software programming and hardware interface; Jennifer Hunter for assistance with light safety calculations; and Loren Looger from the Genetically-Encoded Neuronal Indicator and Effector (GENIE) Project at the Janelia Farm Research Campus of the Howard Hughes Medical Institute for supplying the G-CaMP5 plasmid and providing advice on its use.
D.R.W. has license agreements for AO technology with Canon and Physical Sciences, consults for GlaxoSmithKelin and Pfizer, and has an Small Business Innovation Research grant on development of novel AO technology with Polgenix. The remaining authors declare no competing financial interests.
- Correspondence should be addressed to either of the following: Dr. William H. Merigan, University of Rochester Medical Center, Box 314, Rochester, NY 14642, billm{at}cvs.rochester.edu; or Dr. Lu Yin, University of Rochester, Center for Visual Science, Rochester, NY 14642, lyin{at}cvs.rochester.edu


