Introduction
Chronic diseases like Cardio-vascular diseases and diabetes are the leading cause of mortality in the world. These are non-communicable diseases which killed millions of people in the last few years and a large portion of these deaths occurred before the age of 60 during the most productive period of life. The magnitude of these diseases continues to rise all over the world.1 There is an increase in the spread of obesity in India, with Indians exhibiting unique features of excess body fat, abdominal adiposity, increased subcutaneous and intra-abdominal fat and deposition of fat in ectopic sites.This could lead to complications like high cholesterol and triglycerides, heart disease, osteoarthritis2. Asian Indians are known to have lower body mass index (BMI) than Europeans. However, for any given BMI, Asian Indians have greater waist-to-hip ratios and abdominal fat than Europeans.3,4 Appropriate intervention in the form of weight reduction and weight management through dietary modifications and life style changes may greatly help to prevent or at least delay the onset of these chronic lifestyle diseases.There are many studies that suggest that Resistant Starch (RS) intake decreases postprandial glycaemic and insulinemic responses,5,6,7,8,9,10,11 lowers plasma cholesterol and triglyceride concentrations,12,13,14,15 increases satiety and decreases fat storage.16,17,18 RS as a prebiotic can promote the growth of beneficial microorganisms such as bifidobacteria which exert a lot of beneficial effects on human body. Butyrate, a short chain fatty acid (SCFA) produced as a result of fermentation of RS has been hypothesized to reduce the risk of colon cancer and to benefit inflammatory bowel disease. Butyrate is preferred fuel for colonic epithelial and plays a major role in regulation of cell proliferation and differentiation. It stimulates cell proliferation in normal colonocytes but suppresses proliferation of colon adenocarcinoma.19,20 These properties make RS an important dietary factor in the prevention and management of chronic non communicable diseases.Cereals, pulses and legumes, roots and tubers form a major part of an Indian diet. Since these foods are the major sources of RS in the diet and since RS consumption is associated with a number of health benefits, it becomes important to determine the RS content of typical traditional Indian starchy food preparations. The data-base so created will help to quantify the RS content of typical traditional Indian diets. Therefore the aim of this research was to estimate the RS content of selected, routinely consumed Indian food preparations and to determine the change in RS content of cereal and pulse preparations on cooking and on storage.
Materials and Methods
Cereals like rice and wheat, legumes like Green gram and Bangal gram and thirteen commonly consumed Indian preparations prepared using these cereals and legumes were analyzed for their RS content. These cereals and pulses were procured from local market, cleaned and ground using a mixer to pass through 60 mesh sieve and used for estimation of RS in raw samples.Using raw cereals and legumes, thirteen commonly consumed Indian preparations were standardised. Basmati and Kolam rice was used to prepare plain pressure cooked rice. Pulao and Khichdi were also prepared using Basmati rice and Kolam rice respectively. Chapatti, Paratha and Puri were made using whole wheat flour whereas Bhatura was made using refined wheat flour.Kabuli chana was soaked and used to prepare Chole. Whole Moong was germinated and used to prepare a typical Maharashtrian preparation MoongUsal. Similarly another traditional Maharashtrian preparation Pithle was prepared using Chana flour. All these freshly cooked samples were cooled to room temperature and ground into a fine paste using a mixer. Germinated or soaked samples were also ground into a paste using a mixer. The samples were then subjected to the process of estimation of Resistant Starch. Cooked samples of Rice (Basmati and Kolam), Khichdi, Chapatti, Pithle were also kept in the refrigerator at approximately 60 C for 12 hrs. After bringing these samples to room temperature they were ground into a paste using a mixer and were subjected to the process of estimation of Resistant Starch.RS content in all the above samples was estimated using the procedure given by Parchure and Kulkarni.21 Principle: RS content is estimated in terms of Glucose after the enzymatic hydrolysis and removal of digestible starch followed by solubilisation of RS in alkali and its hydrolysis by Amyloglucosidase.The glucose obtained is estimated by GOD – POD method.
Calculation: Resistant starch = Glucose ×0.9. Enzymes used were Alpha Amylase, Enzyme activity:21,622 BAU/gm; Amyloglucosidase, Enzyme activity:818U/gm; Protease, Enzyme activity:91,524TU/gm.All the enzymes were supplied by “Advanced Enzyme Technologies Limited.”Replicate (two) samples of each were analysed in duplicate. Weight of raw samples used for analysis varied from 100mg to 2000mg.
Statistical analysis:RS content in the raw samples was expressed as g / 100g of sample and in processed or cooked samples as g / 100g food ‘as eaten’. The RS in all the samples was expressed as mean + standard deviation. RS content in freshly cooked preparations was compared with RS content in equivalent amount of raw ingredients. RS content of freshly cooked preparations was also compared with RS in equivalent amount of cooked and stored samples. Comparison of means was done using paired t test. One-way ANOVA was also used to compare RS content of freshly cooked rice preparations, wheat preparations and legume preparations. P≤0.05 was considered statistically significant.
Results and Discussion
In all the preparations there was an increase in the final weight of cooked product as compared to the initial weight of the major raw ingredient. 50g raw rice was used in the preparations like pressure cooked rice and Pulao whereasKhichdi was made using 50g rice and Moong dhal combination. The final cooked weight for these products ranged from 176g to 190g.Chapatti and Paratha made using 50g whole wheat flour weighed 80g after cooking where as Puri and Bhatura made using 50g whole wheat flour and 50g refined wheat flour respectively weighed 88g after frying. 50g whole Moong after soaking and germination weighed 100g and when MoongUsal was made adding water to it the weight of the final product became 200g. The increase in weight observed in Kabuli chana was also similar to this. 50g Chana flour was used to make Pithle, which is a product with semi-solid consistency and it weighed 460g after cooking.Five of these preparations were stored overnight in the refrigerator before estimation of RS in them. As compared to freshly cooked products a little decrease in weight was observed in four of the five products after an overnight storage(data not shown).
There was a wide variation seen in RS content of raw samples (Table 1).It ranged from as low as 0.50g% in whole wheat flour to 27.67g% in Kolam rice. Among cereals the two varieties of rice, Basmati and Kolam contained 20.22g% and 27.67g% RS respectively where as whole wheat flour and refined wheat flour contained 0.50g% and 0.65g% RS respectively.Vatanasuchart22 also have reported higher RS values and a wide difference in the values for polished hard rice (raw) and polished soft rice (raw), the values being 34.8g and 11.6g/100g dry weight respectively. A study by Chen23 reported RS values for four different varieties of rice from Chinese diet, which ranged from 10.3g to 20.8g/100g total starch basis. The wide difference in RS content among cereals in the current study could be because of the difference in the size of the particles. Though rice grains were ground in the mixer before estimation of RS, to obtain rice flour, the particle size must have remained larger than the commercially milled rice to make rice flour. In the current study, both, whole wheat flour and refined wheat flour were obtained from the market, where commercial process of milling wheat grains into flour must have led to formation of very fine particles. This difference in the particle size could be the main reason for the wide difference in the RS content of rice and wheat flours.Whole grain products are likely to contain more RS type 1 than flours.23 For this type of RS, which is a starch physically entrapped within the food, the extent of milling is an important factor. More extensive milling should make the starches more accessible and less resistant to digestion as smaller particles have larger surface area available for the action of digestive enzymes thus reducing RS1.Similar to the findings of the present study, low RS content in cereal flours as compared to whole grains was also reported by Chen et al.,23 In whole grains, part of the starch is encapsulated in grain structure and thereforedigestive amylases may not be able to penetrate or break down the cellulose cell walls and therefore, this starch is inaccessible. Alsaffaret al.,24 reported findings of two studies in which RS concentrations were found to be low for the flours of cereals.
In the current study, the two varieties of rice included, Basmati and Kolam, differed in RS content. But the difference was not statistically significant (P ≥ 0.05, Figure 1 A).This difference in RS content could be because of several factors like botanical origin, amyloase/ amylopectin ratio, cellular structure, and variation in the shape of starch granules and crystalline structure of the two rice varieties which may influence RS quantities in rice. Rice varieties even with similar amylose content can result in different starch digestion rate due to different physiochemical properties and the factors mentioned above.25 Two varieties of rice used in the study by Vatanasuchart et al 22 also showed large difference in their RS content.
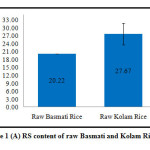 |
Figure 1(A): RS content of raw Basmati and Kolam Rice |
The RS content of whole wheat flour and refined wheat flour also differed though not statistically significant, in the current study, refined wheat flour having more RS than whole wheat flour (P ≥ 0.05, Figure 1 B). These two flours were obtained from local market. There could be a difference in the variety of wheat grains used to make these two flours which partly explains the difference in the RS content. Since refined flour contains higher percentage of starch as compared to whole wheat flour, it would possibly have higher percentage of RS than whole wheat flour.
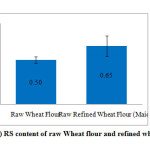 |
Figure 1(B): RS content of raw Wheat flour and refined wheat flour |
The RS content of legumes analysed in this study ranged from 1.93g% in Kabuli Chana to 4.52g% in Whole Moong. Whole Moong contained significantly higher amount of RS as compared to Kabuli chana and Chana flour (P ≤ 0.05) but the difference in RS content of Kabuli chana and Chana flour was not statistically significant (P ≥ 0.05, Figure 1 C).In this study legumes showed higher RS content than cereal flours like Whole wheat flour and refined wheat flour (Table 1).
Table 1: RS in raw food material
| Food Sample | RS (g per 100 g) | SD |
| Basmati rice |
20.22 |
0.014 |
| Kolam rice |
27.67 |
4.094 |
| Whole wheat flour |
0.50 |
0.035 |
| Refined wheat flour |
0.65 |
0.113 |
| Whole moong |
4.52 |
0.191 |
| Kabuli channa |
1.93 |
0.035 |
| Channa flour |
1.98 |
0.240 |
Table 1 shows the RS content in raw samples. The values are given as mean + SD.
Similar findings have been reported by others.26,27 High RS content of legumes can be attributed to the presence of intact cell/tissue structures enclosing starch granules,23 high level of amylose, high content of viscous SDF (soluble dietary fibre) components, presence of large number of antinutrients, ‘B’ type crystallites and strong interactions between amylose chains.
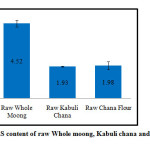 |
Figure 1(C): RS content of raw Whole moong, Kabuli chana and Chana flour |
Table 2 shows Resistant Starch content in cooked or processed food products. RS in these food products is expressed in g/100g food ‘as eaten’. The values in the table appear as mean + SD. Among four freshly cooked rice preparations RS varied from 0.46g% in cooked Kolam to 0.78g% in Khichdi. These results are in agreement with the results reported by Chiu et al.,16 where the RS in four different varieties of pressure cooked rice ranged from 0.29g to 0.58g/100g prepared rice. A higher value i.e. 3.7% RS (total starch basis) is reported by Elmstahl26 for boiled long-grain rice available in Swedish market. But this rice product was parboiled. The parboiling process may affect the rice structure in such a way that the starch will be more restricted in swelling, which may be the cause for the higher RS level in this boiled rice. In an Indian study28 boiled rice contained 2.1g% RS on dry weight basis, which is also a higher value as compared to the value obtained in the current study. But in the current study RS in cooked food is reported as g of RS in 100g food ‘as eaten’, which means that the food would also have high percentage of moisture, due to which the percentage of RS in food would be low as compared to when reported as ‘dry weight basis’.
Table 2: RS in freshly cooked or processed food products
| Freshly Cooked / Processed Food Sample | RS (g per 100 g) | SD |
| Pressure cooked Basmati rice |
0.47 |
0.028 |
| Pressure cooked Kolam rice |
0.46 |
0.021 |
| Pulao |
0.55 |
0.035 |
| Khichadi |
0.78 |
0.014 |
| Chapatti |
0.49 |
0.021 |
| Paratha |
0.61 |
0.035 |
| Puri |
0.47 |
0.021 |
| Bhatura |
0.54 |
0.007 |
| Germinated (sprouted) moong |
0.79 |
0.057 |
| Germinated (sprouted) moongusal |
0.87 |
0.042 |
| Soaked kabulichanna |
0.73 |
0.007 |
| Chhole |
2.38 |
0.297 |
| Pithale |
0.09 |
0.012 |
Among four wheat preparations (freshly cooked) RS content varied from 0.47g% in Puri to 0.61g% (food as eaten) in Paratha (Table 3). Chapatti and Bhatura contained 0.49g% and 0.54g% RS (food as eaten) respectively. These are typical Indian wheat based preparations, and unlike boiled rice, very few studies have been done on these wheat preparations with respect to their RS content. Premavalli et al 29 have reported findings of a study in which the RS content of Wheat roti (chapatti) was found to be 1.4g/ 100g total starch. In another study,28 RS content in chapatti, paratha, puri (all made from wheat flour) was found to be 2.9g%, 2.2g%,and 1.4g% (dry weight basis) respectively. In both these studies RS values reported are higher than the values obtained in the current study. This could be because, in these studies the results are reported either on ‘total starch’ basis or ‘dry weight’ basis. Both would give higher values as compared to results, when reported on the basis of ‘food as eaten’.
Table 3: RS content of freshly cooked rice products and RS in equivalent amount of raw ingredients
| Name of the Product | RS( g per 100 g) in Freshly Cooked / Processed Product | RS (g) in Equivalent Amount of Raw Ingredient |
P Value |
| Pressure cooked Basmati rice |
0.47+0.028 |
5.66+0.00 |
0.00 |
| Pressure cookedKolam rice |
0.46+0.021 |
7.28+1.07 |
0.012 |
| Pulao |
0.55+0.035 |
5.74+0.007 |
0.00 |
| Khichadi |
0.78+0.014 |
7.68+1.13 |
0.013 |
RS in five pulse preparations was estimated in the current study (Table 3). It ranged from 0.09g% in freshly cooked Pithle to 2.38g% in cooked Chhole. The RS values for germinated Moong, MoongUsal, and soaked Kabuli chana were 0.79g%, 0.87g% and 0.73g% (food as eaten) respectively. Except for Pithle RS content of all other pulse preparations was higher than rice (except Khichdi) and wheat preparations. But these values were much lower as compared to values reported by Katyal et al.,30 for pressure cooked decorticated pulses, where it was approximately 8.5g in 100g. Decorticated legumes may have higher values due to changes occurring in starch structure during decortications which involves removal of the outer covering of the grain either by dry or wet method. This may contribute to RS formation. Removal of outer cover also increases starch concentration, possibly leading to an increase in RS. RS values reported by Yadav et al.,27 for conventionally boiled or pressure cooked pulses varied from a minimum of 3.4% in pea to a maximum of 4.9% in lentils. These values were also higher than the values obtained in the current study. But in this study by Yadav et al., the legumes were first converted into flours and then cooked using moist heat method. Pressure cooking was done using an autoclave and not a pressure cooker. These differences in the processing and cooking techniques could partly be responsible for differences in RS content of cooked legumes reported in different studies.
Table 3 gives the Resistant Starch content in freshly cooked rice preparations and in equivalent amount of raw ingredients. The values in the table appear as mean + SD. RS content was significantly lower in all the four freshly cooked rice products as compared to RS in equivalent amount of raw rice (P≤0.05). This was expected as both the varieties of rice in the current study showed very high RS content in their raw form which could be due to higher amount of encapsulated starch in raw rice grains leading to higher RS1. All the rice preparations in the current study were cooked using moist heat treatment i.e. pressure cooking. Moist heat treatment of rice grains leads to disruption of the native starch granules due to gelatinization of starch, making starch partly soluble and available to digestive enzymes thereby decreasing RS1 and increasing its digestibility. Similar effect of boiling and pressure cooking on RS content of rice was also observed by Sagum and Arcot.31 In their study boiling and pressure cooking of rice produced low RS values of 1.0 to 2.2% and 0.8 to 2.8%, respectively, compared to that of the raw rice samples(8.6 to 12.9%).
Table 4 gives the Resistant Starch content in freshly cooked wheat preparations and in equivalent amount of raw ingredients. The values in the table appear as mean + SD. All four freshly cooked wheat products showed increase in RS content after cooking as compared to their corresponding raw equivalents. Except for Bhatura, in which the increase was not significant (P ≥ 0.05), in the rest of the wheat preparations the increase was statistically significant (P ≤ 0.05). Roasting, Shallow frying, and deep fat frying methods used in case of Chapatti, Paratha, Puri and Bhatura respectively, are all dry heat method techniques. These results show that dry heating has a detrimental influence on the starch digestibility which might be due to trans glycosidation reactions. During roasting and shallow frying starch undergoes chemical alterations leading to formation of atypical glycosidic bonds and the concomitant reduction in amylolytic susceptibility resulting in formation of RS.32
Table 4: RS content of freshly cooked wheat products and RS in equivalent amount of raw ingredients
| Name of the Product |
RS( g per 100 g) in Freshly Cooked Product |
RS (g) in Equivalent Amount of Raw Ingredient |
P Value |
| Chapatti | 0.49+0.021 |
0.31+0.028 |
0.020 |
| Paratha |
0.61+0.035 |
0.30+0.02 |
0.009 |
| Puri |
0.47+0.021 |
0.28+0.02 |
0.014 |
| Bhatura |
0.54+0.007 |
0.37+0.07 |
0.082 |
Significant increase in RS content by 1.3, 1.5 and 1.7 fold in maize rotla, chapatti and pearl millet rotla respectively, was also observed by Vaidya et al.,28 The study also showed one fold increase in amylose content upon roasting which may also be one of the factors for increased RS content in roasted cereal products like Chapatti. Same study also reported a non significant increase in RS content of Paratha and a significant increase in RS of Thepla. Both these are shallow fried preparations.
Table 5 gives the Resistant Starch content in processed /freshly cooked legume preparations and in equivalent amount of raw ingredients. The values in the table appear as mean + SD. In the current study, treatments like germination, soaking and use of moist heat for legumes led to significant change in their RS content. Except for Chole, significantly lower RS was found in all legume preparations as compared to their raw equivalent quantities. As soaking and germination of legumes activates the dormant enzymes, there would be improved digestibility of these legumes. Thus the RS content of germinated legumes is expected to reduce.
Table 5: RS content of processed/ freshly cooked legume products and RS in equivalent amount of raw ingredients
| Name of the Product | RS( g per 100 g) in Freshly Cooked / Processed Product |
RS (g) in Equivalent Amount of Raw Ingredient |
P Value |
| Germinated (sprouted) moong |
0.79+0.057 |
2.26+0.09 |
0.003 |
| Germinated (sprouted) MoongUsal |
0.87+0.042 |
1.13+0.04 |
0.026 |
| Soaked Kabuli Channa |
0.73+0.007 |
0.88+0.014 |
0.005 |
| Chhole |
2.38+0.297 |
0.49+0.007 |
0.012 |
| Pithale |
0.09+0.012 |
0.22+0.02 |
0.017 |
These legumes were pressure cooked before preparing MoongUsal or Chole. As in case of pressure cooked rice RS content in MoongUsal was significantly lower than RS in equivalent amount of raw Moong. The low RS in MoongUsal could be the combined effect of germination and moist heat treatment.
In contrast to this significant increase in RS content was observed in Chole after cooking as compared to RS in its raw equivalent quantity. Kabuli Chana was not germinated before making Chole in this study. This could partly explain the inconsistency observed in the results as far as the effect of cooking on RS content of legumes is concerned.
Increase in RS content after pressure cooking decorticated red gram and green gram has been reported by Katyalet al.,30 Though cooking results in release of encapsulated starch, thereby causing a reduction in RS1, there could be simultaneous increase in amylose retrogradation and formation of RS3. Legumes do contain higher amount of amylose as compared to cereals. Therefore there is a possibility of forming more RS3 in legumes after moist heat treatment.
Table 6 shows comparison between RS content in freshly cooked and in equivalent amount of cooked and stored preparations. Values in the table are given as mean ± standard deviations. The loss of weight during storage of food preparation has been accounted for while determining the effect of storage on RS content of food preparations. In all the preparations RS content increased after an overnight storage. A significant increase (P ≤ 0.05) was seen in pressure cooked and stored Kolam Rice. In the rest of the products the increase was not significant (P≥0.05).
Table 6: RS in freshly cooked product and RS in equivalent amount of cooked and stored product
| Name of the Product | RS( g per 100 g) in Freshly Cooked Product as eaten | RS(g) in Equivalent Amount ofCooked and Stored Product | P value |
| Pressure cookedBasmati rice | 0.47+0.028 |
0.56+0.028 |
0.86 |
| Pressure cookedKolam rice |
0.46+0.021 |
0.74+0.014 |
0.04 |
| Khichadi |
0.78+0.014 |
0.79+0.098 |
0.90 |
| Chapatti |
0.49+0.021 |
0.58+0.042 |
0.10 |
| Pitahle |
0.09+0.012 |
0.12+0.014 |
0.12 |
Increase in RS content of cereal products on storing at 40 C during 12 and 24 h was shown by Vidyaet al.,28 Chou et al.,33 reported increase in RS content of potato samples after water bath treatment and storage time of 7 and 14 days.
B S Yadav34 reported an increase in RS in baked breads when stored for 24, 48, 72 and 96h. This is due to the formation of RS3.
During moist heat treatment starch granules are gelatinized and partly solubilized making them available to digestive enzymes. The formation of RS3 which is retrograded amylose takes place within hours after heating, during cooling period. This increases the RS content of cooked and stored product.
Among four freshly cooked rice preparations, Fig. 2 (A), Khichdi contained significantly higher(P≤0.05) amount of RS as compared to other rice preparations. RS content of freshly cooked Basmati rice, Kolam rice, and Pulao ranged from 0.46g to 0.55g per 100g as eaten and the difference among these preparations was not statistically significant (P ≥ 0.05). As mentioned earlier legumes contain higher amount of RS than cereals. This could be the main reason for high RS in Khichdi, which is made with rice and moong dal combination
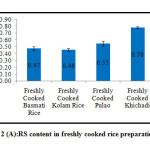 |
Figure 2(A):RS content in freshly cooked rice preparations |
Among freshly cooked wheat preparations, Figure 2 (B), highest RS content was observed in Paratha. The RS value for Paratha was significantly higher than Chapatti and Puri (P ≤ 0.05), whereas the difference between the RS content of Paratha and Bhatura was not statistically significant (P ≥ 0.05). Increase in RS value in shallow fried preparations has been reported in a study28 in which shallow fried Paratha showed a non-significant increase in RS value as compared to raw wheat flour, whereas Thepla made out of pearl millet showed significantly higher RS value than raw pearl millet.
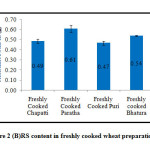 |
Figure 2(B): RS content in freshly cooked wheat preparations |
Deep fried puri had the lowest RS value. There are studies with similar results, where deep frying of food resulted in lower RS.28,34
Bhatura though deep fried, contained more RS than Chapatti and Puri. This could be because Bhatura is made using refined wheat flour which had higher RS in its raw form than whole wheat flour.
As seen in Figure 2(C) when RS content in three freshly cooked legume preparations was compared, Chhole had significantly higher RS content (P≤ 0.05) than Moong Usal or Pithle. Pithle had the lowest RS value and this was expected, as Pithle is the preparation which is semi-solid in consistency and is prepared by adding sufficient water. The weight of cooked Pithle in this study, was almost 10 times the weight of its raw ingredient whereas in case of Moong Usal and Chole the final weight after cooking was approximately just 4 times the weight of corresponding raw ingredients. Thus the dilution effect seen was more in Pithle than the other two products.As mentioned earlier the difference in the RS content of Moong Usal and Chole could be partly explained by the fact that moong usal was prepared using soaked and germinated Moong whereas Kabuli chana used to prepare Chhole was just soaked and not germinated. As mentioned earlier germination improves digestibility of the product. The comparison of RS content in two different legumes may not be justifiable as different legumes might not show similar effects of the same cooking treatments. More research in this direction is required.
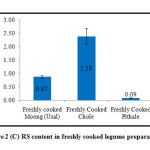 |
Figure 2(C): RS content in freshly cooked legume preparations |
Conclusion
To conclude, the findings of this research show that Resistant Starch content of food preparation is influenced by many factors such as cooking method, processing technique, storage etc. In general moist heat treatment increased RS content whereas dry heat treatment decreased RS content of a food preparation. Overnight storage also led to increase in RS content.Considering that Indians consume a vast variety of starchy preparations, further research in this direction is needed, to create a complete database of Resistant Starch content of Indian starchy preparations, that are made using different cooking and processing techniques and stored under varied conditions.
Acknowledgements
Mrs Madhuri R. Nigudkar wishes to thankProf. Dr.Jagmeet Madan, Principal, SVT College of Home Science (Autonomous), SNDT Women’s University, Mumbai, for her encouragement in taking up Minor Research and for the constant support offered throughout this assignment and UGC for the financial assistance without which this research would not have been possible.
References
- WHO. (2010). Global status report on non communicable diseases 2010. Retrieved from WWW.who.int-nmh/publications/ncd_report2010/en.
- Kalra, S., &Unnikrishnan, A. G. (2012). Obesity in India. J Med NutrNutraceu, 1(1), 37-41.
CrossRef - Thiruwagounder, M., Khan, S., &Dhasthagir, S. S. (2010). The prevalence of metabolic syndrome in a local population in India. BiochemiaMedica, 20(2), 249-52.
CrossRef - Cornier, M. A., Dabelea, D., Henandez, T. L., Lindstrom, R. C., Steig, A. J., Stob, N. R., & Van Pelt, R. (2008). The metabolic syndrome. Endocr.Rev, 29, 777-822.
CrossRef - Brown, I. (1996). Complex Carbohydrates and Resistant Starch.Nutr. Rev., 54(11), S115-S119.
CrossRef - Behall, K. M., &Hallfrisch, J. (2002). Plasma glucose and insulin reduction after consumption of breads varying in amylose content. Eur.J.Clin.Nutr., 56, 913-920.
CrossRef - Aziz, A. A., Kenney, L. S., Goulet, B., & Abdel-Aal, E. S. (2009). Dietary starch type affects body weight and glycemic control in freely fed but not energy-restricted obese rats. J.Nutr., 139(10), 1881-1889.
CrossRef - Li, M., Piao, J. H., Tian, Y., Li, W. D., Li, K. J., & Wang, X. G. (2010). Postprandial glycaemic and insulinaemic responses to GM-resistant starch-enriched rice and the production of fermentation-related H2 in healthy Chinese adults. Brit.J.Nutr.,103, 1029-1034.
CrossRef - Behall, K. M., Scholfield, D. J., Hallfrisch, J. G., &LiijebergElmstahl, H. G. M. (2006). Consumption of both Resistant Starch and beta-glucan improves postprandial plasma glucose and insulin in women.Diabetes Care, 29, 976-981.
CrossRef - Robertson, M. D., Currie, J. M., Morgan, L. M., Jewell, D. P., &Frayn, K. N. (2003). Prior short-term consumption of Resistant Starch enhances postprandial insulin sensitivity in healthy subjects.Diabetologia, 46(5), 659-665.
CrossRef - Bodenham, C., Frost, G., & Robertson, D. (2008). The acute effects of Resistant Starch on postprandial insulin responses and appetite. Proceedings of the Nutrition Society, 67(OCE 8), E341.
CrossRef - De Deckere, E. A. M., Kloots, W. J., & Van Amelsvoort, J. M. M. (1993). Resistant Starch decreases serum total cholesterol and triacylglycerol concentrations in rats. J.Nutr., 123(12), 2142-2151.
- Lopez, H. W., Lebrat-Verny, M. A., Coudray, C., Besson, C., Krespine, V., Messager, A., Demigne, C., &Remesy, C. (2001). Class 2 Resistant Starches lower plasma and liver lipids and improve mineral retention in rats. J.Nutr., 131(4), 1283-1289.
CrossRef - False Liu, X., & Ogawa, H. (2009). Hypolipidaemic effect of Maize starch with different amylose content in ovariectomized rats depends on intake amount of Resistant Starch . Brit.J.Nutr., 101(3), 328-339.
CrossRef - Han, K. H., Fukushima, M., Kato, T., Kojima, M., Ohba, K., Shimada, K., Sekikawa, M., & Nakano, M. (2003). Enzyme-resistant fractions of beans lowered serum cholesterol and increased sterol excretions and hepatic mRNA levels in rats. Lipids, 38(9), 924.
CrossRef - Chiu, Y. T., & Stewart, M. L. (2013). Effect of variety and cooking method on Resistant Starch content of white rice and subsequent postprandial glucose response and appetite in humans . Asia Pac.J.Clin.Nutr.,22(3), 372-379.
- Champ, M., Langkilde, A. M., Brouns, F., Kettlitz, B., & Bail-Collet, Y. L. (2003). Advances in dietary fibre characterisation. 2. consumption, chemistry, physiology and measurement of Resistant Starch; implications for health and food labelling. Nutrition Research Reviews, 16, 143-161.
CrossRef - Zhou, J., Hegsted, M., McCutcheon, K. L., Keenan, M. J., Xi, X., Raggio, A. M., & Martin, R. J. (2006). Peptide YY and proglucagon mRNA expression patterns and regulation in the gut. . Obesity, 14, 683-689.
CrossRef - Sajilata, M. G., Singhal, R. S., & Kulkarni, P. R. (2006). Resistant Starch – a review. Comprehensive Review in Food Science and Food Safety, 5(1), 1-17.
CrossRef - Topping, D. L., Fukushima, M., & Bird, A. R. (2003). Resistant Starch as Prebiotic and Synbiotic : State of the art. Proceedings of the Nutrition Society, 62, 171-176.
CrossRef - Parchure, A. A., & Kulkarni, P. R. (1997). Effect of food processing treatments on generation of Resistant Starch. International J.Food Sci. Nutr., 48, 257-260.
CrossRef - Vatanasuchart, N., Boonma, N., &Wongkrajang, K. (2009). Resistant Starch contents and the in vitro starch digestibility of Thai starchy foods. Kasetstart J.(Nat.Sci.), 43(1), 178-186.
- Chen, L., Niu, R., Qin, C., Meng, Y., Zhang, J., Wang, Y., & Xu, G. (2010). Sources and intake of Resistant Starch in the Chinese diet. Asia Pac.J.Clin.Nutr.,19(2), 274-282.
- Alsaffar, A. A. (2011). Effect of food processing on the Resistant Starch content of cereals and cereal products – a review. Inter.J.FoodSci.Technol, 46, 455-462.
CrossRef - Panlasigui, L., Thompson, L., Julino, B., Perez, C., Yiu, S., & Greenberg, G. (1991). Rice varieties with similar amylose content differ in starch digestibility and glycemic response in humans. Am J ClinNutr, 54, 871-7.
CrossRef - Elmstahl, H. L. (2002). Resistant Starch content in selection of starchy foods on the Swedish market. Eur.J.Clin.Nutr., 56, 500-505.
CrossRef - Yadav, B. S., Sharma, A., & Yadav, R. B. (2010). Resistant Starch content of conventionally boiled and pressure cooked cereals, legume and tubers.J.Food.Sci.Technol., 47(1), 84-88.
CrossRef - Vaidya, R. H., &Sheth, M. K. (2011). Processing and storage of Indian cereal and cereal products alters its Resistant Starch content. J.Food.Sci.Technol.,48(5), 622-627
CrossRef - Premavalli, K. S., Rupa, S., &Bawa, A. S. (2006). Resistant Starch – a functional dietary fibre. Indian Food Industry, 25(2), 40-45.
- Katyl, D., Ghugre, P. S., &Udipi, S. A. (2005). Resistant Starch in selected raw and processed legumes.J.Food.Sci.Technol., 42(6), 506-510.
- Sagum, R., &Arcot, J. (2000). Effect of domestic processing methods on the starch, non-starch polysachharides and in vitro starch and protein digestibility of rice with varying levels of amylose. Food Chemistry, 70, 107-111.
CrossRef - Siljestorm, M., Bjorck, I., &Eliasson, C. A. (1989). Characterisation of resistant starch from autoclaved wheat starch. Starch / strake, 41, 147-151.
- Chou, C., Wu, M., Nourtama, B., & Lin, J. (2010). Effects of different heating treatments and storage time on formation of Resistant Starch from potato starch.Kasetstart J.(Nat.Sci.), 44, 935-942.
- Yadav, B. S. (2011). Effect of frying, baking and storage conditions on Resistant Starch content of foods. British Food Journal, 113(6), 710-719.
CrossRef

This work is licensed under a Creative Commons Attribution-NonCommercial-ShareAlike 4.0 International License.

This work is licensed under a Creative Commons Attribution 4.0 International License.


