10 May 2021: Clinical Research
Functional Magnetic Resonance Imaging of Language Following Constraint-Induced Aphasia Therapy Primed with Intermittent Theta Burst Stimulation in 13 Patients with Post-Stroke Aphasia
Jane B. Allendorfer1BCDEF*, Rodolphe Nenert1BCDE, Sangeeta Nair1CDE, Jennifer Vannest2ABDE, Jerzy P. Szaflarski13ABCDEFGDOI: 10.12659/MSM.930100
Med Sci Monit 2021; 27:e930100


Abstract
BACKGROUND: Aphasia is a debilitating consequence of stroke. This study aimed to investigate the role of functional magnetic resonance imaging (fMRI) activation changes during overt language tasks in promoting language improvements following constraint-induced aphasia therapy (CIAT) primed with intermittent theta burst stimulation (iTBS) in 13 patients with aphasia following ischemic stroke.
MATERIAL AND METHODS: Participants with post-stroke aphasia participated in CIAT primed with iTBS on 10 consecutive weekdays. They also underwent language testing and fMRI while performing overt language tasks at baseline (N=13), immediately post-treatment (N=13), and after 3 months (N=12). Outcome measures were compared between time points, and relationships between changes in language ability and fMRI activation were examined.
RESULTS: We observed improvements in naming (p<0.001), aphasia symptoms (p=0.038), apraxia of speech symptoms (p=0.040), perception of everyday communicative ability (p=0.001), and the number of spoken words produced during fMRI (p=0.028). Pre- to post-treatment change in naming was negatively correlated with change in right postcentral gyrus activation related to noun-verb associations (rho=-0.554, p=0.0497). Change in aphasia symptoms from immediately after to 3 months post-treatment was negatively correlated with change in bilateral supplementary motor area activation related to verbal encoding (rho=-0.790, p=0.0022).
CONCLUSIONS: Aphasia improvements coupled with fMRI activation changes over time provide support for treatment-induced neuroplasticity with CIAT primed with iTBS. However, a larger randomized sham-controlled study is warranted to confirm our findings and further our understanding of how iTBS can potentiate beneficial effects of language therapy in post-stroke aphasia.
Keywords: Aphasia, Language Therapy, Magnetic Resonance Imaging, Stroke, Transcranial Magnetic Stimulation, Brain, Language, Language Tests, Speech, stroke rehabilitation
Background
Aphasia, one of the most debilitating consequences of stroke in the left middle cerebral artery territory, has significant negative effects on a person’s health outcomes and quality of life [1]. Post-stroke aphasia in the acute setting is associated with increased hospital length of stay, prolonged rehabilitation, and increased inpatient complications [2]. Long-term negative outcomes from chronic post-stroke aphasia include performing worse in activities of daily living, decreased independence, and increased mortality [2]. Thus, there is increased focus on treating post-stroke aphasia and developing ways to improve post-stroke language recovery.
Studies have indicated that non-invasive brain stimulation such as repetitive transcranial magnetic stimulation (rTMS) may promote more effective language recovery after stroke [3–6]. One prevailing concept is that diminished transcallosal inhibition of the non-dominant right hemisphere following left middle cerebral artery stroke negatively affects the potential of left-hemispheric dominant language centers to recover function [7,8]. Restoring inhibition of the non-dominant right hemisphere using low-frequency rTMS (1–4 Hz) applied to the unaffected hemisphere may be effective in improving language functions [7,8]. However, this concept has been questioned recently [9]. While the majority of studies administer inhibitory low-frequency rTMS to the unaffected right hemisphere for the treatment of post-stroke aphasia [8], administration of excitatory rTMS (>5 Hz) to the left-hemispheric language areas has been shown to improve language performance in those with primary progressive aphasia [10] and in healthy individuals [11]. Additionally, intermittent theta burst stimulation (iTBS) is an excitatory rTMS paradigm [12] that has also been shown to promote improvements in language function in post-stroke aphasia when applied to the language-responsive peristroke cortex [3, 4].
Regular participation in language therapy is the current standard of care for the treatment of post-stroke aphasia [13]. In a review of 57 randomized controlled trials, speech and language therapy resulted in significant communication improvements in people with post-stroke aphasia [14]. Specifically, constraint-induced aphasia therapy (CIAT) is a group treatment approach in which individuals are constrained to practicing the speech behaviors that they have the most difficulty with, and has shown effectiveness in improving language functions in chronic post-stroke aphasia [3,15–17]. However, progress resulting from language therapy can be slow, particularly in the chronic stage of stroke [18]. The addition of non-invasive brain stimulation to the treatment arsenal for post-stroke aphasia may help boost treatment effects of language therapy by taking advantage of the neuromodulatory effects of rTMS. Studies combining language therapy with rTMS have shown positive results in improving language function in post-stroke aphasia [3,6,19–22]. As stated above, the majority of these studies administered inhibitory low-frequency rTMS to the unaffected right hemisphere and found language improvements, particularly with naming [23–26]. One double-blind randomized controlled trial showed significant language improvement with dual stimulation of 20 Hz excitatory rTMS applied to the lesioned left hemisphere Broca’s area along with 1 Hz inhibitory rTMS to the unaffected right hemisphere homologue [27]. The iTBS protocol is a unique rTMS paradigm in that it is similar to the pattern of hippocampal neuronal firing and may facilitate long-term potentiation [28]. Huang et al (2005) showed that an iTBS protocol consisting of 600 pulses over 190 seconds (2 second train of TBS repeated every 10 seconds) facilitated motor evoked potentials for at least 60 minutes post-stimulation [12]. Furthermore, iTBS has been shown to improve language function in patients with chronic post-stroke aphasia when used alone [4] or prior to CIAT group sessions [3]. Thus, iTBS could serve as a primer in order to enhance the effects of language therapy.
The current study reports on the results of 2 additional overt language functional magnetic resonance imaging (fMRI) tasks, additional language assessments performed by the participants as part of the same experiment but not previously described in Szaflarski et al (2018), and adds one more participant who was not reported previously [3]. We examined baseline to immediate post-treatment changes (T1 vs T2) in fMRI activation during the overt language tasks, sustainability of the fMRI response (i.e., residual effects of treatment) after 3 months (T2 vs T3) and if there was a continued improvement observed compared to baseline after 3 months (T1 vs T3), as well as examining brain-behavior relationships. Therefore, this study aimed to investigate the role of fMRI activation changes during the overt language tasks in promoting language improvements following CIAT primed with iTBS in 13 patients with aphasia following ischemic stroke.
Material and Methods
PARTICIPANTS:
The study participants are the same as those previously described in Szaflarski et al (2018) [3] except for adding one participant who was not reported on previously. Adults who were ≥18 years old who had suffered a single ischemic left middle cerebral artery stroke ≥1 year prior to enrollment were recruited. Other inclusion criteria were aphasia as determined via screening with the Token Test and scoring lower than the 90th percentile [29] and fluency in the English language prior to stroke. Exclusion criteria included age <18 years at the time of stroke and at time of study participation, receiving language therapy within 3 months prior to study enrollment, underlying degenerative metabolic disorder, self-reported severe depression or other psychiatric disorders, pregnancy or a positive urine pregnancy test in women of childbearing age, and any contraindications to 3T MRI (e.g. metal implants) or to TMS (e.g. has epilepsy or previously experienced seizures except for a single seizure within 24 hours of the stroke; none of the participants used chronic anti-seizure medications). The CONSORT flow diagram in Figure 1A provides an overview of the study recruitment of subjects. As previously described, 32 participants were offered study participation, and 7 declined [3]. Of the 25 who accepted participation and were consented 5 were excluded due to illness (n=1), and for not undergoing MRI (n=4). Seven of the 20 participants who completed baseline (T1) procedures received only visit 1 MRI and were not included in data analyses. Of the 13 remaining participants, one did not attend the 3-month follow-up visit (T3), and 12 attended all 3 MRI visits (T1, T2, and T3). Aphasia types as determined by a speech-language pathologist (JV) following interview and interactions are as follows: 1 with global aphasia, 1 with conduction aphasia, 1 with Wernicke’s aphasia, 2 with Broca’s aphasia, and 8 with anomic aphasia. None of the participants presented with dysarthria. Baseline demographic and clinical characteristics are provided in Table 1.
STUDY DESIGN:
We conducted an open-label study of CIAT primed with iTBS for the treatment of chronic post-stroke aphasia as previously described [3]. All participants provided written informed consent prior to performing baseline (T1) study assessments and MRI scan procedures within one week to the start of treatment. Motor threshold determination was performed in order to set treatment stimulation to 80% of active motor threshold. Within one week, participants underwent treatment sessions for 10 consecutive weekdays in which left hemisphere iTBS was applied less than 1 hour prior to participating in a group CIAT session. Daily order in which participants received iTBS was rotated over the 10-day treatment period to minimize the influence of order effects on the impact of iTBS. Within 1 week of completing the 10-day treatment, participants performed study assessments and MRI scan procedures (T2), and then again 3 months after completing the 10-day treatment (T3; Figure 1B).
ASSESSMENTS:
Aphasia testing was administered at each time point, and included the Western Aphasia Battery-Revised (WAB-R) [30] to assess specific aphasia domains, determine the Aphasia Quotient (AQ) and Apraxia Total scores (lower scores indicate greater deficits for aphasia and apraxia of speech, respectively), and assess the presence of dysarthria, and the Boston Naming Test (BNT) to assess naming performance via spontaneously correct responses [31]. Other neuropsychological assessments included the Peabody Picture Vocabulary Test (PPVT) to examine receptive vocabulary [32], the Semantic Fluency Test (SFT [33,34]) and the Controlled Oral Word Association Test (COWAT [33]) to assess verbal fluency (i.e. performance based on the number of words generated in one minute for a given category on the SFT or for a given letter on the COWAT), and the Complex Ideation subset of the Boston Diagnostic Aphasia Examination to assess oral comprehension and information recall [35]. The mini-Communicative Activity Log (mini-CAL) assessed the subject’s judgment of their everyday communicative ability [15]. Results of the WAB-R AQ, BNT, COWAT, and SFT performance have been previously described for the 12 participants who completed all 3 MRI visits [3].
TRANSCRANIAL MAGNETIC STIMULATION:
Resting and active motor threshold determination was performed prior to iTBS treatment as previously described [3]. Briefly, participants were comfortably seated in a semi-recumbent position, provided earplugs for hearing protection, and surface electromyography leads were placed over the left hand’s first dorsal interosseous muscle. Participants were instructed to keep their eyes open during determination of motor thresholds. The Brainsight neuronavigation system (Rogue Research Inc., Montreal Canada) was used to identify the motor cortex location using the participant’s structural MRI. The Magstim Rapid2® figure of 8 stimulation coil (Magstim Co., Wales, UK) was used to apply a single-pulse TMS to the right hemisphere motor cortex. Resting motor threshold and active motor threshold were both defined by the minimum stimulation intensity that elicited at least 50 uV (resting) and 200 uV (active) amplitude for the motor evoked potential in at least 5 of 10 consecutive trials. At each treatment session, the residual left hemisphere cortex most responsive to a semantic decision/tone decision fMRI task (described in detail in [3]) was targeted using the Brainsight neuronavigation system. The left hemisphere region of interest targeted for iTBS treatment was located in or around the inferior frontal gyrus. If such left frontal language activation was not present in an individual (eg, when there was no residual cortex in the area due to the extent of the stroke lesion), a region in the closest proximity to the inferior frontal gyrus where the peak activation was noted in response to the language fMRI paradigm was selected. The final decision regarding the stimulation site was based on review of the fMRI activation maps by a neuroimaging and stroke expert (JPS) who was not involved in stimulation delivery. The Magstim Rapid2® figure of 8 coil was used to apply 600 iTBS pulses over 200 seconds (2 second train of TBS repeated every 10 seconds) with the intensity set to 80% of active motor threshold [3,4,12]. As previously reported, this approach is safe in patients pre-existing brain injury such as stroke [3,4] and the parameters used in the iTBS treatment protocol adhere to the recommended safety guidelines [36,37].
CONSTRAINT-INDUCED APHASIA THERAPY:
Within 1 hour of the iTBS session, participants received approximately 45–60 minutes of a group session of CIAT, which is an abbreviated version of the 3-hour CIAT protocol by Szaflarski et al (2008) [15] that was developed based on Pulvermuller et al (2001) [16]. This is the same CIAT protocol utilized and described in a previous study [3]. The CIAT group session facilitated by trained therapists typically included 3–4 participants with post-stroke aphasia. Two days prior to and during the first 2 days of each CIAT session the same linguistics and aphasia expert (JV) provided therapists with CIAT training and supervision to ensure treatment fidelity. During the training and in the first day of the program the therapists had no information about the participants or their abilities (all assessments were performed by study coordinator who was not part of the treatment team). The pairing of therapist to participants rotated daily. Complete details of the CIAT sessions are provided elsewhere [3]. Briefly, during treatment sessions, therapists provided cues to the participants to facilitate verbal communication. At the beginning of each session, participants received cards depicting everyday objects or scenes that were used to play a game similar to “go fish.” The design of the game was such that the participants asked questions of each other and had to also answer each other’s questions. This game design also required other skills including visual card matching, attention, and working memory.
OVERT LANGUAGE TASKS:
Subjects performed 2 overt language tasks during fMRI, each programmed in DirectRT software (www.empirisoft.com). Both tasks employed a method of sparse-sampling acquisition during event-related fMRI [38]. For each task (Figure 2), the first 6 seconds of each stimulus event occurred during MRI silence to allow the participant to provide an overt response that was recorded and later transcribed; this was followed by 6 seconds in which 3 fMRI volumes were acquired at the peak of the blood oxygenation level dependent (BOLD) canonical hemodynamic response function to the prior event trial [39].
For the event-related verb generation task (VGT; Figure 2A), participants were aurally presented with a noun while presented with visual instructions for covert verb generation (“think verbs”), overt verb generation (“say verbs”), or overt noun repetition (“repeat nouns”); participants were presented with 15 trials for each condition that would alternate during the task [39]. They were instructed to say out loud (provide overt responses) as many verbs as they can related to the noun that they hear during “say verbs”. They were also instructed to generate related verbs during “think verbs” but to do so silently (ie, provide covert responses). During the “repeat noun” condition, participants were instructed to say the noun that they hear out loud. Overt responses given during MRI silence (overt verb generation and noun repetition) were recorded during the MRI session and later transcribed and scored for correct responses for each condition.
For the verbal paired associates task (VPAT; Figure 2B), participants were visually presented with a pair of related words (rhyming, opposites, synonyms, or semantically related) and were instructed to either read or generate the second word in the pair out loud [40–42]. Subjects were presented with 30 trials for each condition. During the “read” condition, the second word in the pair was provided. During the “generate” condition, only the first letter of the second word was provided followed by asterisks for each remaining letter of the word, and subjects had to generate the second word and say it out loud. Overt responses given during MRI silence were transcribed and scored for correct responses for each pair of words. Recognition memory for the second word in each pair was performed during a post-scan assessment presenting the target word along with 2 foils.
MRI DATA ACQUISITION:
Participants underwent fMRI at all 3 time points. For the 13 participants included in analysis, neuroimaging was performed using a 3.0 T head-only Siemens Magnetom Allegra scanner at UAB. Participants were fitted with an MRI-compatible headset to communicate with research staff, were provided with a response device in their left hand, and were equipped with a mirror/screen system for viewing visual stimuli as part of a functional MRI study. Once participants were positioned in the MRI scanner, a localizer scan was performed, followed by a high-resolution T1-weighted 3D anatomical scan using a magnetization-prepared rapid acquisition with gradient echo sequence (TR 2300 ms, TE 2.17 ms, flip angle 9°, FOV 25.6×25.6×19.2 cm, matrix 256×256, 1 mm slice thickness). Two T2*-weighted gradient echo EPI scans were acquired (TR 2.0s, TE 38.0ms, flip angle 90o, FOV 24.0×24.0×12.9 cm, matrix 64×64, 30 4-mm axial slices with 7% distance factor for a full-brain coverage) while participants performed overt fMRI language tasks using sparse-sampling acquisition [38]. For the VGT, we acquired 137 whole-brain fMRI scans (the first 2 scans for the “Ready” screen were not included in analysis). For the VPAT, we acquired 180 whole-brain fMRI scans.
FUNCTIONAL MRI DATA PROCESSING:
FMRI data were analyzed and visualized using AFNI software [43]. Anatomical and fMRI scans were aligned, and a co-registration algorithm applied to correct for head motion [44]. Lesion probability maps created for each subject using the lesion_gnb toolbox for SPM12 [45] were used to infill lesions in the anatomical scan prior to removal of non-brain voxels and normalization into Montreal Neurologic Institute (MNI) space. The composite lesion map is illustrated in Figure 3A. The same transformation matrix was applied to normalize fMRI scans and the lesion masks to MNI space, followed by the spatial smoothing of fMRI scans to an effective smoothness of 6 mm Gaussian full width half-maximum (FWHM). Single-subject statistical modeling of event types for each task was then performed, while accounting for motion correction parameters and signal drift. For the VGT, each condition (think verbs; say verbs; repeat nouns) was modeled separately. General linear modeling of the VGT contrasting “say verbs” vs “think verbs” conditions was performed to isolate activation related to speech production and/or auditory processing (since both conditions involve processing noun-verb associations). General linear modeling of the VGT contrasting “say verbs” vs “repeat nouns” conditions was performed to isolate activation related to processing of semantic associations (since both conditions involve speech production and/or auditory processing). For the VPAT, generate and read conditions were modeled separately in addition to general linear modeling of activation related to verbal encoding of words (contrasting generate vs read conditions).
Changes in the fMRI contrasts described above for the VGT and changes in verbal encoding of words for the VPAT were assessed using whole-brain paired samples t-tests to compare T1 and T2 (n=13) and examine immediate post-treatment changes induced by CIAT primed with iTBS, which was the primary aim of the study. Paired samples t-tests were also performed for each task to compare T2 and T3 (n=12), to examine residual effects of treatment after 3 months, and to compare T1 and T3 (n=12), and to examine the sustainability of the response (i.e., retention of effects of treatment) after 3 months. Parameters for statistical thresholding of significant activation clusters were determined using the spatial autocorrelation function (ACF) in the 3dFWHx program in AFNI to estimate smoothness of the noise. The smoothness estimate was then used to fit a mixed model and subsequently estimate the probability of false-positive clusters and determine the cluster threshold for different voxelwise thresholds using the 3dClustSim program in AFNI [46]. Cluster thresholds for voxelwise p=0.05 were calculated using 10,000 Monte Carlo simulations to achieve activation clusters significant at corrected p<0.05. The results of these simulations yielded a critical cluster extent volume threshold of 2079 mm3 for changes in the VGT contrasts and a threshold of 1836 mm3 for changes in the VPAT contrast.
BEHAVIORAL DATA ANALYSES:
For each behavioral measure, the Shapiro-Wilk test for normality was performed for the changes between time points. For measures in which we failed to reject the null hypothesis that the sample data conform to a normal distribution (p≥0.05), paired Student’s t-tests were performed for the participants who completed T1 and T2 (n=13) to assess pre- to post-treatment changes. For each measure in which we rejected the null hypothesis of normality (p<0.05), the Sign test was performed. Examination of immediate post-treatment changes induced by CIAT primed with iTBS (T1 vs T2) was the primary aim of the study. Paired Student’s t-tests or Sign tests, when appropriate, were also performed for participants who completed T2 and T3 (n=12) to assess residual effects of treatment after 3 months. Finally, paired Student’s t-tests or Sign tests, when appropriate, were performed for the participants who completed T1 and T3 (n=12) to assess if there was a return to baseline, or if there was partial retention of effects of treatment after 3 months. Statistical analyses were performed using Statistical Analysis Software (SAS) version 9.4 (Cary, NC), with p<0.05 considered significant. Effect size (Cohen’s d) was calculated for each measure that showed significant change with time.
CORRELATIONS BETWEEN CHANGES IN FMRI ACTIVATION AND LANGUAGE PERFORMANCE:
Exploratory correlation analyses were performed to investigate brain-behavior relationships for each significant change in fMRI activation that showed a corresponding change in task performance (ie, T1 vs T2). We also extended the correlation analyses to include behavioral assessments showing corresponding significant changes for these time points (ie, T1 vs T2 and T2 vs T3). For these time points, the average signal for each cluster was extracted and the change in signal was correlated with change in behavioral task performance. Given our small sample, we performed Spearman correlation analyses, which are more robust against the effects of outliers. Analyses were performed using Statistical Analysis Software (SAS) version 9.4 (Cary, NC), with p<0.05 considered significant. We report correlations greater than |0.50| (medium to large effect sizes). Bonferroni correction for multiple comparisons was applied when appropriate.
Results
BEHAVIORAL PERFORMANCE:
Performance variables for the study participants over time are summarized in Table 2. Due to a technical issue, we were unable to collect VGT in-scanner voice recordings for 2 subjects at T1 and 3 subjects at T2 and no VPAT in-scanner voice recordings for 3 subjects at T1, 5 subjects at T2, and 1 subject at T3. Two participants at T2 did not complete the post-scan recognition memory test. Table 2 summarizes assessment and fMRI task performance and indicates the number of subjects with missing data for different paired analyses. Results of the WAB-R AQ, BNT, COWAT, and SFT performance have been previously described for the 12 participants who completed all 3 MRI visits [3]. Consistent with the previous report, there were significant treatment-related gains in BNT (p<0.001 for T1 vs T2; n=13; d=1.76), along with the delayed gains in the WAB-R AQ that were previously reported (p=0.038 for T2 vs T3; n=12; d=0.96) [3]. There was a significant improvement of the WAB-R Apraxia Total score from baseline to immediately post-treatment (p=0.040 for T1 vs T2; n=13; d=0.90). There was also a delayed gain for the mini-CAL (p=0.001 for T1 vs T3; n=12; d=1.52). There were no other significant changes in aphasia testing performance.
There were minimal changes in fMRI task performance. For the VGT, there was a significant increase in the number of words produced for the “say verbs” condition that were not verbs (ie, non-verb words) from baseline to immediately post-treatment (p=0.028 for T1 vs T2; n=8; d=1.37). For the VPAT, there was a trend toward a decrease in the number of correct trials for the “generate” condition from immediately post-treatment to after 3 months (p=0.062 for T2 vs T3; n=7; d=1.22). No other significant changes were observed in performance for either task.
FUNCTIONAL MRI ACTIVATION:
Group analyses for the VGT at each time point are depicted in Figure 3B for activation related to speech production/auditory processing (“say verbs” vs “think verbs”) and in Figure 3C for activation related to noun-verb semantic processing (“say verbs” vs “repeat nouns”). There was minimal activation related to speech production/auditory processing at all 3 time points, with posterior visual cortex activation at T1 and then less engagement of this region at T2, and decreased right cerebellum activation at T3. In contrast, we observed widespread fronto-temporo-parietal activation related to noun-verb semantic processing at T1. There was less engagement of brain regions at T2 and T3 during noun-verb semantic processing, with decreased at T2 with decreased visual cortex activation and at T3 with decreased insula activation.
Group analysis for the VPAT at each time point is depicted in Figure 3D for activation related to verbal encoding of words (“generate” vs “read”). Activation patterns are similar for T1 and T2, with respect to increased posterior midline and parietal involvement in verbal encoding, as well as for T2 also showing frontal and left temporal activation. T3 depicts a different pattern with both increased and decreased midline frontal activation and decreased right temporal and parietal activation during verbal encoding.
We observed significant differences in activation between time points for each fMRI task. There were minimal differences in VGT activation for speech production/auditory processing between time points, with differences for the right angular gyrus and midbrain at T2 relative to T1 and differences in cerebellum activation between T3 and T1 (Figure 4A). Differences in VGT activation for processing noun-verb semantic associations between time points T1 relative to both T2 and T3 (Figure 4B) largely overlaps with the activation pattern shown for baseline (T1). Activation differences for T3 vs T2 in the left insula for VGT noun-verb semantic processing overlaps with the T3 insula activation. The differences in VPAT activation for verbal encoding between time points T3 and T2 were in the temporal cortex, supplementary motor area (SMA), and visual/parietal regions, bilaterally; these activation differences were also present for the bilateral visual/parietal regions when comparing T3 to T1 (Figure 4C). Regions showing significant differences between time points for each task are summarized in Table 3.
CORRELATIONS BETWEEN CHANGES IN FMRI ACTIVATION AND LANGUAGE PERFORMANCE:
We performed Spearman correlation analyses to examine relationships between T2 vs T1 change in language measures (VGT non-verb words, BNT, and WAB-R Apraxia Total) and T2 vs T1 change in VGT fMRI activation related to speech production/auditory processing in 2 brain regions (Figure 4, Table 3). There were no correlations that were greater than |0.50|.
We performed Spearman correlation analyses to examine relationships between T2 vs T1 change in language measures (VGT non-verb words, BNT, and WAB-R Apraxia Total) and T2 vs T1 change in VGT fMRI activation related to processing noun-verb semantic associations in 11 brain regions (Figure 4, Table 3). There were 2 correlations greater than |0.50| (Figure 5A): 1) a negative correlation (rho=−0.611, p=0.108) between change in the number of non-verb words on the VGT and change in VGT activation related to noun-verb associations in the area extending between the right insula, anterior cingulate cortex, and middle/superior frontal gyrus (N=8), and 2) a negative correlation (rho=−0.554, p=0.0497) between change in BNT and change in VGT activation related to noun-verb associations in the right postcentral gyrus (N=13). However, neither was significant at p<0.0045 after Bonferroni correction for multiple comparisons.
We performed Spearman correlation analyses to examine relationships between T3 vs T2 change in the WAB-R AQ and T3 vs T2 change in VGT fMRI activation related to processing noun-verb semantic associations in the left insula (Figure 4, Table 3). There were no correlations that were greater than |0.50|.
We also performed Spearman correlation analyses to examine relationships between T3 vs T2 change in the WAB-R AQ and T3 vs T2 change in VPAT fMRI activation related to verbal encoding in 5 brain regions (Figure 4, Table 3). There was one correlation greater than |0.50| in the bilateral supplementary motor area (N=12) and was significant at p<0.01 after Bonferroni correction for multiple comparisons (rho=−0.790, p=0.0022; Figure 5B).
Finally, we performed Spearman correlation analyses to examine the relationships between T3 vs T1 change in the mini-CAL and corresponding language-related activation changes on the fMRI tasks (Figure 4, Table 3). There were no correlations greater than |0.50|.
Discussion
We investigated the effects of CIAT primed with iTBS on language performance and brain activation patterns during overt language fMRI tasks in individuals with chronic post-stroke aphasia. While the improvements in naming ability (BNT) and of aphasia symptoms (WAB-R AQ) have been previously described and discussed [3], the current study reports additional findings in assessments and the overt language fMRI tasks and adds one more participant who was not previously described. Namely, there was a significant improvement of the WAB-R Apraxia Total score (p=0.040) and in the number of non-verb words produced for the VGT (p=0.028) from baseline to immediately post-treatment, as well as a delayed gain for the mini-CAL (p=0.001). Effect size was large (>0.80) for each of the measures showing significant change over time. We also showed that iTBS-primed CIAT resulted in brain changes in the overt language fMRI tasks. For the VGT, there was a decrease in semantic-related activation from baseline (T1) to both immediately post-treatment (T2) and the 3-month follow-up (T3). For the VPAT, we observed a delayed shift in activation patterns, evident in the differences between the 3-month follow-up and the 2 earlier time points. Exploratory correlation analyses gleaned some insight into brain and behavior relationships. There was a significant negative correlation between T2 vs T1 activation change in the right postcentral gyrus for VGT processing of noun-verb semantic associations and corresponding change in BNT performance (rho=−0.554, p=0.0497). There was also a significant negative correlation between T3 vs T2 activation change in the supplementary motor area for VPAT verbal encoding and the corresponding change in AQ (rho=−0.790, p=0.0022). As these findings expand our understanding of language functions that may be improved and corresponding brain changes induced by combined therapy of CIAT primed with iTBS in chronic post-stroke aphasia, they warrant further discussion.
There were no significant changes in the standard behavioral measures of performance on the VGT (ie, number of correct trials for either the “say verbs” or “repeat nouns” conditions). This is likely due to the large variability in performance in our small sample coupled with missing behavioral data, which further reduced the sample size for the analysis of task performance. It is also possible for the task performance itself not to be an accurate measure of language improvement, given the significant improvements observed on neuropsychological assessments (eg, BNT, WAB-R AQ and WAB-R Apraxia Total). However, we did observe a significant increase in the total number of non-verb words produced during the “say verbs” condition (Table 2). This result is consistent with previous CIAT studies in patients with post-stroke aphasia showing language improvement with regards to an increase in the number of words and utterances for a story task [15] and in the counted words and correct information units per utterance during CIAT [47]. A small non-randomized controlled trial of constraint-induced language therapy (N=4) vs a comparison therapy called “Promoting aphasic communicative effectiveness” (N=5) observed some increases in the number of utterances in both therapy groups, but could not clearly show a pattern at the 1-month post-treatment follow-up due to an incomplete sample [48]. Thus, it was unclear if this gain can be retained past the immediate time period following treatment, and our study shows that 3 months after treatment completion there is a return to baseline performance. This indicates that while language improvements in response to CIAT primed with iTBS are possible, they may not be sustained. Additional “booster” interventions may be needed similar to the “transfer package” utilized in some of the motor recovery trials [49].
We also observed significant improvements in the BNT and in the Apraxia Total score immediately following CIAT primed with iTBS, although there was some decline 3-months post-treatment (Table 2). The majority of our patients had anomic aphasia (8 of 13), which is likely to account for the marked improvement in BNT performance, since word-finding is typically their biggest impairment, and that is also where there is the most potential for gain. It should be noted, however, that all but 3 participants (1 anomic, 1 global, and 1 Broca’s aphasia) showed improved BNT scores from T1 to T2, which suggests that CIAT primed with iTBS may help improve naming abilities for all types of aphasia. With respect to apraxia of speech, the intensive verbal practice during CIAT may have contributed to such improvement. While those with anomic aphasia are typically unlikely to have severe apraxia of speech, 3 of the 8 with anomic aphasia showed increased Apraxia Total score from T1 to T2 (range of 1–6-point increase) and all others with different types of aphasia (Wernicke’s, Broca’s, global, and conduction aphasia) showed increased Apraxia Total score from T1 to T2 (range of 2–12-point increase). These results suggest that while those with all types of aphasia may benefit from CIAT primed with iTBS with regards to apraxia of speech symptoms, types other than anomic aphasia may experience greater benefit. Interestingly, a non-randomized controlled trial of constraint-induced language therapy vs a comparison therapy did not find within group improvements in apraxia of speech [48], suggesting that the improvement observed in our study may be due to either iTBS, combined treatment, or participant differences. Apraxia of speech occurs in about 1/3 of patients that suffer a left hemisphere stroke [50]. Similar to aphasia, apraxia of speech has been shown to negatively affect activities of daily living as well as be a predictor of increased dependency after stroke [51]. Together, the observed improvements of aphasia and apraxia of speech symptoms likely facilitated the corresponding, albeit delayed, improvement in the subject’s perception of their own everyday communicative ability, which was significantly better at 3-months post-treatment compared to baseline.
The fMRI tasks utilized in this study are unique in that verbal responses can be recorded during the MRI scan by using a method of sparse-sampling acquisition [38]. For the VGT, this method allows for comparison of the “say verbs” vs “think verbs” conditions to isolate activation related to speech production and auditory processing when generating verbs in an overt vs covert manner (Figure 3B). While the expected activation pattern would include the canonical language areas of lateral and inferior frontal regions including insula and of temporo-parietal regions [52], as well as activation of the cerebellum and motor cortex during speech, we only observed the posterior visual cortex at baseline corresponding to a region previously shown to be activated during this task in both healthy and post-stroke individuals [53]. Overall, we observed low activation related to speech production/auditory processing at all 3 time points. While the subjects were instructed to not speak during the “think verbs” condition, it is possible that subjects were also verbalizing during this condition as they engaged in the semantic process of thinking of verbs related to the noun. The behavioral data revealed that while subjects were not correctly generating verbs aloud, they were generating non-verb words during “say verbs”; the case could be the same during “think verbs” (not investigated), thus possibly decreasing the expected effects. Direct comparison of time points (Figure 4A, Table 3) revealed right angular gyrus and midbrain activation differences at T2 relative to T1, as well as decreased cerebellum activation between T3 and T1, possibly reflecting the changes in speech production.
The VGT also allows for isolating activation related to processing noun-verb semantic associations (eg, associating a verb to the presented noun vs repeating the noun; Figure 3C). Behavior can be tracked in both conditions, and the pattern of activation observed at baseline corresponds to the widespread fronto-temporo-parietal involvement previously shown in healthy controls and includes the left frontal and temporal activation previously shown in post-stroke individuals [53]. However, there were minimal differences in activation when processing noun-verb associations at T2 and T3. Direct comparison of time points (Figure 4B, Table 3) revealed that T2-T1 and T3-T1 differences overlapped largely with the baseline (T1) pattern of activations (Figure 3C). Interestingly, the CIAT primed with iTBS treatment resulted in a significant increase in the total number of words verbalized while the number of correct trials for both “say verbs” and “repeat nouns” remained consistent. Thus, the decreased activation at T2 and T3 relative to T1 suggests decreased recruitment of brain regions to perform similarly on the task, while still having an increase in the number of words produced. Such changes point toward increased efficiency in semantic processing with CIAT primed with iTBS treatment. The negative correlation in our study between T1 to T2 change in the number of words verbalized and change in fMRI activation for VGT in the right frontal cortex (rho=−0.611, p=0.108) further supports this notion (Figure 5A). We found a similar negative correlation between change in BNT performance and change in fMRI activation for VGT in the right postcentral gyrus (r=−0.554, p=0.0497). Unlike the previous report in our study patients illustrating more of a shift in the patterns of language fMRI activation [3], results of the overt language tasks exhibiting a pattern of diminished activation over time have not been observed in previous studies of iTBS in the treatment of post-stroke aphasia. However, our findings are consistent with other studies showing association between fMRI activation decreases with language therapy gains, particularly with naming, which have been attributed to higher processing efficiency [3,54,55]. Our findings are also consistent with a previous study suggesting that iTBS-induced decrease in motor cortex fMRI activity during a task where the subject presses a button upon presentation of a visual cue may reflect increased efficiency in the transmission of neural signals [56]. This idea of increased neural efficiency with iTBS and whether language therapy primed with iTBS may induce a greater effect than language therapy alone requires further investigation with a larger sample and use of appropriate control groups.
The VPAT activation patterns for verbal encoding were similar for T1 and T2 (Figure 3D), showing increased posterior midline and parietal activation that included regions previously shown to be involved during this task in healthy controls [40,41]. The CIAT primed with iTBS treatment did not induce any significant immediate changes (T2 vs T1) in task-related activation on the VPAT. Similar to the VGT, the lack of significant changes in task performance is likely due to the large variability in performance in addition to missing behavioral data. There were significant changes in VPAT activation at 3 months post-treatment compared to the earlier visits (Figure 4C, Table 3). The delay in significant VPAT activation changes paralleled the delayed improvement in the WAB-R AQ. Interestingly, we observed a significant negative correlation (rho=−0.790, p=0.0022) between the change in the AQ from T2 to T3 and the corresponding change in VPAT fMRI activation in the bilateral supplementary area (Figure 5B). The supplementary motor area plays a role in not only speech motor control, but also serves to control functions during language processing [57], and the negative correlation may reflect more efficient processing with language production. Given that our previous report in these patients also showed a significant negative correlation between change in the AQ from T2 to T3 and change in left inferior parietal lobule activation during semantic decision making [3], our findings suggest that CIAT primed with iTBS may induce slower changes in particular neural substrates that are associated with delayed treatment gains.
There are limitations to this study that need to be considered. One limitation is the relatively small number of subjects that were able to undergo treatment and return for multiple visits. There was also missing data, specifically for the fMRI voice recordings and post-scan memory test, and the mini-CAL (indicated in Table 2). These factors may have limited our ability to detect treatment effects and other significant brain-behavior relationships particularly since exploratory analyses did show associations with medium effect sizes. It should be noted, however, that all participants completed all language assessments at baseline and T3, with only 1 participant at T2 that did not complete the mini-CAL and 2 participants at T2 that did not complete the post-scan memory test. Further, without the presence of a sham control group, we cannot rule out the possibility that the observed treatment effects are due to spontaneous recovery. However, it is unlikely that the extent of improvements we showed in multiple domains occurred spontaneously given that all subjects were more than 1 year after stroke. The lack of comparison groups also does not allow us to differentiate whether iTBS alone or CIAT alone would induce similar gains. A previous randomized controlled trial of CIAT for post-stroke aphasia did show improved naming performance over time and no change in perceived communicative ability [58], suggesting that effects we observed on naming ability may not be specific to CIAT primed with iTBS. However, the observed improvements in other measures have yet to be investigated in a randomized controlled trial. Therefore, it is promising that we showed improvements not only in naming ability with CIAT primed with iTBS, but also in aphasia and apraxia of speech symptoms, the number of utterances produced, and in the subject’s perception of their everyday communicative ability.
Conclusions
Aphasia improvements coupled with fMRI activation changes over time provide support for treatment-induced neuroplasticity with CIAT primed with iTBS and the possibility of increased neural efficiency. However, a larger randomized sham-controlled study is warranted to confirm our findings and further our understanding of how iTBS can potentiate beneficial effects of language therapy in post-stroke aphasia.
Figures
![Overview of study recruitment and procedures. (A) CONSORT flow diagram outlining recruitment of subjects who suffered a left middle cerebral artery stroke and participated in the magnetic resonance imaging (MRI) study before and after treatment with constraint-induced aphasia therapy (CIAT) primed with intermittent theta burst stimulation (iTBS; modified after Szaflarski et al (2018) [3]). (B) Schematic of the open label study procedures. Participants performed language testing and MRI at baseline within 1 week of treatment initiation (T1), within 1 week of treatment completion (T2), and again after 12 weeks following treatment completion (T3).](https://jours.isi-science.com/imageXml.php?i=medscimonit-27-e930100-g001.jpg&idArt=930100&w=1000) Figure 1. Overview of study recruitment and procedures. (A) CONSORT flow diagram outlining recruitment of subjects who suffered a left middle cerebral artery stroke and participated in the magnetic resonance imaging (MRI) study before and after treatment with constraint-induced aphasia therapy (CIAT) primed with intermittent theta burst stimulation (iTBS; modified after Szaflarski et al (2018) [3]). (B) Schematic of the open label study procedures. Participants performed language testing and MRI at baseline within 1 week of treatment initiation (T1), within 1 week of treatment completion (T2), and again after 12 weeks following treatment completion (T3).
Figure 1. Overview of study recruitment and procedures. (A) CONSORT flow diagram outlining recruitment of subjects who suffered a left middle cerebral artery stroke and participated in the magnetic resonance imaging (MRI) study before and after treatment with constraint-induced aphasia therapy (CIAT) primed with intermittent theta burst stimulation (iTBS; modified after Szaflarski et al (2018) [3]). (B) Schematic of the open label study procedures. Participants performed language testing and MRI at baseline within 1 week of treatment initiation (T1), within 1 week of treatment completion (T2), and again after 12 weeks following treatment completion (T3). 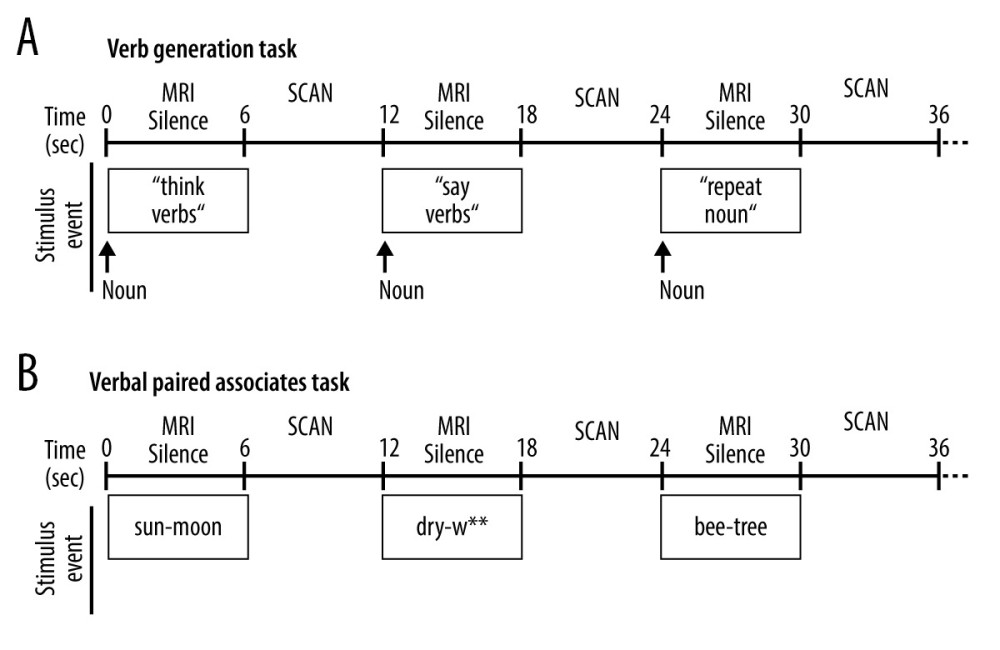 Figure 2. Schematic of the overt language tasks. During functional magnetic resonance imaging (fMRI) stimulus events were presented for 6 seconds during MRI silence, followed by 6 seconds of fMRI acquisition. Overt responses during MRI silence were recorded. (A) The event-related verb generation task involved auditory presentation of a noun, and subjects were instructed to either think of verbs related to the noun (covert generation), say the verbs related to the noun out loud (overt generation), or repeat the noun out loud (overt repetition). (B) The event-related verbal paired associates task involved visual presentation of a pair of related words, and participants were instructed to say the second word in the pair out loud. During the “read” condition, the second word in the pair was provided. During the “generate” condition, only the first letter of the second word was provided followed by asterisks for each remaining letter of the word, and subjects had to generate the second word and say it out loud.
 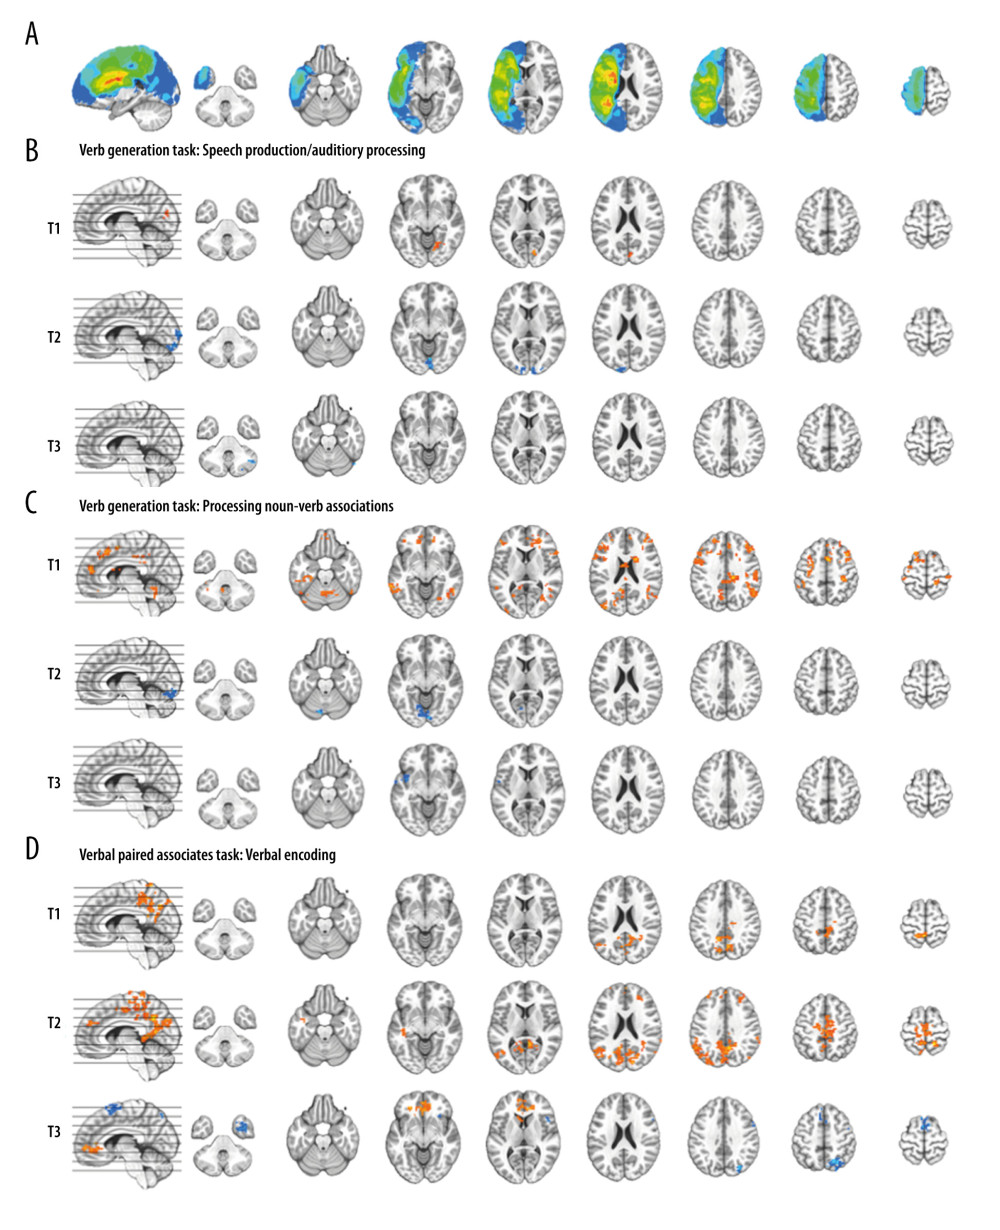 Figure 3. Composite lesion map and functional magnetic resonance imaging (fMRI) activation for the 13 participants. The composite lesion map and fMRI task activation maps at baseline (T1), immediately after treatment (T2) and at 3-month follow-up (T3; n=12) are overlaid onto a standard anatomical brain image in Montreal Neurologic Institute space. For all axial slices, left in the image is left in the brain. (A) The composite lesion map color scale ranges from the minimum (n=1 in blue) to the maximum (n=10 in red) number of participants that show overlap of lesions. (B) Statistical maps illustrating whole-brain fMRI activation patterns during speech production/auditory processing (“say verbs” vs “think verbs”) on the verb generation task are diminished at all 3 time points. Activation clusters are significant at corrected p<0.05 (voxelwise p=0.05, cluster threshold of 2079 mm3). (C) Activation related to processing noun-verb semantic associations on the verb generation task (“say verbs” vs “repeat nouns”) are present in frontal, temporal and parietal regions at T1 with minimal activation at T2 and T3. Activation clusters are significant at corrected p<0.05 (voxelwise p=0.05, cluster threshold of 2079 mm3). (D) Statistical maps illustrating whole-brain fMRI activation patterns during verbal encoding (“generate” vs “read”) on the verbal paired associates task are similar at T1 and T2, and differing at T3. Activations are significant at p<0.05, corrected (voxelwise p=0.05, cluster threshold of 1836 mm3).
 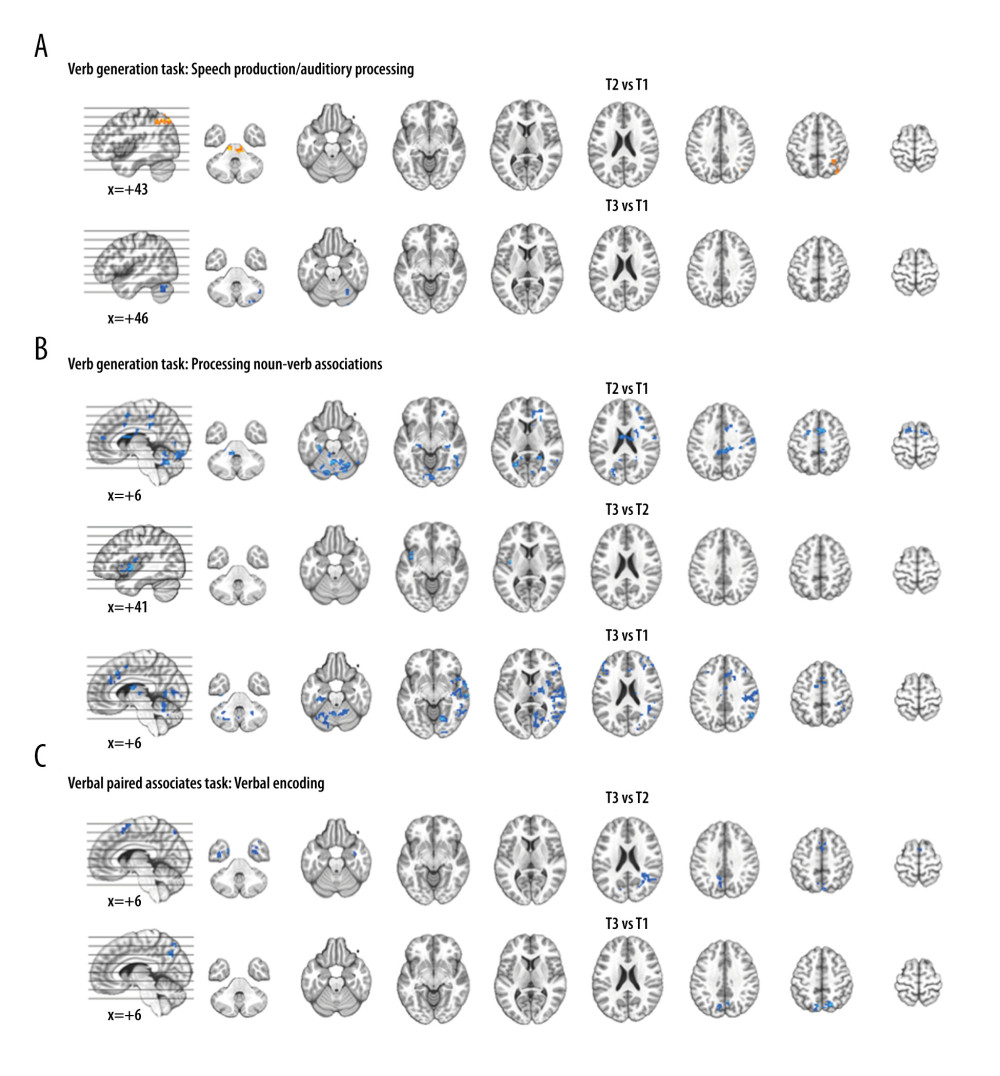 Figure 4. Functional magnetic resonance imaging (fMRI) statistical maps showing changes in activation over time. Paired t-tests reveal differences in fMRI activation between the 3 visits for the verb generation and verbal paired associates tasks. Coordinates of peak activation differences and extent of brain regions are provided in Table 3. Comparisons of immediately post-treatment relative to baseline (T2 vs T1) included 13 participants, while comparisons of 3-month follow-up relative to either immediately post-treatment (T3 vs T2) or to baseline (T3 vs T1) included 12 participants. The fMRI statistical maps are overlaid onto a standard anatomical brain image in Montreal Neurologic Institute space. For all axial slices, left in the image is left in the brain. (A) Regions showing differences in activation for speech production/auditory processing (“say verbs” vs “think verbs”) between T2 and T1 are shown in orange in the right angular gyrus and midbrain. There were also differences in activation between T3 and T1 in the right cerebellum (in blue). Clusters showing differences over time are significant at p<0.05, corrected (voxelwise p=0.05, cluster threshold of 2079 mm3). (B) T1 compared to both T2 and T3 showed differences in activation for processing noun-verb semantic associations (“say verbs” vs “repeat nouns”) as shown in blue in a number of regions including the cerebellum, as well as frontal, temporal, and parietal regions. The only activation difference for T3 relative to T2 is in the left insula (in blue). Activations are significant at p<0.05, corrected (voxelwise p=0.05, cluster threshold of 2079 mm3). (C) The differences in activation for verbal encoding at T3 relative to both T2 and T1 were in visual and parietal regions (in blue). Differences in activation between T3 and T2 also include bilateral temporal pole and midline frontal regions. Activations are significant at p<0.05, corrected (voxelwise p=0.05, cluster threshold of 1836 mm3).
 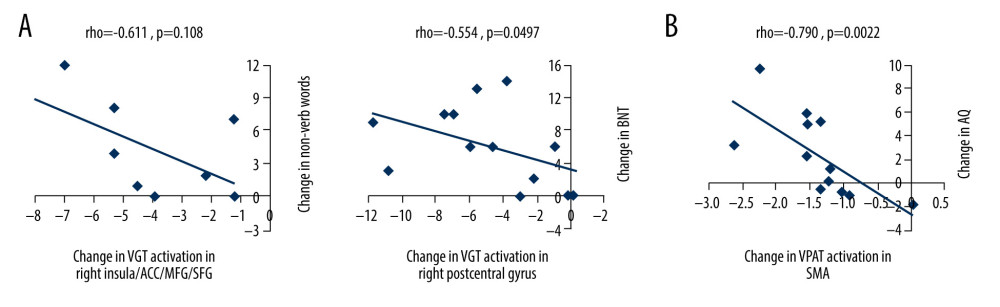 Figure 5. Scatterplots showing relationships between changes in functional magnetic resonance imaging (fMRI) activation and changes in language performance. We show Spearman correlations greater than |0.50|. (A) There were negative associations between T2 vs T1 fMRI activation changes in verb generation task (VGT) processing of noun-verb semantic associations and both corresponding change in the number of non-verb words produced on the VGT and change in Boston Naming Task (BNT) performance. ACC – anterior cingulate cortex; MFG – middle frontal gyrus; SFG – superior frontal gyrus. (B) There was a significant negative association between T3 vs T2 fMRI activation change in the supplementary motor area (SMA) during verbal paired associates task (VPAT) verbal encoding and the corresponding change in the aphasia quotient (AQ).
 Tables
Table 1. Baseline (T1) demographic and clinical variables for study participants.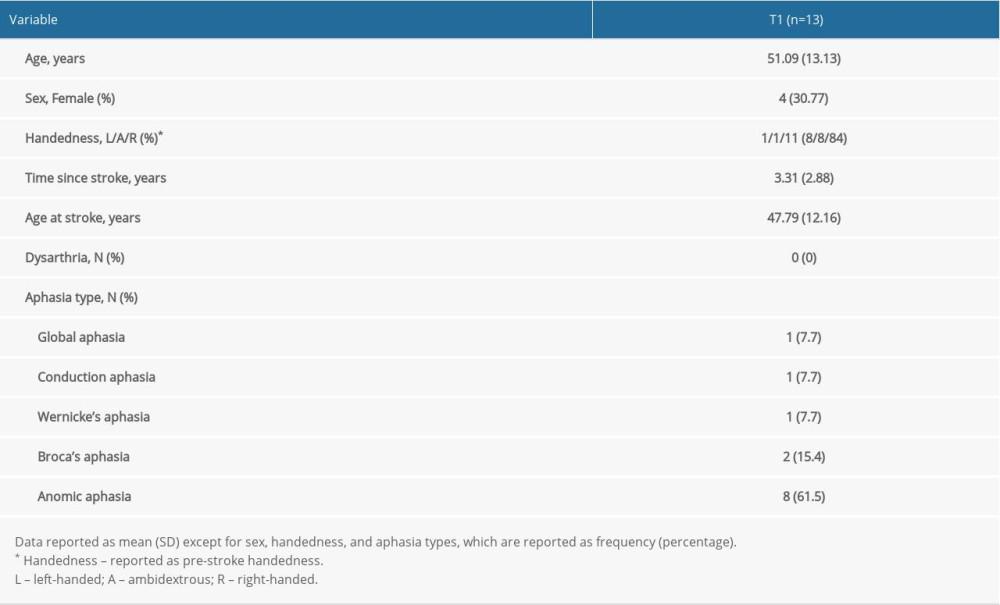 Table 2. Performance variables for the study participants over time.
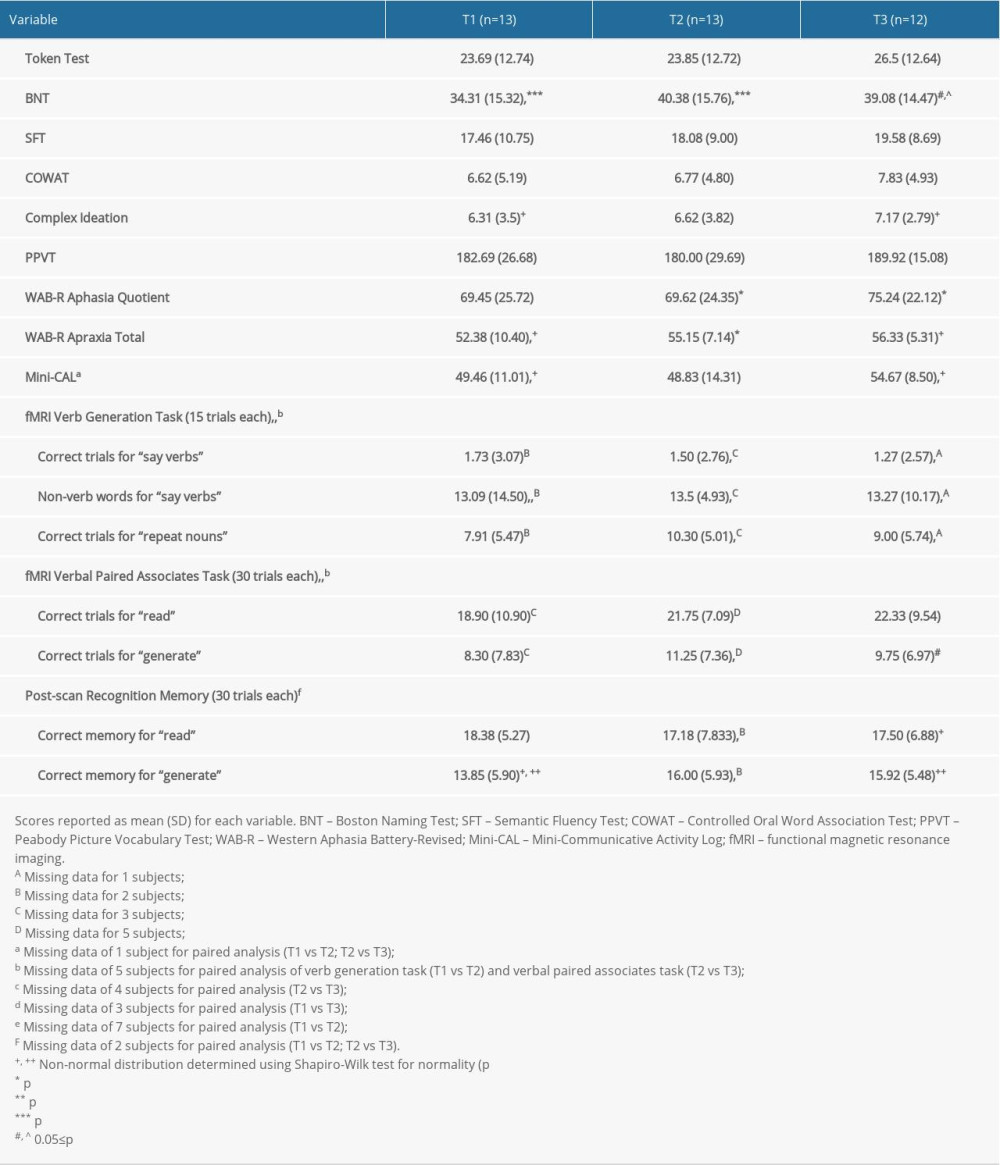 Table 3. Location and extent of functional magnetic resonance imaging (fMRI) activation in Figure 4. Brain regions showing differences in fMRI activation patterns between time points (T1, T2, T3) for the verb generation and verbal paired associates tasks are identified. Peak Montreal Neurologic Institute (MNI) coordinates (x, y, z) and t-value for each brain region are provided.
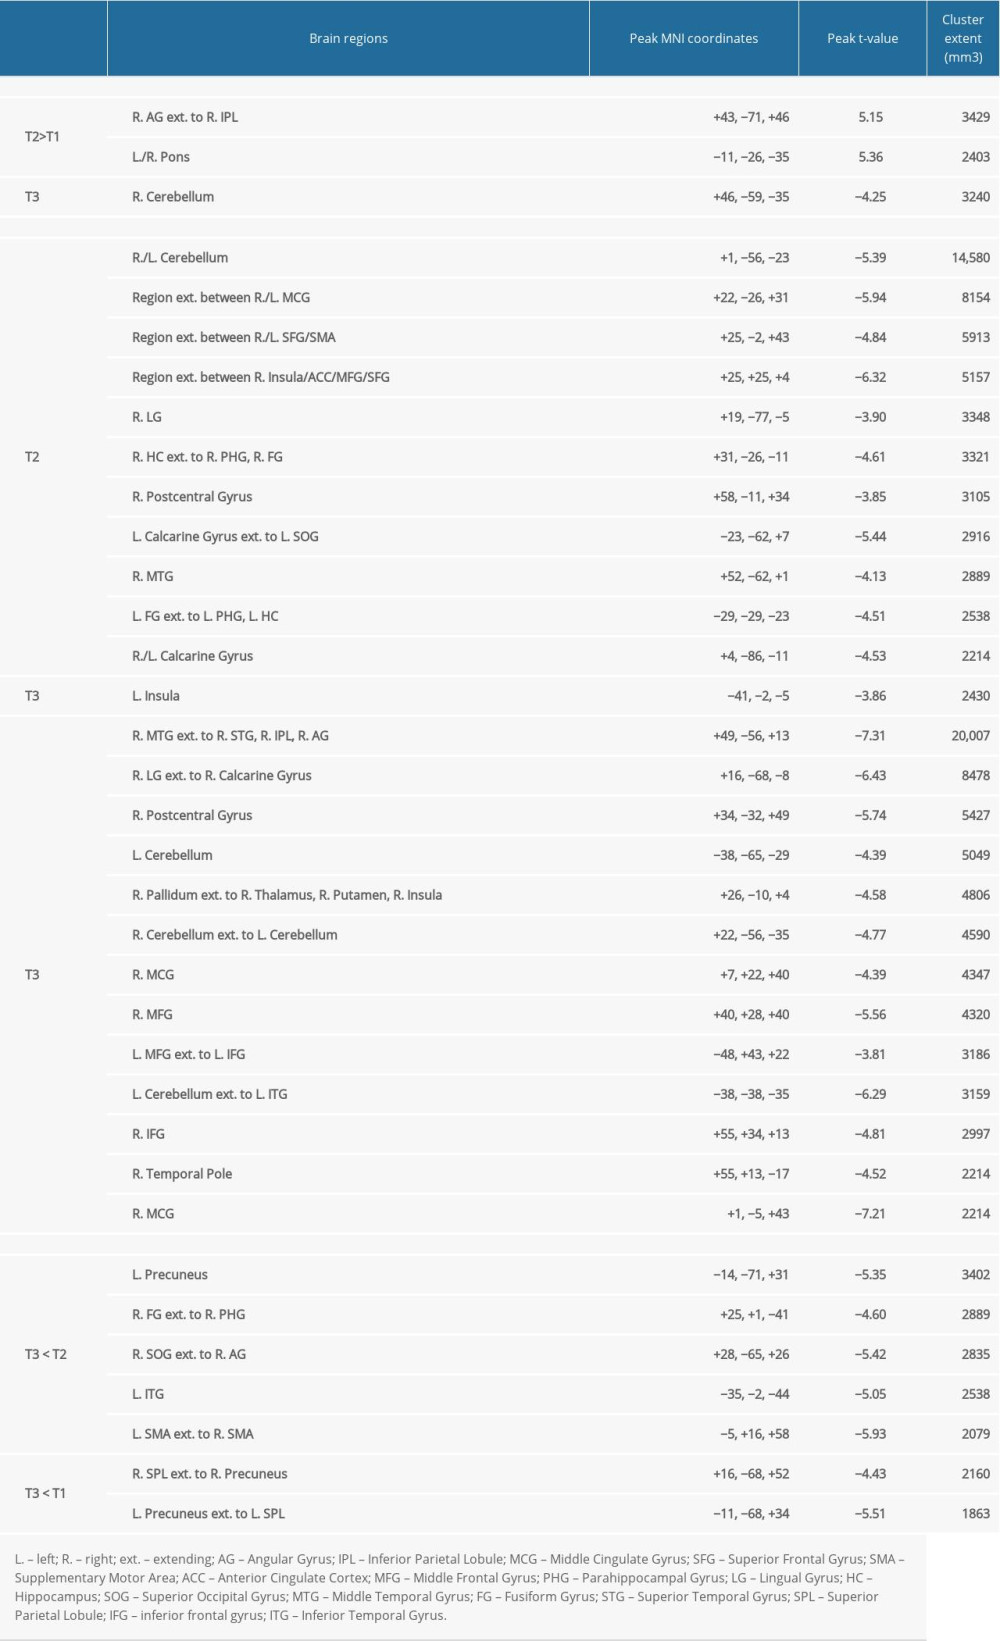
References
1. Hilari K, Needle JJ, Harrison KL, What are the important factors in health-related quality of life for people with aphasia? A systematic review: Arch Phys Med Rehabil, 2012; 93(1 Suppl); S86-95
2. Lazar RM, Boehme AK, Aphasia as a predictor of stroke outcome: Curr Neurol Neurosci Rep, 2017; 17(11); 83
3. Szaflarski JP, Griffis J, Vannest J, A feasibility study of combined intermittent theta burst stimulation and modified constraint-induced aphasia therapy in chronic post-stroke aphasia: Restor Neurol Neurosci, 2018; 36(4); 503-18
4. Szaflarski JP, Vannest J, Wu SW, Excitatory repetitive transcranial magnetic stimulation induces improvements in chronic post-stroke aphasia: Med Sci Monit, 2011; 17(3); CR132-39
5. Harvey DY, Podell J, Turkeltaub PE, Functional reorganization of right prefrontal cortex underlies sustained naming improvements in chronic aphasia via repetitive transcranial magnetic stimulation: Cogn Behav Neurol, 2017; 30(4); 133-44
6. Haghighi M, Mazdeh M, Ranjbar N, Seifrabie MA, Further evidence of the positive influence of repetitive transcranial magnetic stimulation on speech and language in patients with aphasia after stroke: Results from a double-blind intervention with sham condition: Neuropsychobiology, 2017; 75(4); 185-92
7. Turkeltaub PE, Brain stimulation and the role of the right hemisphere in aphasia recovery: Curr Neurol Neurosci Rep, 2015; 15(11); 72
8. Shah PP, Szaflarski JP, Allendorfer J, Hamilton RH, Induction of neuroplasticity and recovery in post-stroke aphasia by non-invasive brain stimulation: Front Hum Neurosci, 2013; 7; 888
9. Stefaniak JD, Halai AD, Lambon Ralph MA, The neural and neurocomputational bases of recovery from post-stroke aphasia: Nat Rev Neurol, 2020; 16(1); 43-55
10. Finocchiaro C, Maimone M, Brighina F, A case study of Primary Progressive Aphasia: Improvement on verbs after rTMS treatment: Neurocase, 2006; 12(6); 317-21
11. Mottaghy FM, Hungs M, Brugmann M, Facilitation of picture naming after repetitive transcranial magnetic stimulation: Neurology, 1999; 53(8); 1806-12
12. Huang YZ, Edwards MJ, Rounis E, Theta burst stimulation of the human motor cortex: Neuron, 2005; 45(2); 201-16
13. Zumbansen A, Thiel A, Recent advances in the treatment of post-stroke aphasia: Neural Regen Res, 2014; 9(7); 703-6
14. Brady MC, Kelly H, Godwin J, Speech and language therapy for aphasia following stroke: Cochrane Database Syst Rev, 2016(6); CD000425
15. Szaflarski JP, Ball A, Grether S, Constraint-induced aphasia therapy stimulates language recovery in patients with chronic aphasia after ischemic stroke: Med Sci Monit, 2008; 14(5); CR243-50
16. Pulvermuller F, Neininger B, Elbert T, Constraint-induced therapy of chronic aphasia after stroke: Stroke, 2001; 32(7); 1621-26
17. Balardin JB, Miotto EC, A review of Constraint-Induced Therapy applied to aphasia rehabilitation in stroke patients: Dement Neuropsychol, 2009; 3(4); 275-82
18. Fridriksson J, Hubbard HI, Hudspeth SG, Transcranial brain stimulation to treat aphasia: A clinical perspective: Semin Speech Lang, 2012; 33(3); 188-202
19. Thiel A, Hartmann A, Rubi-Fessen I, Effects of noninvasive brain stimulation on language networks and recovery in early poststroke aphasia: Stroke, 2013; 44(8); 2240-46
20. Heiss WD, Hartmann A, Rubi-Fessen I, Noninvasive brain stimulation for treatment of right- and left-handed poststroke aphasics: Cerebrovasc Dis, 2013; 36(5–6); 363-72
21. Kakuda W, Abo M, Momosaki R, Morooka A, Therapeutic application of 6-Hz-primed low-frequency rTMS combined with intensive speech therapy for post-stroke aphasia: Brain Inj, 2011; 25(12); 1242-48
22. Abo M, Kakuda W, Watanabe M, Morooka A, Effectiveness of low-frequency rTMS and intensive speech therapy in poststroke patients with aphasia: A pilot study based on evaluation by fMRI in relation to type of aphasia: Eur Neurol, 2012; 68(4); 199-208
23. Otal B, Olma MC, Flöel A, Wellwood I, Inhibitory non-invasive brain stimulation to homologous language regions as an adjunct to speech and language therapy in post-stroke aphasia: A meta-analysis: Front Hum Neurosci, 2015; 9; 236
24. Shah-Basak PP, Wurzman R, Purcell JB, Fields or flows? A comparative metaanalysis of transcranial magnetic and direct current stimulation to treat post-stroke aphasia: Restor Neurol Neurosci, 2016; 34(4); 537-58
25. Li Y, Qu Y, Yuan M, Du T, Low-frequency repetitive transcranial magnetic stimulation for patients with aphasia after stoke: A meta-analysis: J Rehabil Med, 2015; 47(8); 675-81
26. Bucur M, Papagno C, Are transcranial brain stimulation effects long-lasting in post-stroke aphasia? A comparative systematic review and meta-analysis on naming performance: Neurosci Biobehav Rev, 2019; 102; 264-89
27. Khedr EM, Abo El-Fetoh N, Ali AM, Dual-hemisphere repetitive transcranial magnetic stimulation for rehabilitation of poststroke aphasia: A randomized, double-blind clinical trial: Neurorehabil Neural Repair, 2014; 28(8); 740-50
28. Gamboa OL, Antal A, Moliadze V, Paulus W, Simply longer is not better: Reversal of theta burst after-effect with prolonged stimulation: Exp Brain Res, 2010; 204(2); 181-87
29. De Renzi E, Vignolo LA, The token test: A sensitive test to detect receptive disturbances in aphasics: Brain, 1962; 85; 665-78
30. Kertesz A: Western aphasia battery – revised, 2006, San Antonio, TX, Psychological Corporation
31. Kaplan E, Goodglass H, Weintraub S: Boston Naming Test, 2001, Baltimore, MD, Lippincott Williams & Wilkins
32. Dunn L, Dunn M: Peabody picture vocabulary test, 2007, Minneapolis, MN, NCS Pearson Inc
33. Lezak M: Neuropsychological assessment, 1995, New York, Oxford University Press
34. Kozora E, Cullum CM, Generative naming in normal aging – total output and qualitative changes using phonemic and semantic constraints: Clinical Neuropsychologist, 1995; 9(4); 313-20
35. Goodglass H, Kaplan E: The assessment of aphasia and related disorders, 1972, Philadelphia, Lea & Febiger
36. Rossi S, Antal A, Bestmann S, Safety and recommendations for TMS use in healthy subjects and patient populations, with updates on training, ethical and regulatory issues: Expert Guidelines: Clin Neurophysiol, 2021; 132(1); 269-306
37. Rossi S, Hallett M, Rossini PM, Pascual-Leone A, Safety, ethical considerations, and application guidelines for the use of transcranial magnetic stimulation in clinical practice and research: Clin Neurophysiol, 2009; 120(12); 2008-39
38. Schmithorst VJ, Holland SK, Event-related fMRI technique for auditory processing with hemodynamics unrelated to acoustic gradient noise: Magn Reson Med, 2004; 51(2); 399-402
39. Allendorfer JB, Lindsell CJ, Siegel M, Females and males are highly similar in language performance and cortical activation patterns during verb generation: Cortex, 2012; 48(9); 1218-33
40. Vannest J, Eaton KP, Henkel D, Cortical correlates of self-generation in verbal paired associate learning: Brain Res, 2012; 1437; 104-14
41. Nair S, Nenert RE, Allendorfer JB, Sex, age, and handedness modulate the neural correlates of active learning: Front Neurosci, 2019; 13; 961
42. Siegel M, Allendorfer JB, Lindsell CJ, The effects of linguistic relationships among paired associates on verbal self-generation and recognition memory: Brain Behav, 2012; 2(6); 789-95
43. Cox RW, AFNI: Software for analysis and visualization of functional magnetic resonance neuroimages: Comput Biomed Res, 1996; 29(3); 162-73
44. Cox RW, Jesmanowicz A, Real-time 3D image registration for functional MRI: Magn Reson Med, 1999; 42(6); 1014-18
45. Griffis JC, Allendorfer JB, Szaflarski JP, Voxel-based Gaussian naive Bayes classification of ischemic stroke lesions in individual T1-weighted MRI scans: J Neurosci Methods, 2015; 257; 97-108
46. Cox RW, Chen G, Glen DR, FMRI clustering in AFNI: False-positive rates redux: Brain Connect, 2017; 7(3); 152-71
47. Griffith J, Dietz A, Ball A, An examination of changes in spoken productions within constraint-induced aphasia therapy: Aphasiology, 2017; 31(11); 1250-65
48. Maher LM, Kendall D, Swearengin JA, A pilot study of use-dependent learning in the context of Constraint Induced Language Therapy: J Int Neuropsychol Soc, 2006; 12(6); 843-52
49. Morris DM, Taub E, Mark VW, Protocol for a randomized controlled trial of CI therapy for rehabilitation of upper extremity motor deficit: The Bringing Rehabilitation to American Veterans Everywhere Project: J Head Trauma Rehabil, 2019; 34(4); 268-79
50. Donkervoort M, Dekker J, van den Ende E, Prevalence of apraxia among patients with a first left hemisphere stroke in rehabilitation centres and nursing homes: Clin Rehabil, 2000; 14(2); 130-36
51. Bjorneby ER, Reinvang IR, Acquiring and maintaining self-care skills after stroke. The predictive value of apraxia: Scand J Rehabil Med, 1985; 17(2); 75-80
52. Griffis JC, Nenert R, Allendorfer JB, The canonical semantic network supports residual language function in chronic post-stroke aphasia: Hum Brain Mapp, 2017; 38(3); 1636-58
53. Allendorfer JB, Kissela BM, Holland SK, Szaflarski JP, Different patterns of language activation in post-stroke aphasia are detected by overt and covert versions of the verb generation fMRI task: Med Sci Monit, 2012; 18(3); CR135-37
54. Nardo D, Holland R, Leff AP, Less is more: Neural mechanisms underlying anomia treatment in chronic aphasic patients: Brain, 2017; 140(11); 3039-54
55. Abel S, Weiller C, Huber W, Therapy-induced brain reorganization patterns in aphasia: Brain, 2015; 138(Pt 4); 1097-112
56. Cardenas-Morales L, Gron G, Kammer T, Exploring the after-effects of theta burst magnetic stimulation on the human motor cortex: A functional imaging study: Hum Brain Mapp, 2011; 32(11); 1948-60
57. Hertrich I, Dietrich S, Ackermann H, The role of the supplementary motor area for speech and language processing: Neurosci Biobehav Rev, 2016; 68; 602-10
58. Nenert R, Allendorfer JB, Martin AM, Neuroimaging correlates of post-stroke aphasia rehabilitation in a pilot randomized trial of constraint-induced aphasia therapy: Med Sci Monit, 2017; 23; 3489-507
Figures
Figure 1. Overview of study recruitment and procedures. (A) CONSORT flow diagram outlining recruitment of subjects who suffered a left middle cerebral artery stroke and participated in the magnetic resonance imaging (MRI) study before and after treatment with constraint-induced aphasia therapy (CIAT) primed with intermittent theta burst stimulation (iTBS; modified after Szaflarski et al (2018) [3]). (B) Schematic of the open label study procedures. Participants performed language testing and MRI at baseline within 1 week of treatment initiation (T1), within 1 week of treatment completion (T2), and again after 12 weeks following treatment completion (T3).Figure 2. Schematic of the overt language tasks. During functional magnetic resonance imaging (fMRI) stimulus events were presented for 6 seconds during MRI silence, followed by 6 seconds of fMRI acquisition. Overt responses during MRI silence were recorded. (A) The event-related verb generation task involved auditory presentation of a noun, and subjects were instructed to either think of verbs related to the noun (covert generation), say the verbs related to the noun out loud (overt generation), or repeat the noun out loud (overt repetition). (B) The event-related verbal paired associates task involved visual presentation of a pair of related words, and participants were instructed to say the second word in the pair out loud. During the “read” condition, the second word in the pair was provided. During the “generate” condition, only the first letter of the second word was provided followed by asterisks for each remaining letter of the word, and subjects had to generate the second word and say it out loud.Figure 3. Composite lesion map and functional magnetic resonance imaging (fMRI) activation for the 13 participants. The composite lesion map and fMRI task activation maps at baseline (T1), immediately after treatment (T2) and at 3-month follow-up (T3; n=12) are overlaid onto a standard anatomical brain image in Montreal Neurologic Institute space. For all axial slices, left in the image is left in the brain. (A) The composite lesion map color scale ranges from the minimum (n=1 in blue) to the maximum (n=10 in red) number of participants that show overlap of lesions. (B) Statistical maps illustrating whole-brain fMRI activation patterns during speech production/auditory processing (“say verbs” vs “think verbs”) on the verb generation task are diminished at all 3 time points. Activation clusters are significant at corrected p<0.05 (voxelwise p=0.05, cluster threshold of 2079 mm3). (C) Activation related to processing noun-verb semantic associations on the verb generation task (“say verbs” vs “repeat nouns”) are present in frontal, temporal and parietal regions at T1 with minimal activation at T2 and T3. Activation clusters are significant at corrected p<0.05 (voxelwise p=0.05, cluster threshold of 2079 mm3). (D) Statistical maps illustrating whole-brain fMRI activation patterns during verbal encoding (“generate” vs “read”) on the verbal paired associates task are similar at T1 and T2, and differing at T3. Activations are significant at p<0.05, corrected (voxelwise p=0.05, cluster threshold of 1836 mm3).Figure 4. Functional magnetic resonance imaging (fMRI) statistical maps showing changes in activation over time. Paired t-tests reveal differences in fMRI activation between the 3 visits for the verb generation and verbal paired associates tasks. Coordinates of peak activation differences and extent of brain regions are provided in Table 3. Comparisons of immediately post-treatment relative to baseline (T2 vs T1) included 13 participants, while comparisons of 3-month follow-up relative to either immediately post-treatment (T3 vs T2) or to baseline (T3 vs T1) included 12 participants. The fMRI statistical maps are overlaid onto a standard anatomical brain image in Montreal Neurologic Institute space. For all axial slices, left in the image is left in the brain. (A) Regions showing differences in activation for speech production/auditory processing (“say verbs” vs “think verbs”) between T2 and T1 are shown in orange in the right angular gyrus and midbrain. There were also differences in activation between T3 and T1 in the right cerebellum (in blue). Clusters showing differences over time are significant at p<0.05, corrected (voxelwise p=0.05, cluster threshold of 2079 mm3). (B) T1 compared to both T2 and T3 showed differences in activation for processing noun-verb semantic associations (“say verbs” vs “repeat nouns”) as shown in blue in a number of regions including the cerebellum, as well as frontal, temporal, and parietal regions. The only activation difference for T3 relative to T2 is in the left insula (in blue). Activations are significant at p<0.05, corrected (voxelwise p=0.05, cluster threshold of 2079 mm3). (C) The differences in activation for verbal encoding at T3 relative to both T2 and T1 were in visual and parietal regions (in blue). Differences in activation between T3 and T2 also include bilateral temporal pole and midline frontal regions. Activations are significant at p<0.05, corrected (voxelwise p=0.05, cluster threshold of 1836 mm3).Figure 5. Scatterplots showing relationships between changes in functional magnetic resonance imaging (fMRI) activation and changes in language performance. We show Spearman correlations greater than |0.50|. (A) There were negative associations between T2 vs T1 fMRI activation changes in verb generation task (VGT) processing of noun-verb semantic associations and both corresponding change in the number of non-verb words produced on the VGT and change in Boston Naming Task (BNT) performance. ACC – anterior cingulate cortex; MFG – middle frontal gyrus; SFG – superior frontal gyrus. (B) There was a significant negative association between T3 vs T2 fMRI activation change in the supplementary motor area (SMA) during verbal paired associates task (VPAT) verbal encoding and the corresponding change in the aphasia quotient (AQ). Tables
Table 1. Baseline (T1) demographic and clinical variables for study participants.Table 2. Performance variables for the study participants over time.Table 3. Location and extent of functional magnetic resonance imaging (fMRI) activation in Figure 4. Brain regions showing differences in fMRI activation patterns between time points (T1, T2, T3) for the verb generation and verbal paired associates tasks are identified. Peak Montreal Neurologic Institute (MNI) coordinates (x, y, z) and t-value for each brain region are provided.Table 1. Baseline (T1) demographic and clinical variables for study participants.Table 2. Performance variables for the study participants over time.Table 3. Location and extent of functional magnetic resonance imaging (fMRI) activation in Figure 4. Brain regions showing differences in fMRI activation patterns between time points (T1, T2, T3) for the verb generation and verbal paired associates tasks are identified. Peak Montreal Neurologic Institute (MNI) coordinates (x, y, z) and t-value for each brain region are provided. In Press
06 Mar 2024 : Clinical Research
Comparison of Outcomes between Single-Level and Double-Level Corpectomy in Thoracolumbar Reconstruction: A ...Med Sci Monit In Press; DOI: 10.12659/MSM.943797
21 Mar 2024 : Meta-Analysis
Economic Evaluation of COVID-19 Screening Tests and Surveillance Strategies in Low-Income, Middle-Income, a...Med Sci Monit In Press; DOI: 10.12659/MSM.943863
10 Apr 2024 : Clinical Research
Predicting Acute Cardiovascular Complications in COVID-19: Insights from a Specialized Cardiac Referral Dep...Med Sci Monit In Press; DOI: 10.12659/MSM.942612
06 Mar 2024 : Clinical Research
Enhanced Surgical Outcomes of Popliteal Cyst Excision: A Retrospective Study Comparing Arthroscopic Debride...Med Sci Monit In Press; DOI: 10.12659/MSM.941102
Most Viewed Current Articles
17 Jan 2024 : Review article
Vaccination Guidelines for Pregnant Women: Addressing COVID-19 and the Omicron VariantDOI :10.12659/MSM.942799
Med Sci Monit 2024; 30:e942799
14 Dec 2022 : Clinical Research
Prevalence and Variability of Allergen-Specific Immunoglobulin E in Patients with Elevated Tryptase LevelsDOI :10.12659/MSM.937990
Med Sci Monit 2022; 28:e937990
16 May 2023 : Clinical Research
Electrophysiological Testing for an Auditory Processing Disorder and Reading Performance in 54 School Stude...DOI :10.12659/MSM.940387
Med Sci Monit 2023; 29:e940387
01 Jan 2022 : Editorial
Editorial: Current Status of Oral Antiviral Drug Treatments for SARS-CoV-2 Infection in Non-Hospitalized Pa...DOI :10.12659/MSM.935952
Med Sci Monit 2022; 28:e935952