


Abstract
In this study, we investigated the prognostic value of MRI contrast enhancement (CE) at the time of histological diagnosis specifically in a selected population of WHO grade II gliomas. We reviewed 927 histologically proven WHO grade II gliomas for which contrast-enhanced MR images were available at the time of histological diagnosis. CE patterns were classified into three categories: “patchy and faint,” “nodular-like,” and “ring-like.” CE progression over time was recorded before oncological treatment on successive MR images, when available. CE was present in 143 cases (15.9%), with 93 patchy and faint, 50 nodular-like, and no ring-like patterns. CE areas were time progressive before oncological treatment in 35 of the 56 available cases (62.5%). Regardless of its pattern, the presence of CE was not significantly associated with a worsened prognosis (p = 0.415) by univariate analysis. Only the nodular-like pattern of CE (p < 0.01) and the time-progressive CE (p < 0.001) in the available subgroup proved to be statistically associated with survival since first oncological treatment. The present results show the necessity, in cases of WHO grade II gliomas, to study CE at the time of histological diagnosis and, whenever possible, to follow its progression over time before oncological treatment. Nodular-like CE and time-progressive CE are associated with a worsened prognosis, both suggesting malignant transformation, even though histopathological examination cannot initially disclose signs of malignancy in those areas.
WHO grade II gliomas are progressive tumors that affect young adults.1–4 They are characterized by continuous growth,5,6 infiltration of the brain parenchyma preferentially along the white matter fiber tracts,7,8 and systematic malignant transformation that affects both functional and vital prognoses.4,9 WHO grade II gliomas are typically non-contrast-enhancing tumors.2–4,10–13 However, contrast enhancement (CE) has been reported at various frequencies,2–4,6,10,11,14–24 and the prognostic significance remains controversial.12–16,18–22,24–28
The aim of the present study was to investigate the prognostic value of CE on MR images, as determined in daily practice at the time of histological diagnosis, specifically in the selected population of WHO grade II gliomas. To address this issue, we reviewed a large homogeneous series of histologically proven WHO grade II gliomas for which contrast-enhanced MR images were available at the time of histological diagnosis.
Materials and Methods
Selection Criteria
We reviewed a consecutive series of patients with a diagnosis of glioma included between 1992 and 2007 in a French glioma study group (Réseau d'Etude des Gliomes). Patients included met the following criteria: (1) 18 or more years of age at the time of histological diagnosis; (2) histological diagnosis of supratentorial hemispheric WHO grade II glioma obtained before oncological treatment (astrocytoma, oligodendroglioma, and mixed glioma; gemistocytic astrocytoma and gliomatosis cerebri excluded);1 (3) histological samples targeting the CE areas in contrast-enhanced tumors (Fig. 1); and (4) available contrast-enhanced MRI performed less than 1 month before histological diagnosis.
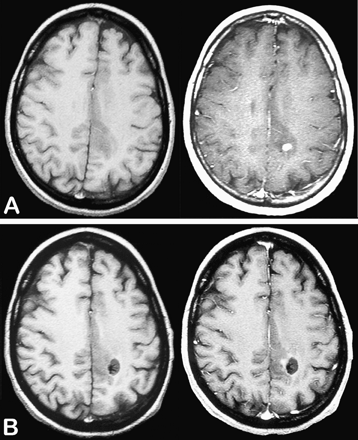
Example of biopsy sampling performed on the area of contrast enhancement. Axial T1-weighted sequences before (left) and after (right) injection of gadopentetate dimeglumine showing a small nodular-like contrast enhancement at the time of histological diagnosis (A) and after biopsy sampling (B). This case was taken from the gliomas under study.
Assessment of CE
MRI was performed prior to histological diagnosis in all cases with 1.5-T magnet systems at various institutions. Contrast-enhanced T1-weighted images were obtained approximately 10 min after injection of gadopentetate dimeglumine at the routine clinical contrast material dose (0.1 mmol/kg of body weight) in the same plane as used for the non-contrast-enhanced images.
MR images were reviewed independently by two investigators (L.C., J.P.) blinded to individual prognoses. In cases of discrepancies, MR images were reevaluated by both investigators until a consensus was reached. The following CE characteristics were evaluated by visual assessment: (1) CE: “present” versus “absent”; (2) pattern of CE: “patchy and faint” versus “nodular-like” versus “ring-like”; (3) areas of CE: “unique” versus “multiple”; and, when available, (4) CE change over time: “stable” versus “progressive.” The patchy and faint pattern was defined as a minimally or moderately intense, heterogeneous and not well-defined area of CE, regardless of its size (Fig. 2A, B). The nodular-like pattern was defined as a homogeneous and well-defined area of CE giving a nodular appearance, regardless of its intensity (Fig. 2C, D), and the diameter of the CE nodular area was measured. The ring-like pattern was defined as a nodular CE with a contrast-enhanced border surrounding a central focus of hyposignal, regardless of the size and the regularity in shape of the nodule and the intensity of CE (Fig. 2E, F). The progression of CE over time was estimated on consecutive MR images obtained before first oncological treatment (FT) and was defined by (1) the occurrence of new CE in a previously non-contrast-enhanced tumor, (2) the progression of CE pattern from patchy and faint to nodular-like and from nodular-like to ring-like, (3) an increase in size of the CE area, or (4) an increase in the number of CE areas (Fig. 3).
Histological Analysis
Histological diagnosis was obtained from routine histological analyses according to the WHO classification.1 For the purpose of this study, a random histological review was performed by a neuropathologist (M.K.) blinded of individual MRI findings and prognoses.
Statistical Analysis
To allow comparisons with prognostic factors previously proposed, the end point of the study was the survival since FT.29 Comparisons among groups were performed using χ2 tests for categorical variables and the Kruskal-Wallis and the Mann-Whitney U-tests for continuous variables. Survival curves were obtained using the Kaplan-Meier method. Comparisons of survival curves according to various parameters were performed using the log-rank test. Multivariate analysis was performed using the Cox model (backward stepwise method). Significance was set at p < 0.05. Analyses were performed with JMP 5.2 statistical software (SAS Institute Inc., Cary, NC, USA).
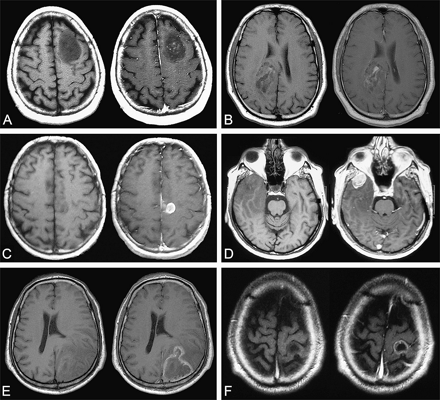
Examples of MRI patterns of contrast enhancement on axial T1-weighted sequence before (left) and after (right) injection of gadopentetate dimeglumine. (A and B) Patchy and faint pattern of contrast enhancement. (C and D) Nodular-like pattern of contrast enhancement. (E and F) Ring-like pattern of contrast enhancement. A–D were taken from the gliomas under study; E and F were taken from a high-grade glioma library.
Results
Clinical, Morphological, and Histological Data
The series under study included 927 patients (516 males and 411 females). At the time of histological diagnosis, the median age was 38 years (mean, 39.5 years; range, 18–73 years), 20 patients were asymptomatic, 809 had seizures, 123 had chronic headaches, and 101 had associated neurological deficits. The median tumor volume measured on MR images, based on the maximal visible abnormalities on T2-weighted or FLAIR (fluid attenuated inversion recovery) sequences, was 64.2 cm3 (mean, 84.2 cm3; range, 2.7–460.1 cm3) and tumor midline crossing was present in 48 cases.
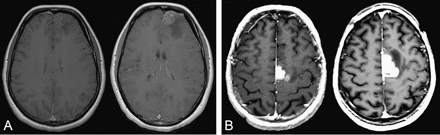
Examples of MRI time-progressive contrast enhancement before oncological treatment on axial T1-weighted sequence after injection of gadopentetate dimeglumine. (A) Time-progressive contrast enhancement at 2-month interval. (B) Time-progressive contrast enhancement at 3-month interval. A and B were both taken from the gliomas under study.
Histological diagnosis was obtained by 278 biopsy procedures and 649 surgical resections. There were 547 grade II oligodendrogliomas (59.0%), 215 grade II astrocytomas (23.2%), and 165 grade II mixed gliomas (17.8%).1 Random histological reviews were performed in 234 cases (25.2%). The median interval between histological diagnosis and FT was 3.0 months (mean, 12.0 months; range, 0.0–108.0 months).
CE Analysis
Tumor CE was present in 143 of the 927 grade II gliomas (15.9%), with 93 patchy and faint, 50 nodular-like, and no ring-like patterns of CE (Table 1). The median diameter of the nodular-like areas of CE was 1.4 cm (mean, 1.7 cm; range, 0.4–4.0 cm). Multiple areas of CE were present within the tumor volume in 33 cases. The possibility of studying the progression over time was available only in 56 cases, for which we had consecutive MRIs before FT. The duration of follow-up is the interval during which consecutive MRIs were performed before FT.
Patterns of contrast enhancement at the time of histological diagnosis in the 143 contrast-enhanced grade II gliomas
| Pattern | |||
|---|---|---|---|
| Characteristic | Patchy and Faint | Nodular-like | |
| Unique/multiple | 76 (81.7%)/17 (18.3%) | 34 (68.0%)/16 (32.0%) | |
| Progression/stability | 21 (22.6%)/17 (18.3%) | 14 (28.0%)/4 (8.0%) | |
| Progression not available | 55 (59.1%) | 32 (64.0%) | |
| Total | 93 | 50 | |
Interinvestigator discrepancies were observed initially in 33 cases. Sixteen mismatches between patchy and faint and nodular-like patterns were finally included as 4 nodular-like and 12 patchy and faint patterns. Seventeen mismatches between patchy and faint patterns and absence of CE were finally included as 12 patchy and faint patterns and 5 with absence of CE. No mismatches between nodular-like pattern of CE and absence of CE were observed.
At the time of histological diagnosis, there were no statistically significant differences between the subgroups of CE pattern regarding clinical findings, the presence of a midline crossing, and the random histological review (Table 2). The tumor volume was statistically higher in the patchy and faint subgroup than in the other subgroups (p = 0.004). The histological classes varied among subgroups, with statistically more mixed gliomas and statistically fewer astrocytomas in the nodular-like subgroup than in the other subgroups (p = 0.028). The interval between histological diagnosis and FT was statistically shorter in the nodular-like subgroup than in the other subgroups (p = 0.022).
Clinical, imaging, and histological characteristics at the time of diagnosis of the different subgroups of WHO grade II gliomas under study
| Contrast Enhancement | ||||||
|---|---|---|---|---|---|---|
| Characteristic | Absent | Patchy and Faint | Nodular-like | p-Value | ||
| Number of cases | 784 | 93 | 50 | |||
| Clinical findings at histological diagnosis | ||||||
| Median age, years | 38.0 | 40.5 | 38.0 | 0.118 | ||
| Sex, M/F | 438/346 | 50/43 | 28/22 | 0.927 | ||
| Seizures, n (%) | 688 (87.7%) | 79 (85.0%) | 42 (84.0%) | 0.553 | ||
| Chronic headaches, n (%) | 101 (12.9%) | 13 (14.0%) | 9 (18.0%) | 0.596 | ||
| Neurological deficit, n (%) | 84 (10.7%) | 11 (11.9%) | 6 (12.0%) | 0.286 | ||
| Median interval/treatment, months | 3.0 | 3.0 | 1.0 | 0.022 | ||
| Imaging findings at histological diagnosis | ||||||
| Median tumor volume,a cm3 | 60.9 | 79.2 | 69.6 | 0.004 | ||
| Midline crossing, n (%) | 37 (4.7%) | 6 (6.5%) | 5 (10.0%) | 0.285 | ||
| Histological findings | ||||||
| Histological class, n (%) | ||||||
| Astrocytoma | 193 (24.6%) | 16 (17.2%) | 6 (12.0%) | |||
| Oligodendroglioma | 454 (58.0%) | 64 (68.8%) | 29 (58.0%) | |||
| Mixed glioma | 137 (17.4%) | 13 (14.0%) | 15 (30.0%) | |||
| Histological review, n (%) | 209 (26.6%) | 23 (24.7%) | 12 (24.0%) | 0.561 | ||
Median tumor volume was estimated on MR images based on the maximal visible abnormalities on T2-weighted or FLAIR sequences
Survival Analysis
The overall median duration of clinical follow-up for the whole population under study was 4.0 years (mean, 5.0 years; range, 0.4–29.2 years) since FT. During this period, 201 patients died (21.7%). Nine patients who died of a nononcological cause were censored at the time of death. The remaining 192 patients died at a median time of 4.7 years (mean, 5.7 years; range, 0.4–27.3 years) since FT. The overall median survival for the whole population under study was at 12.8 years since FT. The median survival and survival at 5, 10, and 15 years since FT, by subgroup of CE, are summarized in Table 3.
Survival from first oncological treatment by contrast enhancement pattern
| Survival from First Treatment | |||||||
|---|---|---|---|---|---|---|---|
| Contrast Enhancement | Median (Years) | 5 Years | 10 Years | 15 Years | |||
| Absence | 12.7 | 83.2% | 60.3% | 44.3% | |||
| Presence | 11.9 | 79.1% | 68.5% | 27.8% | |||
| Patchy and faint pattern | 12.6 | 89.4% | 72.4% | 19.0% | |||
| Nodular-like pattern | 4.3 | 47.1% | 47.1% | — | |||
| Unique area | 10.5 | 76.2% | 71.4% | — | |||
| Multiple areas | 9.3 | 71.7% | 48.2% | — | |||
| Stable over time | 12.3 | 86.3% | 65.3% | 40.8% | |||
| Progression over time | 4.0 | 40.6% | 19.2% | — | |||
In univariate analyses, regarding the CE characteristics, only the presence of a nodular-like pattern and the presence of progressive CE over time were statistically associated with survival since FT (Table 4, Fig. 4). Presence of CE regardless of its pattern, patchy and faint CE pattern, multiple areas of CE within the tumor volume, and size of the nodular-like areas of CE (cutoff at 2 cm in diameter) did not reach statistical significance for survival from FT (Table 4). Regarding commonly listed risk factors,6,29 tumor volume (cutoff at 6-cm diameter) and presence of neurological deficit proved to be statistically associated with survival since FT (Table 4). Presence of midline crossing, age at histological diagnosis (cutoff at 40 years), and histological diagnosis (oligodendrogliomas and mixed gliomas vs. astrocytomas) did not reach statistical significance for survival from FT (Table 4).
Prognostic factors associated with survival from first oncological treatment
| Association with Survival from First Treatment (p-Value) | |||
|---|---|---|---|
| Factor | Univariate | Multivariate | |
| Contrast enhancement | |||
| Presence | 0.415 | — | |
| Patchy and faint pattern | 0.348 | — | |
| Nodular-like pattern | <0.01 | 0.380 | |
| Size of nodular areas | 0.344 | — | |
| Number of areas | 0.285 | — | |
| Progression over time | <0.001 | 0.103 | |
| Prognostic factors | |||
| Age | 0.734 | 0.257 | |
| Midline crossing | 0.479 | 0.036 | |
| Neurological deficit | <0.001 | 0.055 | |
| Histological diagnosis | 0.453 | 0.041 | |
| Tumor volume | <0.001 | <0.001 | |
In multivariate analyses, midline crossing, tumor volume, and histological diagnosis proved to be independent prognostic factors significantly associated with survival since FT in the whole series. Presence of a nodular-like CE pattern, presence of time-progressive CE, age at histological diagnosis, and presence of neurological deficit did not reach statistical significance (Table 4).
Discussion
In this retrospective study, we identified CE, as determined in daily practice, at the time of histological diagnosis in about 16% of the 927 WHO grade II gliomas under study. Survival analysis demonstrated that the presence of CE alone, regardless of its pattern, had no prognostic value and that only the presence of a nodular-like CE pattern or of progressive CE over time, both suggesting malignant transformation, were associated with a worsened prognosis. These parameters were statistically significant in univariate analyses but failed to reach significance in multivariate analyses, perhaps due to small numbers of cases in the subgroups or to the interrelations with other parameters.
WHO grade II gliomas are typically non-contrast-enhancing tumors;2–4,10–13 the presence of CE at the time of histological diagnosis has been reported with a frequency ranging from less than 10% to more than 50%.2–4,6,10,11,14–23 When present, CE has been usually described as heterogeneous, patchy and faint, and rarely with nodular-like or ring-like patterns.2,10 The prognostic significance of CE on MR images at the time of histological diagnosis has been controversial for the subgroup of WHO grade II gliomas, being reported as a negative factor in several studies12–16,21,22,25–27 and as without prognostic significance in others.4,18–20,28 The discrepancies observed between the reported frequencies of CE suggest that tumors might have been misdiagnosed and misgraded as WHO grade II gliomas, especially in the oldest studies. In such cases, the prognostic value of CE becomes meaningless. Several malignant gliomas may have been undergraded due to the limitations of histological sampling.2,6,12,13,30 This is illustrated by the presence, in reported studies of WHO grade II gliomas, of tumors with a clinical progression closer to that of a malignant glioma6,20,30,31 and of tumors with ring-like CE surrounding a central focus of hyposignal with a typical geographic map appearance, which is classically a hallmark of high-grade malignancy.11–13,32,33 In contrast, some studies included all low-grade tumors, such as WHO grade I pilocytic astrocytomas and dysembryoplastic neuroepithelial tumors, which are known to be, in part, contrast enhanced.1,34,35 In the present study, we tried to avoid any bias by drastic selection of histologically proven WHO grade II gliomas and requiring histological sampling of the CE areas. The risk of sampling error remains, but both the absence of ring-like CE patterns in the present study and the observed frequency of 15.9% of contrast-enhanced tumors, in accordance with the reported frequency in recent studies of WHO grade II gliomas, argue for a correct histological sampling in the present study.2,15
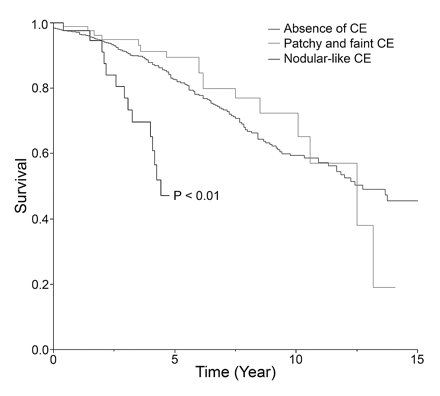
Kaplan-Meier estimates of survival since first oncological treatment by contrast enhancement (CE) pattern: absent, patchy and faint, or nodular-like.
The use of imaging criteria as the macroscopic scale of tumor analysis has been proposed to overcome limitations of histological sampling.12,13,32 In their original approach, Daumas-Duport et al. demonstrated that the presence of CE, reflecting areas of neoangiogenesis, has the same prognostic significance as the presence of endothelial hyperplasia on histological analysis.12,13,32 These observations form the rationale of an alternative classification and grading of oligodendrogliomas using additional imaging criteria.12,13,32 Such an approach implies the use of reproducible definition criteria for CE as used in this study. However, clear, common, and reproducible criteria describing characteristics of CE on MR images are still lacking. In reported studies, CE is generally defined as present, absent, or doubtful, and specific features are rarely studied.3,6,12–17,19–22,25,26,28 Consequently, such studies could not link patterns of CE and tumor behaviors. The present study indicates that CE patterns might reflect underlying biological properties, corresponding to different glioma subgroups that vary in their natural history and will consequently have different prognoses. Indeed, time-progressive CE and a nodular-like pattern of CE may correspond to active processes leading to malignancy, including neoangiogenesis, as previously proposed,13,21 even though histopathological examination failed to disclose signs of malignancy. Additionally, the patchy and faint pattern of CE may reflect only the inherent vascular properties of the tumor. Moreover, transient postictal imaging abnormalities can occur after seizures, which include a transient CE extending from the tumor bed into the surrounding parenchyma.36 Thus, MRI performed shortly after an ictal event may present a false CE area. In the present study, 809 patients experienced seizures, and several patchy and faint areas of CE, without prognostic significance, could have been transient postictal CE. However, 38 of the 93 MR images with patchy and faint CE also included longitudinal MRI follow-up before FT, and all had patchy and faint CE on the second MRI as well.
The main reason for the interinvestigator discrepancies in CE pattern determination is that comparisons are subjective and difficult because qualitative evaluation of CE characteristics on MR images were performed at various institutions using different protocols. Moreover, printed as well as digitized images were available that did not allow quantification of CE characteristics. Consequently, the proposition of universally accepted definition criteria for CE requires the development of reproducible quantitative criteria through a standardized methodology.
In the present study, we found that only the presence of a nodular-like CE pattern and time-progressive CE were associated with a worsened prognosis in a large population of histologically proven WHO grade II gliomas. As a direct consequence, we recommend that the pattern of CE and, when possible, its progression over time be determined for each patient to help identify tumors with a higher risk of malignant behavior. From a practical point of view, qualitative criteria for CE are not sufficiently reliable, thus arguing for the development of reproducible quantitative criteria that might be incorporated in a multiscale glioma grading scheme.6 In this regard, relative cerebral blood flow measurements from dynamic susceptibility MR perfusion imaging have been shown to be correlated with histological measurements of microvascularity in gliomas. It thus appears to be a promising tool in helping to identify gliomas that are at high risk of malignant transformation, even if they were histologically diagnosed as WHO grade II gliomas.30,37
References
Kleihues P, Cavenee W.
Cavaliere R, Lopes MB, Schiff D. Low-grade gliomas: an update on pathology and therapy.
Lang FF, Gilbert MR. Diffusely infiltrative low-grade gliomas in adults.
Wessels PH, Weber WE, Raven G, et al. Supratentorial grade II astrocytoma: biological features and clinical course.
Mandonnet E, Delattre JY, Tanguy ML, et al. Continuous growth of mean tumor diameter in a subset of grade II gliomas.
Pallud J, Mandonnet E, Duffau H, et al. Prognostic value of initial magnetic resonance imaging growth rates for World Health Organization grade II gliomas.
Mandonnet E, Capelle L, Duffau H. Extension of paralimbic low grade gliomas: toward an anatomical classification based on white matter invasion patterns.
Pallud J, Devaux B, Daumas-Duport C, et al. Glioma dissemination along the corticospinal tract.
Duffau H. Lessons from brain mapping in surgery for low-grade glioma: insights into associations between tumour and brain plasticity.
Brami-Zylberberg F, Grand S, Le Bas JF, Meder JF. [MRI for oligodendrogliomas].
Lote K, Egeland T, Hager B, et al. Prognostic significance of CT contrast enhancement within histological subgroups of intracranial glioma.
Daumas-Duport C, Koziak M, Miquel C, et al. [Reappraisal of the Sainte-Anne Hospital classification of oligodendrogliomas in view of retrospective studies].
Daumas-Duport C, Tucker ML, Kolles H, et al. Oligodendrogliomas. Part II: a new grading system based on morphological and imaging criteria.
Bauman G, Lote K, Larson D, et al. Pretreatment factors predict overall survival for patients with low-grade glioma: a recursive partitioning analysis.
Kreth FW, Faist M, Grau S, Ostertag CB. Interstitial 125I radiosurgery of supratentorial de novo WHO grade 2 astrocytoma and oligoastrocytoma in adults: long-term results and prognostic factors.
Lote K, Egeland T, Hager B, et al. Survival, prognostic factors, and therapeutic efficacy in low-grade glioma: a retrospective study in 379 patients.
Lunsford LD, Somaza S, Kondziolka D, Flickinger JC. Survival after stereotactic biopsy and irradiation of cerebral nonanaplastic, nonpilocytic astrocytoma.
Nicolato A, Gerosa MA, Fina P, et al. Prognostic factors in low-grade supratentorial astrocytomas: a uni-multivariate statistical analysis in 76 surgically treated adult patients.
Philippon JH, Clemenceau SH, Fauchon FH, Foncin JF. Supratentorial low-grade astrocytomas in adults.
Piepmeier J, Christopher S, Spencer D, et al. Variations in the natural history and survival of patients with supratentorial low-grade astrocytomas.
Plathow C, Lichy MP, Bachert P, et al. The role of MRI in patients with astrocytoma WHO II treated with fractionated stereotactic radiotherapy.
Plathow C, Schulz-Ertner D, Thilman C, et al. Fractionated stereotactic radiotherapy in low-grade astrocytomas: long-term outcome and prognostic factors.
Walker C, du Plessis DG, Fildes D, et al. Correlation of molecular genetics with molecular and morphological imaging in gliomas with an oligodendroglial component.
Lebrun C, Fontaine D, Ramaioli A, et al. Long-term outcome of oligodendrogliomas.
Grabenbauer GG, Roedel CM, Paulus W, et al. Supratentorial low-grade glioma: results and prognostic factors following postoperative radiotherapy.
Schuurman PR, Troost D, Verbeeten B Jr, Bosch DA. 5-year survival and clinical prognostic factors in progressive supratentorial diffuse “low-grade” astrocytoma: a retrospective analysis of 46 cases.
Vaquero J, Zurita M, Morales C, Coca S. Prognostic significance of tumor-enhancement and angiogenesis in oligodendroglioma.
Leighton C, Fisher B, Bauman G, et al. Supratentorial low-grade glioma in adults: an analysis of prognostic factors and timing of radiation.
Pignatti F, van den Bent M, Curran D, et al. Prognostic factors for survival in adult patients with cerebral low-grade glioma.
Law M, Oh S, Johnson G, et al. Perfusion magnetic resonance imaging predicts patient outcome as an adjunct to histopathology: a second reference standard in the surgical and nonsurgical treatment of low-grade gliomas.
Abdulrauf SI, Edvardsen K, Ho KL, et al. Vascular endothelial growth factor expression and vascular density as prognostic markers of survival in patients with low-grade astrocytoma.
Daumas-Duport C, Varlet P, Tucker ML, et al. Oligodendrogliomas. Part I: patterns of growth, histological diagnosis, clinical and imaging correlations: a study of 153 cases.
Hammoud MA, Sawaya R, Shi W, et al. Prognostic significance of preoperative MRI scans in glioblastoma multiforme.
Daumas-Duport C, Scheithauer BW, Chodkiewicz JP, et al. Dysembryoplastic neuroepithelial tumor: a surgically curable tumor of young patients with intractable partial seizures. Report of thirty-nine cases.
Stanescu Cosson R, Varlet P, Beuvon F, et al. Dysembryoplastic neuroepithelial tumors: CT, MR findings and imaging follow-up: a study of 53 cases.
Finn MA, Blumenthal DT, Salzman KL, Jensen RL. Transient postictal MRI changes in patients with brain tumors may mimic disease progression.


