


Postmenopausal women are at an increased risk of developing coronary artery disease (CAD). This increase is due primarily to elevated cholesterol concentrations accompanying the loss of endogenous estrogen secretion. Recently, the consumption of soy foods has been shown to reduce serum cholesterol concentrations. Phytoestrogens (PE) have been proposed as the responsible agents of the hypocholesterolemic effect of soy foods. However, few studies have investigated the effect of PE supplementation on serum lipoproteins. The purpose of the present study is to investigate the effects of PE supplementation (150 mg) on serum lipids and lipoproteins in moderately hypercholesterolemic, elderly, postmenopausal women. Thirty-six subjects were randomized into two groups and received either a 150-mg PE supplement/d (n = 20) or a placebo (n = 16). Serum samples obtained at baseline and 2 months were analyzed for total triacylglycerol, total cholesterol, and high density lipoprotein cholesterol using standard Lipid Research Clinic procedures. In addition, total triacylglycerol and cholesterol were measured after 6 months of treatment. The t test and ANOVA were employed to compare the two groups. The results (mean ± sem) indicated no significant differences in total triacylglycerol (1.3 ± 0.2 vs. 1.2 ± 0.2 mmol/liter), total cholesterol (6.4 ± 0.4 vs. 6.5 ± 0.2 mmol/liter), or high density lipoprotein cholesterol (1.0 ± 0.1 vs. 1.0 ± 0.1 mmol/liter) between the placebo and the PE groups, respectively, after 2 months of treatment. Moreover, total triacylglycerol and cholesterol remained unchanged after 6 months. Our findings suggest that PE supplementation with 150 mg/d over a 6-month period does not significantly alter serum lipoproteins in postmenopausal women and, therefore, may not effectively reduce the risk of CAD in this population.
POSTMENOPAUSAL WOMEN ARE a population at increased risk for coronary artery disease (CAD) (1). This increase is believed to be due to changes in lipoprotein metabolism that accompany the loss of endogenous estrogen secretion, including elevated plasma cholesterol, elevated low density lipoprotein (LDL) cholesterol, and decreased high density lipoprotein (HDL) cholesterol (2). There is evidence in the current literature suggesting that dietary intake of soy protein contributes to lowering these risk factors in a variety of populations (3, 4), including postmenopausal women (5, 6).
It has been proposed that phytoestrogens (PE) may be the component in soy responsible for this beneficial effect because of their similarity to endogenous estrogen in chemical structure and biological activity (7). Figure 1 illustrates the virtually superimposable structures of E2 and equol, a PE metabolite. Specifically, the presence of the phenolic ring and the distance between the hydroxyl groups, which is nearly identical in the two molecules, are considered prerequisites for estrogen binding. Despite this hypothesis, few studies have been reported the effect of PE supplementation on these risk factors (8–11). Results have suggested a decreasing trend of LDL cholesterol, but have failed to reach statistical significance (9). However, the amount of PE used was limited to a maximum of 80 mg, a quantity that approximates the level obtainable with soy-based diets (10). Although this is of practical importance, higher levels available through supplementation may be effective in decreasing the risk for CAD (10). The purpose of this study is to assess the role of supplementation with higher amounts of PE (150 mg/d) on serum lipoprotein triacylglycerol and cholesterol concentrations in moderately hypercholesterolemic, elderly, postmenopausal women.
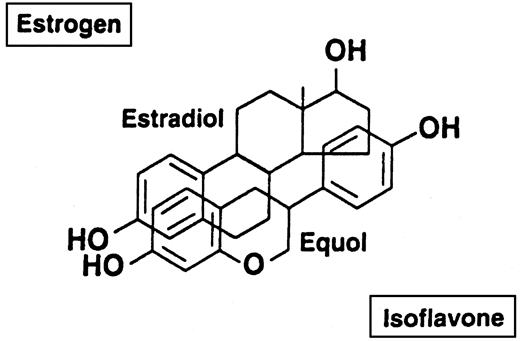
Comparison of the chemical structures of E2 and the isoflavone metabolite, equol, showing their nearly superimposable characteristics.
Subjects and Methods
Subjects and study design
Subjects were recruited initially as part of a larger randomized, double blind, placebo-controlled trial with a parallel design to assess the role of PE supplementation on bone mineral health. Thirty-six healthy moderately hypercholesterolemic (mean total cholesterol, 6.6 ± 1.3 mmol/liter) postmenopausal women (mean age, 69 ± 4 yr), not receiving hormone replacement therapy, were randomly assigned to take either a PE supplement (n = 20) or placebo (n = 16) three times daily for 6 months. With the exception of mild hypercholesterolemia, all subjects were in good general health with no clinical or biochemical evidence of diabetes or renal, hepatic, or cardiovascular disease. With the exception of two individuals, none of the subjects was taking any medication known to affect carbohydrate or lipid metabolism. One subject was taking simvastatin and the other fluvastatin for hypercholesterolemia. Both subjects had been on a stable dose for at least 1 yr before the study, and medications were not altered during the study period. Because the results from these two individuals were indistinguishable from the other 34 participants, they were included in the analyses of the data. All subjects signed a consent form approved by the Administrative Panel on Human Subjects in Medical Research at Stanford University School of Medicine before participating in the study.
The baseline characteristics of the subjects are provided in Table 1. The two groups did not significantly differ in age, weight, body mass index, total cholesterol, HDL cholesterol, non-HDL cholesterol, or triacylglycerol concentrations. The PE and placebo tablets were composed of either 150 mg soy-derived isoflavones or maltodextrin with 10% caramel color, respectively. The PE tablet contained a semipurified extract in which 90 mg of the total isoflavones were present as aglycones and the remaining as glycosides. The aglycones were genistein (40 mg, or 45%) and daidzein and glycitein (55%) (12). The glycosides are easily hydrolyzed in the gastrointestinal tract, and the released aglycones are readily absorbed (13). Fasting serum was obtained at baseline, 2 months, and 6 months. The subjects were instructed to maintain their usual diet and lifestyle habits, with the exception of excluding soy-containing foods. Thirty-five of the 36 subjects completed a 3-month, self-administered, semiquantitative food frequency questionnaire (NCI version FULL 87) (14). Diets were analyzed at baseline and 3 months using the Dietary Analysis System (Dietsys) version 3.6 (NCI, Bethesda, MD).
Baseline characteristics of subjects in the placebo and phytoestrogen (PE)-supplemented groups
| Variable | Placebo (n = 16) | PE (n = 20) |
|---|---|---|
| Age (yr) | 70 ± 1 (65–77) | 69 ± 1 (64–83) |
| BW (kg) | 66 ± 4 (48–102) | 68 ± 2 (50–86) |
| Body mass index (kg/m2) | 25 ± 1 (19–39) | 25 ± 1 (18–32) |
| Total cholesterol (mmol/liter) | 6.3 ± 0.5 (4.9–12.3) | 6.8 ± 0.2 (5.7–8.2) |
| HDL cholesterol (mmol/liter) | 1.2 ± 0.1 (0.7–1.8) | 1.2 ± 0.1 (0.7–2.0) |
| Non-HDL cholesterol (mmol/liter) | 5.1 ± 0.5 (3.5–11.4) | 5.6 ± 0.2 (4.4–7.0) |
| Triacylglycerol (mmol/liter) | 1.3 ± 0.2 (0.1–3.0) | 0.8 ± 0.1 (0.2–2.4) |
Values are expressed as the mean ± sem; ranges are given in parentheses.
Lipid analyses
Total serum triacylglycerol and cholesterol concentrations were measured in fasting samples obtained at baseline and after 2 and 6 months of treatment. Because of the unavailability of serum, determinations of triacylglycerol and cholesterol concentrations at 6 months were performed only on 17 and 18 of the 20 subjects in the PE-treated group, respectively. All samples were analyzed in duplicate. Intraassay coefficients of variation were 2% or less, and interassay coefficients of variation were 4% or less. Total serum triacylglycerol concentrations were determined using a quantitative enzymatic method (Sigma, St. Louis MO) (15). Total serum cholesterol and HDL cholesterol concentrations were measured at the same time for each individual, using standard Lipid Research Clinic Procedures established by the Centers for Disease Control (Atlanta, GA) (16, 17). HDL cholesterol concentrations were determined after selective precipitation of apolipoprotein B-containing lipoproteins with phosphotungstic acid and MgCl2, at baseline and at 2 months of treatment. Non-HDL cholesterol concentrations were calculated by subtracting HDL cholesterol from total serum cholesterol.
Statistical analyses
All values are presented as the mean ± sem. Standard statistical techniques for the analysis of two sample means were used (18). Nonpaired t test was used to compare differences in dietary intake at baseline and 3 months between the two groups and to compare differences in total triacylglycerol, cholesterol, HDL cholesterol, and non-HDL cholesterol between groups at baseline and 2 months. ANOVA was employed to compare fasting triacylglycerol and cholesterol concentrations between the two groups, at baseline and after 2 and 6 months of treatment. The level of statistical significance was set at P < 0.05.
Results
The composition of the subjects’ diets at baseline and 3 months after supplementation are presented in Table 2. There were no significant differences between the two groups at baseline or 3 months with respect to total energy intake or the amount of total fat, saturated fat, cholesterol, or dietary fiber, but there was a significant difference in protein intake between the two groups at 3 months (P < 0.05). The changes in dietary protein intake, although statistically significant, were quantitatively very small and resulted from a 1% increase in the PE-treated group at 3 months. These differences are probably of little or no clinical significance, given the semiquantitative nature of the food frequency questionnaire. The subjects’ total fat intake is similar to the average fat intake in the U.S. population (NHANES data, 1994). Their intake of saturated fat and cholesterol is within the recommendations of the National Cholesterol Education Program Step 1 diet (<10% saturated fat, <300 mg cholesterol) and represents their habitual dietary intake. No changes in dietary fat or cholesterol intake were made before or during the study. Although the effect of the baseline diet on the response to PE supplementation or soy-based diets is currently unknown, it is widely perceived that diets low in saturated fats and cholesterol would accentuate the hypocholesterolemic effects of soy (3–6, 8–10, 19–23). As both groups in the present study were consuming diets already low in saturated fat and cholesterol and essentially identical in composition, it is likely that any contributory effect of the baseline diets on lipid metabolism would be equivalent for both groups.
Dietary intakes in the placebo and phytoestrogen (PE)-supplemented groups at baseline and 3 months
| Variable | Placebo (n = 16) | PE (n = 19) | ||
|---|---|---|---|---|
| Baseline | Post | Baseline | Post | |
| Energy (kJ) | 7502 ± 786 | 6460 ± 531 | 6870 ± 536 | 6958 ± 469 |
| Protein (%) | 15 ± 1 | 15 ± 1 | 16 ± 1 | 17 ± 11 |
| Fat (%) | 35 ± 2 | 34 ± 2 | 32 ± 2 | 34 ± 2 |
| Saturated (%) | 10 ± 1 | 10 ± 1 | 10 ± 1 | 11 ± 1 |
| Cholesterol (mg) | 258 ± 70 | 183 ± 20 | 184 ± 22 | 210 ± 20 |
| Carbohydrate (%) | 49 ± 2 | 50 ± 3 | 53 ± 2 | 48 ± 2 |
| Fiber (g) | 17 ± 1 | 17 ± 2 | 20 ± 2 | 19 ± 2 |
Values are expressed as the mean ± sem.
Significantly different from placebo (P < 0.05).
The results of the lipid analyses are presented in Table 3. The main comparisons in serum lipids were made between the placebo and PE groups at baseline and after 2 months of treatment. The results showed no significant differences between the two groups in total triacylglycerol, total cholesterol, HDL cholesterol, or non-HDL cholesterol at baseline or after 2 months of supplementation with 150 mg PE. In addition, comparisons of total serum triacylglycerol and cholesterol concentrations at 6 months continued to show no significant changes between the two groups.
Serum lipids and lipoproteins in the placebo and phytoestrogen (PE)-supplemented groups at baseline and postintervention
| Variable | Placebo (n = 16) | PE (n = 20) | ||||
|---|---|---|---|---|---|---|
| Baseline | 2 months | 6 months | Baseline | 2 months | 6 months | |
| Total cholesterol (mmol/liter) | 6.3 ± 0.5 | 6.4 ± 0.4 | 6.0 ± 0.2 | 6.8 ± 0.2 | 6.5 ± 0.2 | 6.4 ± 0.2 |
| HDL cholesterol (mmol/liter) | 1.2 ± 0.1 | 1.0 ± 0.1 | 1.2 ± 0.1 | 1.0 ± 0.1 | ||
| Non-HDL cholesterol (mmol/liter) | 5.1 ± 0.5 | 5.3 ± 0.4 | 5.6 ± 0.2 | 5.5 ± 0.2 | ||
| Triacylglycerol (mmol/liter) | 1.3 ± 0.2 | 1.3 ± 0.2 | 1.4 ± 0.2 | 0.8 ± 0.1 | 1.2 ± 0.2 | 0.9 ± 0.1 |
Values are expressed as the mean ± sem.
Discussion
The results of the present study demonstrate that PE supplementation with 150 mg of soy-derived phytoestrogens for 6 months was ineffective in reducing total serum triacylglycerol and cholesterol concentrations in these moderately hypercholesterolemic postmenopausal women. In addition, there were no significant differences in the cholesterol concentrations in either the HDL or non-HDL lipoprotein fraction at 2 months. As such, these data argue strongly against the idea that the hypocholesterolemic effect previously reported with soy-based diets (3–6) resulted from their PE content.
PE have been promoted as good candidates for the cholesterol-lowering effect of soy because of their similarity to endogenous estrogen in chemical structure and biological activity (7). Genistein, the predominant PE in soy, exhibits a weak estrogenic activity, on the order of 10−2–10−3 that of 17β-E2, but can still achieve maximal stimulation of the ER (20). However, our findings along with previous investigations of the effect of PE supplementation in postmenopausal women (8–11) do not support this general hypothesis. Nestel and colleagues studied the effects of a pure soybean extract in 21 postmenopausal women in a placebo-controlled, cross-over trial over 5- to 10-wk periods (8). The results suggested that daily supplementation with 40 or 80 mg isoflavones did not significantly alter lipid or lipoprotein profiles. The authors reported equivalent findings in a second, similar study using an isoflavone extract from red clover, a plant that contains the isoflavones present in the soybean (genistein and daidzein) as well as their precursors (biochanin A and formononetin) (9). The authors discussed an apparent downward trend in LDL (6%) and an upward trend in HDL (4%), which resulted in an apparent reduction (10%) in the LDL/HDL cholesterol ratio between the placebo and treatment values. However, none of these differences, including total cholesterol (3%), was statistically significant, and all were quantitatively small. More recently, similar findings were reported in a placebo-controlled, cross-over study of 20 postmenopausal women (10). In this study, after 8 wk of supplementation with 80 mg soy isoflavones, cholesterol concentrations were essentially identical (≤1%) to the placebo values.
It has been suggested that the cholesterol-lowering effects of soy protein are strongly associated with baseline serum cholesterol concentrations (21) and may depend on the dose of PE administered (10). All subjects in the present study were moderately hypercholesterolemic, and the dose of isoflavones used (150 mg/d) was 1.5–2 times the level that could be reasonably expected in soy-based diets. Thus, the conditions of the present study should have been optimal for the detection of any hypocholesterolemic effect. The results of this study expand upon previous investigations and strongly suggest that PE probably play a limited role in modifying serum cholesterol in this population.
It is entirely possible that the inability to demonstrate a significant lowering of cholesterol in the present study as well as others using purified or semipurified phytoestrogens, as opposed to those observations of a hypocholesterolemic effect of soy-based studies, results from factors present in soy-based diets other than PE content. Indeed, it has been suggested that the hypocholesterolemic effects of soy may not be attributed to any specific factor, but result from the synergistic actions of several components present in soy (22). On the other hand, it is equally possible that the difference between the present study and existing research evaluating the effects of PE extracts (8–11) and the results reported in several intervention studies using soy protein (5, 6) may be more apparent than real. It is important to note that although the soy-based investigations obtained statistically significant reductions in cholesterol (5, 6), these changes are quantitatively small and similar in magnitude to those reported in the studies using PE extracts (8–11). For, example, Baum and colleagues (5), using adjusted means, were able to show a significant decrease in non-HDL cholesterol (7%) and a significant increase in HDL cholesterol (5%) in subjects receiving 40 g soy protein daily compared with the control group. On the other hand, the actual means at the end of the treatment periods were essentially identical. Thus, the current available data on the effect of soy protein on serum lipids remain inconclusive. Therefore, it is of some concern that the Food and Drug Administration recently approved a claim petition stating “diets low in saturated fat and cholesterol that include 25 grams of soy protein a day may reduce the risk of heart disease” (19). In fact, a recent study investigating the effect of a similar amount of soy protein (20 g) in a Step 1 diet reported only a 2.6% lowering of non-HDL cholesterol in moderately hypercholesterolemic men (23). The subjects’ non-HDL cholesterol was reduced by only 0.13 mmol/liter, from 4.91 to 4.78 mmol/liter (from 190 to 185 mg/dl), after 6 wk of treatment. It is questionable whether such reductions would be of clinical importance in decreasing the risk of heart disease.
In conclusion, PE supplementation at 150 mg/d for 6 months did not significantly change lipid or lipoprotein concentrations in moderately hypercholesterolemic postmenopausal women. Collectively, these results along with previously published data (8–11) strongly suggest that PE are not the responsible agent for the putative hypocholesterolemic effect of soy protein. Moreover, it is unlikely that supplementation would effectively lower CAD risk factors associated with hypercholesterolemia in postmenopausal women. The mechanism for the reputed cholesterol-lowering effect of soy remains to be established, and its importance with respect to the risk for CAD in this population may need to be further evaluated.
We gratefully acknowledge Drs. Robert Marcus, Gail Butterfield (deceased), and Gene Spiller and Ms. Rosemary Schmele for providing the serum samples and for their invaluable assistance in the completion of this study.
This work was supported in part by a small research grant from the College of Applied Sciences and Arts at San Jose State University and a research award from the Circle of Friends/Department of Nutrition and Food Science of San Jose State University.
Abbreviations:
- CAD,
Coronary artery disease;
- HDL,
high density lipoprotein;
- LDL,
low density lipoprotein;
- PE,
phytoestrogen.
DHEW
Food and Drug Administration
