


Vitamin D is known to influence muscle health. A reduction in muscle mass increases the risk of functional limitations among older individuals.
The aim of this study was to examine the relationship between vitamin D status and functional limitations.
Two independent cohorts of the Longitudinal Aging Study Amsterdam were used. Participants were aged 65 to 88 years (older cohort, n = 1237; baseline 1995) and 55 to 65 years (younger cohort, n = 725; baseline 2002).
Questions on the ability and degree of difficulty to perform 6 functions of daily life were asked.
Of the participants, 56% in the older cohort and 30% in the younger cohort had ≥1 limitation. Vitamin D deficiency (25-hydroxyvitamin D level of <20 ng/mL) compared with the value in the reference group (>30 ng/mL) was related to the presence of functional limitations at baseline (odds ratio [OR] = 1.7; 95% confidence interval [CI], 1.2–2.5 and OR = 2.2; 95% CI 1.3–3.7 for the older and younger cohorts, respectively). In the older cohort, vitamin D deficiency was associated with an increase in limitations at 3 years (OR = 2.0; 95% CI, 1.1–3.5), whereas vitamin D deficiency in the younger cohort was associated with an increase in limitations at 6 years (OR = 3.3; 95% CI, 1.1–10.1). Analyses were adjusted for confounders.
Vitamin D status is associated with functional limitations cross-sectionally and longitudinally in individuals aged 55 to 65 years and those 65 years and older. The possible association of vitamin D with functional limitations is present after a shorter follow-up time in the oldest age group compared with the younger age group.
Vitamin D has been shown to be positively related to muscle mass and strength and physical performance (1–3). In the last few years, the results of many studies on the association of vitamin D status and physical performance became available. Earlier studies in our cohort showed that vitamin D status is associated with physical performance and its decline in older individuals (3, 4). Vitamin D may influence physical function in 2 ways (5): indirectly through the possible influence on the onset of many chronic conditions, which may cause functional decline, and directly via its role in muscle function (2, 5). Sarcopenia, defined as the loss of muscle mass, has been found to be associated with a higher number of functional limitations and their earlier onset (6, 7) and lower physical performance (8).
Self-reported functional limitations are, in addition to physical performance tests, a measure of physical functioning (9). Whereas physical performance tests give little information about the reality of the individual's functioning in daily life because of the experimental setting, self-reported functional limitations are hypothetical questions about the presumed abilities in daily life (9). Therefore, more aspects may influence this relationship, such as personal characteristics (10). Accordingly, both types of physical functioning complement each other, and, therefore, it is considered necessary to study both. However, knowledge of the association of vitamin D status and self-reported functional limitations is limited. The results of the few studies that examined this relationship cross-sectionally were contradictory (5, 11–14). The results were also contradictory when the association between vitamin D status and functional decline was analyzed (5, 15).
More studies on the association between vitamin D status and functional limitations are warranted because vitamin D deficiency is common in older individuals. Its prevalence is up to 90%, depending on the definition of deficiency used, country, age, lifestyle (16), and method used for the assessment of vitamin D status (17). In addition, functional limitations are a strong predictor of negative outcomes, such as nursing home admission, hospitalization, and mortality (18, 19).
The aims of this study were to determine whether vitamin D status was associated with functional limitations cross-sectionally and with an increase in number longitudinally. Second, we studied which of the individual items of the functional limitations was associated with vitamin D status. Two different age groups (65 years and older and 55–65 years) were analyzed. The analyses were performed using data from two independent cohorts from the Longitudinal Aging Study Amsterdam (LASA).
Materials and Methods
Study sample
Data for this study were collected in LASA, which is an ongoing cohort study of the Dutch older population. The sampling and data collection procedures are described elsewhere in detail (20, 21). In brief, LASA is based on an age- and sex-stratified random sample, drawn from population registries of 11 municipalities in 3 different regions in The Netherlands. At the start in 1992, 3107 participants were interviewed (aged 55 years and older, “the older cohort”). In 2002, an additional cohort of 1002 subjects (aged 55–65 years, “the younger cohort”) was recruited from the same sampling frame. The study was approved by the Medical Ethics Committee of the VU University Medical Center, and all participants gave informed consent.
For this study, the second, third, and fourth measurement cycles of the older cohort (1995/1996, 1998/1999, and 2001/2002) and the first, second, and third measurement cycles of the younger cohort (2002/2003, 2005/2006, and 2008/2009) were used. The recruitment and exclusion of the participants in the older cohort are shown in Figure 1. Persons who participated in the medical interview in 1995/1996, born in or before 1930 (aged 65 years and older as of January 1, 1996), were selected (n = 1509). The study sample consisted of 1237 individuals. Three years later, 1008 participants completed the questions on functional limitations and 6 years later these were 762 participants.
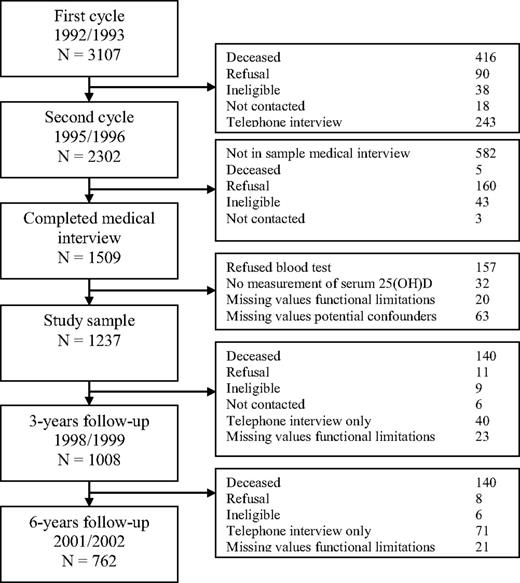
The recruitment and exclusion of the participants in the first (older) cohort of LASA.
The recruitment and exclusion of participants in the younger cohort is shown in Figure 2. In the younger cohort, 919 individuals participated in the medical interview. The study sample consisted of 725 participants. Three years later, 677 participants completed the questions on functional limitations and 6 years later these were 597 individuals.
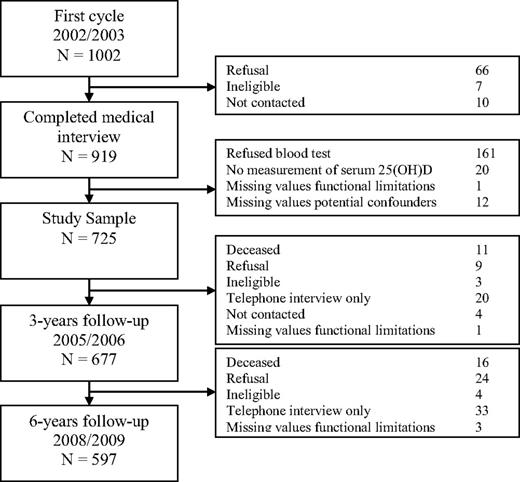
The recruitment and exclusion of the participants in the second (younger) cohort of LASA.
Serum 25-hydroxyvitamin D [25(OH)D]
In 1995/1996 and 2002/2003, morning blood samples were drawn. Subjects were allowed to take tea and toast but no dairy products. The samples were centrifuged and stored at −20°C until determination. Serum 25(OH)D was measured in 1997/1998 for the samples from 1995/1996 and in 2010/2011 for the samples from 2002/2003. For both analyses, a competitive binding protein assay was used (1997/1998: Nichols Diagnostics; 2010/2011: DiaSorin). The interassay coefficients of variation were 10% in both cohorts. The Nichols and DiaSorin assays were compared by measuring 117 samples (41 LASA participants and 76 samples measured for clinical purposes) with both methods. These analyses showed that levels of 10, 20, and 30 ng/mL measured with the Nichols device equaled 10.4, 19.3, and 28.2 ng/mL, respectively, when measured with the DiaSorin device. The correlation coefficient was r = 0.94. For this study, the original values were used.
Functional limitations
Functional limitations were assessed with an interviewer-administered questionnaire, adapted from the Organization for Economic Cooperation and Development (OECD) questionnaire, which was translated to Dutch and validated by Statistics Netherlands (22). Questions on the ability and degree of difficulty to perform the following functions of daily life were asked: to walk up and down a staircase of 15 steps without resting, to dress and undress oneself, to sit down and stand up from a chair, to cut one's toenails, to walk outside during 5 minutes without resting and to use one's own or public transportation. A limitation in an activity was defined as having any difficulty with or not being able to perform the specific activity. The number of limitations were summed to a total score and ranged from 0 (no limitations) to 6 (limitations on all functions). An increase in number of functional limitations during follow-up was defined as having at least 2 more limitations compared with baseline. The cut-off point of 2 more limitations was chosen because this is approximately 1 SD of the score at baseline in the older cohort (SD = 1.7), and in the younger cohort the SD was also more than 1 (SD = 1.3).
Potential effect modifiers
Age and sex were examined as potential effect modifiers. Vitamin D deficiency is more common in older individuals (16) and the prevalence of functional limitations is increasing with advancing age (23). We hypothesized that vitamin D has more influence on the increase of functional limitations in older than in younger persons (3).
Potential confounders
The following parameters were considered as potential confounders: age, sex, number of chronic diseases, physical activity, smoking, alcohol consumption, level of education, degree of urbanization, season of blood collection, serum creatinine, body mass index (BMI), and multivitamin use. Data on age and sex were derived from population registries. The number of chronic diseases was based on self-report; questions were asked on 7 major chronic diseases: chronic obstructive pulmonary disease, cardiac disease, stroke, peripheral arterial disease, diabetes mellitus, cancer, and rheumatoid arthritis/osteoarthritis. Physical activity in minutes per day was assessed using the LASA Physical Activity Questionnaire, which is a validated interviewer-administered questionnaire about the duration and frequency of activities during the past 2 weeks (24). Smoking status (never, former, and current smoker) and alcohol consumption (none, light, moderate, and [very] excessive drinker) were based on self-report. The classification of alcohol consumption was based on the number of days alcohol was consumed and the number drinks per time (25). The level of education was converted into years of education and subsequently divided into 3 categories: low (≤9 years), intermediate (10–12 years), and high level (>12 years). The degree of urbanization was assessed using the classification of Statistics Netherlands, which recodes the postal codes of The Netherlands into 5 categories based on the number of addresses per square kilometer (3). The season of blood collection was dichotomized into summer (April–September) and winter (October–March). Serum creatinine was measured with the Hitachi 747 analyzer. BMI was calculated as measured weight in kilograms divided by measured height in square meters. Multivitamin use was only assessed in the older cohort by asking a question on the use of over-the-counter vitamin tablets.
Statistical analysis
Serum 25(OH)D was divided into 3 groups: <20, 20–30, and >30 ng/mL (<50, 50–75, and >75 mmol/L). The latter served as the reference category for all analyses. In The Netherlands, the advised minimum level of serum 25(OH)D for older persons is 20 ng/mL, also according to the guidelines of the Institute of Medicine (26). The level of 30 ng/mL is the required level according to the guidelines of The Endocrine Society (27).
Multiple logistic regression analyses were used to determine associations of vitamin D status with having functional limitations (yes/no), with the presence of different items of the total functional limitation score, and with an increase of at least 2 functional limitations during the 3- and 6-year follow-up. To assess associations with number of functional limitations cross-sectionally, ordinal logistic regression analysis was used. The assumptions of ordinal logistic regression analysis were tested by the test of parallel lines. To apply this test, the participants were divided in 5 groups: no limitations and the 4 quartiles of the participants with limitations.
All associations with continuous variables were tested for linearity. Only BMI had a nonlinear relationship with functional limitations, and we divided BMI into 3 categories: low weight (BMI < 20 kg/m2), normal weight (20 kg/m2 ≤ BMI < 25 kg/m2), and overweight (BMI ≥ 25 kg/m2). To check for confounding, all potential confounders were added separately to the univariable model. Parameters that changed the regression coefficient at least 10% were added to the models. To test for interaction, a value of P < .1 was considered significant. For all other tests, a value of P < .05 was considered significant. Sensitivity analyses were performed in the older cohort by adding multivitamin use to all models, because data on vitamin D use were not available.
All analyses were performed using SPSS version 18.0 for Windows (SPSS, Inc).
Results
The baseline characteristics of both study cohorts are shown in Table 1. The mean (SD) ages of the participants in the older and younger cohort were 75.3 (6.5) and 60.0 (3.0) years. The mean (SD) serum 25(OH)D levels were 21.6 (9.7) and 22.7 (8.1) ng/mL, respectively. Of the participants in the older and younger cohorts, 56.0 and 30.1% had 1 or more functional limitations at baseline. An increase in number (defined as ≥2 more than at baseline) was observed in 15% of the older and in 6% of the younger cohort after 3 years and 20% and 8%, respectively, after 6 years. Participants with limitations at baseline were more likely to drop out during both the 3- and 6-year follow-up in the older cohort (P < .001), but this was not observed in the younger cohort (P = .07 and P = .113).
Baseline Characteristics
| Older Cohort, 1995/1996 | Younger Cohort, 2002/2003 | |||||||
|---|---|---|---|---|---|---|---|---|
| <20 ng/mL | 20–30 ng/mL | ≥30 ng/mL | P | <20 ng/mL | 20–30 ng/mL | ≥30 ng/mL | P | |
| n | 589 | 422 | 226 | 294 | 305 | 126 | ||
| Sex, % men | 39.2 | 53.3 | 64.2 | <.01 | 45.9 | 48.9 | 39.7 | .22 |
| Age, y | 77.6 ± 6.6 | 74.0 ± 5.9 | 72.1 ± 5.3 | <.01 | 60.0 ± 3.1 | 60.2 ± 2.9 | 59.6 ± 2.9 | .15 |
| Functional limitations, n | 1 (0–3) | 0 (0–2) | 0 (0–1) | <.01 | 0 (0–1) | 0 (0–0) | 0 (0–1) | <.01 |
| ≥1 limitation, % | 67.6 | 49.1 | 38.9 | <.01 | 38.8 | 23.6 | 25.4 | <.01 |
| No. of chronic diseasesa | 1 (1–2) | 1 (0–2) | 1 (0–2) | <.01 | 1.0 (0–1) | 1.0 (0–1) | 1.0 (0–1) | .48 |
| Creatinine, μmol/L | 93.8 ± 32.1 | 93.5 ± 20.5 | 96.8 ± 20.8 | .27 | 87.6 ± 14.3 | 92.7 ± 17.1 | 92.4 ± 35.0 | .01 |
| Physical activity, min/d | 124 (71–195) | 145 (87–210) | 143 (76–211) | .01 | 141 (86–216) | 140 (89–221) | 153 (94–226) | .56 |
| Level of education, % | ||||||||
| Low (≤9 y) | 64.0 | 60.0 | 54.4 | .01 | 45.9 | 40.3 | 48.4 | .01 |
| Intermediate (10–12 y) | 23.4 | 31.0 | 30.1 | 29.9 | 40.3 | 38.9 | ||
| High (>12 y) | 12.6 | 9.0 | 15.5 | 24.1 | 19.3 | 12.7 | ||
| Degree of urbanization | ||||||||
| No. of addresses/km2, % | ||||||||
| Rural (<500) | 20.7 | 20.4 | 30.1 | <.01 | 13.3 | 19.0 | 21.4 | .08 |
| Low (500–1000) | 18.0 | 23.0 | 23.9 | 32.3 | 28.5 | 39.7 | ||
| Moderate (1000–1500) | 13.4 | 14.0 | 14.6 | 13.3 | 12.5 | 10.3 | ||
| High (1500–2500) | 17.7 | 18.0 | 17.3 | 20.1 | 21.0 | 17.5 | ||
| Very high (>2500) | 30.2 | 24.6 | 14.2 | 21.1 | 19.0 | 11.1 | ||
| Season of blood collection, % winter | 60.4 | 50.2 | 46.5 | <.01 | 74.5 | 68.5 | 66.7 | .16 |
| BMI, % | ||||||||
| <20 kg/m2 | 4.9 | 2.6 | 2.7 | <.01 | 2.7 | 1.0 | 1.6 | .41 |
| 20–25 kg/m2 | 25.8 | 29.6 | 43.8 | 26.9 | 31.5 | 7.8 | ||
| ≥25 kg/m2 | 69.3 | 67.8 | 53.5 | 70.4 | 67.5 | 70.6 | ||
Differences in means were tested using 1-way ANOVA, differences in medians were tested using the Kruskal-Wallis H test, and differences in frequencies were tested using the Pearson χ2 test. To convert serum 25(OH)D values from nanograms per milliliter to nanomoles per liter, multiply by 2.496. Data are means ± SD or medians (interquartile range).
Number of chronic diseases from 7 major diseases: chronic obstructive pulmonary disease, cardiac disease, peripheral arterial disease, diabetes mellitus, stroke, cancer, and rheumatoid arthritis/osteoarthritis.
Age and sex did not significantly modify the associations between serum 25(OH)D and functional status (P > .1). Relevant confounders were age, sex, BMI, number of chronic diseases, level of education, and level of urbanization. Nonrelevant confounders, ie, physical activity, smoking, alcohol consumption, and serum creatinine, were not included in the final models. Table 2 shows the results of the cross-sectional analysis. In the older and younger cohorts, participants with serum 25(OH)D levels of <20 ng/mL had 1.7 (95% confidence interval [CI], 1.2–2.5) and 2.1 (95% CI, 1.2–3.5) times higher odds for having at least 1 functional limitation than participants with serum 25(OH)D levels of ≥30 ng/mL, after adjustment for confounders. The results of ordinal logistic regression analysis showed that vitamin D status was also associated with the number of functional limitations cross-sectionally. In the fully adjusted models, participants in the older cohort with serum 25(OH)D levels of <20 ng/mL had a 1.6 (95% CI, 1.2–2.3) times higher odds for having 1 more functional limitation than participants in the reference category (≥30 ng/mL). In the younger cohort, this odds ratio (OR) was 1.9 (95% CI, 1.2–3.0). Figure 3 shows the percentages of participants in each vitamin D category according to the number of limitations at baseline. This figure shows that persons in the highest category of serum 25(OH)D were less likely to have 1 or more limitations compared with those in the 2 other categories. These differences in proportions were statistically significant (P < .001 for the older cohort and P = .002 for the younger cohort). The results of cross-sectional logistic regression analyses that aimed to assess which of the different functional items was associated with vitamin D status showed that vitamin D status was associated with limitations in walking stairs (fully adjusted OR = 1.8; 95% CI, 1.2–2.8; P = .007), cutting toenails (fully adjusted OR = 1.5; 95% CI, 1.0–2.2; P = .037), and walking outside (fully adjusted OR = 2.1; 95% CI, 1.2–3.7; P = .012). In the younger cohort, fewer participants had limitations, and, therefore, the statistical power was insufficient to analyze the functional limitations separately.
ORs for One or More Functional Limitations According to Different Vitamin D Status (Cross-Sectional Analysis)
| Serum 25(OH)D | Older Cohort (n = 1237, Aged 65 y and Older) | Younger Cohort (n = 725, Aged 55–65 y) | ||
|---|---|---|---|---|
| Model 1 | Model 2 | Model 1 | Model 2 | |
| <20 ng/mL | 1.9 (1.3–2.6)a | 1.7 (1.2–2.5)b | 1.9 (1.2–3.0)c | 2.1 (1.2–3.5)c |
| 20–30 ng/mL | 1.2 (0.9–1.7) | 1.1 (0.8–1.6) | 0.9 (0.6–1.5) | 1.0 (0.6–1.7) |
| ≥30 ng/mL (reference group) | 1.0 | 1.0 | 1.0 | 1.0 |
Data represent ORs (95% CI). Model 1 was adjusted for age and sex. Model 2 was adjusted for age, sex, BMI, chronic diseases, level of education, and level of urbanization. Other confounders did not change the observed associations.
P < .001.
P < .05.
P < .01.
Table 3 shows the results of the longitudinal logistic regression analyses for the association between vitamin D status and an increase in functional limitations after 3 and 6 years. In the older cohort (individuals aged 65 years and older), serum 25(OH)D levels of <20 ng/mL were associated with an increase in functional limitations after 3 years: OR = 2.0 (95% CI, 1.1–3.5) compared with that of the reference group, but not after 6 years. In the younger cohort, the association was significant (OR = 3.3; 95% CI, 1.1–10.1) after 6 years of follow-up only. Adding multivitamin use to the fully adjusted models in the older cohort did not change any of the results. Adding season of blood collection to the models did not change the results (data not shown).
ORs for an Increase in Number of Functional Limitations (at Least 2 More) in 3 and 6 Years According to Different Vitamin D Status
| Serum 25(OH)D | Older Cohort (n = 1237, Aged 65 y and Older at Baseline) | Younger Cohort (n = 725, Aged 55–65 y at Baseline) | ||||||
|---|---|---|---|---|---|---|---|---|
| 3-y Follow-Up (n = 1008) | 6-y Follow-Up (n = 762) | 3-y Follow-Up (n = 725) | 6-y Follow-Up (n = 677) | |||||
| Model 1 | Model 2 | Model 1 | Model 2 | Model 1 | Model 2 | Model 1 | Model 2 | |
| <20 ng/mL | 2.4 (1.4–4.2)a | 2.0 (1.1 − 3.5)b | 1.1 (0.7–1.6) | 0.9 (0.6–1.4) | 0.8 (0.4–1.9) | 0.8 (0.3–1.8) | 3.5 (1.2–10.4)b | 3.3 (1.1–10.1)b |
| 20–30 ng/mL | 2.1 (1.2–3.7)a | 1.9 (1.1–3.4)b | 1.1 (0.7–1.6) | 1.0 (0.6–1.5) | 0.7 (0.3–1.5) | 0.7 (0.3–1.5) | 2.7 (0.9–7.9) | 2.9 (1.0–8.9) |
| ≥30 ng/mL (reference group) | 1.0 | 1.0 | 1.0 | 1.0 | 1.0 | 1.0 | 1.0 | 1.0 |
Data represent ORs (95% CI). Model 1 was adjusted for age and sex. Model 2 was adjusted for age, sex, BMI, chronic diseases, level of education, and level of urbanization. Other confounders did not change the observed associations.
P < .01.
P < .05.
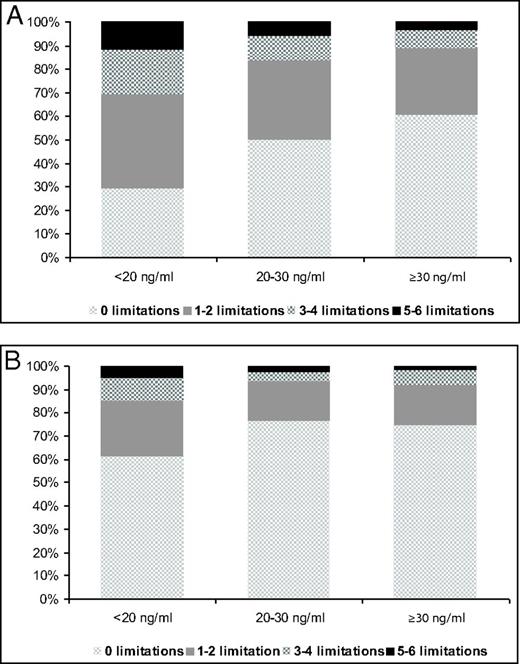
Prevalence of functional limitations according different vitamin D status. Differences in proportions were tested using the Pearson χ2 test. A, Older cohort, 1995/1996 (P < .001). B, Younger cohort, 2002/2003 (P = .002).
Discussion
This study shows that vitamin D deficiency [defined as a serum 25(OH)D level of <20 ng/mL] is associated with the presence of functional limitations and with a higher number of functional limitations cross-sectionally in the age groups of 55 to 65 years and 65 years and older. In longitudinal analyses, vitamin D deficiency was associated with an increase of at least 2 limitations in 3 years in individuals of 65 years and older and in 6 years in individuals of 55 to 65 years.
Previous research on the association between vitamin D status and functional limitations is scarce and not conclusive. The results of the Cardiovascular Health Study also showed that serum 25(OH)D levels of <20 ng/mL were associated with limitations in activities of daily living (ADL) and mobility limitations in community dwelling adults aged 77 to 100 years (5). In contrast, an Italian study found no difference in functional problems between groups with low (≤15 ng/mL) and high (>15 ng/mL) levels of serum 25(OH)D (14). This study was conducted in individuals aged 68 to 75 years, but these subjects were relatively healthy compared with the general population because persons with chronic conditions were excluded and cognition had to be adequate. In addition, the small sample size of 269 participants may contribute to the lack of significance (14). Other cross-sectional studies examined whether functional limitations were a determinant of low serum 25(OH)D levels (12, 13). In these studies, higher levels of disability were associated with lower levels of serum 25(OH)D. These associations may be caused by a different mechanism. The mechanism of action in our study may be the positive influence of vitamin D on muscles, and a poor vitamin D status may cause functional limitations (1, 2). However, the previously found associations may be caused by, for example, less sunshine exposure due to mobility limitations (28). Vitamin D may influence muscle strength through genomic and nongenomic pathways. It has been known that vitamin D receptors exist on muscle cells. By binding to this receptor more than 300 genes can be activated. The active metabolite, 1,25-dihydroxyvitamin D, may influence muscle fiber proliferation and differentiation (29, 30). Although the current study is not designed to determine the direction of the relationship, the results of the longitudinal analyses, the known presence of vitamin D receptors on muscle cells (2), and the positive effects of vitamin D supplementation on muscle function (31) at least suggest a potential positive effect of vitamin D on functional performance. Further studies are necessary to draw definite conclusions on the direction of the relationship.
This study also revealed that poor vitamin D status is related to a higher number of functional limitations cross-sectionally. One study using data from the Women's Health and Aging Study I and II showed that the percentage of people with serum 25(OH)D levels of ≤10 ng/mL was lower in the groups with fewer domains of functions affected and that the mean serum 25(OH)D level drops when the number of affected domains was higher (13). Although in this previous study, the number of affected domains of function was treated as being determinant of serum 25(OH)D, the results were similar to those of our study. In addition, our study showed that most participants in the 2 highest serum 25(OH)D groups (>20 ng/mL) of the older cohort had zero limitations compared with the participants in the lowest serum 25(OH)D group (<20 ng/mL) in which nearly 70% had 1 or more limitations. From the category of 2 limitations, the highest percentages are found in the lowest vitamin D category in the older cohort. This was in contrast to the younger cohort, in which at least 1 limitation was already more prevalent in the lowest vitamin D group. Participants in that cohort were younger and had fewer limitations overall. This may explain the differences between both cohorts.
The results of the longitudinal logistic regression analyses showed that a significant association was found for 3 years follow-up and not for the 6 years follow-up in the older cohort. The lack of an association after 6 years may be explained by the long follow-up period in this cohort of individuals with a mean age of 75 years. Hence, other aspects may influence functional decline, such as normal aging and chronic diseases. As a consequence, vitamin D alone might not be discriminative anymore. In the younger cohort, we only found statistically significant results in logistic regression analyses after 6 years. This difference may be explained by the fact that only 7% of the participants in the younger cohort were classified with an increase in number of limitations after 3 years compared with 19% in the older cohort. Participants in the younger cohort were younger, and, therefore, they may have had more skills to compensate for an increase in number of limitations due to low vitamin D status in the first 3 years. Our results are in line with a study in US individuals aged 77 to 100 years (5), in which low vitamin D was associated with the onset of mobility limitations, and in contrast to the findings of another study, but in the latter study only moderately to severely disabled women of 65 years and older were included (15). In the older cohort, a higher number of participants with limitations were lost to follow-up compared with participants without limitations. This may have led to an underestimation of the observed associations.
The results of the present study are in line with the results of most studies on vitamin D status and physical performance, in which low vitamin D status was associated with low physical performance and its decline in individuals aged 65 years and older (3, 5, 32). Previous research showed that physical performance is associated with the ability to perform ADL, eg, walking, eating, arising, and dressing (33). To perform ADL and to do well on the physical performance tests, the muscles need to be in good condition. During the aging process, muscles lose mass and strength (34). In addition, vitamin D has been found to influence muscle strength and muscle mass (2). Therefore, vitamin D status could be linked to physical performance as well as functional limitations. However, when all limitations were analyzed separately, no association between vitamin D status and limitations in chair rising was found in contrast to the association between vitamin D status and the chair stands test, previously found in the same cohort (3). The difference between the ability to do an activity (chair stands test) and individual's perception of his or her abilities (self-reported limitations in chair rising) may contribute to these contradictory results (9). Furthermore, the ability to rise from a chair is not the same as the velocity that is measured in the chair stand test.
This study has limitations. First, vitamin D status was only assessed once in most of the participants, and, therefore, it was not possible to study whether a change in vitamin D status was associated with a change in functional limitations. Definite conclusions on the direction of relationships could not be made based on this study. Furthermore, information on diet and over-the-counter vitamin D supplements use was not available. However, after addition of multivitamin use to the models, the results were similar. Last, because most individuals had to come to the hospital for blood sampling, these cohorts are relatively healthy. Therefore, our conclusions cannot be generalized to more frail populations. The main strengths of this study are the 2 large independent population-based study samples, its prospective design, its repeated assessments of functional limitations over time, and the different age groups.
In conclusion, vitamin D status is associated with functional limitations cross-sectionally and longitudinally in individuals aged 55 to 65 years and 65 years and older. However, the possible association of vitamin D with functional limitations is present after a shorter follow-up time in the oldest age group than in the younger age group. Because functional limitations are a predictor of adverse outcomes, further research is necessary to explore underlying mechanisms and the potential benefits of vitamin D supplements on functional status.
Acknowledgments
We acknowledge our colleagues from the laboratories of the VU University Medical Center in Amsterdam, Isala Klinieken (Weezenland) in Zwolle, and Ziekenhuis Bernhoven in Oss and Veghel and the team and participants in LASA.
This study was funded in part by The Netherlands Organization for Health Research and Development (ZonMw). LASA is largely supported by a grant from the Netherlands Ministry of Health, Welfare and Sports, Directorate of Long-Term Care. The serum 25(OH)D measurements were partly funded by Merck & Co.
Disclosure Summary: The authors have nothing to disclose.
Abbreviations
- ADL
activities of daily living
- CI
confidence interval
- 25(OH)D
25-hydroxyvitamin D
- LASA
Longitudinal Aging Study Amsterdam
- OR
odds ratio.
References
