


Introduction
As is the case in the majority of psychiatric disorders as well as other complex behavioral traits, the etiology of social anxiety disorder (SAD) can be attributed to the interplay between genetic and environmental risk factors [Reference Scaini, Belotti and Ogliari1]. SAD typically starts with social anxiety symptoms (SAS) during late-childhood and mid-adolescence, a period characterized by an increase in environmental complexity. Once present, SAS can lead to a variety of maladjustments such as poor social functioning, an overall reduction in life quality, and physical health complications [Reference Ooi, Nocita, Coplan, Zhu and Rose-Krasnor2–Reference Sackl-Pammer, Özlü-Erkilic, Jahn, Karwautz, Pollak and Ohmann4]. Furthermore, it has been shown that anxiety symptoms occurring in childhood and adolescence have a strong persistence over time [Reference Bittner, Egger, Erkanli, Jane Costello, Foley and Angold5–Reference Stein, Scott, de Jonge and Kessler7] and are associated with a poorer treatment outcome [Reference Dalrymple, Herbert and Gaudiano8,Reference Dalrymple and Zimmerman9]. This highlights the need for early SAS identification [Reference DeWit, Ogborne, Offord and MacDonald10]. Therefore, new insights into the development and risk factors of SAS are of great importance.
Previous research has shown that parenting practices can be divided into dimensions that are differentially linked to behavior acting as a promotive or risk factor for development of mental health problems including anxiety in adolescents [Reference Olofsdotter, Åslund, Furmark, Comasco and Nilsson11,Reference Waite, Whittington and Creswell12]. It was also shown that an adverse family environment and parenting are associated with the etiology of SAS [Reference Oppenheimer, Ladouceur, Waller, Ryan, Allen and Sheeber13,Reference Bynion, Blumenthal, Bilsky, Cloutier and Leen-Feldner14]. Specifically, abusive and overcontrolling parental behavior are linked to higher levels of SAS both in a sample from the general population and in clinical SAD outpatients [Reference Bandelow, Torrente, Wedekind, Broocks, Hajak and Rüther15–Reference Gulley, Oppenheimer and Hankin17]. These negative parenting practices have been hypothesized to reduce the child’s opportunity to learn the skills required for good socialization and thereby increase anxiety symptoms and social withdrawal. Furthermore, exposure to such parent-driven chronic adversities have a negative impact on the stress response system’s functioning, resulting in sensitization to stressors that facilitate SAS [Reference Belsky and Pluess18,Reference Lipscomb, Becker, Laurent, Neiderhiser, Shaw and Natsuaki19]. Therefore, parenting and the family environment play an important role in the development of SAS among youth.
Another important etiological aspect of SAS development is rooted in genetics. A variety of twin studies have shown that SAS has a heritable basis [Reference Scaini, Belotti and Ogliari1,Reference Burt20]. SAD heritability rates are estimated to be between 13 and 76% (for a detailed review, please see Moreno et al. [Reference Gulley, Oppenheimer and Hankin17]). However, the variance associated with both genetic and environmental factors varies widely between studies [Reference Lewis-Morrarty, Degnan, Chronis-Tuscano, Rubin, Cheah and Pine16,Reference Gulley, Oppenheimer and Hankin17]. This variability seems to originate from the high heterogeneity of twin cohorts. For example, the variance associated with genetic factors has been found higher in children and adolescents compared to adults [Reference Scaini, Belotti and Ogliari1,Reference Lewis-Morrarty, Degnan, Chronis-Tuscano, Rubin, Cheah and Pine16]. These results suggest that genetic and environmental factors might have a different impact throughout development, stressing the importance of investigating their influence over time. However, to date, the literature aimed at improving our understanding of the genetic basis of SAS and SAD remains limited.
The first insights into the genetic architecture of SAD vulnerability came from candidate gene (CG) studies and two genome-wide association studies (GWASs). In the study of Trzaskowsk et al. [Reference Moreno, De Lima Osório, Martín-Santos and Crippa21] on anxiety traits in 2,810 seven-year-old children, no single nucleotide polymorphism (SNP) reached the genome wide threshold for significance, and the SNPs that showed the lowest p values with relation to social anxiety traits (rs2772129 and rs2922037) could not be replicated in another similar cohort of 4,804 children. More promising were the findings of an even larger GWAS on anxiety traits by Stein et al. [Reference Belsky and Pluess18], who reported two SNPs that were significantly associated with social anxiety (rs78924501 on Chr 1 in African American and rs708012 on Chr 6 in European American samples). Still, the data from these studies explain only a very small proportion of SAS’s heritability.
One of the reasons for the relative lack of success of GWAS may be related to the lack of sufficient power when applying standard corrections for multiple testing. In addition, the above mentioned GWAS only investigated main effects and did not take into account environmental risk factors. This can lead to an oversimplification of the multidimensional etiology of such complex symptoms. As a result, some SNPs that are in fact associated with the trait might not be identified [Reference Trzaskowski, Eley, Davis, Doherty, Hanscombe and Meaburn22,Reference Stein, Chen, Jain, Jensen, He and Heeringa23]. However, such SNPs might be detected once relevant environmental factors and additional effects of age and gender are taken into consideration, which can be achieved through a gene—environment interaction (G × E) approach [Reference Hill, Goddard and Visscher24]. Contrary to CG and GWAS, the main focus of G × E studies is on the interaction effects between genetic variants and environmental factors. Within this framework, it is assumed that the risk of developing the disease is increased when people with susceptible genotypes are exposed to adverse environmental conditions [Reference Hill and Mulder25]. In addition, factors such as age and gender are typically also taken into account. However, to date, G × E studies in the field of social anxiety have investigated only a very limited number of genes, mainly within the oxytocin and serotonin neurotransmission systems [Reference Rosenman, Tennekoon and Hill26–Reference Sullivan28].
In this study, we investigate how 274 genes involved in nine neurotransmission systems (serotonin, dopamine, hypothalamic pituitary adrenal [HPA] axis, oxytocin, GABA, glutamate, choline, noradrenergic, and the clock pathway) and perceived parenting behaviors (as environmental exposures) interact in explaining SAS during adolescence. Such hypothesis-driven preselection of biologically relevant genes allows us to incorporate biological knowledge into G × E analyses and helps to increase statistical power (by reducing the effect of multiple test corrections), which is important for relatively smaller sample sizes [Reference Keller29]. Genes were selected based on their involvement in neurotransmitter-related functional protein networks. It was shown that highly complex behaviors can arise from a restricted set of gene families, by a tightly regulated interaction network of proteins encoded by these genes [Reference Franceschini, Szklarczyk, Frankild, Kuhn, Simonovic and Roth30]. The functional networks are constructed based on the proteins’ direct physical and their indirect functional interactions, such as catalysis of subsequent reactions in a metabolic pathway and ability to regulate each other transcriptionally or posttranscriptionally [Reference Franceschini, Szklarczyk, Frankild, Kuhn, Simonovic and Roth30,Reference Lee, Blom, Wang, Shim and Marcotte31]. To study these G × E interactions, we have used a statistical approach based on Brown’s method [Reference Schneider-Hassloff, Straube, Jansen, Nuscheler, Wemken and Witt32,Reference Van Heel, Bijttebier, Claes, Colpin, Goossens and Van Den Noortgate33], which allows preserving power by taking genes, rather than SNPs, as the main unit of analysis.
Methods
Participants
All participants were part of the STRATEGIES cohort (i.e., Studying Transactions in Adolescence: Testing Genes in Interaction with Environments), a population-based study on the development of problem behaviors in adolescence. After active written informed consent was provided, participants were asked to fill out questionnaires and to provide a saliva sample for further genotyping. The STRATEGIES cohort consists of 1,111 adolescents with genetic information available for 1,103 participants. In this study, only participants of Caucasian origin and with available data on social anxiety and perceived parenting were included. In addition, if two siblings participated, only one child per family was randomly selected, which resulted in a final sample of 948 adolescents (mean age = 13.78 [standard deviation, SD = 0.92]; 50.5% boys).
Social anxiety and perceived parenting
SAS were assessed using the self-reported Dutch version of the Social Anxiety Scale for Adolescents (SAS-A) [Reference Van Assche, Moons, Cinar, Viechtbauer, Oldehinkel and Van Leeuwen34], a 12-item short version of the SAS-A [Reference Brown35]. A mean score was calculated, with higher scores indicating greater levels of SAS.
Perceived parenting, as reported by adolescents, was measured via the Leuven Adolescent Perceived Parenting Scale [Reference Nelemans, Meeus, Branje, Van Leeuwen, Colpin and Verschueren36] and Parental Behavior Scale–Short [Reference La Greca and Lopez37]. All items were rated by adolescents on a 5-point scale ranging from 1 = (almost) never to 5 = (almost) always. Based on the abovementioned parenting scales, we computed five parenting dimensions (support, proactive control, psychological control, punitive control, and harsh punitive [HP] control) by grouping items and calculating mean scores as described in Janssens et al. [Reference Delhaye, Beyers, Klimstra, Linkowski and Goossens38]. These parenting dimensions represent particular features of parenting that are hypothesized to have an effect on developmental outcomes and child behavioral adjustment. In all subsequent analyses, these five parenting dimensions were used as indicators of the quality of the adolescents’ family environment. Descriptive statistics of the SAS-A and parenting dimensions are available in Table1. For a more comprehensive description regarding the STRATEGIES cohort, data collection, and perceived parenting measurements, we refer to previous publications by our group [Reference Delhaye, Beyers, Klimstra, Linkowski and Goossens38,Reference Wirtz and von Känel39].
Genetic information
In total, 5,052 SNPs in 344 genes involved in nine neurotransmitter pathways (serotonin, dopamine, the HPA-axis, oxytocin, GABA, glutamate, choline, noradrenergic neurotransmission, and the clock pathway) were genotyped.
The genotyping quality control was done based on the protocols of Anderson et al. [Reference Van Leeuwen, Vermulst, Kroes, De Meyer, Nguyen and Veerman40] and Purcell et al. [Reference Janssens, Goossens, Van Den Noortgate, Colpin, Verschueren and Van Leeuwen41]. In brief, SNPs with a call rate of less than 98% and/or a minor allele frequency of less than 1% were excluded. The population structure was checked and confirmed to be homogeneous via a principal component analysis, and all SNPs were in Hardy–Weinberg equilibrium. In the next step, the linkage disequilibrium (LD) matrices were calculated for all available SNPs (using PLINK v1.07). A more detailed description of the LD matrices, selected genes, and SNPs, and the applied quality control methods are available in our previous publication [Reference Schneider-Hassloff, Straube, Jansen, Nuscheler, Wemken and Witt32].
Statistical analysis
In brief, we first applied a linear regression model, in which we tested the interaction effects of each SNP (G) with each parenting dimension (E). Regression models were fitted for each of five parenting dimensions separately. As severe degrees of HP control were relatively rare in our data set—which resulted in a strong right skewness of this variable—we applied a sensitivity analysis, in which we distinguished between no presence of HP control and any presence.
All regression analyses were adjusted for the potentially confounding effects of gender and age, based on a recommendation by Keller [Reference Anderson, Pettersson, Clarke, Cardon, Morris and Zondervan42]. The output of the regression models (p value of G × E interactions) was taken for further analysis. Next, all SNPs in the output file were linked to their corresponding genes.
Since single SNPs within a specific gene are often in LD, the p values obtained from the interaction of these SNPs with environment are not independent either. To account for this, we applied a gene-based analysis using Brown’s method with adjustment for LD [Reference Van Heel, Bijttebier, Claes, Colpin, Goossens and Van Den Noortgate33]; we used poolr, a recently developed R package for pooling the results from (dependent) tests. The detailed description of Brown’s method for G × E analysis can be found in existing literature [Reference Schneider-Hassloff, Straube, Jansen, Nuscheler, Wemken and Witt32]. The gene-based analysis with Brown’s method allows us to calculate a unified p value per gene, which is adjusted for nonrandom association of SNPs, particularly the LD structure of the gene which is estimated based on the LD matrices. Only genes with two or more SNPs were selected for further analysis, which resulted in 274 genes. Bonferroni correction was applied based on the number of genes (adjusted p value = 1.8 × 10⁻⁴). When significant G × E interactions were found, a permutation test with 100,000 permutations was used to verify the validity of our findings [Reference Rutter43]. In addition to that, we calculated a genomic control (GC) coefficient to check for bias in the distribution of the test statistic [Reference Liu, Wang and Jiang44]. The analysis was done using R [Reference Purcell, Wray, Stone, Visscher, O’Donovan and Sullivan45].
Results
Significant gene-based interactions were present for one parenting dimension, that is, “HP control,” in interaction with two genes (the neuronal glutamate transporter excitatory amino acid carrier 1 (SLC1A1), p = 9.3 × 10⁻⁵, and the glutathione transferase zeta 1 (GSTZ1), p = 9.3 × 10⁻⁵; Figure 1A). Interactions with other parenting dimensions were not significant. More information regarding results for all parenting dimensions are available in the Supplementary Materials.
The GC showed strong inflation, with an inflation factor of λ = 1.5. The results of the permutation test for the GSTZ1 gene came close to significance, but without actually meeting the threshold (Figure 1B).
Table 1. Descriptive statistics of the sample and the main variables: SAS-A and the five parenting dimensions obtained via the Leuven Adolescent Perceived Parenting Scale and the Parental Behavior Scale–Short.

Abbreviations: SAS-A, Social Anxiety Scale for Adolescents; SD, standard deviation.

Figure 1. Manhattan plots of gene-based interactions of Harsh Punitive Control × 274 genes: (A) results of adjusted Brown’s method and (B) results of permutation test. Bonferroni correction: 1.8 × 10⁻⁴; each bar represents a gene. The dashed line represents the significance level after the Bonferroni correction.
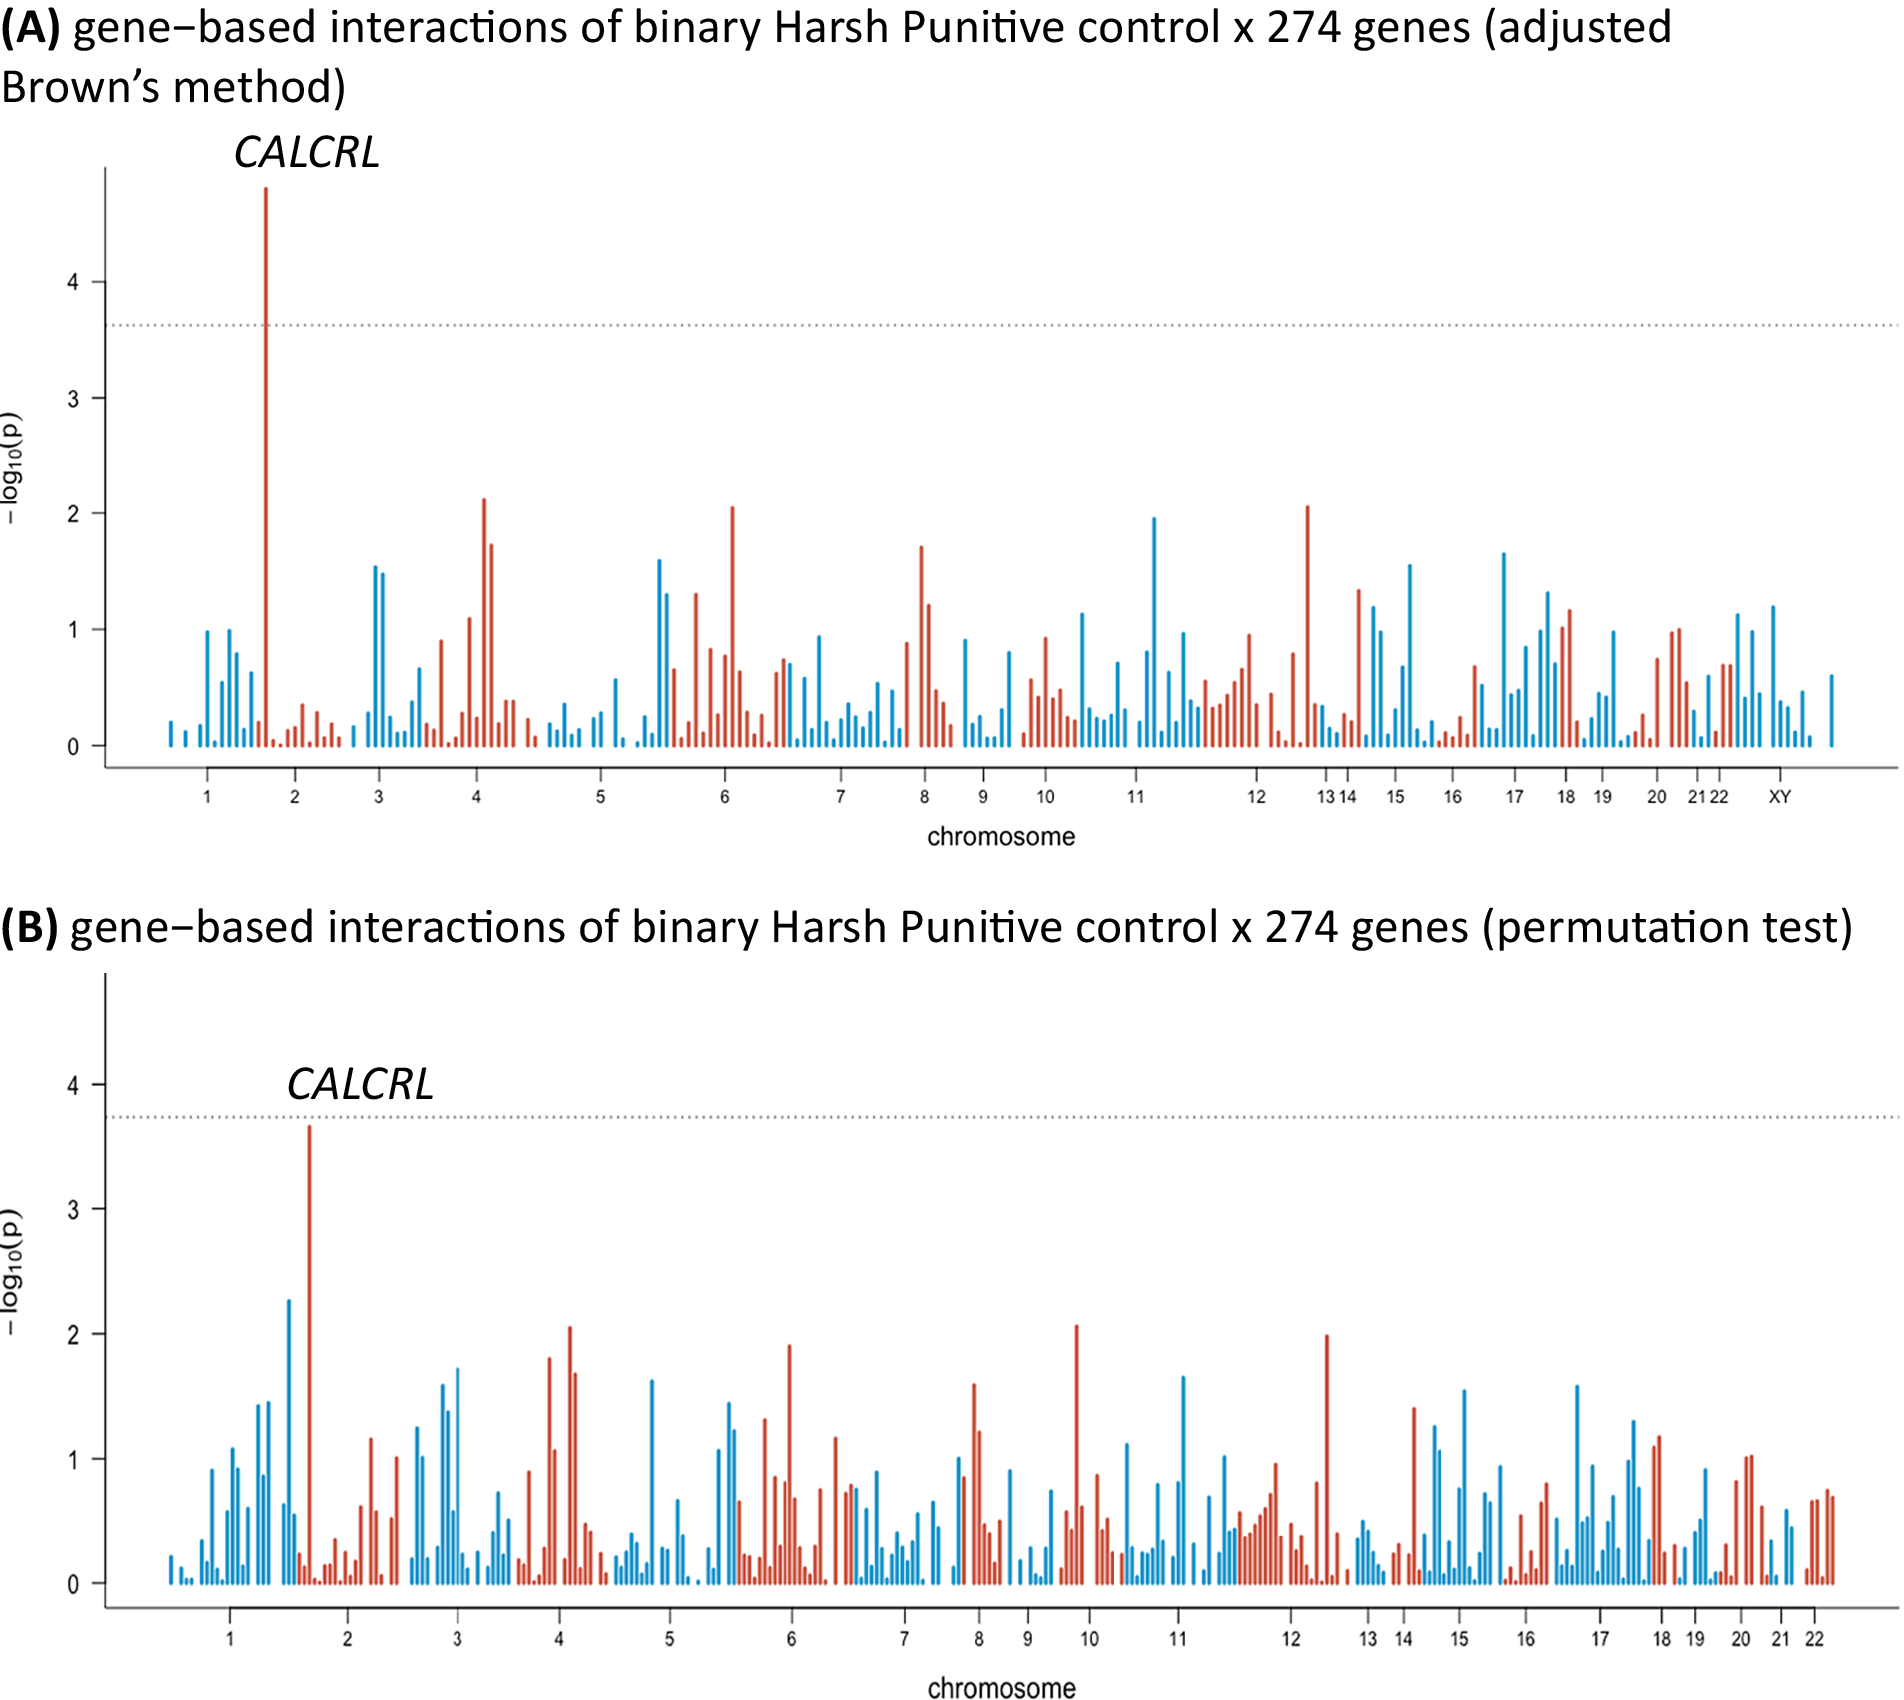
In the sensitivity analysis, we distinguished between no presence and any presence of HP control and repeated the analysis. We used median split to dichotomize HP control. One gene showed a significant interaction with HP control (the calcitonin receptor-like gene [CALCRL]; p value = 1.59 × 10⁻⁵; inflation factor λ = 1.05; Figure 2A). The permutation test came close to significance, but without reaching the threshold (Figure 2B). Interestingly, in the first analysis, the CALCRL gene was also close to significance (see Supplementary Materials).

Figure 2. Manhattan plots of gene-based interactions of binary Harsh Punitive Control × 274 genes: (A) results of adjusted Brown’s method and (B) results of permutation test. Bonferroni correction: 1.8 × 10⁻⁴; each bar represents a gene. The dashed line represents the significance level after the Bonferroni correction.
Discussion
Using the data from the STRATEGIES cohort of almost 1,000 Flemish adolescents, we have examined how genes and perceived parenting behavior as environmental exposure interact in association with SAS during adolescence. To study these gene–environment interactions, we have applied a gene-based analysis using Brown’s method with adjustment for LD that allows studying genetic information at the gene level by aggregating data from multiple SNPs within the same gene. This approach can help to uncover genes and biological pathways that interact with the environment during development. In our analysis, we included SNPs that belong to 274 genes involved in nine neurotransmission systems: serotonin, dopamine, HPA-axis, oxytocin, GABA, glutamate, choline, noradrenergic, and the clock pathway.
We found significant gene–environment interactions for only one parenting dimension (HP control). Two genes remained significant after we controlled for multiple testing: SLC1A1 and GSTZ1. However, the genomic inflation factor was high (λ = 1.5). The results of the permutation test, used to verify the accuracy of our interactions, showed that SLC1A1 or GSTZ were among the top significant genes, but neither reached significance after adjusting for Bonferroni correction (Figure 1B). The data were checked for population structure and familial relationships, and these were therefore excluded as possible reasons for increased genomic inflation. Given the skewness of the HP control variable, a bigger sample size might be needed for studies of this parenting dimension in the general population. G × E studies of HP control such as this one are very relevant given that the degree of reported HP control is strongly associated with maltreatment, which is a well-known risk factor for mental health problems, including social anxiety [Reference Legendre, Legendre, Legendre and Legendre46,Reference Devlin and Roeder47].
Next, we used a sensitivity analysis to distinguish between the absence and presence of HP control. One gene came out significant: CALCRL. This gene was also among the most strongly associated genes in the first analysis (for details, please see Supplementary Materials). The result of the permutation test was close to significance, without reaching the expected threshold (Figure 2B).
Studies on SLC1A1, GSTZ1, CALCRL, and psychopathology in humans are scarce. However, the available literature suggests that these genes may be involved in the development of anxiety.
SLC1A1 is a glutamate transporter gene that is highly expressed in the brain. Polymorphisms in SLC1A1 have been associated with early onset obsessive–compulsive disorder in males [48,Reference Simon, Herlands, Marks, Mancini, Letamendi and Li49] and in a general sample [Reference Hovens, Giltay, Van Hemert and Penninx50]. Some SNP variants in SLC1A1 are also reported to significantly increase the likelihood of post-traumatic stress disorder in combat-exposed veterans [Reference Arnold, Macmaster and Hanna51]. In addition, polymorphisms in SLC1A1 are associated with the severity of anxiety symptom in children with autism spectrum disorder [Reference Dickel, Veenstra-VanderWeele, Cox, Wu, Fischer and Van Etten-Lee52].
GSTZ1 is a multifunctional enzyme that belongs to the glutathione S-transferase enzymes superfamily. It is primarily responsible for glutathione dependent metabolism including the conjugation of glutathione to substrates and is involved in oxidative stress regulation [Reference Wu, Wang, Yu, Wang, Chen and Jiang53,Reference Zhang, Sheerin, Mandel, Banducci, Myrick and Acierno54]. An association was shown between variants in GSTZ1 and an increased susceptibility to early onset of bipolar disorder [Reference Gadow, Roohi, Devincent, Kirsch and Hatchwell55].
Interestingly, changes in glutamate levels and increases in cellular oxidative stress were reported in animal models of social isolation rearing that are commonly compared with psychological stressors in humans [Reference Blackburn, Woollatt, Sutherland and Board56]. In addition, changes in expression levels of genes involved in oxidative stress, in particular, in those genes related to glutathione enzymes, were also linked to anxiety-related phenotypes [Reference Board and Menon57]. In human studies, cortical glutamate levels have been associated with increased anxiety [Reference Rezaei, Saadat and Saadat58], and level changes in cortical glutamate have also been reported in pharmacologically induced anxiety [Reference Shao, Yan, Xuan, Peng and Huang59]. Together, the abovementioned studies indicate that biological pathways that regulate oxidative stress and glutamate neurotransmission are related to anxiety-like behavior and can be sensitive to stressful life events during development.
Although our results should be interpreted with caution, our findings align with previous studies and suggest that polymorphisms in genes involved in glutamate neurotransmission (SLC1A1) and in oxidative stress (GSTZ1), together with harsh parenting might facilitate increases in SAS. It is worth knowing, however, that biological pathways associated with SLC1A1 and GSTZ1 seem to be related to anxiety symptoms in general, rather than to social anxiety specifically. This may be plausible, as the same biological vulnerabilities could underlie both social and general anxiety disorders.
CALCRL plays an important role in neovascularization control [Reference Hovatta and Barlow60] and is involved in inflammation, blood pressure regulation, vascular biology, and cell proliferation [Reference Hovatta and Barlow60–Reference Zwanzger, Zavorotnyy, Gencheva, Diemer, Kugel and Heindel62]. Recently, it was suggested as a potential target for migraine treatment [Reference Kusano, Kukimoto-Niino, Hino, Ohsawa, Okuda and Sakamoto63]. Increased inflammation is reported in relation to anxiety [Reference Aiyar, Rand, Elshourbagy, Zeng, Adamou and Bergsma64], but also in the majority of other stress-related disorders [Reference Pozsgai, Liang, Brain, Hay and Dickerson65], as exposure to repeated and chronic stressful events was repeatedly associated with increase in pro-inflammatory processes [Reference Pozsgai, Liang, Brain, Hay and Dickerson65,Reference Karsan and Goadsby66].
Our results from the sensitivity analysis may suggest that binary environmental variables might make the model less specific to certain type of environmental exposure because more specific information available in the environmental variable might have been lost. In this way, HP control, which includes harsh punishment parental practices (such as physical punishment), after coded as being present or not might represent a more general exposure to stressful life experiences or adversity, rather than specific child–parent interactions. This can explain why in the sensitivity analysis, CALCRL, a gene involved in inflammation, a biological process linked with stress, became more prominent.
Therefore, this study suggests that interactions between genes and social environment play an important role in the etiology of anxiety-related disorders. However, it is important to note that more studies are needed to investigate further the interaction of genes involved in glutamate, glutathione neurotransmission, and oxidative stress in association with social environmental factors and the development of social anxiety-related symptoms.
Our study also shows that a hypothesis-driven preselection of genes, based on their functional protein networks, allows researchers to incorporate biological knowledge into G × E analyses. Such an approach allows researchers to focus on biological pathways that might be affected by adverse environments during sensitive developmental time periods. This allows a better understanding of the contribution of both genes and environment along the developmental time span. Our results also show the importance of applying a control for genomic inflation and permutation tests in G × E interaction studies.
Several limitations should be acknowledged. First of all, this study is based on cross-sectional data; therefore, it is difficult to establish a temporal relationship between variables. Secondly, both SAS and parenting were measured via self-reported questionnaires, which potentially introduces bias [Reference Wolf, Grishin and Koonin67]. This study also did not include a replication sample, as for reliable replication we would have needed a sample with similar age, outcome, and environmental variables, and currently genetically informed studies within the field of developmental psychology are scarce.
Financial Support
This work was supported by the grant C14/16/040 from KU Leuven.
Conflict of Interest
The authors declare that they have no conflict of interests.
Data Availability Statement
The dataset used in this study is not publicly available, because of the presence of sensitive information. However, the data are available from the last author, upon reasonable request and arrangement of data sharing agreements.
Supplementary Materials
To view supplementary material for this article, please visit http://dx.doi.org/10.1192/j.eurpsy.2020.62.


 Open access
Comments
No Comments have been published for this article.