


Depression is a leading cause of disability worldwide and a significant public health concern for older adults.Reference Alexopolous1–Reference Fiske, Wetherell and Gatz3 In the USA, individuals who are socioeconomically disadvantaged and racial or ethnic minorities are less likely to seek or receive needed mental health services.Reference Ross4,Reference Wang, Lane, Olfson, Pincus, Wells and Kessler5 Along with enhancing the availability and acceptability of mental health treatment, more comprehensive efforts to promote mental health are needed, such as targeting environmental factors that provide protection for mental health at a larger, population level. A factor that has received growing attention in its connection to mental health and well-being is greenness of the environment, or vegetative presence.Reference Beyer, Kaltenbach, Szabo, Bogar, Nieto and Malecki6–Reference Mitchell, Richardson, Shortt and Pearce8 Environmental greenness has been associated with lower depression, stress and anxiety symptoms in adult populations.Reference Beyer, Kaltenbach, Szabo, Bogar, Nieto and Malecki6,Reference Groenewegen, van den Berg, de Vries and Verheij9,Reference Roe, Thompson, Aspinall, Brewer, Duff and Miller10 The mechanisms by which this may occur include attention restoration, decreased rumination, stress buffering, increased physical activity and/or enhanced social contact and support.Reference Roe, Thompson, Aspinall, Brewer, Duff and Miller10–Reference van den Berg, Maas, Verheij and Groenewegen13 Interestingly, the relationships between greater income disadvantage and both mental wellness and mortality have been found to be attenuated among individuals with greater access to or contact with green spaces, leading Mitchell et al Reference Mitchell, Richardson, Shortt and Pearce8 to propose that increasing exposure to green space may be a promising approach for reducing health inequalities.Reference Mitchell and Popham14 Understanding the effects of neighbourhood greenness on older adults' mental health is importantReference Bos, van der Meulen, Wichers and Jeronumis15,Reference Wu, Prina, Jones, Matthews and Brayne16 given that older adults represent a large and growing population in the USA and they may be particularly sensitive to the impact of their immediate residential neighbourhood environment.Reference Brown, Lombard, Wang, Byrne, Toro and Plater-Zyberk17,Reference Yen, Michael and Perdue18
The present study examines the association between neighbourhood greenness at the block level and depression in Miami-Dade County (Florida, USA) among beneficiaries of Medicare, a USA federal health insurance programme for older adults ages 65 and older. All adults (and their spouses) over 65 years of age in the USA who worked and paid Medicare taxes for at least 10 years are eligible for Medicare, regardless of income, medical history or health.19 USA Census (2017) data show that Miami-Dade County has a population of approximately 2.7 million residents, with nearly 68% of the population being of Hispanic origin and over 52% being foreign born. These data show that median household income is 44 224 US$, with more than 18% of the population living below the federal poverty line. Persons 65 years and older make up 16% of the county's population, with 21% living below the poverty line.20 Recent analyses of Medicare data in Miami-Dade County found that higher levels of greenness at the block level were associated with reduced odds of chronic conditions, including physical health conditions such as cardiometabolic conditions (e.g. diabetes, hypertension) and mental health conditions such as Alzheimer's disease and depression.Reference Brown, Lombard, Wang, Byrne, Toro and Plater-Zyberk17,Reference Brown, Perrino, Lombard, Wang, Toro and Rundek21 Importantly, the Alzheimer's disease and depression findings also showed greater benefits of greenness for individuals living in lower-income, compared with higher-income, neighbourhoods.Reference Brown, Perrino, Lombard, Wang, Toro and Rundek21 However, these prior analyses did not disentangle the effects of physical and mental health outcomes, which often co-occur in older adulthood,Reference Alexopolous1,Reference Fiske, Wetherell and Gatz3 nor did they differentiate between the impact of high and moderate levels of greenness (v. low greenness) on depression, which can further clarify and facilitate interpretation of the findings to better inform interventions. The present analyses delve deeper into the prior research by examining the relationship between block-level greenness and depression diagnoses, controlling for medical illnesses.
Method
Study design
A retrospective cohort study was conducted to investigate the relationship between mean neighbourhood greenness at the census-block level and depression diagnoses among Medicare beneficiaries aged 65 years or older in Miami-Dade County, Florida in 2010–2011. A ‘census block’ is the smallest geographical area used by the USA Census Bureau for tabulating data collected from multiple households. In urban centres it may be the same as a city block, but it may be larger and more irregular in rural areas.Reference Rossiter22 Participants were included if their residence remained unchanged from 2010 to 2011. Analyses examined the relationship of neighbourhood census-block greenness to odds of depression diagnosis.
Sample
The study sample is summarised here but described in greater detail in Brown et al.Reference Brown, Lombard, Wang, Byrne, Toro and Plater-Zyberk17 In 2011 the USA Centers for Medicare for Medicare and Medicaid Services' (CMS) Master Beneficiary Summary File for Miami-Dade County contained 407 296 unique Medicare beneficiaries. Several exclusions were made to obtain the final study sample. The participant exclusion criteria were as follows: individuals living outside Miami-Dade County (n = 11 507); those who had died (n = 14 296); those who qualified for Medicare solely as a result of end-stage renal disease rather than old age (n = 3572); those younger than 65 years old (n = 64 109); those beneficiaries who could not be matched to a specific ZIP+4 code location associated with a census block (n = 14 401); ethnic/racial group members who represented <1% of the Miami-Dade County senior population (e.g. Asian, Pacific Islander, Native Americans) (n = 12 132); those who did not have the same residence in 2010 and 2011 (n = 34 584); and those with nursing home claims, in which case their location may have corresponded to a billing address rather an actual residence (n = 3650). The final cohort comprised 249 405 Medicare beneficiaries aged 65 years or older who had the same location (based on ZIP+4 code locator) across 2 calendar years (2010–2011). ZIP+4 data from CMS data were linked to a residential census block for each beneficiary, using Windows (PC-) version of Geolytics ZIP+4 software which provides the area centroid of the ZIP+4 code with latitude and longitude coordinates, and assigns the corresponding 2010 Census block, block group and tract identification numbers. The ZIP+4 code refers to the neighbourhood delivery code used by the United States Postal Service to identify address locations and deliver mail.
Measures: source of data
Individual demographic data
Information on individuals' age, gender, race/ethnicity and residential location were gathered from the Master Beneficiary Summary File from the CMS for the calendar years 2010–2011.
Neighbourhood household income
Neighbourhood median household income was obtained from the USA Census Bureau for 2011 at the census-block group level, which is the smallest geographic unit for which neighbourhood income was available. (Note that each census-block group is a clustering of multiple census blocks, as described above.) Income was assessed in thousands of US$.
Depression diagnosis
The CMS Master Beneficiary Summary File's Chronic Conditions Segment provides chronic conditions algorithms based on Medicare claims for each beneficiary during the selected time period. The depression algorithm includes any ICD-9 (1978) diagnosis code in the previous year for a mood or affective disorder (e.g. depression, major depressive disorder, dysthymic disorder, bipolar disorder, adjustment disorder with depressed mood).23 This is a dichotomous variable indicating the presence or absence of a diagnosis that includes depression.
Comorbid medical conditions
From the same CMS Master Beneficiary Summary File's Chronic Conditions Segment, comorbid medical conditions data were obtained per the CMS chronic conditions algorithms which covers the past 1–3 years depending on medical condition.23 The number of conditions was calculated by summing the number of chronic conditions other than depression in CMS data, with a possible range between 0 and 26 based on our previous work.Reference Brown, Lombard, Wang, Byrne, Toro and Plater-Zyberk17 Note that the CMS Chronic Conditions Segment contains information on the presence/absence of 27 chronic conditions and one of these conditions is depression, with almost all of the other 26 chronic conditions being physical health conditions (e.g. diabetes, cardiovascular disease diagnoses). For a full list of the chronic conditions and the specific algorithms for each condition, please see https://www.ccwdata.org/web/guest/condition-categories. The number of comorbid medical conditions was used as a control variable in the models in this study, given their co-occurrence with depression.Reference Alexopolous1,Reference Fiske, Wetherell and Gatz3
Neighbourhood greenness at the block level
Mean normalised difference vegetation index (NDVI) was used to calculate neighbourhood greenness at the census-block level for 2011, using USA National Aeronautics and Space Administration Advanced Spaceborne Thermal Emission and Reflection Radiometer satellite imagery at a 15-metre × 15-meter spatial resolution. As described by Rhew et al,Reference Rhew, Vander Stoep, Kearney, Smith and Dunbar24 NDVI is an objective, validated measure of greenness which is calculated by the formula NDVI = (NIR−RED)/(NIR + RED). NIR is the quantity of near-infrared wavelength reflectance and RED is the quantity of (visible) red wavelength reflectance. The basis for this measure is that vegetation, particularly tree canopy, reflects greater quantities of infrared radiation and absorbs greater quantities of energy in the red wavelength. NDVI yields values between −1 to +1, with higher numbers being indicative of higher and more dense levels of vegetation or greenness.Reference Rhew, Vander Stoep, Kearney, Smith and Dunbar24
Mean census block-level NDVI was assessed for all census blocks in Miami-Dade County and was subsequently categorised into three levels based on the level of greenness: low NDVI (−0.40 to −0.06, the lowest tertile of greenness), middle NDVI (−0.06 to 0.006, the middle tertile) and high NDVI (0.006 to 0.429, the highest tertile of greenness for the county).Reference Brown, Perrino, Lombard, Wang, Toro and Rundek21 To illustrate, Fig. 1 shows images with examples of census blocks at each level of NDVI or greenness tertile.
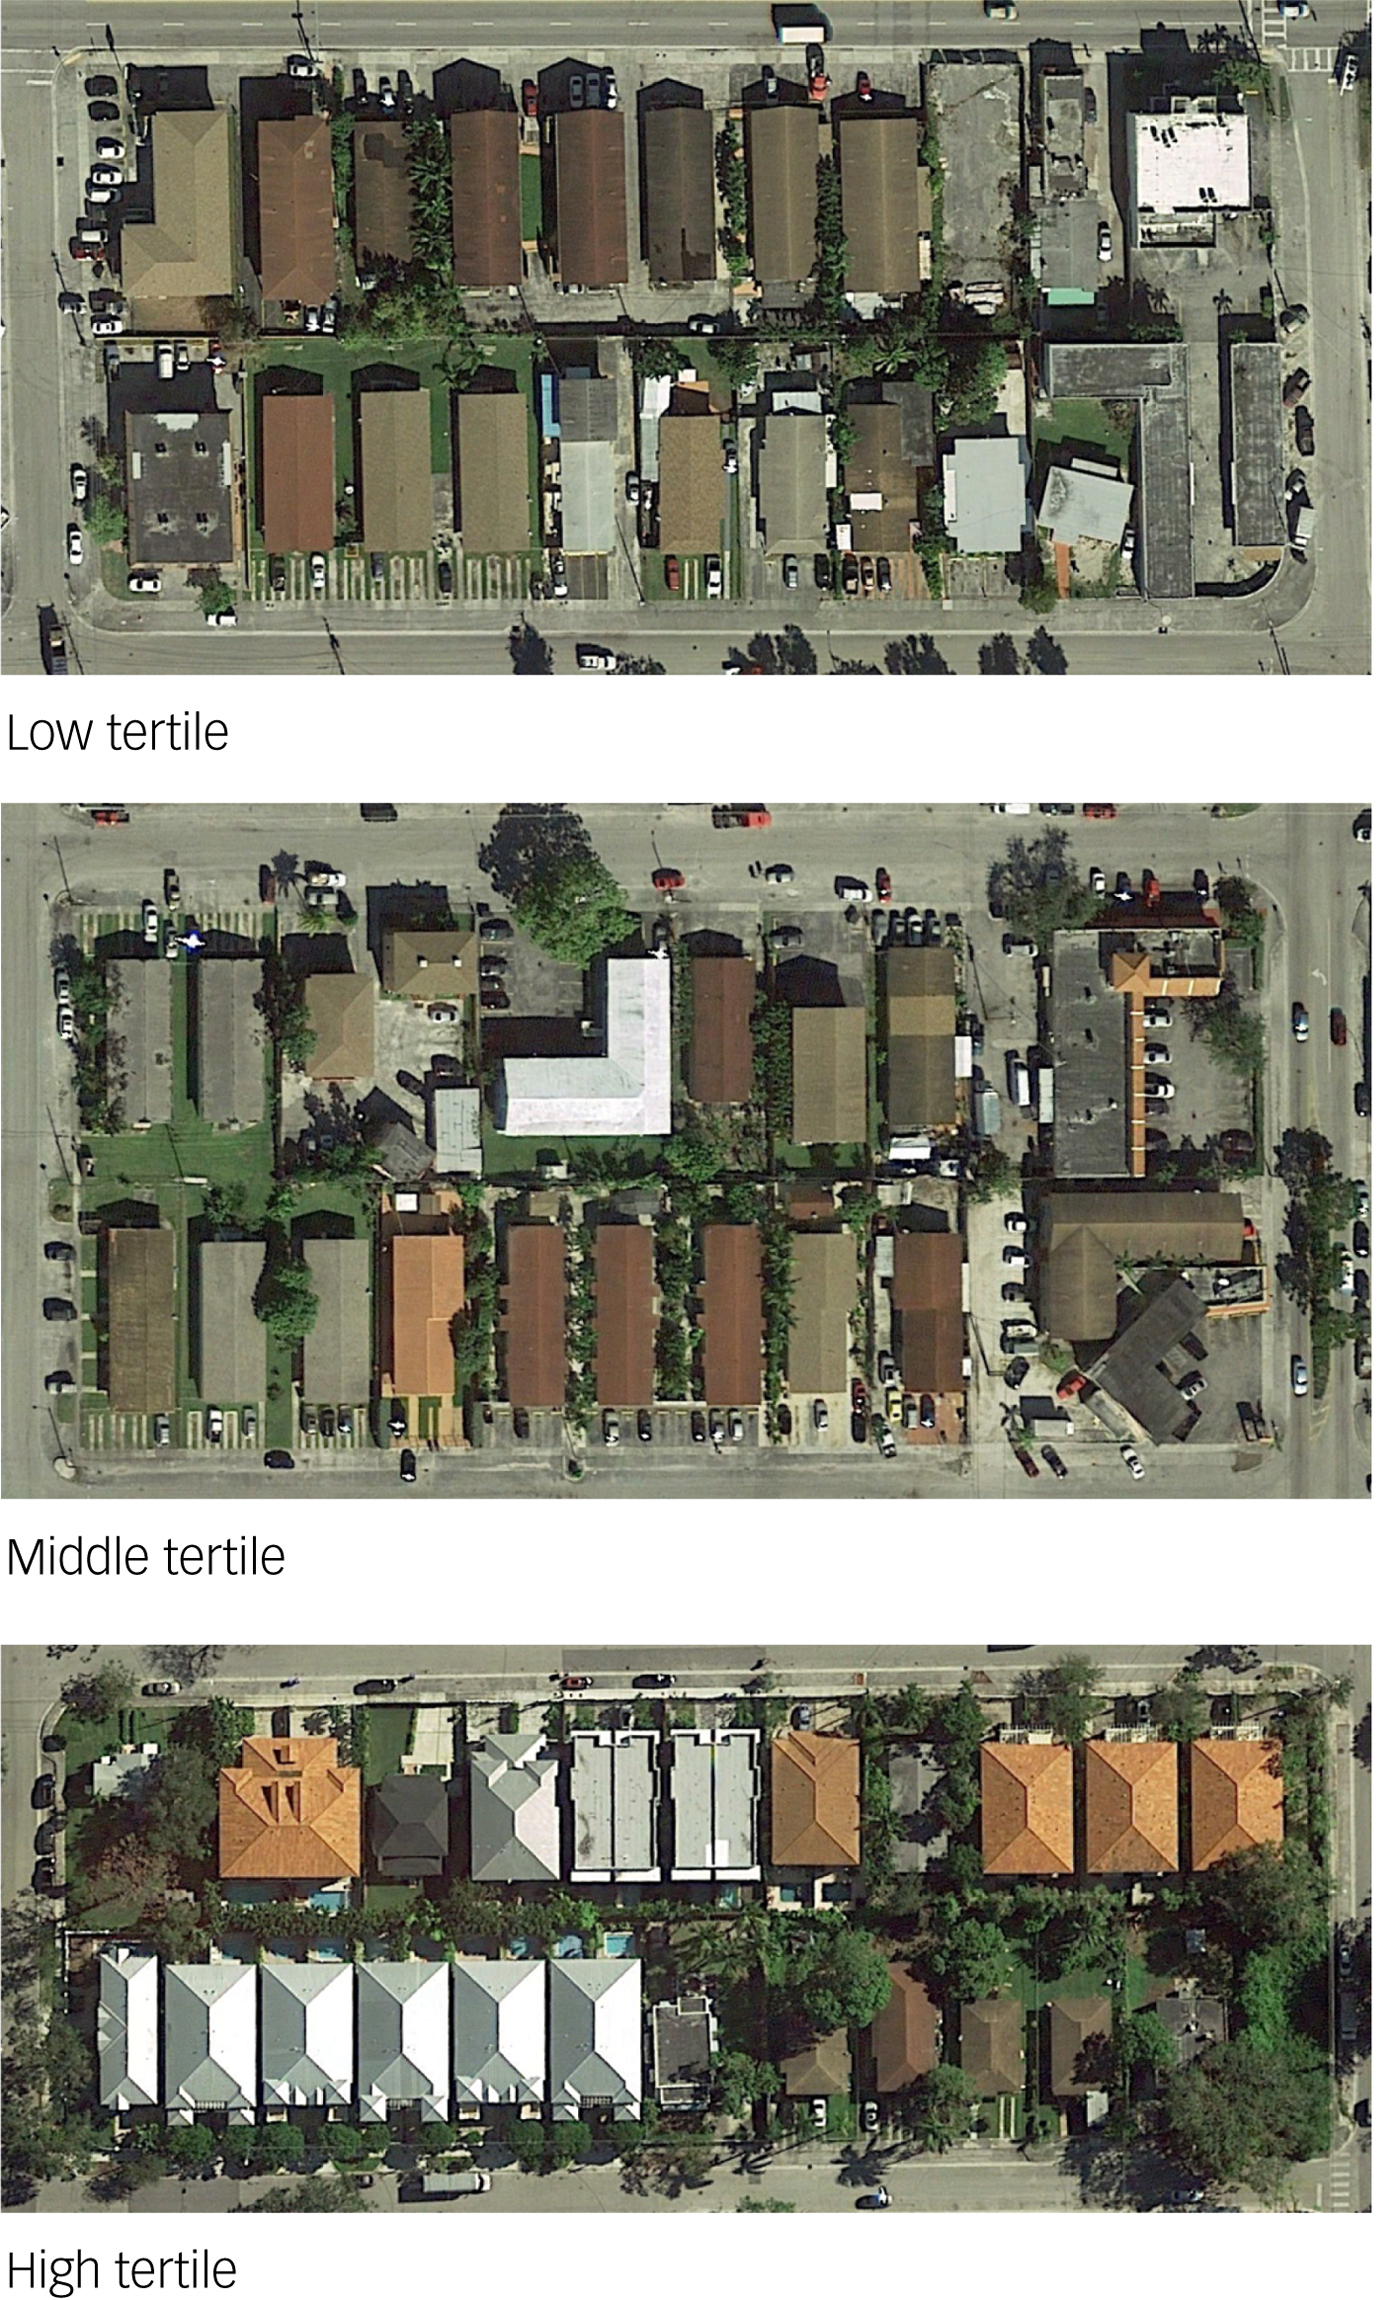
Fig. 1 Examples of census blocks at each tertile (low, medium and high) of greenness as assessed by using the mean normalized difference vegetation index measure.
Statistical analysis
All analyses were conducted using Windows (PC-) version of SAS 9.3 software.25 First, descriptive statistics were computed to characterise the overall sample on individual sociodemographics, depression and medical comorbidities as well as neighbourhood median income measured at the census-block group level. Census block-level greenness was then calculated by using mean continuous NDVI, allowing us to assign census blocks by neighbourhood greenness tertiles (low levels, medium levels or high levels of greenness). Because the number of comorbid, non-depression medical conditions was highly skewed, this variable was log transformed before analysis.
Four successive hierarchical logistic regression models were then conducted to examine the relationship between neighbourhood greenness and depression, adjusting for covariates. Model 1 was the unadjusted model. Model 2 was an adjusted model which included individual-level sociodemographic variables including age, gender and race/ethnicity. Model 3 was an adjusted model that included the individual-level sociodemographic variables as well as the neighbourhood-level income variable. Model 4 was a ‘fully adjusted’ model that added the number of comorbid medical conditions and thereby adjusted for individual-level sociodemographic variables, the neighbourhood-level income variable and the comorbid medical conditions. Low NDVI, the lowest tertile of neighbourhood greenness, was used as the reference group in the analyses. PROC GENMOD was used for this model, which involved a binary depression outcome variable indicating presence or absence of a depression diagnosis. Post hoc analyses with a parallel hierarchical logistic regression model examined the relationship between greenness and depression, but comparing the high-NDVI versus medium-NDVI tertiles.
Ethical approval
This study was approved by the University of Miami's Institutional Review Board (FWA00002247, ePROST Protocol#20110948) and the USA CMS Privacy Board (under CMS DUA# 24971).
Results
Descriptive statistics for the sample may be found in Table 1. Mean age was 76.3 (s.d. = 7.5) and 58% were female. Approximating the population distribution in Miami-Dade County, 66% were of Hispanic ethnicity, 11% of individuals reported that they were Black and 23% were non-Hispanic White. The mean number of comorbid medical conditions other than depression was 1.68 (s.d. = 2.84). The number of comorbid medical conditions varied (P < 0.0001) by neighbourhood greenness tertile, with those in the lowest NDVI tertile having the highest mean number of conditions at 2.0 (s.d. = 3.11), those in the medium tertile having a mean of 1.54 conditions (s.d. = 2.76) and those in the highest NDVI tertile having a mean of 1.49 conditions (s.d. = 2.58). The prevalence of depression – based on the CMS depression algorithm – among all beneficiaries was 9.25% (n = 23 075).
Table 1 Descriptive statistics for the overall sample and by mean neighbourhood greenness (NDVI) tertile
NDVI, normalised difference vegetation index.
a. Race and ethnicity was measured by USA Centers for Medicare for Medicare and Medicaid Services for each beneficiary using race/ethnicity designation for Medicare; this was enhanced by using first/last name algorithms from the Research Triangle Institute's race code.Reference Eicheldinger and Bonito26
The relationship between neighbourhood greenness at the census-block level and depression diagnosis is shown in Table 2. Model 1 (the unadjusted model) shows that, compared with the lowest tertile of greenness per NDVI, individuals residing in the medium-level tertile had 36% lower odds of depression (odds ratio 0.64; 95% CI 0.61, 0.67) whereas those in the highest tertile had 52% lower odds of depression (odds ratio 0.48; 95% CI 0.46, 0.51). Models 2 through 4 are the adjusted models and are consistent with the findings from the unadjusted model. These models show the relationship between block-level greenness and depression with the gradual addition of covariates, i.e. adding individual-level sociodemographics of age, gender and race/ethnicity (model 2), adding neighbourhood-level income (model 3) and adding the log-transformed number of other comorbid health conditions (model 4, the fully adjusted model). Although the relationship between greenness and odds of depression is reduced in strength with the addition of covariates, greenness and depression remain significantly and inversely related in the final, fully adjusted model. After adjusting for comorbidities, there was a monotonic relationship between greenness and odds of depression, with the odds of depression being 8% lower in the medium versus low tertile of greenness (odds ratio 0.92; 95% CI 0.88, 0.96), and 16% lower in the high versus low tertile of greenness (odds ratio 0.84; 95% CI 0.79, 0.88). The post hoc analyses comparing individuals in the high-NDVI versus medium-NDVI tertiles showed that after adjusting for individual-level sociodemographic variables, neighbourhood-level income and comorbid medical conditions, the odds of depression was 9% lower in the high- versus medium-level tertile of greenness (odds ratio 0.91; 95% CI 0.86, 0.96).
Table 2 Relationship of neighbourhood greenness (NDVI) tertiles to depression: unadjusted and adjusted hierarchical logistic regression models
NDVI, normalised difference vegetation index.
a. Unadjusted model.
b. Individual sociodemographic covariates: age, gender, race/ethnicity.
c. Individual sociodemographic covariates and neighbourhood-level income, which is median household income for neighbourhood.
d. Fully adjusted model: individual sociodemographic covariates, neighbourhood-level income and comorbid health conditions, which are non-depression comorbid health conditions.
e. P-value for linear trends is reported across the three tertiles of greenness (NDVI).
Discussion
Findings from this study show that higher levels of neighbourhood greenness at the census-block level were associated with lower odds of depression diagnosis among older adults. This was true even after adjusting for individual-level sociodemographic variables, neighbourhood-level income and comorbid health conditions which can co-occur with depression.Reference Alexopolous1,Reference Fiske, Wetherell and Gatz3 Although depression is influenced by genetic, neurobiological, medical and cognitive vulnerabilities;Reference Fiske, Wetherell and Gatz3 neighbourhood environmental factors including neighbourhood poverty, violent crime and safety and limited collective efficacy have been found to increase the risk for depression and depressive symptoms among older adults.Reference Groenewegen, van den Berg, de Vries and Verheij9,Reference Ahern and Galea27–Reference Wilson-Genderson and Pruchno29 In this and related work, we show a similar relationship between low levels of neighbourhood greenness and depression, even across different neighbourhood socioeconomic strata.Reference Brown, Perrino, Lombard, Wang, Toro and Rundek21The mechanisms through which greenness may affect depression are not yet clear. Greenness has been associated with lower levels of mental fatigue and stress through attention restoration.Reference Hartig7 Environmental greenness may also buffer the effects of stressful life events.Reference van den Berg, Maas, Verheij and Groenewegen30 It has also been associated with higher levels of physical activity, which have in turn been related to decreased cortisol levels and depressive symptoms.Reference Roe, Thompson, Aspinall, Brewer, Duff and Miller10 Moreover, higher levels of physical activity may be related to reduced isolation, increased social interaction and support and opportunities for positive reinforcement through behavioural activation.Reference Fan, Das and Chen12,Reference Polenick and Flora31 Assessment of potential mechanisms that explain the relationship between greenness and depression may be helpful in tailoring environmental interventions to meet individual needs. Nonetheless, the associations identified by this and other work suggest that neighbourhood greenness and vegetation are a promising intervention target, and that even moderate levels of greenness may confer mental health benefits compared with low greenness levels.
This study is not without limitations. Self-selection of individuals' neighbourhoods cannot be removed as a potential source of bias. Indeed, it may be that healthier and more advantaged individuals choose neighbourhoods that are greener. It is also noteworthy that this study involved cross-sectional analyses and thus causation cannot be established. There may also be important, unassessed variables that are affecting the variables examined in the study. Finally, the generalisability of the findings to other communities should be considered, given that Miami-Dade County has a unique sociodemographic composition, geography and climate characteristics. The warm and humid subtropical climate may have influenced the findings and may limit generalisability. The reliance on this sample of Medicare beneficiaries, who do not represent all older adults in the county, may also affect the generalisability of the findings to other regions. Nonetheless, there is growing research literature showing a relationship between neighbourhood greenness and mental health which has been carried out in different regions (e.g. North America, Europe) with diverse climates and with populations varying in ethnicity, age and socioeconomic characteristics.Reference Mitchell, Richardson, Shortt and Pearce8–Reference Roe, Thompson, Aspinall, Brewer, Duff and Miller10,Reference Wu, Prina, Jones, Matthews and Brayne16,Reference van den Berg, Maas, Verheij and Groenewegen30
Implications and future directions
This study adds to previous findings that have found that nature and neighbourhood greenness have a positive relationship to health outcomes and well-being.Reference Beyer, Kaltenbach, Szabo, Bogar, Nieto and Malecki6,Reference Groenewegen, van den Berg, de Vries and Verheij9,Reference Mitchell and Popham14,Reference Pereira, Foster, Martin, Christian, Boriff and Knulman32 This includes findings with this same sample that concluded that neighbourhood greenness was associated with lower odds of diabetes, hypertension and hyperlipidemia.Reference Brown, Lombard, Wang, Byrne, Toro and Plater-Zyberk17 Because a number of health outcomes have been associated with neighbourhood greenness, the current findings further suggest that community-level, environmental interventions that enhance greenness of older adults' neighbourhoods may play a part of a broader approach to promoting mental health. Access and exposure to nature and green spaces may also form part of clinician recommendations to patients regarding self-care. Additionally, policy makers should consider parks and green spaces as key aspects of city and neighbourhood planning. These community-level interventions may mitigate some of the health burden experienced by older adults and other vulnerable populations. Indeed, planting trees and/or increasing access to green spaces may be a relatively low-cost intervention for preventing and/or treating depression, a leading cause of disability worldwide.
Funding
This project was supported in part by a grant from the US Department of Housing and Urban Development, grant number HUD H-21620-RG (principal investigator: S.C.B.) and the Health Foundation of South Florida (principal investigator: S.C.B.).


eLetters
No eLetters have been published for this article.