


Patients with schizophrenia often experience adverse outcomes, such as unemployment, frequent hospital admissions, long-term dependency on healthcare and suicide. Premature mortality of patients with schizophrenia has been reported to be 3.5 timesReference Olfson, Gerhard, Huang, Crystal and Stroup1 greater than that of adults in the general population. The societal costs of schizophrenia during a 12-month period have been estimated to be as high as $890 million in the USA.Reference Evensen, Wisloff, Lystad, Bull, Ueland and Falkum2 All domains of quality of life (QoL; physical, psychological and social) are severely decreased in schizophrenia compared with healthy controls. QoL is also increasingly becoming an important index for effectiveness of treatment in schizophrenia.Reference Kane, Robinson, Schooler, Mueser, Penn and Rosenheck3 Several variables have been shown to be associated with QoL among patients with schizophrenia, such as age, gender, employment status, marital status, duration of illness, body mass index, antipsychotic medication, number of hospital admissions, level of knowledge about schizophrenia, schizophrenia symptoms, coping mechanisms and comorbid depression.Reference Hasan and Tumah4–Reference Yamauchi, Aki, Tomotake, Iga, Numata and Motoki12 However, a comprehensive, large-scale study that uses in-depth phenotyping to investigate factors associated with QoL in schizophrenia in a hypothesis-generating fashion is lacking. In addition, to the best of our knowledge, the genetic underpinnings of QoL have not been investigated. Recently published genome-wide association studies (GWASs) for schizophreniaReference Ripke, Neale, Corvin, Walters, Farh and Holmans13 and related traits, such as major depressive disorder (MDD)Reference Wray, Ripke, Mattheisen, Trzaskowski, Byrne and Abdellaoui14 and subjective well-being,Reference Okbay, Baselmans, De Neve, Turley, Nivard and Fontana15 provide a timely opportunity to investigate whether genetic mechanisms are at the root of QoL. Knowledge of clinical and genetic contributing factors to QoL in schizophrenia could inform clinicians to help identify vulnerable patients and optimise secondary preventive care, thus reducing the burden of disease. This could be achieved through optimisation of treatment regimens (e.g. psychosocial interventions or optimising psychopharmacological treatments) and targeting clinical variables negatively influencing QoL. On a similar note, insight into genetic factors contributing to QoL could contribute to the early identification of vulnerable patients, and improve their outcome.
Here, we used a hypothesis-generating approach and investigated over 100 phenotypes to investigate factors related to QoL among patients with schizophrenia. We additionally performed genetic risk scoring in patients, relatives and healthy controls to uncover associations between genetic susceptibility to schizophrenia, MDD and subjective well-being on the one hand, and QoL on the other.
Method
Participants and study design
All procedures contributing to this work comply with the ethical standards of the relevant national and institutional committees on human experimentation and with the Helsinki Declaration of 1975, as revised in 2008. All procedures involving human subjects/patients were approved by the medical-ethical committee of University Medical Center Utrecht. All participants provided written informed consent for the study. The current study was performed within a cohort of 3684 individuals, including 1119 patients with schizophrenia, 1059 siblings, 920 parents and 586 controls (Supplementary Appendix 2, Supplementary Fig. 1 available at https://doi.org/10.1192/bjo.2020.140). We used two main subsets. The first subset included patients only (n = 1119), to test non-genetic contributing factors to QoL among patients with schizophrenia. We chose this subset as we were interested in phenotypic contributing factors to QoL in patients; however, other, larger cohort studies may be more appropriate to probe contributing factors to QoL in the general population. The second subset included patients, relatives and controls with genetic data available (n = 2265), to test genetic contributing factors to QoL. We chose this subset to increase statistical power and as, intuitively, genetic contributing factors to QoL may (partly) overlap between patients, relatives and controls. All participants were included from the Genetic Risk and Outcome of Psychosis (GROUP) study,Reference Korver, Quee, Boos, Simons and de Haan16 a multicentre, large longitudinal study in The Netherlands and Belgium, investigating various psychological and genetic variables among patients with schizophrenia and their relatives. The study population was followed up since 2004, in several mental healthcare institutions, both in The Netherlands and Belgium. The detailed phenotypic information of GROUP participants offers a unique and enriched database.Reference Korver, Quee, Boos, Simons and de Haan16 Psychosis-related and demographic variables that were included in the analysis are presented in Supplementary Appendix 1. These variables may be divided into symptoms and experiences that were assessed with a range of (semi)-structured scales, including drug use, family loading for psychiatric disorders, social cognition, demographic variables, IQ, medication use data and theory of mind scales. For the purpose of this study, we only used the baseline assessments of the GROUP study (release 5.00), as we were interested in factors contributing to QoL in schizophrenia apparent in its early disease stages (the first psychotic episode of the GROUP participants had to occur within 10 years before this first assessment). Supplementary Figure 1 shows a breakdown of the study sample.
QoL assessment
QoL was assessed with the World Health Organization's WHOQOL-BREF, an abbreviated version of the World Health Organization Quality of Life scale. The self-report WHOQOL-BREF has been validated for a Dutch-speaking population of psychiatric patients.Reference Korver, Quee, Boos, Simons and de Haan16–Reference Gobbens and van Assen18 Details of the Dutch WHOQOL-BREF are described elsewhere.Reference Gobbens and van Assen18 The WHOQOL-BREF scale includes 24 items covering four domains of QoL,Reference Gobbens and van Assen18 namely physical health (seven items), psychological (six items), social relations (three items) and environment (eight items). The questionnaire additionally provides a general estimate of QoL presented as five categories: ‘very bad’, ‘moderately bad’, ‘good nor bad’, ‘moderately good’ and ‘very good’. To reduce the number of QoL variables and create a suitable variable for statistical analyses, we performed principal component analysis to preferably identify one quantitative component that best explained most of the variability in QoL domains, without transformations, only in patients. Similar to a previously published GWAS using principal component analysis to derive a single phenotype,Reference Davies, Lam, Harris, Trampush, Luciano and Hill19 the percentage of variance accounted for by the first unrotated principal component was computed. This principal component was standardised for further analysis, explained 62.5% of the variability in our data and correlated well with all WHOQOL-BREF domains (Supplementary Fig. 2), whereas the other four components were correlated with only one of the domains and showed minimal correlations with other domains of QoL. We therefore used this first principal component for subsequent analyses.
Phenome-wide analyses
For the agnostic association analysis of QoL with the above explained demographic and clinical phenotypes (Supplementary Appendix 1), we used data from patients with complete data on the QoL principal component, age, gender and study site (n = 925; Supplementary Fig. 1). The number of independent variables was calculated by testing two-by-two correlations between variables, using non-parametric Spearman correlation. Variables with correlation estimates >0.3 and statistically significant correlations (P<0.05) were considered interdependent variables. This analysis resulted in 105 independent variables. Generalised linear models (GLM) adjusted for age, gender and study site were then used to test the association of QoL with each of the clinical phenotypes. The statistical significance threshold for this association analysis was corrected for multiple testing with the Bonferroni correction method, i.e. 4.76 × 10−04 (0.05 adjusted for 105 independent tests).Reference Shaffer20 As sensitivity analysis, we calculated P-values for phenotype-QoL associations by using data with random samples of the QoL variable, using 1000 iterations. We then calculated the probability that our observed P-values are driven by chance (empirical P-values) by using the method of Davison and Hinkley,Reference Davison and Hinkley21 as follows: (number of null P-values less than the observed + 1)/(number of permutations + 1). For each trait-QoL association, we declared statistical significance if none of the 1000 iterated samples led to a permutated P-value less than the observed P-value. This was equivalent to an empirical P-value of 0.001. The variance in QoL explained by the phenotypes was calculated with R2 values obtained from GLM. To then identify a set of variables that were associated with QoL independent of one another, we used the phenotypes that were associated with QoL at P < 4.76 × 10−04 and selected the independent variables in a backward stepwise regression model. As a sensitivity analysis, we then regressed the most significantly associated phenotypes with ordinal estimates of QoL as opposed to the first principal component of QoL.
Genotyping, quality control and genome-wide association analysis
Details of genotyping and GWAS of QoL can be found in Supplementary Appendix 1. In brief, genotype data for 2812 GROUP participants were generated on a customised Illumina Institute of Psychological Medicine and Clinical Neurology chip array with 570 038 single-nucleotide polymorphisms (SNPs). Quality control procedures were performed with PLINK, version 1.9 for Apple Mac (Harvard, USA; see https://zzz.bwh.harvard.edu/plink/download.shtml).Reference Purcell, Neale, Todd-Brown, Thomas, Ferreira and Bender22 In total, 2505 individuals and 275 021 SNPs passed these abovementioned quality control steps. After merging with the phenotype file, 2265 individuals were left for genetic analyses (Supplementary Appendix 2, Supplementary Fig. 1).
Additional SNPs were imputed on the Michigan server,Reference Das, Forer, Schonherr, Sidore, Locke and Kwong23 using the Haplotype Reference Consortium r1.1 2016 reference panel. Although likely underpowered, for the benefit of possible future meta-analyses and as a first exploratory approach we performed linear mixed models association testing implemented in BOLT-LMM (version 2.3) software for Apple Mac (Broad Institute, USA; see https://alkesgroup.broadinstitute.org/BOLT-LMM/BOLT-LMM_manual.html)Reference Loh, Tucker, Bulik-Sullivan, Vilhjálmsson, Finucane and Salem24 to assess associations between SNPs and QoL (Supplementary Appendix 1). BOLT-LMM corrects for confounding from population structure and cryptic relatedness. We used the generally accepted association P-value threshold of P < 5 × 10⁻⁸ for genome-wide significance. We report those findings in the Supplementary Appendix 2 (Supplementary Figs. 7 and 8).
Polygenic risk score analyses of QoL
We used recent GWASs of schizophrenia,Reference Ripke, Neale, Corvin, Walters, Farh and Holmans13 MDDReference Wray, Ripke, Mattheisen, Trzaskowski, Byrne and Abdellaoui14 and subjective well-beingReference Okbay, Baselmans, De Neve, Turley, Nivard and Fontana15 for polygenic risk score (PRS) calculations.Reference Choi, Mak and O'Reilly25 We chose the PRSs of these disorders as they are strongly associated with QoL in the general population.Reference IsHak, Mirocha, James, Tobia, Vilhauer and Fakhry26–Reference Domenech, Altamura, Bernasconi, Corral, Elkis and Evans29 To verify that PRS of other traits were indeed unlikely to be associated with QoL, the genetic correlations between the primary BOLT- LMM GWAS summary statistics and over 700 other disease traits were estimated with linkage disequilibrium score regression (http://ldsc.broadinstitute.org/).Reference Zheng, Erzurumluoglu, Elsworth, Kemp, Howe and Haycock30 As a quality control for PRS calculation, the SNPs that overlapped between the summary statistics GWASs (training data-sets) and our data-setReference Habtewold, Liemburg, Islam, de Zwarte, Boezen and Bruggeman31 were extracted. Then, insertions or deletions, ambiguous SNPs, SNPs with minor allele frequency <0.01 and imputation quality (R2) < 0.8 in both training and target data-sets were excluded. To account for complicated linkage disequilibrium structure of SNPs in the genome, these SNPs were clumped in two rounds with PLINK version 1.90b3z,Reference Chang, Chow, Tellier, Vattikuti, Purcell and Lee32 according to previously established methods:Reference McLaughlin, Schijven, van Rheenen, van Eijk, O'Brien and Kahn33,Reference Schur, Schijven, Boks, Rutten, Stein and Veldink34 round 1 with the default parameters (physical distance threshold 250 kb and linkage disequilibrium threshold (R2) of 0.5); and round 2 with a physical distance threshold of 5000 kb and linkage disequilibrium threshold (R2) of 0.2. Additionally, we excluded all SNPs in genomic regions with strong or complex linkage disequilibrium structures (e.g. the MHC region on chromosome 6; Supplementary Appendix 2, Supplementary Table 1). If only odds ratios were reported in the summary statistics, they were log-converted to β-values as effect sizes. To prevent possible study population overlap affecting our results, all Dutch and Belgian individuals had been excluded from the schizophrenia GWASReference Ripke, Neale, Corvin, Walters, Farh and Holmans13 to allow unbiased PRS computation.Reference McLaughlin, Schijven, van Rheenen, van Eijk, O'Brien and Kahn33 Sample overlap between GROUP data with MDD and subjective well-being GWAS samples is unlikely because all samples belong to different cohorts. To reassure that there was indeed minimal to no sample overlap between GROUP and MDD and subjective well-being samples, we checked the intercepts of the genetic covariances from linkage disequilibrium score regression analyses between the GROUP GWAS and MDD and subjective well-being. Presence of sample overlap modifies this intercepts from zero,Reference Bulik-Sullivan, Finucane, Anttila, Gusev, Day and Loh35 whereas in our study all intercepts turned out to be close to zero (Supplementary Appendices 1 and 2, Supplementary Table 2). We constructed PRSs based on schizophrenia risk alleles weighted by their schizophrenia-increasing effect estimate, using the Purcell et al method,Reference Purcell, Neale, Todd-Brown, Thomas, Ferreira and Bender22,Reference Purcell, Wray, Stone, Visscher, O'Donovan and Sullivan36 i.e. using PLINK's score function for 12 GWAS P-value thresholds (referred to as Pt from here onward): 5 × 10⁻⁸, 5 × 10⁻⁷, 5 × 10⁻⁶, 5 × 10⁻⁵, 5 × 10⁻⁴, 5 × 10⁻³, 0.05, 0.1, 0.2, 0.3, 0.4 and 0.5. PRSs were calculated for 2505 patients, relatives and controls (those remaining after quality control). Genetic data and QoL variables were available for patients, relatives and controls. We thus performed statistical analyses for the association of PRSs with QoL in the whole sample after quality control (N = 2265; Supplementary Appendix 2, Supplementary Fig. 1), including patients, controls and family members. This approach provided the opportunity to investigate genetic susceptibility of these PRSs on QoL regardless of presence or absence of the disease. We calculated explained variance and P-values for PRSs on QoL in two stages. In the first stage, we analysed the effect of age, gender and disease status on QoL to obtain residuals of this model. Subsequently, we tested the association of the residuals of the previous model with each of the various PRSs, using a linear mixed model with family identification as random effect and the first three genetic principal components as covariates. We additionally included the most significantly associated PRSs from each schizophrenia, MDD and well-being PRS group in one single mixed model, to assess if these PRSs were statistically independent of each other. We subsequently included negative, positive and depressive symptoms as covariates (as these were previously known to associate with QoL, which was also confirmed in the current cohort), and PRSs in mixed models to assess the additional explained variance of the three PRSs beyond clinical phenotypes. We additionally performed sensitivity schizophrenia PRS analyses on patients only, to assess whether we observed similar effects to the combined set of patients, siblings and controls.
To claim significance for association analyses between PRS and QoL, we Bonferroni-corrected the P-value for multiple testing (0.05/3 = 0.016), which is likely to be conservative given the significant and sizeable genetic correlations between the three PRS traits tested.
Results
Table 1 shows baseline characteristics of patients, relatives and controls. In the GLM, 18 distinct variables were associated with QoL at the Bonferroni significance threshold of 4.76 × 10−04 in patients with schizophrenia (Fig. 1, Table 2 and Supplementary Appendix 2, Supplementary Fig. 3). In our permutation sensitivity analysis, the same variables were significantly associated with QoL in addition to one extra variable, educational degree (Table 2). The statistically most significant phenotypes were negative (β = −1.17; s.e. 0.05, P = 1 × 10−83; r 2 model = 38%), depressive (β = −1.07; s.e. 0.05; P = 2 × 10−79; r 2 model = 36%), emotional distress (β = −0.09; s.e. 0.01; P = 4 × 10−59; r 2 model = 25%) and general psychopathology (β = 0.81; s.e. 0.06; P = 3 × 10−40; r 2 model = 17%) symptoms (Table 2). In our regression model including these 18 variables, nine remained independently associated with QoL (P<0.05), explaining 58.55% of the variance in QoL. Ordered by decreasing level of significance these are: negative symptoms, global assessment of functioning, emotional distress, depressive symptoms, positive symptoms, remission status, cannabis craving, number of unmet needs and excitement (Table 2 and Supplementary Appendix 2, Supplementary Table 3). In addition, there was a negative age effect (β = −0.01; s.e. 0.003; P = 3 × 10⁻³) on QoL in the backward stepwise model (Supplementary Appendix 2, Supplementary Table 3). Association analysis between ordinal estimates of QoL showed similar results (Supplementary Appendix 2, Supplementary Fig. 4). We additionally tested if any of these phenotypes captured in the original World Health Organization questionnaire items showed associations with the phenotypes tested, and we observed that the World Health Organization mobility item explained 32%, 25%, 21% and 9% of the variances in depressive, negative, positive and emotional symptoms, respectively. The rest of the World Health Organization items each explained less than 8% variation in each of our statistically most significant phenotypes.

Fig. 1 Results of the hypothesis-generating association analysis between clinical variables and QoL among patients with schizophrenia with explained variance for QoL. Number of unmet needs was measured with the Camberwell Assessment of Need. Remission was measured with the PANSS patient in remission tool. Suicide attempt was assessed with the composite file (a questionnaire with closed questions designed for the Genetic Risk and Outcome of Psychosis study). Cannabis thoughts were defined as thoughts about cannabis use, measured with the Obsessive Compulsive Drug Use Scale. Deficit syndrome was measured with the Schedule for the Deficit Syndrome. Obsessive–compulsive symptoms total score was measured with the Yale–Brown Obsessive Compulsive Scale. Akathisia was measured with the Barnes akathisia rating scale. PAS, Premorbid Adjustment Scale.
Table 1 Baseline characteristics for patients, siblings and controls

Table 2 The 18 distinct clinical variables associated with quality of life in the generalised linear model (n = 925 patients with schizophrenia); and one variable additionally associated in our permutation sensitivity analysis
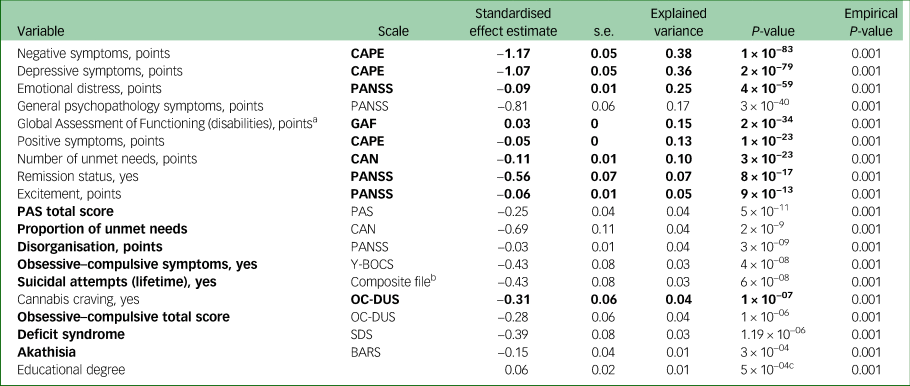
The clinical variables in bold were independently associated with quality of life in our stepwise regression model.
CAPE, Community Assessment of Psychic Experiences; PANSS, Positive and Negative Syndrome Scale; GAF, Global Assessment of Functioning; CAN, Camberwell Assessment of Need; PAS, Premorbid Adjustment Scale; Y-BOCS, Yale–Brown Obsessive Compulsive Scale; OC-DUS, Obsessive-Compulsive Drug Use Scale; SDS, Schedule for the Deficit Syndrome; BARS, Barnes Akathisia Rating Scale Global, a clinical assessment scale for akathisia.
a. Greater score indicates better functioning.
b. This scale contains a range of questions probing health.
c. In our permutation sensitivity analysis the same 18 variables remained associated, as well as one additional variable, educational degree.
The variance in QoL explained by various PRSs (N = 2265) were 1.37% for schizophrenia, 1.37% for subjective well-being (Fig. 2) and 1.40% for MDD (Supplementary Appendix 2, Supplementary Fig. 5) when using only genome-wide significant SNPs (Pt of 5 × 10⁻⁸). The most significant associations between PRS and QoL were observed for schizophrenia (Pt0.5; explained variance 1.58%, P = 7 × 10⁻⁶; Fig. 1), subjective well-being (Pt0.4; explained variance 1.82%, P = 0.004; Fig. 1) and MDD (Pt0.005; explained variance 1.62%, P = 0.01; Supplementary Appendix 2, Supplementary Fig. 5). As a sensitivity analysis, we repeated the schizophrenia PRS analysis on patients only (n = 633), and confirmed the same pattern of association with QoL and the same Pt of 0.5 showing most significant association results (Supplementary Appendix 2, Supplementary Fig. 6). The SNP heritability of QoL was 13.19% (s.e. 19.03). As expected, given the relatively low statistical power, genetic correlation analysis in LD Hub showed no statistically significant results. Confirming our rationale for investigating the PRSs chosen in the current study, genetic correlations of QoL with schizophreniaReference Ripke, Neale, Corvin, Walters, Farh and Holmans13 and subjective well-beingReference Okbay, Baselmans, De Neve, Turley, Nivard and Fontana15 were the strongest, in the expected direction (Supplementary Appendix 2, Supplementary Table 2).
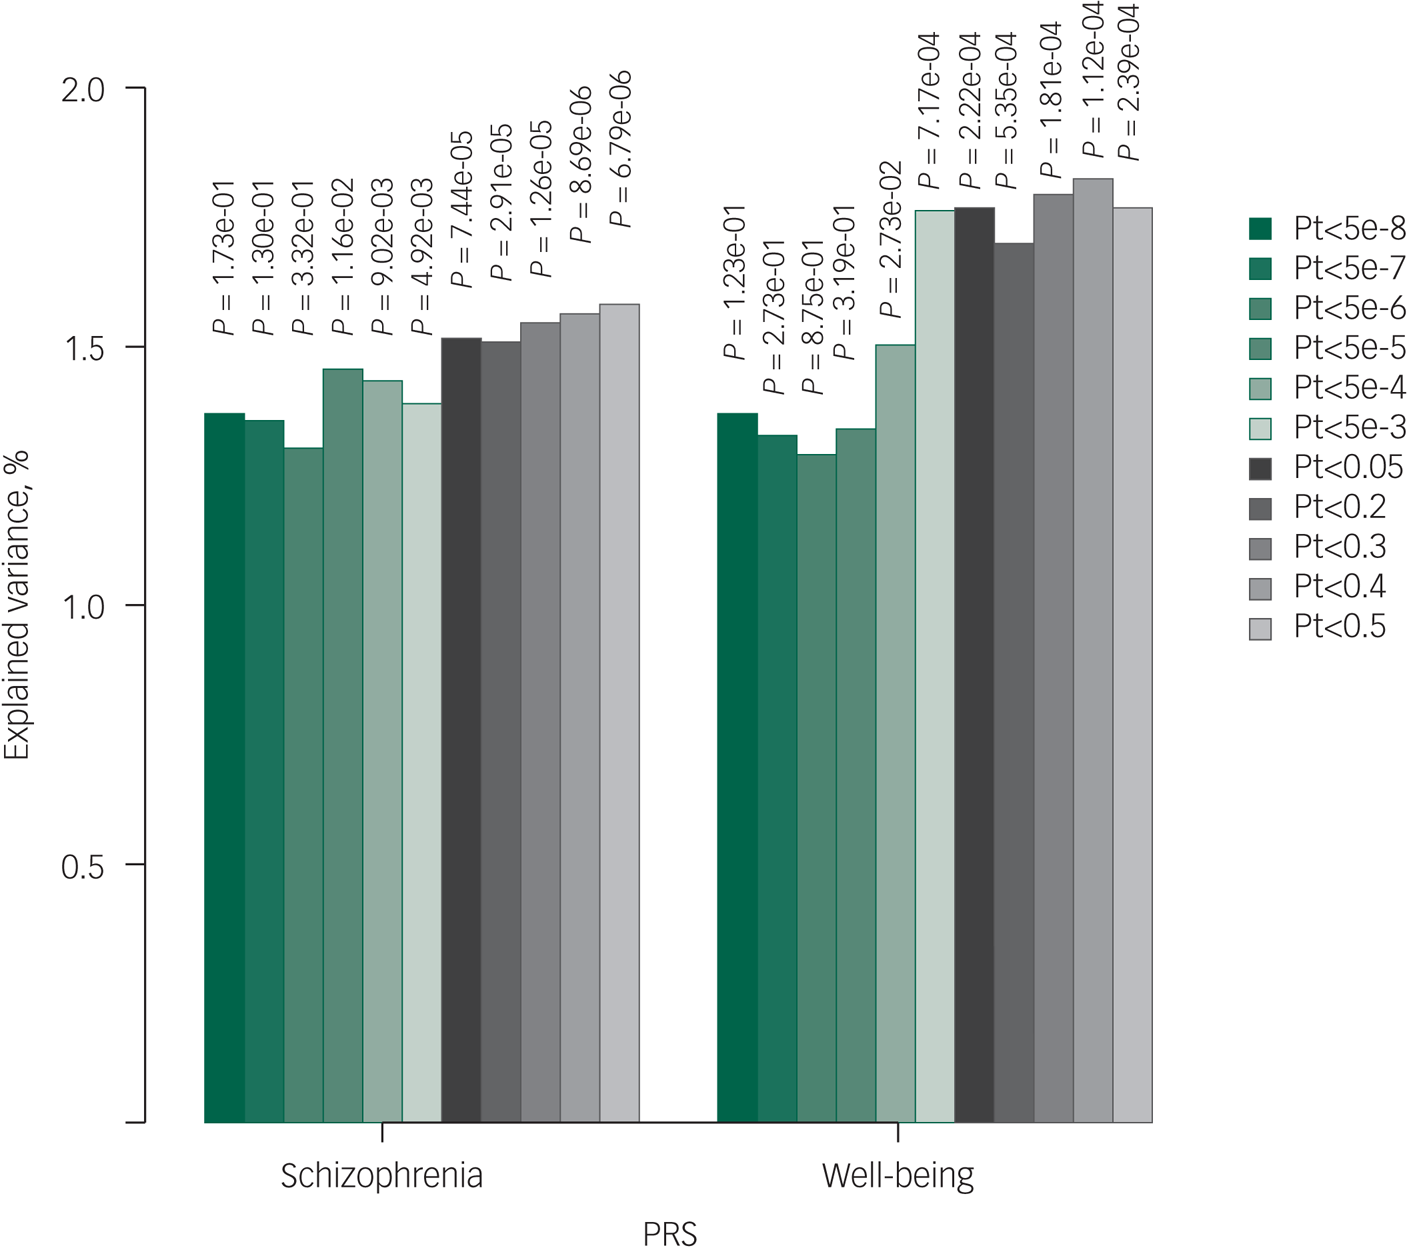
Fig. 2 Bar plot illustrating explained variance for association of polygenic risk scores of schizophrenia and subjective well-being with quality of life. The figure illustrates the results with linear mixed models. Displayed are the number of single-nucleotide polymorphisms (N), the strengths of the association results (–log10 P-value) and explained variances per Pt (P-value threshold). PRS, polygenic risk score.
Schizophrenia Pt0.5 (P = 7 × 10⁻⁶), MDD Pt0.005 (P = 0.01) and subjective well-being Pt0.4 (P = 0.004) remained associated with QoL independent of one another. After additional adjustment for positive, negative and depressive symptoms, schizophrenia PRS (Pt0.5; P = 0.002) and well-being PRS (Pt0.4; P = 0.04) remained associated with QoL. Moreover, only schizophrenia and subjective well-being PRSs were consistent with true polygenicity, explaining a proportion of the variance in QoL, as may be appreciated by increasing degrees of explained variances and increasing significance levels with relaxing Pts (Fig. 2).
As stated above, all final clinical phenotypes included in our regression model together explained 58.55% of the variability in QoL. By adding schizophrenia Pt0.5, MDD Pt0.005 and subjective well-being Pt0.4, the model explained 59.00% of the variability.
Discussion
Here, we identify non-genetic factors contributing to QoL among patients suffering from schizophrenia. Our results show that ~58% of variance in QoL may be explained by a range of demographic and clinical variables. We additionally demonstrate that genetic predisposition to schizophrenia and subjective well-being explain a (small) proportion of variability in QoL on top of clinical variables. The novelty of our method lies in the use of hypothesis-generating approaches to investigate a vast number of schizophrenia-associated genetic and non-genetic variables.
Most of the previous studies into QoL in schizophrenia had small-to-moderate sample sizes,Reference Savill, Orfanos, Reininghaus, Wykes, Bentall and Priebe10,Reference Wang, Petrini and Morisky11,Reference Cruz, de Resende, Carvalhaes, Cardoso, Teixeira and Keefe37 and have shown the association of particularly negative and positive symptoms with QoL in schizophrenia. A recent study in 157 patients with schizophrenia showed the effects of excitement,Reference Domenech, Altamura, Bernasconi, Corral, Elkis and Evans29 positive, negative and depressiveReference Domenech, Altamura, Bernasconi, Corral, Elkis and Evans29 symptoms on QoL. The study by Domenech et al used only clinical symptoms based on PANSS.Reference Domenech, Altamura, Bernasconi, Corral, Elkis and Evans29 We tested clinical symptoms assessed with multiple internationally well-established scales (e.g. Community Assessment of Psychic Experience, Positive And Negative Syndrome Scale, Camberwell Assessment of Need) and assessed a range of other phenotypic variables. Such rich phenotyping together with our large sample size allowed us to firmly establish additional variables associated with QoL in schizophrenia at increased statistical significance. Moreover, this approach allowed us to weigh the effect of all variables in one model. In line with our findings, a recent meta-analysis also found a substantial association between depressive symptoms and personal recovery, a concept related to QoL.Reference Van Eck, Burger, Vellinga, Schirmbeck and de Haan38
Several of the variables we found to be associated with QoL in schizophrenia had, to the best of our knowledge, not been reported, such as disorganisation, obsessive–compulsive symptoms, suicidal attempts, unmet needs, akathisia and cannabis craving. Although the underlying mechanisms of this latter association are still unclear, one may speculate that cannabis craving constitutes a proxy for cannabis abstinence, which in turn may increase anxiety and thus reduce psychological well-being. Alternatively, relatively high levels of cannabis dependence may worsen symptoms and thus negatively affect QoL.
Genetic predisposition to schizophrenia captured by PRS showed clear and persistent effects on QoL across all Pts. We also observed moderate effects of polygenic susceptibility to subjective well-being on QoL and no independent effects of genetic predisposition to MDD on QoL in our cohort. Intriguingly, although statistical power for PRSs derived from large GWAS cohorts is usually relatively large, we found stronger associations for schizophrenia PRS (GWAS N = 36 989 cases and 113 075 controls) than for MDD PRS (GWAS N = 135 458 cases and 344 901 controls) and subjective well-being PRS (GWAS N = 298 420). Possibly, genetic architecture (relatively large SNP-based heritability for schizophrenia) and case–control ascertainment (relatively low numbers of incorrectly diagnosed controls in schizophrenia) explain a stronger association signal for schizophrenia PRS with QoL. Alternatively, QoL in schizophrenia may simply be more genetically related to schizophrenia than MDD, given how the nature of the disease affects QoL in people who suffer from it. Hypothetically, MDD and subjective well-being PRSs may be stronger determinants of QoL in people who do not suffer from schizophrenia.
The current study benefits from a large sample size of a multicentre, prospective cohort study in The Netherlands, with comprehensive phenotypic assessments in individuals with schizophrenia. The large sample size increases precision and reliability of our findings. The combination of a large sample size and rich phenotyping created a unique opportunity for a phenome-wide study to identify contributing factors to QoL in schizophrenia. In addition, carefully selected participants from several geographical locations restricted the risk of selection bias. On the other hand, several limitations should be borne in mind when interpreting our results. First, interpretation of principal component-driven variables may not be intuitive. Here, we managed to show its feasibility and usefulness. We reduced the number of variables of the four different domains of QoL into one variable and were able to assess the impact of multiple clinical and genetic determinants on this variable. Our results showed consistency in terms of direction and magnitude of the effect estimate when compared with ordinal domains of QoL (Supplementary Fig. 3). Second, we are aware of the relatively low power for genetic studies on a complex trait such as QoL, both in our GWAS and linkage disequilibrium score regression analyses. Our GWAS must therefore be regarded as a first exploratory GWAS of QoL in patients with schizophrenia, their siblings and healthy controls. Similarly, for linkage disequilibrium score regression, we were underpowered to reveal clear genetic correlations. Linkage disequilibrium score regression analysis was done to explore possible genetic correlations with traits different from the ones we investigated, and to investigate whether the trait with most significant genetic correlation results was identical to the trait with most significant PRS results, which indeed turned out to be the case. Third, in the study population, about 97% of participants were White, which hampers generalisability to other ethnicities. Fourth, given the uniqueness of our cohort and the lack of QoL phenotyping data in other cohorts, we were unable to perform replication analyses. We encourage researchers to collect QoL and genome-wide data to allow for such replication efforts. Finally, our association analyses preclude us from drawing definite conclusions about causality. Future, well-powered, prospective studies are necessary to improve insight into possible causal mechanisms.
In conclusion, we highlight multiple clinical and genetic associations with QoL that could be leveraged in daily care of patients with schizophrenia to improve their QoL. The variables highlighted in the current study could aid health professionals who interact with patients with psychosis to more readily recognise the need for additional interventions in patients showing a high burden of such phenotypes. For example, although high levels of positive and negative symptoms are intuitively associated with QoL, disorganisation, cannabis craving and obsessive–compulsive symptoms are also important contributors, according to our analyses. Genetic risk scoring may furthermore be used to optimise identification of those patients with schizophrenia who are susceptible to low QoL, which in turn may advance timely management for these vulnerable patients.
Supplementary material
Supplementary material is available online at https://doi.org/10.1192/bjo.2020.140
Data availability
All authors have continuous access to the data, both phenotypic and genotypic, collected in this study. Summary data are available upon reasonable request.
Author contributions
All authors were involved in writing the manuscript. Statistical analyses were done by R.P., B.D.L., K.R.v.E., D.S. and S.d.Z. S.G. and J.J.L. supervised this work. J.J.L. and R.P. conceived the study. J.J.L., R.P. and B.D.L. wrote the first draft.
Funding
The infrastructure for the GROUP study is funded through the Geestkracht programme of the Dutch Health Research Council (Nederlandse organisatie voor gezondheidsonderzoek en zorginnovatie, grant number 10-000-1001), and matching funds from participating pharmaceutical companies (Lundbeck, AstraZeneca, Eli Lilly, Janssen Cilag) and universities and mental healthcare organisations (Amsterdam: Academic Psychiatric Centre of the Academic Medical Center and the mental health institutions at Geestelijke Gezondheidszorg (GGZ) Ingeest, Arkin, Dijk en Duin, GGZ Rivierduinen, Erasmus Medical Centre and GGZ Noord Holland Noord; Groningen: University Medical Center Groningen and the mental health institutions at Lentis, GGZ Friesland, GGZ Drenthe, Dimence, Mediant, GGNet Warnsveld, Yulius Dordrecht and Parnassia Psycho-Medical Center The Hague; Maastricht: Maastricht University Medical Centre and the mental health institutions at GGZ Eindhoven en De Kempen, GGZ Breburg, GGZ Oost-Brabant, Vincent van Gogh voor Geestelijke Gezondheid, Mondriaan, Virenze riagg, Zuyderland GGZ, MET ggz, Universitair Centrum Sint-Jozef Kortenberg, Collaborative Antwerp Psychiatric Research Institute University of Antwerp, Psychiatrisch Centrum Ziekeren Sint-Truiden, Psychiatrisch Ziekenhuis Sancta Maria Sint-Truiden, GGZ Overpelt and Openbaar Psychiatrisch Zorgcentrum Rekem; Utrecht: University Medical Center Utrecht and the mental health institutions Altrecht, GGZ Centraal and Delta).
Declaration of interest
None.
ICMJE forms are in the supplementary material, available online at https://doi.org/10.1192/bjo.2020.140.


 Open access
eLetters
No eLetters have been published for this article.