- Research
- Open access
- Published:
Visualization of real-time monitoring datagraphic of urban environmental quality
EURASIP Journal on Image and Video Processing volume 2019, Article number: 42 (2019)
Abstract
Quality of urban environment directly affects people health, and it is important to understand the real-time status of urban air quality. Air quality monitoring, data analysis, and visualization can grasp the concentration data of air pollutants in cities. In view of the current air quality monitoring using digital displays, it is difficult for users to intuitively determine the air pollution level with unsatisfied interaction mode of the data query. Using the real-time monitoring data of 23 observation points in Beijing, the work based on Google Earth applied Keyhole Markup Language (KML) for the visualization of air monitoring data. The interactive query makes it easier for users to query air quality, and gradually varied color can visually highlight the air quality level. Visualization of data has stronger expression (more images and more intuitive) than the original data table, which is beneficial for further analysis of data.
1 Introduction
The quality of the urban environment is related to the health of urban residents. Under global warming and urbanization, population concentration is getting higher and higher, with urban environmental quality becoming prominent. The coordinated development of human settlements and urbanization has become the focus in the world. At 2017 World Climate Conference in Copenhagen, members, focusing on energy conservation and emission reduction as well as the ecology and low carbon development, signed the Copenhagen Accord [1].
At present, most cities have established the complete monitoring system for environmental quality to measure six parameters (PM2.5, PM10, SO2, NO2, CO, O3) of air quality index (AQI), wind direction, noise, temperature and humidity, negative oxygen ions, and light, wherein AQI is the focus of real-time monitoring, especially for PM2.5 and PM10, because respirable particulate matter is a typical carcinogen. Urban air pollution leads to an increase in cancer incidence, and people can reduce outdoor activities due to air pollution. Real-time monitoring of air quality has the advantages such as guiding the travel of residents, regulating urban infrastructure traffic, strengthening medical care for respiratory diseases, and insisting environmental protection departments for reducing/stopping production of pollution-emitting enterprises.
As early as 1996, China formulated Ambient Air Quality Standard, which details the classification of urban air quality, standard classification, major pollutants, and their concentration limits at various levels. At present, China’s industry is still a traditional energy consumption structure. For economic development, a large amount of petrochemical energy such as coal and oil is consumed every year, causing serious pollution to the air. In winter in the north, extreme foggy weather appears due to heating, which leads to school suspension, factory shutdowns, and traffic control. It is the basis for improving urban air quality and the guarantee for the health of the masses by integrating computer network, air quality sensing, and data visualization into an urban air quality monitoring system.
Advances in current sensor technology and Internet of Things technology have made it possible to monitor air quality in various areas of the city in real time. However, the large amount of data collected in real time brings inconvenience to analysis and processing. Explosively growing big data sometimes exceeds the processing power of the system, and existing data mining techniques only use the tip of the iceberg [2]. Data visualization can transform data into intuitive graphical images and provide interaction and analysis between the server and users, showing the valuable rules between complex and massive data [3]. Data visualization is used to integrate the high-bandwidth, high-speed, and large-capacity storage vision system with the computer system of powerful computing and logic judgment. The graphic visualization of real-time data of urban air quality displays the air quality data obtained by real-time monitoring, enabling users to efficiently capture hidden features and patterns in big data. Without efficient datagraphic visualization analysis, it is impossible to achieve good management of urban air quality.
Based on Google Earth, the work proposed a graphical visualization method for real-time monitoring data of urban air quality, which is helpful to grasp the change and development trends of urban air quality and control pollution. It has theoretical significance and practical value for environmental management and public services.
2 Methods for visualized analysis
2.1 Visualized analysis of air quality data
There are a number of visualization methods available for analysis and processing of air quality data with one or more visualization tools. Qu et al. [4] used S-shaped parallel coordinates, a weighting map, and a polar coordinate system embedded in circular pixel strips to analyze the fog and haze of Hong Kong. Li et al. [5] used a multi-dimensional view to analyze air quality and meteorological data. A correlation detection view is proposed to visualize the change of air quality. Liao et al. [6] used the networked visualized analysis system to monitor air quality data in Beijing, with Geographical Information System (GIS), parallel coordinate, and splattering. Li et al. [7] analyzed the air pollution data in Beijing and used a two-dimensional diagram for the pollution levels of areas. Visualization for data analysis is difficult for ordinary users to understand, because the two-dimensional diagram of the data often fails to meet the growing demands of air quality information systems. Data should be presented in an interesting and easy-to-understand format to deliver information to end users.
In 2010, Canadian researches Aaron Van Daniela and Randall Martin added the total amount of aerosols monitored by NASA (National Aeronautics and Space Administration) satellites and superimposed them on the vertical distribution of aerosols calculated by computer models to obtain the global image of PM2.5 concentration distribution. PM2.5 pollution in China is very serious, and Shandong Province in China is the most polluted area of PM2.5 in the world. There is a common flaw in most of these traditional data visualization methods—they separate the relationship between air quality and time and space and statically calculate air quality data in the past. It cannot display air quality dynamically in real time, with no good predictability of future air quality.
2.2 Google Earth-based visualization system
Google Earth is a virtual Earth software developed by Google Inc., which arranges satellite photos, aerial photography, and GIS on a three-dimensional model of the Earth. Users can view high-definition satellite images from the world for free through the client software of Google Earth. The satellite images, not from a single data source, are the data fusion of satellite imagery and aerial imagery.
Charts are represented in a fixed scene in traditional air quality visualization methods and cannot be dynamically updated based on changes in location and real-time data. However, to master the air quality of a single city or a group of cities, it is impossible to rely on static charts without user interaction. The air quality of a city exists under specific time and space, and the charts are meaningless if it is deviating from geographical location and observation time.
Using Google Earth to visualize urban air quality combines air quality information with time and space. It visualizes massive amounts of air quality data in an intuitive and vivid way, breaking traditional patterns of data, formulas, and charts that express air quality. The simulation on the 3D virtual Earth platform can obtain the dynamic change of air quality to enhance the authenticity of data visualization of air quality. It is easy for users to understand and conducive to providing decision support for public management and improving urban air quality.
Figure 1 shows the average PM2.5 air quality index of monthly and weekly hotlist in the traditional table. Figure 2 shows the design sketch of data visualization based on Google Earth. From the comparison, the use of Google Earth to achieve data visualization of air quality is more intuitive and provides more images.

Average PM2.5 air quality index of monthly and weekly hotlist in the traditional table

Design sketch of data visualization based on Google Earth
At present, many scholars have performed lots of useful work in this field. Environmental information is integrated into Google Earth [8], and visual dynamic playback of pollution distribution is implemented based on Google Earth [9]. Urban air pollution is investigated by Google Earth with detailed explanation [10]. Google Earth is applied to the simulation of urban air pollution spread. Based on the distribution of atmospheric pollution concentration, dangerous areas are drawn in the urban map of Google Earth, providing the basis for emergency decision-making [11]. The data of 3D scanning lidar is integrated into Google Earth to observe real-time atmospheric pollution. The visualization of information can quickly determine the location of pollution sources and assess which areas are seriously affected [12].
3 Data visualization of urban air quality
3.1 Keyhole Markup Language (KML)
KML is a markup language based on XML standard, which uses a markup structure with nested elements and attributes to express geotagging. KML files are written according to the KML language, widely used in software such as Google Earth, Google Map, and Google Maps for mobile [13]. The basic structure of a KML file is shown in a KML code, which uses a yellow pushpin to mark a location on the surface of the Earth. Place mark is the most commonly used geographic feature in Google Earth.
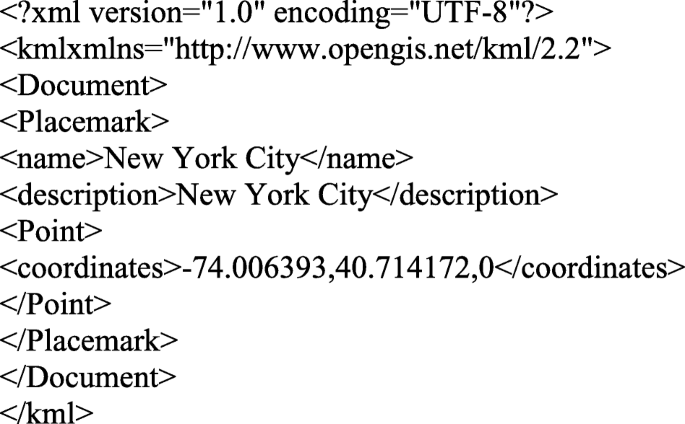
KML files are used to exchange geographic data in Google Earth. File-based data exchange has been one of the main ways of software data exchange. KML files define a number of TAGS used to specify how geographic data is displayed. Geographic features that can be defined include locations, descriptions, overlays, paths, and polygons.
3.2 Public data of air quality
With the rapid development of Internet technology, local government agencies provide public data on air quality monitoring to protect the health of the people. USA, Britain, Australia, and Canada have operated public data sites. For example, the US AirNow website specializes in providing air quality data and its impact on human health, helping people to make healthy behaviors based on different air quality [14]. UK Air Quality Archive is the UK’s authoritative platform of air quality query. The Chinese government has also established numerous public data sites. However, regarding air pollution data, the public generally obtains data from the mass media. Since numerical data is difficult to understand, it is necessary to visualize the data.
The work studied Beijing, which is located at 39″ 26′ to 41″ 03′ north latitude and 115″ 25′ to 117″ 30′ east longitude on the northwestern edge of the North China Plain with a total area of 164.1 thousand square kilometers and an urban area of 1401 thousand square kilometers. The west, north, and northeast of Beijing are surrounded by mountains, and the southeast is a large plain that slowly slopes towards the Bohai Sea. The altitude of the Beijing Plain is 20 to 60 m, and the mountain is generally 1000 to 1500 m above the sea level.
The real-time monitoring data of air quality in the work comes from the Beijing Municipal Environmental Monitoring Center established in 1974. The center is the first-level station of national environmental monitoring that provides environmental quality monitoring of environmental factors (such as atmosphere, water, noise, soil, and ecology), the monitoring of pollution sources, and the emergency monitoring of sudden pollution accidents in Beijing. Figure 3 shows the distribution of environmental assessment points in 23 districts across Beijing. The website’s data is updated every half hour, and the data of urban air quality can be obtained by the Web Service interface. Table 1 shows the specific parameters and sample data of air quality data in the work. The data also includes other information such as weather forecast, wind direction, typhoon, and monitoring station. Only air pollution data is used in the work.
In Table 1, AQI represents air quality index with no unit in the range of 0–500, O3/8 h the average concentration of ozone within 8 h, PM2.5 the particles with a diameter of less than 2.5 μm, and PM10 the particles with a diameter of less than 10 μm.

Distribution of 23 air quality observation points in Beijing
3.3 Visualization process of air quality data
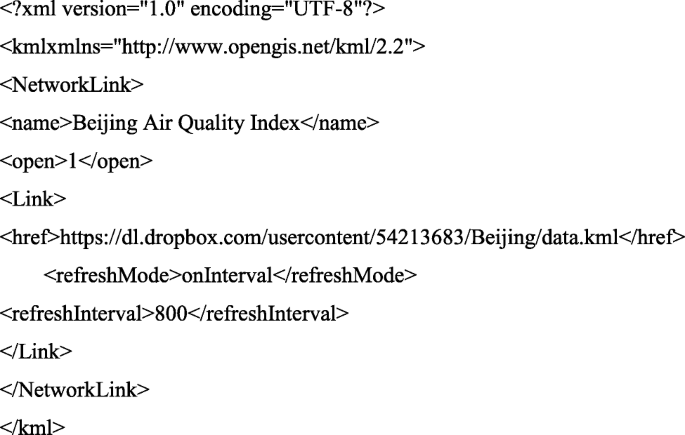
To improve the intuitiveness of air quality data, the work implemented data visualization of air quality based on Google Earth and KML. The real-time monitoring data of air quality was obtained from the Beijing Municipal Environmental Monitoring Center, stored in the server with regular update. By developing and applying the KML Generator program, the Web Service was used to request air quality data from the server and visualize the data by Google Earth. The generated KML code and its URL were stored in the public folder of Dropbox. They were linked to Google Earth via KML network links that read air quality data in the server in real time [15,16,17]. Once the server is properly configured with the shared URL of KML files, users who have installed Google Earth can view KML files hosted in the public web server. Figure 4 shows the specific process of reading data and visualizing air quality data using KML files.

Process of reading air quality data and data visualization
The KML code for real-time visualization of air quality using KML network link is shown below. The data in the server is read periodically, with the display refreshed at a specified time interval [18, 19].
3.4 KML Generator program
KML Generator program requests the server to read the air quality data through the longitude and latitude of each observation point. Figure 5 shows the structure of KML files generated after obtaining the data. Each observation point corresponds to a folder containing <name>, <description>, and six <Placemark> tags. <name> indicates the name of the observation point, <description> shows a brief description of the observation area, and six <Placemark> corresponds to six kinds of polluting gases (including names and short descriptions). <Style> label indicates the color of each contaminant. The transparency of color depends on the level of contamination in the observation area—the darker color means the higher level of contamination.

KML structure for visualization of the pollution level in the observation area
3.5 Visualization of air quality
Figure 6 shows the visualization of air pollution data using KML and Google Earth. In the distribution of AQI, red indicates the high concentration of air pollutants, and blue the low concentration. The air pollution concentration is low in the north and high in the south, which is consistent with the geographical environment of Beijing. Forested land and orchards are mainly in the northern mountain areas of Beijing, with less settlements, factories, and roads. The south-central part is a bustling and crowed urban area with dense personnel and vehicles, resulting in a significantly lower air quality than the north. For the distribution of specific pollutants such as PM2.5, PM10, SO2, and NO2, users can switch to the single-pollutant distribution mode by clicking the label. The visualization in Fig. 6 can only show the overall air quality. More specific visualization results can be obtained by the interactive query in Google Earth.

Average AQI heat map in Beijing
4 Results and discussion
Visual interactive query allows users to learn more specific air quality values, performing a series of selection operations through the interactive graphical interface to query. Users intuitively transmit the query without complex query statements. The data shorted in the server can be directly read and written into KML format recognized by Google Earth [20,21,22]. The template changes according to different needs, and the air quality data is displayed in Google Earth with various forms.
Figure 7 shows the real-time AQI query for the area around Shunyi New City observation point. Users simply click on the observation point indicated by the red arrow in the graph to pop up the query results. In general, the size of the display screen is limited. To make users focus on a certain detail while browsing Google Earth, animation or a pop-up window (used in the work) is required to attract users’ attention.

Interactive query of air quality
To show the dynamic change process of the AQI in the past 24 h, a histogram is used to combine the cylinders of different colors to represent the AQI value. The green cylinder indicates the air quality level is excellent, with an AQI value between 0 and 50. The yellow one indicates the air quality level is good, with an AQI value between 0 and 50. The deepest purple indicates the air quality is severely polluted, with an AQI value greater than 300. For each air quality level, the effects of air on human health and recommended actions are briefly introduced. In this way, the overall understanding of Fig. 6 can be gradually refined to understand the specific air quality of each area.
Figure 8 shows the variation of contaminants within 24 h—six pollutants, temperature, pressure, and humidity. The horizontal axis in the bar chart is the time axis, indicating the last 48 h from now. The vertical axis represents the parameter values. On the far right is the actual value range of the parameter value within 48 h, not the theoretical value range of the parameter. The higher the cylinder height, the closer the parameter value is to the maximum value. The colors of the cylinder further distinguish different parameter values. As the color changes, the corresponding parameter value gradually becomes large. It shows the changes in air quality over the past period of time, and a rough estimate can be made accordingly on the concentration of each pollutant over a period of time. After the analysis process of more data, the laws implied in the big data make the air quality data more valuable.

Multiple air quality parameters
5 Conclusions
With the development of social economy, a large amount of harmful substances generated by industrial production and automobile exhaust gas are discharged into the air, causing serious air pollution. It is the most serious environmental problem facing most industrial cities in the world. Taking Beijing as an example, the work used the real-time monitoring data of 23 observation points throughout the city to visualize the monitoring data in the Google Earth. Users can understand the air quality distribution from a macro perspective or obtain the specific air quality data by the interactive query to understand the time trends of air pollution, pollutants, and air quality levels in different regions at different times.
In the future work, it is necessary to study the cloud storage for the data of each observation point, the storage of more data in a lone time range, and the acquisition of complete data information for further analysis and utilization of data. On the other hand, the reasonable air quality prediction model with big data will be studied to predict the air quality, thus meeting the needs of the public.
Abbreviations
- AQI:
-
Air quality index
- GIS:
-
Geographical Information System
- KML:
-
Keyhole Markup Language
- NASA:
-
National Aeronautics and Space Administration
References
Doniger D (2009) The Copenhagen Accord: a big step forward, NRDC Climate Center. Accessed 21 Dec 2009
H. Mayer, J. Holst, D. Schindler, D. Ahrens, Evolution of the air pollution in SW Germany evaluated by the long-term air quality index LAQx. Atmos. Environ. 42(20), 5071–5078 (2008)
Sarkar, D. (2008). Lattice: multivariate data visualization with R. Springer Science & Business Media
H. Qu, W.Y. Chan, A. Xu, K.L. Chung, K.H. Lau, P. Guo, Visual analysis of the air pollution problem in Hong Kong. IEEE Trans. Vis. Comput. Graph. 13(6), 1408–1415 (2007)
J. Li, Z. Xiao, H.Q. Zhao, Z.P. Meng, K. Zhang, Visual analytics of smogs in China. J. Vis. 19(3), 461–474 (2016)
Z. Liao, Y. Peng, Y. Li, X. Liang, Y. Zhao. A web-based visual analytics system for air quality monitoring data, 2014 22nd International Conference on Geoinformatics, Kaohsiung, The Institute of Electrical and Electronics Engineers, INC. 1-6 (Piscataway, NJ, 2014)
H. Li, H. Fan, F. Mao, A visualization approach to air pollution data exploration—a case study of air quality index (PM2. 5) in Beijing, China. Atmosphere 7(3), 35 (2016)
N. Kussul, A. Shelestov, S. Skakun, Grid and sensor web technologies for environmental monitoring. Earth Sci. Inf. 2(1–2), 37–51 (2009)
R. Varatharajan, G. Manogaran, M.K. Priyan, V.E. Balaş, C. Barna, Visual analysis of geospatial habitat suitability model based on inverse distance weighting with paired comparison analysis. Multimed. Tools Appl. 77(14), 17573–17593 (2018)
M.J. URBAN, in 2009 Portland GSA Annual Meeting. Using Google Earth to examine metropolitan air pollution (2009)
Y. CHU, D. LIANG, J. GUO, X. FENG, J. FANG, Y. CHEN, Z. ZHANG, Z. YIN, Analysis of urban air pollution diffusion simulation based on Google Earth. Ind. Saf. Environ. Prot. 40(09), 36–39 (2014)
C. Chiang, J. Nee, S. Das, S. Sun, Y. Hsu, H. Chiang, et al., in AGU Fall Meeting Abstracts. Incorporation of 3-D scanning lidar data into Google Earth for real-time air pollution observation (2011)
M. Silberbauer, W. Geldenhuys, in Academic track of the 2008 Free and Open Source Software for Geospatial (FOSS4G) Conference, incorporating the GISSA 2008 Conference, Cape Town, South Africa. Using keyhole markup language to create a spatial interface to South African water resource data through Google Earth (2008)
T. LU, Application of AIRNow ambient air quality notification system of USA in Shanghai. Environ. Monit. Forewarning 3(01), 4–7 (2011)
S. Tavani, P. Granado, A. Corradetti, et al., Building a virtual outcrop, extracting geological information from it, and sharing the results in Google Earth via OpenPlot and Photoscan: an example from the Khaviz Anticline (Iran). Comput. Geosci. 63, 44–53 (2014)
A. Chen, G. Leptoukh, S. Kempler, C. Lynnes, A. Savtchenko, D. Nadeau, J. Farley, Visualization of A-Train vertical profiles using Google Earth. Comput. Geosci. 35(2), 419–427 (2009)
A. Triantafyllou, A. Watlet, C. Bastin, Geolokit: an interactive tool for visualising and exploring geoscientific data in Google Earth. Int. J. Appl. Earth Obs. Geoinf. 62, 39–46 (2017)
Q. Zhou, Multi-layer affective computing model based on emotional psychology. Electron. Commer. Res. 18(1), 109–124 (2018)
Q. Zhou, J. Luo, The study on evaluation method of urban network security in the big data era. Intell. Autom. Soft Comput. 24(1), 133–138 (2018)
M. Richards, M. Ghanem, M. Osmond, Y. Guo, J. Hassard, Grid-based analysis of air pollution data. Ecol. Model. 194(1–3), 274–286 (2006)
D. Christin, A. Reinhardt, S.S. Kanhere, M. Hollick, A survey on privacy in mobile participatory sensing applications. J. Syst. Softw. 84(11), 1928–1946 (2011)
E. Kanjo, Noisespy: a real-time mobile phone platform for urban noise monitoring and mapping. Mob. Netw. Appl. 15(4), 562–574 (2010)
Acknowledgements
Thank for the editor and reviewers.
Funding
No funding was received.
Availability of data and materials
Data will not be shared; reason for not sharing the data and materials is that the work submitted for review is not completed. The research is still ongoing, and those data and materials are still required by my team for further investigations.
Author information
Authors and Affiliations
Contributions
PC designed the research, analyzed the data, and wrote and edited the manuscript. The author read and approved the final manuscript.
Corresponding author
Ethics declarations
Ethics approval and consent to participate
I approved.
Consent for publication
I agree.
Competing interests
The author declares that he has no competing interests. He has seen the manuscript and approved its submission to the journal. The author confirmed that the content of the manuscript has not been published or submitted for publication elsewhere.
Publisher’s Note
Springer Nature remains neutral with regard to jurisdictional claims in published maps and institutional affiliations.
Rights and permissions
Open Access This article is distributed under the terms of the Creative Commons Attribution 4.0 International License (http://creativecommons.org/licenses/by/4.0/), which permits unrestricted use, distribution, and reproduction in any medium, provided you give appropriate credit to the original author(s) and the source, provide a link to the Creative Commons license, and indicate if changes were made.
About this article

Cite this article
Chen, P. Visualization of real-time monitoring datagraphic of urban environmental quality. J Image Video Proc. 2019, 42 (2019). https://doi.org/10.1186/s13640-019-0443-6
Received:
Accepted:
Published:
DOI: https://doi.org/10.1186/s13640-019-0443-6