


Abstract
Immune escape is a fundamental trait of cancer in which mechanistic knowledge is incomplete. Here, we describe a novel mechanism by which hypoxia contributes to tumoral immune escape from cytotoxic T lymphocytes (CTL). Exposure of human or murine cancer cells to hypoxia for 24 hours led to upregulation of the immune inhibitory molecule programmed cell death ligand-1 (PD-L1; also known as B7-H1), in a manner dependent on the transcription factor hypoxia-inducible factor-1α (HIF-1α). In vivo studies also demonstrated cellular colocalization of HIF-1α and PD-L1 in tumors. Hypoxia-induced expression of PD-L1 in cancer cells increased their resistance to CTL-mediated lysis. Using glyceryl trinitrate (GTN), an agonist of nitric oxide (NO) signaling known to block HIF-1α accumulation in hypoxic cells, we prevented hypoxia-induced PD-L1 expression and diminished resistance to CTL-mediated lysis. Moreover, transdermal administration of GTN attenuated tumor growth in mice. We found that higher expression of PD-L1 induced in tumor cells by exposure to hypoxia led to increased apoptosis of cocultured CTLs and Jurkat leukemia T cells. This increase in apoptosis was prevented by blocking the interaction of PD-L1 with PD-1, the PD-L1 receptor on T cells, or by addition of GTN. Our findings point to a role for hypoxia/HIF-1 in driving immune escape from CTL, and they suggest a novel cancer immunotherapy to block PD-L1 expression in hypoxic-tumor cells by administering NO mimetics. Cancer Res; 74(3); 665–74. ©2013 AACR.
Introduction
An important feature of malignant progression is the selection of tumor cell variants that are capable of escaping detection and destruction by the innate and adaptive arms of the immune system (1). There is evidence that tumor cells can escape from adaptive immunity by increasing their surface expression of inhibitory B7 costimulatory molecules (2, 3). These cell surface molecules are members of a family of activating and inhibitory costimulatory ligands with important roles in the regulation of CTL responses (3). A member of this family of molecules, programmed cell death ligand-1 (PD-L1, also known as B7-H1), is expressed in human and rodent tumors to provide negative signals that suppress CTL responses.
PD-L1 interacts with the programmed cell death-1 (PD-1) receptor on activated CTLs to inhibit immune responses via mechanisms that include induction of apoptosis and anergy in the CTLs (4). Although the mechanisms regulating PD-L1 expression have not been fully elucidated, interferon-γ (IFN-γ) was shown to stimulate the expression of PD-L1 in cancer cell lines (5). In addition, signaling via phosphatase and tensin homolog/phosphatidylinositol-3-kinase (PTEN/PI3K) was linked to the posttranscriptional regulation of PD-L1 expression (6). Interleukin (IL)-10, VEGF, activation of Toll-like receptor-4, and signaling via extracellular signal-regulated kinase, were also reported to increase PD-L1 expression (7–9).
Many studies have demonstrated the important contribution of hypoxia to the acquisition of malignant properties in cancer cells such as drug resistance (10) and metastatic ability (11–13); however, the effect of hypoxia on tumor immune escape remains poorly understood. We previously showed that exposure of tumor cells to hypoxia increases their intrinsic resistance to lysis mediated by innate immune effector cells (14, 15). In the present study, we investigated whether exposure of tumor cells to hypoxia increases their resistance to adaptive (T cell-mediated) immunity. We report here that hypoxia increases the expression of PD-L1 in human breast and prostate cancer cells, as well as in mouse melanoma and mammary carcinoma cells, and that increased expression of these inhibitory molecules leads to resistance to CTL-mediated lysis.
Materials and Methods
Cell lines
Human MDA-MB-231 breast cancer cells, human DU145 prostatic carcinoma cells, human Jurkat leukemia T cells, and mouse B16-F10 melanoma and 4T1 mammary carcinoma cells were obtained from the American Type Culture Collection. MDA-MB-231 and DU145 cells were cultured in RPMI 1640 medium (Invitrogen) supplemented with 5% FBS, whereas Jurkat cells were cultured in RPMI 1640 medium supplemented with 10% FBS. Mouse B16-F10 cells were maintained in Dulbecco's Modified Eagle Medium (DMEM) supplemented with 10% FBS. Mouse B16-OVA melanoma cells were kindly provided by Dr. Scott A. Gerber (University of Rochester Medical Center, Rochester, NY), and were maintained in RPMI 1640/10% FBS medium supplemented with G418 (100 μg/mL). The authenticity of these cell lines has not been verified in the last six months. All experiments were conducted using cultures not exceeding 60% to 70% confluence to avoid pericellular hypoxia induced by overconfluence.
Blocking antibodies
To block human PD-L1 or PD-1 function, we used anti-human PD-L1 antibody (4 μg/mL; BioLegend; Cat. #329702) or anti-human PD-1 (2 μg/mL; R&D Systems; Cat. #AF1086). To block mouse PD-L1 or PD-1 (CD279), we used anti-mouse PD-L1 antibody (2 μg/mL; eBiosciences; Cat. #16-5982-81) or anti-mouse PD-1 antibody (anti-CD279; 1 μg/mL; BD Pharmingen; Cat. #551891), respectively.
mRNA knockdown
Knockdown of human hypoxia-inducible factor-1α (HIF-1α) or PD-L1 (CD274) expression was achieved using Silencer-validated siRNA #42840 or Silencer Select siRNA #s26547 (Ambion Inc.), respectively. To knock down mouse PD-L1 (CD274) or mouse HIF-1α, we used Silencer Select siRNA #s82016 or #s67530 (Ambion Inc.), respectively. Silencer Negative Control siRNA #2 (Ambion Inc.) was used as control. The siRNA (25 nmol/L final concentration) was introduced into cells using siPORT NeoFx reagent (Ambion Inc.) according to the manufacturer's instructions. Treatments with siRNA were performed 24 hours before incubation in hypoxia or standard conditions.
Exposure to different levels of oxygen
Tumor cell cultures were incubated under control (20% O2) or hypoxic (0.5% O2) conditions for 24 hours as described previously (15). Culture conditions included incubations in the absence or presence of glyceryl trinitrate (GTN; 10 nmol/L) or blocking antibodies. In some experiments, DU145 cells were incubated in 20% O2 for 24 hours in the presence of the hypoxia mimic cobalt chloride (100 μmol/L). Pilot studies revealed that CD3+ lymphocytes showed signs of apoptosis when incubated in 20% O2. Therefore, control groups of coculture experiments involving CD3+ lymphocytes were conducted in 8% O2 to simulate more physiologic oxygen concentrations.
Determination of PD-L1 and HIF-1α expression
Relative levels of PD-L1 mRNA in tumor cells were determined by quantitative reverse transcriptase PCR (qRT-PCR) using a Roche LightCycler 480 instrument. A cDNA obtained using a Qiagen Omniscript Reverse Transcription Kit (Qiagen Inc.) was used as template in qRT-PCRs. PCRs included primers for human PD-L1 spanning exons 3 and 4 (forward: 5′-TGTACCGCTGCATGATCAG′, reverse: 5′-AGTTCATGTTCAGAGGTGACTG-3′; Eurofins MWG Operon) and SYBR Green (Fast Start SYBR Green Master, Roche Diagnostics Canada). Human β-actin primers (forward: 5′ TGGGACGACATGGAGAAAAT 3′, reverse: 5′ GAGGCGTACAGGGATAGCAC 3′, Eurofins MWG Operon) were used to generate standard curves. The following program was used for PCRs for human genes: 95°C for 3 minutes, then 50 cycles: 95°C for 20 seconds, melting temperature (Tm) 60°C for 20 seconds, 72°C for 20 seconds. Primers used to amplify mouse PD-L1 were: forward 5′-GACCAGCTTTTGAAGGGAAATG-3′, and reverse 5′-CTGGTTGATTTTGCGGTATGG-3′ (Eurofins). Primers used to amplify mouse 18S were: forward 5′ -GTAACCCGTTGAACCCCATT-3′, and reverse 5′-CCATCCAATCGGTAGTAGCG-3′ (Eurofins). The following program was used for PCRs for mouse genes: 95°C for 3 minutes, then 50 cycles: 95°C for 20 seconds, Tm 55°C for 20 seconds, 72°C for 20 seconds.
Cellular HIF-1α and PD-L1 protein levels were determined in total cell extracts by Western blot analysis. Antibodies used included monoclonal mouse anti-human PD-L1 antibody (1/250 dilution; R&D Systems; MAB156), rat anti-mouse PD-L1 antibody (1/250 dilution; eBiosciences; 14-5982-82), and monoclonal mouse anti-human HIF-1α antibody (1/250 dilution; BD Biosciences; # 610958). Membranes were probed for β-actin or α-tubulin to control for differences in the loading of the gels. Corresponding bands were detected by enhanced chemiluminescence. Alternatively, surface PD-L1 levels were measured in B16-OVA cells by flow cytometry using rat anti-mouse PD-L1 antibody (eBiosciences; #14-5982-82) and a standard protocol.
Overexpression of HIF-1α in MDA-MB-231 cells
Plasmid DNA (either pCMV6-kan/neo empty vector or pCMV6-kan/neo vector expressing nonmutant HIF-1α; generously provided by Dr. Lynne Postovit, Department of Oncology, University of Alberta, Edmonton, Canada) was introduced into MDA-MB-231 cells at a concentration of 2.5 μg/well using Lipofectamine 2000 (5 μL/well; Invitrogen). Following a 24-hour incubation in 20% O2, the medium was replaced and cells were allowed to recover for another 24 hours. Cells were then harvested, lysed, and the protein was extracted and used for Western blot analysis.
Identification of HIF-1α–binding sites in PD-L1
Canonical hypoxia response elements (HRE; TACGTG) within genomic sequences of PD-L1 were first identified using the Ensembl genome browser (URL: http://useast.ensembl.org/index.html). Two potential HIF-1α–binding sites were mapped. The first HRE (HRE1) is located between exons 1 and 2, 4,559 bp downstream from the start of exon 1 [ENSE00001892659]. The second HRE (HRE2) is located between exons 4 and 5, 1,545 bp downstream from the start of exon 4 [ENSE00000813157]. To determine whether indeed these are bona fide HIF-1α–binding sequences, we performed chromatin immunoprecipitation (ChIP) using an ExactaChIP Human/Mouse HIF-1α Chromatin Immunoprecipitation Kit (R&D Systems) according to the instructions provided with the kit. Precipitated DNA was amplified using primers flanking the putative HREs. Primers for HRE1 were: forward 5′- GGAACATTAATCTCCTGTCTTATATAGC-3′ (Tm: 61.5) and reverse 5′-TCTCCCTCTTCTGTTATACATATATTTACA-3′ (Tm: 62.2). Primers for HRE2 were: forward 5′-TGGCCTACAGTAACTCACCT-3′ (Tm: 62.3) and reverse 5′-CCGTAACTTACAGTTTACAATGCC-3′ (Tm: 62.0). Primers were designed using online tools from Integrated DNA Technologies (http://www.idtdna.com/).
Isolation of human CD3+ T lymphocytes and coculture experiments
Human peripheral blood lymphocytes were isolated from Ficoll-Paque–fractionated blood of healthy human donors. Blood was obtained after approval from the Faculty of Health Sciences Research Ethics Board (Queen's University) and the signing of an informed consent form. Lymphocytes were sorted using magnetic microbeads coated with anti-CD3 antibody (Miltenyi Biotec; Cat. # 130-050-101) and an autoMACS Pro Separator (Miltenyi Biotec).
To test the effect of tumor cells on lymphocyte apoptosis, human tumor cells were cocultured with either peripheral blood CTLs or Jurkat leukemia T cells. Cocultures at two different lymphocyte:tumor cell ratios (5:1 and 10:1, for CTL and Jurkat cell cocultures, respectively) were incubated under hypoxic (0.5% O2) or control (20% or 8% O2) conditions for 24 hours. CD3+ T lymphocytes were activated with human recombinant IL- 2(Sigma #17908 1,000 U/107 cells) for 24 hours. Alternatively, tumor cells were incubated in hypoxia (0.5% O2) for 24 hours before coculture in 20% O2 with IL-2–activated CD3+ CTLs for a further 24 hours. T lymphocytes were also incubated in the absence of other cells under hypoxic or control conditions to determine the potential effects of hypoxia alone on apoptosis as determined below. Expression of surface PD-1 in CD3+ peripheral blood lymphocytes and Jurkat leukemia T cells was determined by flow cytometry using phycoerythrin-labeled anti-human PD-1 (CD279) antibody (eBiosciences; Cat. #12-9969).
Generation of tumor-specific CTLs and cytotoxicity assay
To determine whether hypoxia induces resistance of tumor cells to adaptive immunity, we performed cytotoxicity assays using primed mouse CD3+ CTLs as effectors and B16-OVA or B16-F10 melanoma cells as targets, both of which express PD-L1 (16). To generate tumor-specific CTLs from precursor T cells in vivo, we followed a well-established protocol (17). Briefly, female C57Bl/6 mice (6–8 weeks old; The Jackson Laboratory) were injected intraperitoneally with 5 × 10⁶ mitomycin C-treated B16-OVA melanoma cells. Fourteen days later, mice were euthanized and their spleens were removed and passed through a fine wire mesh in order to obtain single-cell suspensions. Following lysis of red blood cells, CD3+ lymphocytes were isolated from the primed splenic lymphocytes using magnetic microbeads coated with anti-mouse CD3 antibody (Miltenyi Biotec; Cat. #130-095-130). CD3+ lymphocytes were expanded by coculture for five days with mitomycin C-treated B16-OVA cells, at a ratio of 5:1, using sensitization medium (RPMI-10 medium containing 1 mmol/L sodium pyruvate and ×1 nonessential amino acids) in the presence of recombinant IL-2 (Sigma-Aldrich; Cat. # SRP3085; 30 U/mL). Cytotoxicity was assessed by means of a LIVE/DEAD cell viability/cytotoxicity assay (Invitrogen) as we reported previously (15).
Flow cytometric assessment of apoptosis
Extent of apoptosis in CD3+CD8+ lymphocytes from coculture studies was determined by two-color flow cytometry using FITC-Annexin V (5 μL/test; BD Biosciences; #556420) as well as anti-human CD8+ phycoerythrin (PE)-tagged antibody (BD Biosciences; #555635). For determination of Jurkat cell apoptosis, an apoptosis detection kit APO-BRDU (BD Biosciences; # 556405) was used. All flow cytometric analyses were performed using a Beckman Coulter EPICS Altra HSS flow cytometer (Beckman-Coulter). Apoptotic index was determined from the percentage of apoptotic Jurkat cells, or percentage of apoptotic CD3+CD8+ relative to total CD3+ CTLs. The percentage was then normalized relative to control values (of 20% O2 exposure) for each experiment.
Tumor growth study
Female Balb/c mice (6–8 weeks old; The Jackson Laboratory) were inoculated orthotopically in the left mammary fat pad with 3.5 × 10³ syngeneic 4T1 cells in 100 μL of PBS. When the tumors reached a palpable size (50–100 mm3), mice were randomly divided in two groups: (i) 24 mice treated with 0.25 cm2 Minitran transdermal patches (3M Pharmaceuticals) delivering 1.8 μg of GTN per hour and placed on the back of the neck and (ii) 17 mice treated with transdermal placebo patches. Tumor volumes were measured every two days using digital calipers. The formula used to calculate tumor volume was length × width2 divided by 2.
Statistical analysis
GraphPad Prism software (GraphPad Software, Inc.) was used for all statistical analyses. For flow cytometry, expression was presented as percentage of positive cells, and analyzed by one-way ANOVA followed by the Bonferroni multiple comparison test. The relative means of immunoblot densitometric values were calculated (compared with α-tubulin or β-actin) and analyzed using one-way ANOVA followed by the Bonferroni' multiple comparison test. Differences were considered to be statistically significant at P < 0.05. Cytotoxicity results were analyzed by one-way ANOVA of the Y-intercepts of the linear regressions of killing curves pooled from different experiments, followed by the Bonferroni multiple comparison test to determine whether differences between individual treatment groups reached statistical significance. Two-way ANOVA followed by the Bonferroni multiple comparison test was used to determine statistical differences between cytolytic activities at individual effector-to-target ratios as well as to determine differences in 4T1 tumor growth.
Results and Discussion
Hypoxia induces PD-L1 expression in a HIF-1α–dependent manner
A 24-hour incubation of human DU145 prostate and MDA-MB-231 breast carcinoma cells in hypoxia (0.5% O2) resulted in increased PD-L1 protein levels when compared with incubation in control conditions (20% O2; Fig. 1A). HIF-1 is a heterodimeric transcription factor, consisting of HIF-1α and HIF-1β subunits, known to mediate the activation of genes involved in cellular adaptations to hypoxia. Thus, accumulation of HIF-1α under hypoxic conditions is critical for the expression of hypoxia-inducible genes. To determine if HIF-1α is required for the hypoxia-induced expression of PD-L1, we first assessed whether the levels of HIF-1α and PD-L1 are correlated in cells incubated in 20% O2, 0.5% O2, or in 20% O2 in combination with the hypoxia mimic cobalt chloride. Results of Western immunoblots revealed that there was a significant correlation (Pearson r = 0.691; P < 0.0001) between HIF-1α and PD-L1 levels in MDA-MB-231 cells incubated under these conditions for 24 hours (Fig. 1B). This correlation persisted even in some experiments in which HIF-1α levels were unusually high in cultures incubated in 20% O2. Also, when HIF-1α was overexpressed in 20% O2 in MDA-MB-231 cells transfected with a cDNA-encoding HIF-1α, PD-L1 protein expression was significantly upregulated (P < 0.01; Supplementary Fig. S1).
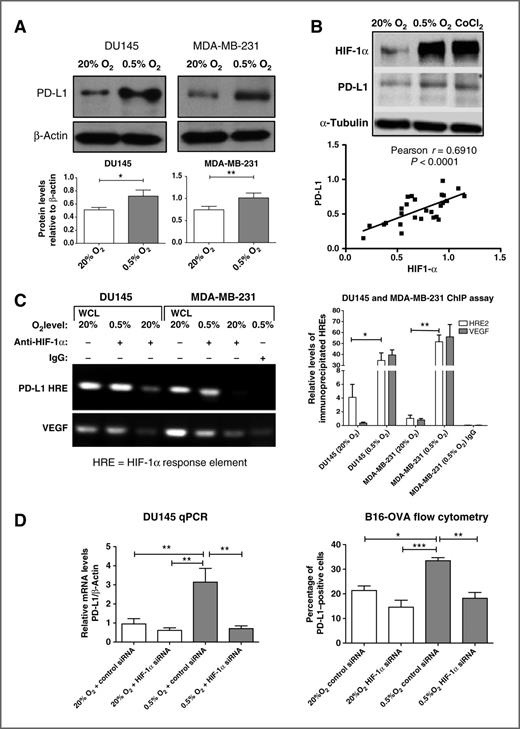
Hypoxia upregulates PD-L1 expression in a HIF-1α–dependent manner. A, Western blot analysis of PD-L1 protein in total extracts of DU145 and MDA-MB-231 cells. A, bottom, results of pooled densitometric analysis from three or more independent experiments. B, Western blot analysis of HIF-1α and PD-L1 protein in MDA-MB-231 cells following incubation in 20% O2, 0.5% O2, or cobalt chloride. B, bottom, a significant correlation (P < 0.0001) between HIF-1α and PD-L1 protein levels in 28 different samples from at least five independent experiments in which MDA-MB-231 cells were incubated in either 20% O2, 0.5% O2, or with cobalt chloride. C, ChIP assay for HRE2 (see Materials and Methods) binding sites within the PD-L1 gene. Left, results of a PCR agarose gel. The top bands on the left show the PCR products using primers flanking the HRE2 on the intron spanning exons 4 and 5. The bottom bands show PCR products using positive-control primers flanking a known VEGF HRE (provided by the kit, see Materials and Methods). The first and fourth lanes reveal PCR products from whole-cell lysates (WCL). The second and fifth lanes represent PCR amplifications of anti-human HIF-1α–immunoprecipitated DNA from hypoxic DU145 and MDA-MB-231 cells, respectively. The third and sixth lanes represent PCR amplifications of anti-human HIF-1α–immunoprecipitated DNA from DU145 and MDA-MB-231 cells exposed to 20% O2. The lane on the far right represents results of PCR amplification of DNA from MDA-MB-231 cells immunoprecipitated with anti-human control IgG. Right, qRT-PCR results for immunoprecipitated HRE2 and the VEGF HRE. They reveal significantly increased amplification of DNA products immunoprecipitated with HIF-1α and VEGF antibodies in extracts of cultures from both DU145 and MDA-MB-231 cell lines incubated in 0.5% O2 versus 20% O2 (P < 0.05 and P < 0.01, respectively). Extracts immunoprecipitated with control IgG did not show significant levels of amplification products. D, qRT-PCR analysis of PD-L1 mRNA in DU145 cells (left) and flow cytometric analysis of PD-L1 in B16-OVA cells (right). For these experiments, both cell lines were transfected with either scrambled control siRNA or HIF-1α siRNA before exposure to either 20% or 0.5% O2. Graphs in D represent pooled data from three to five experiments. A representative flow cytometry histogram indicating the effect of hypoxia and HIF-1α knockdown on PD-L1 expression in B16-OVA cells is shown in Supplementary Fig. S2D. Results of flow cytometry showed a 19% ± 2% increase in the PD-L1 mean fluorescence intensity (P < 0.01) in control siRNA-transfected B16-OVA cells incubated in 0.5% O2 versus 20% O2. This effect of hypoxia was abrogated in cells transfected with HIF-1α siRNA (data not shown). *, P < 0.05;**, P < 0.01; ***, P < 0.001.
Hypoxia upregulates PD-L1 expression in a HIF-1α–dependent manner. A, Western blot analysis of PD-L1 protein in total extracts of DU145 and MDA-MB-231 cells. A, bottom, results of pooled densitometric analysis from three or more independent experiments. B, Western blot analysis of HIF-1α and PD-L1 protein in MDA-MB-231 cells following incubation in 20% O2, 0.5% O2, or cobalt chloride. B, bottom, a significant correlation (P < 0.0001) between HIF-1α and PD-L1 protein levels in 28 different samples from at least five independent experiments in which MDA-MB-231 cells were incubated in either 20% O2, 0.5% O2, or with cobalt chloride. C, ChIP assay for HRE2 (see Materials and Methods) binding sites within the PD-L1 gene. Left, results of a PCR agarose gel. The top bands on the left show the PCR products using primers flanking the HRE2 on the intron spanning exons 4 and 5. The bottom bands show PCR products using positive-control primers flanking a known VEGF HRE (provided by the kit, see Materials and Methods). The first and fourth lanes reveal PCR products from whole-cell lysates (WCL). The second and fifth lanes represent PCR amplifications of anti-human HIF-1α–immunoprecipitated DNA from hypoxic DU145 and MDA-MB-231 cells, respectively. The third and sixth lanes represent PCR amplifications of anti-human HIF-1α–immunoprecipitated DNA from DU145 and MDA-MB-231 cells exposed to 20% O2. The lane on the far right represents results of PCR amplification of DNA from MDA-MB-231 cells immunoprecipitated with anti-human control IgG. Right, qRT-PCR results for immunoprecipitated HRE2 and the VEGF HRE. They reveal significantly increased amplification of DNA products immunoprecipitated with HIF-1α and VEGF antibodies in extracts of cultures from both DU145 and MDA-MB-231 cell lines incubated in 0.5% O2 versus 20% O2 (P < 0.05 and P < 0.01, respectively). Extracts immunoprecipitated with control IgG did not show significant levels of amplification products. D, qRT-PCR analysis of PD-L1 mRNA in DU145 cells (left) and flow cytometric analysis of PD-L1 in B16-OVA cells (right). For these experiments, both cell lines were transfected with either scrambled control siRNA or HIF-1α siRNA before exposure to either 20% or 0.5% O2. Graphs in D represent pooled data from three to five experiments. A representative flow cytometry histogram indicating the effect of hypoxia and HIF-1α knockdown on PD-L1 expression in B16-OVA cells is shown in Supplementary Fig. S2D. Results of flow cytometry showed a 19% ± 2% increase in the PD-L1 mean fluorescence intensity (P < 0.01) in control siRNA-transfected B16-OVA cells incubated in 0.5% O2 versus 20% O2. This effect of hypoxia was abrogated in cells transfected with HIF-1α siRNA (data not shown). *, P < 0.05;**, P < 0.01; ***, P < 0.001.
We then determined by immunofluorescence whether HIF-1α and PD-L1 colocalize in vivo in a mouse tumor model. Mouse 4T1 mammary carcinoma cells were injected orthotopically into the mammary fat pad of syngeneic Balb/c female mice and allowed to form tumors. Earlier results had revealed that PD-L1 mRNA expression was upregulated by hypoxia in these cells and that this upregulation was prevented when HIF-1α was knocked down (Supplementary Fig. S2A). Results demonstrated cellular colocalization of HIF-1α (nuclear) and PD-L1 (mostly cytoplasmic) in 4T1 tumors (Supplementary Fig. S2B).
To determine whether HIF-1α interacts with PD-L1 genomic sequences, we conducted ChIP assays using primer sequences flanking two potential HIF-1α HREs located within the PD-L1 gene. Results of standard and qRT-PCR revealed that HIF-1α binds to HRE2 (see Materials and Methods section) in the intron located between exons 4 and 5 of the PD-L1 genomic sequences in both DU145 and MDA-MB-231 cells (Fig. 1C; see legend for details). The second canonical sequence (HRE1) did not exhibit detectable binding of HIF-1α (data not shown; see Materials and Methods section). To confirm that HIF-1α is indeed required for the hypoxia-induced expression of PD-L1, we conducted HIF-1α knockdown experiments using validated siRNA. Knockdown of HIF-1α expression with siRNA prevented HIF-1α protein accumulation in DU145 cells incubated in 0.5% O2 for 24 hours (Supplementary Fig. S2C) and inhibited the hypoxia-mediated increase in PD-L1 mRNA and cell surface protein levels (determined by flow cytometry) in human DU145 cells and mouse B16-OVA cells, respectively (Fig. 1D and Supplementary Fig. S2D). Together, these findings demonstrate that hypoxia increases PD-L1 expression in tumor cells via a mechanism dependent on HIF-1α.
Hypoxia increases resistance to CTL-mediated lysis in tumor cells via a mechanism dependent on HIF-1α, PD-L1, and PD-1
To further investigate the relevance of hypoxia-induced expression of PD-L1 to tumor cell escape from adaptive immunity, we used in vivo/ex vivo-generated CTLs as effectors against B16-OVA cells in cytolytic assays performed in vitro (Fig. 2). B16-OVA cells express high levels of chicken ovalbumin (OVA) on the surface. Therefore, immunization of C57Bl/6 mice with mitomycin C-treated B16-OVA cells results in the expansion of OVA-specific CTLs. Additional in vitro priming of CD3+ CTLs isolated from spleens of immunized mice led to further proliferation of lymphocytes with cytolytic activity against OVA-expressing cells. Thus, we tested the cytolytic activity of these CD3+ CTLs using as targets B16-OVA cells preincubated in hypoxia or standard conditions. To account for nonspecific, OVA-independent, cytolytic activity in the expanded splenic lymphocyte population, we also conducted control assays using B16-F10 melanoma cells that do not express ovalbumin. As previously reported (18–20), there was some nonspecific cytolytic activity of CD3+ CTLs against B16-F10 cells that was also independent of hypoxia (Supplementary Fig. S3A). This nonspecific cytolytic activity at each effector:target ratio was subtracted from the cytolytic activity at corresponding effector:target ratios in assays using B16-OVA cells as targets in order to determine OVA-specific cell killing (Fig. 2). The total cytolytic activity curves, which include specific and nonspecific cell killing, are provided in Supplementary Fig. S3B–S3E.
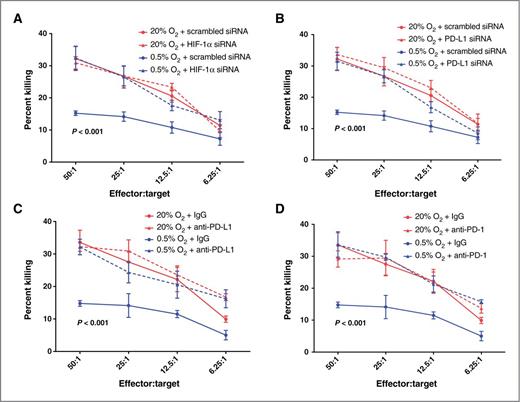
Hypoxia induces tumor cell resistance to CTL-mediated lysis. A, cytolytic activity of mouse CTLs against B16-OVA cells transfected with control siRNA or HIF-1α siRNA and preincubated in 20% O2 or 0.5% O2. B, cytolytic activity of mouse CTLs against B16-OVA cells transfected with control siRNA or PD-L1 siRNA and preincubated in 20% O2 or 0.5% O2. C, cytolytic activity of mouse CTLs against B16-OVA cells preincubated in 20% O2 or 0.5% O2 and treated with IgG or anti-mouse PD-L1 blocking antibody. D, cytolytic activity of mouse CTLs against B16-OVA cells preincubated in 20% O2 or 0.5% O2 and treated with IgG or anti-mouse PD-1 blocking antibody. Results shown represent pooled data from experiments performed using CD3+ CTLs isolated from four different C57Bl/6 mice. Data points showing the effects of preincubation of tumor cells in 0.5% O2 plus scrambled siRNA or 0.5% O2 plus IgG are duplicated in A and B as well as in C and D, respectively. P values on the graphs indicate significant difference between the lowermost curves (0.5% O2 + scrambled siRNA or IgG) and the curves above combined. Significance was calculated by one-way ANOVA followed by the Bonferroni multiple comparison post hoc test performed on the Y-intercepts of the linear regressions of the data pooled from all experiments. Results of two-way ANOVA of the mean cytolytic activities at each individual effector:target ratio are shown in Supplementary Table S1.
Hypoxia induces tumor cell resistance to CTL-mediated lysis. A, cytolytic activity of mouse CTLs against B16-OVA cells transfected with control siRNA or HIF-1α siRNA and preincubated in 20% O2 or 0.5% O2. B, cytolytic activity of mouse CTLs against B16-OVA cells transfected with control siRNA or PD-L1 siRNA and preincubated in 20% O2 or 0.5% O2. C, cytolytic activity of mouse CTLs against B16-OVA cells preincubated in 20% O2 or 0.5% O2 and treated with IgG or anti-mouse PD-L1 blocking antibody. D, cytolytic activity of mouse CTLs against B16-OVA cells preincubated in 20% O2 or 0.5% O2 and treated with IgG or anti-mouse PD-1 blocking antibody. Results shown represent pooled data from experiments performed using CD3+ CTLs isolated from four different C57Bl/6 mice. Data points showing the effects of preincubation of tumor cells in 0.5% O2 plus scrambled siRNA or 0.5% O2 plus IgG are duplicated in A and B as well as in C and D, respectively. P values on the graphs indicate significant difference between the lowermost curves (0.5% O2 + scrambled siRNA or IgG) and the curves above combined. Significance was calculated by one-way ANOVA followed by the Bonferroni multiple comparison post hoc test performed on the Y-intercepts of the linear regressions of the data pooled from all experiments. Results of two-way ANOVA of the mean cytolytic activities at each individual effector:target ratio are shown in Supplementary Table S1.
To determine a potential role of HIF-1α, PD-L1, and PD-1 in hypoxia-induced resistance to CTL-mediated lysis, we used the siRNA knockdown approach (for HIF-1α and PD-L1) as well as blocking antibodies (for PD-L1 and PD-1). Before performing the cytotoxicity assays, we confirmed siRNA-mediated knockdown of PD-L1 expression in B16-OVA cells (Supplementary Fig. S4A). Cytotoxicity assays revealed that hypoxic (0.5% O2) preincubation of B16-OVA cells, either transfected with control siRNA or preincubated with control immunoglobulin G (IgG), resulted in a significant decrease in CTL-mediated lysis (percent killing) when compared with preincubation in 20% O2 (Fig. 2A–D). This effect of hypoxia on resistance to CTL-mediated lysis did not occur in OVA-negative B16-F10 melanoma cells, which were significantly (P < 0.001) more resistant to CTL-mediated lysis than the B16-OVA cells (Supplementary Fig. S3A). This finding indicates that the hypoxia-induced resistance to lysis in B16-OVA cells is due to reduced killing by OVA-specific CD3+ CTLs. Knockdown of HIF-1α or PD-L1 with siRNA in B16-OVA cells abolished the hypoxia-induced resistance to CTL-mediated killing (Fig. 2A and B). Similarly, incubation of B16-OVA cells with either PD-L1 or PD-1 blocking antibodies resulted in inhibition of hypoxia-induced resistance to CTL-mediated lysis (Fig. 2C and D). Results of two-way ANOVA of the mean cytolytic activities at each individual effector-to-target ratio are shown in Supplementary Table S1. Together, these results indicate that the resistance to CTL-mediated lysis in B16-OVA cells exposed to hypoxia requires the expression of functional HIF-1α, PD-L1, and PD-1. On the basis of our results showing that hypoxia increases PD-L1 expression in a manner dependent on HIF-1α (Fig. 1D), we propose that the hypoxia-induced resistance to CTL-mediated lysis in B16-OVA cells is a result of increased interaction between PD-L1 on the tumor cells and PD-1 on the CTLs.
GTN inhibits the hypoxia-induced upregulation of PD-L1 expression and the hypoxia-induced resistance to CTL-mediated lysis
We previously reported that the hypoxia-induced accumulation of HIF-1α protein could be prevented by incubating DU145 cells in the presence of low concentrations of the nitric oxide (NO) mimetic GTN or 8-bromo-cGMP, an activator of classical NO signaling (15). Incubation of DU145, MDA-MB-231, or B16-OVA cells in the presence of GTN (10 nmol/L) for 24 hours blocked the hypoxia-induced upregulation of PD-L1 expression at the mRNA and protein levels as determined by qRT-PCR and Western blotting (Fig. 3A–C). Moreover, incubation of B16-OVA cells in the presence of GTN (10 nmol/L) resulted in inhibition of hypoxia-induced resistance to CTL-mediated lysis (Fig. 3D). These results point to a potential immunosensitizing role for GTN. Interestingly, continuous transdermal delivery of GTN to mice with orthotopically transplanted 4T1 mammary carcinomas resulted in attenuation of tumor growth when compared with placebo-treated mice (Supplementary Fig. S4B).
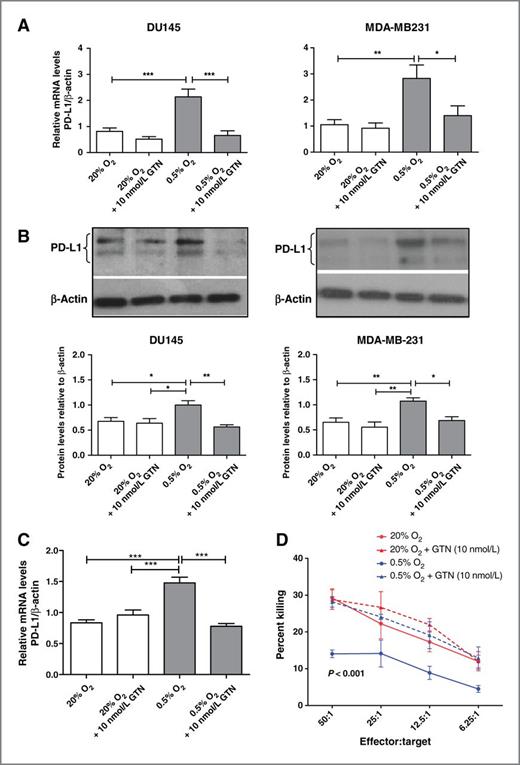
GTN inhibits hypoxia-induced upregulation of PD-L1 expression in various tumor cell lines and prevents resistance to CTL-mediated lysis in B16-OVA cells exposed to hypoxia. A, qRT-PCR analysis of PD-L1 mRNA expressed as a ratio to β-actin mRNA from at least three independent experiments using DU145 and MDA-MB-231 cells. The data show PD-L1 mRNA levels in cells incubated in 20% O2 or 0.5% O2 in the presence or absence of 10 nmol/L GTN. B, Western blot analysis of PD-L1 protein in DU145 cells or MDA-MB-231 cells incubated in 20% O2 or 0.5% O2 in the absence or presence of GTN (10 nmol/L). The figure is representative of at least three independent experiments, and the graphs (bottom) reveal the densitometric quantification of these experiments. C, results of pooled (N = 3) qRT-PCR assays for PD-L1 expression in B16-OVA cells following incubation in 20% or 0.5% O2 in the absence or presence of GTN (10 nmol/L). *, P < 0.05, **, P < 0.01; ***, P < 0.001. D, cytolytic activity of mouse CTLs against B16-OVA cells preincubated in 20% O2 or 0.5% O2 in the absence or presence of GTN (10 nmol/L). Results shown in D were obtained from experiments using pooled CD3+ splenocytes isolated from four mice immunized with B16-OVA cells. P value on the graph indicates significant difference between the lowermost curve (0.5% O2) and the curves above combined. Significance was calculated by one-way ANOVA followed by the Bonferroni multiple comparison post hoc test performed on the Y-intercepts of the linear regressions of the data pooled from all experiments. Results of two-way ANOVA of the mean cytolytic activities at all effector-to-target ratios are shown in Supplementary Table S1.
GTN inhibits hypoxia-induced upregulation of PD-L1 expression in various tumor cell lines and prevents resistance to CTL-mediated lysis in B16-OVA cells exposed to hypoxia. A, qRT-PCR analysis of PD-L1 mRNA expressed as a ratio to β-actin mRNA from at least three independent experiments using DU145 and MDA-MB-231 cells. The data show PD-L1 mRNA levels in cells incubated in 20% O2 or 0.5% O2 in the presence or absence of 10 nmol/L GTN. B, Western blot analysis of PD-L1 protein in DU145 cells or MDA-MB-231 cells incubated in 20% O2 or 0.5% O2 in the absence or presence of GTN (10 nmol/L). The figure is representative of at least three independent experiments, and the graphs (bottom) reveal the densitometric quantification of these experiments. C, results of pooled (N = 3) qRT-PCR assays for PD-L1 expression in B16-OVA cells following incubation in 20% or 0.5% O2 in the absence or presence of GTN (10 nmol/L). *, P < 0.05, **, P < 0.01; ***, P < 0.001. D, cytolytic activity of mouse CTLs against B16-OVA cells preincubated in 20% O2 or 0.5% O2 in the absence or presence of GTN (10 nmol/L). Results shown in D were obtained from experiments using pooled CD3+ splenocytes isolated from four mice immunized with B16-OVA cells. P value on the graph indicates significant difference between the lowermost curve (0.5% O2) and the curves above combined. Significance was calculated by one-way ANOVA followed by the Bonferroni multiple comparison post hoc test performed on the Y-intercepts of the linear regressions of the data pooled from all experiments. Results of two-way ANOVA of the mean cytolytic activities at all effector-to-target ratios are shown in Supplementary Table S1.
Hypoxia induces T-cell apoptosis by upregulating PD-L1 expression in tumor cells
Interactions between PD-L1 on tumor cells and PD-1 on T cells are known to lead to anergy or apoptosis in the T cells (4). To further elucidate the mechanism by which hypoxia-induced upregulation of PD-L1 expression leads to tumor-cell resistance to CTL-mediated lysis, we determined the effect of PD-L1 upregulation in tumor cells on T-cell apoptosis. Specifically, we measured apoptosis (Annexin V or apo-BrDU labeling) in Jurkat leukemia T cells or peripheral blood human CD3+ lymphocytes incubated either alone or in coculture with DU145 cells (Fig. 4A and B) or MDA-MB-231 cells (data not shown). For the coculture experiments, because the tumor cells were postulated to act as inducers of apoptosis, they were plated at higher numbers than their T-cell "targets". Incubations were carried out for 24 hours in either 20% O2 (Jurkat cells), 8% O2 (CD3+ lymphocytes), or 0.5% O2 (both cell types; Fig. 4A and B). We cultured CD3+ lymphocytes in 8% O2 (physiologic levels) rather than 20% O2 because incubation of these cells alone in 20% O2 increased their basal level of apoptosis. However, exposure of Jurkat cells or CD3+ lymphocytes alone to 0.5% O2 (versus 20% or 8% O2, respectively) did not significantly affect their basal level of apoptosis (Fig. 4A and B). When cocultured with DU145 cells in 0.5% O2, the apoptotic index of T cells (see Materials and Methods section) increased substantially (Fig. 4A and B). Incubation of the cocultures in the presence of GTN, PD-L1 blocking antibody, or PD-1 blocking antibody significantly attenuated the extent of apoptosis induced by hypoxia (Fig. 4A and B). We confirmed by flow cytometry the expression of PD-1 in Jurkat cells and CD8+ peripheral blood lymphocytes. Compared with CD3+ peripheral blood lymphocytes, a higher number of Jurkat cells expressed surface PD-1 (91.3% vs. 8.1%; Fig. 4C), which paralleled the levels of apoptosis in these T cells induced by the hypoxic tumor cells (Fig. 4A and B). To provide further evidence that hypoxia induced apoptosis in T cells by upregulating PD-L1 expression in the tumor cells, we preincubated DU145 cells alone in 0.5% or 20% O2 for 24 hours before coculture with CD3+ lymphocytes in 8% O2 for a further 24 hours. Indeed, the extent of apoptosis was significantly higher in CD3+CD8+ lymphocytes cocultured with DU145 cells preincubated in 0.5% O2 versus 20% O2 (Fig. 4C). Furthermore, preincubation of DU145 cells in hypoxia in the presence of GTN or PD-L1 blocking antibody inhibited the proapoptotic effect of hypoxic DU145 cells on T cells (Fig. 4C). These results reveal that hypoxia may contribute to cancer immune evasion by inducing CTL apoptosis through a pathway involving increased tumor cell PD-L1 expression. Our results show that this pathway is dependent on HIF-1α and that it can be inhibited by GTN.

Hypoxia induces T-cell apoptosis by upregulating PD-L1 expression. A, apoptotic index of Jurkat T cells incubated either alone or in coculture with DU145 cells in the absence or presence of GTN, blocking anti-PD-L1 antibody, or blocking PD-1 antibody. Apoptosis was determined by terminal deoxynucleotidyl transferase–mediated dUTP nick end labeling (TUNEL) followed by flow cytometry. Data are standardized from samples of at least two independent experiments. B, apoptotic index of peripheral blood human CD3+CD8+ CTLs. CD3+ lymphocytes were incubated either alone or in coculture with DU145 cells in the absence or presence of GTN, blocking anti-PD-L1 antibody, or blocking PD-1 antibody. Extent of CTL apoptosis was determined by double labeling of Annexin V and anti-human CD8 antibody. C, expression of surface PD-1 in CD3+ peripheral blood lymphocytes and Jurkat cells was confirmed by flow cytometry. The number of Jurkat cells expressing PD-1 was approximately 10-fold higher compared with CD3+ peripheral blood lymphocytes (91.3% vs. 8.1%). D, apoptosis of peripheral blood human CD3+CD8+ CTLs. DU145 cells were preincubated in 20% or 0.5% O2 in the absence or presence of GTN or blocking anti-PD-L1 antibody for 24 hours. CD3+ lymphocytes were then added and the cocultures were incubated in 8% O2 for another 24 hours. Extent of CTL apoptosis was determined by double labeling with Annexin V and PE-tagged anti-human CD8 antibody. *, P < 0.05; **, P < 0.01; ***, P < 0.001.
Hypoxia induces T-cell apoptosis by upregulating PD-L1 expression. A, apoptotic index of Jurkat T cells incubated either alone or in coculture with DU145 cells in the absence or presence of GTN, blocking anti-PD-L1 antibody, or blocking PD-1 antibody. Apoptosis was determined by terminal deoxynucleotidyl transferase–mediated dUTP nick end labeling (TUNEL) followed by flow cytometry. Data are standardized from samples of at least two independent experiments. B, apoptotic index of peripheral blood human CD3+CD8+ CTLs. CD3+ lymphocytes were incubated either alone or in coculture with DU145 cells in the absence or presence of GTN, blocking anti-PD-L1 antibody, or blocking PD-1 antibody. Extent of CTL apoptosis was determined by double labeling of Annexin V and anti-human CD8 antibody. C, expression of surface PD-1 in CD3+ peripheral blood lymphocytes and Jurkat cells was confirmed by flow cytometry. The number of Jurkat cells expressing PD-1 was approximately 10-fold higher compared with CD3+ peripheral blood lymphocytes (91.3% vs. 8.1%). D, apoptosis of peripheral blood human CD3+CD8+ CTLs. DU145 cells were preincubated in 20% or 0.5% O2 in the absence or presence of GTN or blocking anti-PD-L1 antibody for 24 hours. CD3+ lymphocytes were then added and the cocultures were incubated in 8% O2 for another 24 hours. Extent of CTL apoptosis was determined by double labeling with Annexin V and PE-tagged anti-human CD8 antibody. *, P < 0.05; **, P < 0.01; ***, P < 0.001.
These findings reveal a novel mechanism of escape from adaptive immunity operating in tumor cells exposed to hypoxia. Together with our previous studies showing that hypoxia contributes to tumor cell escape from innate immunity (14, 15), the results of the present study provide evidence that hypoxia also contributes to a key phase of cancer immunoediting, i.e., escape from adaptive immunity (1), thereby promoting malignant progression. Thus, targeting specific steps in these mechanisms of immune escape—for example, through the use of NO mimetics such as GTN or small molecule inhibitors—could lead to novel immunotherapeutic strategies.
Disclosure of Potential Conflict of Interest
C.H. Graham and D.R. Siemens have small ownership interest in Nometics Inc. and are consultant/advisory board members of Nometics Inc. without financial remuneration. These authors have no additional financial interests. No potential conflicts of interest were disclosed by the other authors.
Authors' Contributions
Conception and design: I.B. Barsoum, C.A. Smallwood, D.R. Siemens, C.H. Graham
Development of methodology: C.A. Smallwood, D.R. Siemens, C.H. Graham
Acquisition of data (provided animals, acquired and managed patients, provided facilities, etc.): I.B. Barsoum, C.A. Smallwood
Analysis and interpretation of data (e.g., statistical analysis, biostatistics, computational analysis): I.B. Barsoum, C.A. Smallwood, D.R. Siemens, C.H. Graham
Writing, review, and/or revision of the manuscript: I.B. Barsoum, C.A. Smallwood, D.R. Siemens, C.H. Graham
Study supervision: D.R. Siemens, C.H. Graham
Grant Support
This work was supported by a grant from the Canadian Institutes of Health Research awarded to C.H. Graham and D.R. Siemens. I.B. Barsoum was the recipient of a Terry Fox Foundation Training Program in Transdisciplinary Cancer Research in partnership with the Canadian Institutes of Health Research. C.A. Smallwood was the recipient of a Canadian Institutes of Health Research Frederick Banting and Charles Best Canada Graduate Scholarship.
The costs of publication of this article were defrayed in part by the payment of page charges. This article must therefore be hereby marked advertisement in accordance with 18 U.S.C. Section 1734 solely to indicate this fact.