Abstract
Pt supported on carbon black, commonly used as PEM fuel cell catalyst, underlies electrochemical instabilities in terms of carbon corrosion and platinum degradation. To better understand the influence of the support on nature and extent of catalyst aging, Pt was synthesized on four different substrates: Carbon black, multiwalled carbon nanotubes (MWCNTs), reduced graphene oxide (rGO) and a nanocomposite of indium tin oxide with rGO (ITO-rGO). The four Pt catalysts and the separate supports were studied on their durability using an accelerated stress test (AST, −0.02–1.40 VSHE). Comparable platinum degradation was shown by losses of electrochemically active surface area (EASA) and activity for oxygen reduction reaction (ORR) and by identical location transmission electron microscopy (IL-TEM). With respect to the supports, highest instability of carbon black was observed investigating the double layer capacitance and amounts of hydroquinone (HQ) species. MWCNTs showed the lowest degradation. Thus, AST provoked strongly different extents of support aging but similar Pt degradation. In view of complex FC catalyst degradation mechanism, only negligible Pt detachment caused by support degradation and rather dominating Pt dissolution and agglomeration—additionally evidenced by IL-TEM—is assumed here. Regarding ITO-rGO, neither carbon support nor platinum stabilization by ITO nanoparticles has been observed.
Export citation and abstract BibTeX RIS

This is an open access article distributed under the terms of the Creative Commons Attribution 4.0 License (CC BY, http://creativecommons.org/licenses/by/4.0/), which permits unrestricted reuse of the work in any medium, provided the original work is properly cited.
Proton exchange membrane fuel cells (PEMFCs) are attractive for stationary, portable and automotive applications.1,2 Short response times and simple cell design with low weight and solid electrolyte membranes are some advantages of PEMFCs, especially for the automotive sector. Good performance and high lifetimes are two important criteria for commercialization of fuel cells. Low temperature PEMFCs can reach power densities about 680 mWcm−2,3 higher than the power densities of other fuel cell types.1 However, a challenge is the loss of performance with operation time.2,4 The better understanding of physical, thermal, mechanical, chemical and electrochemical processes, leading to the aging of fuel cell components, is indispensable and is therefore one main issue of current fuel cell research.2,5–8
Platinum supported on carbon black represents the commonly used catalyst in fuel cells. Under PEMFC conditions at low pH values and cell voltages of around 1.0 V during no-load or 1.4 V during start-stop operation,9 dissolution of platinum becomes relevant. Pt oxides are formed at potentials higher than 0.6 VSHE,10 whereas Pt oxides or metallic Pt can dissolve.2 Dissolved Pt underlies Ostwald ripening or simply leaves the cell with the exhaust water stream. Pt ions can migrate into the membrane and be reduced to metallic platinum.11 Especially at potentials above 0.95 VSHE oxygen atoms can replace Pt atoms, so that potential cycling can lead to significant changes of the catalyst particle structure.2
Also instabilities of the catalyst support can result in a reduction of cell performance. Corrosion of carbon has the consequence of detached Pt particles and thus electrical isolation and catalytic inactivity.2 Carbon corrosion is thermodynamically possible from 0.207 VSHE,2 but gets in PEMFC systems kinetically relevant from cell voltages of 0.9 V.12 The reaction to carbon dioxide is generalized by Equation 1, whereas also partial oxidized stages, for instance carbonyl and hydroxyl groups, can be formed. Also hydroquinone/quinone (HQ/Q) species can occur during partial carbon oxidation which can be detected during electrochemical tests due to its redox activity.13–15 Furthermore, carbon corrosion can lead to changes in the surface area of support materials. Both properties, the porosity16,17 and the amount of C-O surface groups,16 contribute to the electric double layer in electrochemical measurements. Thus, changes in the double layer capacitance (CDL) can be an indicator for support degradation.
![Equation ([1])](https://content.cld.iop.org/journals/1945-7111/164/9/F995/revision1/d0001.gif)
Alternative support materials with improved stability under fuel cell operation conditions are mandatory to achieve increased fuel cell lifetimes. This study compares alternative carbon supports for platinum stabilization in high dispersion regarding their durability under the harsh electrochemical conditions of PEMFC application. On one hand insights into degradation processes are given and on the other hand the durability of different substrates is compared. The exposure of Pt catalysts to an accelerated stress testing (AST, potential cycling, ∼0.0–1.4 VSHE) allows fast catalyst aging, opposed to the constant potential holding test.12,18 Next to the initiation of degradation, potential cycling can be used as simultaneous characterization tool for the change of fuel cell relevant Pt reactions and also for the change of the HQ/Q species or electric double layer over testing time.18,19
Graphene-based materials have received much attention during the last decade and have been tested for fuel cell application in various studies.20–26 Carbon nanotubes are characterized by highly ordered graphene sheets in terms of the cylindrical nanostructure, showing high electrical conductivity and chemical stability.24 However, reduced graphene oxide (rGO) consists of wrinkled graphene layers with a high number of defect sites for better interaction with nanoparticles, meeting the requirements for fuel cell catalyst supports,27–29 but exhibiting lower electrical conduction.30 Mass transport limitation because of rGO restacking and also corrosion due to the high defect density are other challenges with respect to fuel cells.31–33 The deposition of metal oxide particles on the rGO surface can prevent reduced graphene oxide from restacking and corrosion.32 Metal oxides like indium tin oxide (ITO) show good preconditions with respect to the stability in PEM fuel cells like their already oxidized stage34 and the almost inert characteristics in strong acidic environments and enhanced temperatures.35
The commonly used carbon black is compared with three promising alternative materials as stable substrate for PEMFC application. Next to the comparison of four substrates, Pt catalysts are prepared using the same platinum precipitation method on the four different support materials. Thus, high comparability of Pt on different supports as well as only the support materials among each other is given. An accelerated stability test in terms of potential cycling up to 1.4 VSHE in oxygen-saturated electrolyte is performed in case of four catalysts and four substrates. Degradation of the substrates (with and also without platinum) is carefully studied by electrochemical evaluation of detected HQ/Q species and of the double layer capacitance. Platinum degradation is investigated through EASA determination via cyclic and CO stripping voltammetry before and after the test. By the use of a rotating disk electrode, the analysis of the oxygen reduction reaction kinetics is also carried out. Identical location TEM is done to optically reveal Pt degradation and to verify electrochemical results.
Experimental
Catalyst synthesis
The platinum catalyst synthesis was carried out employing four different support materials. All chemicals were used as delivered. The utilized carbon black (C) is Vulcan XC72R from Cabot Corporation (Malaysia). Multiwalled carbon nanotubes (MWCNT) were purchased from Ionic Liquids Technologies GmbH (Germany) with 10–30 nm diameters and 5–15 μm lengths.
Reduced graphene oxide (rGO) was prepared in two steps. Natural graphite (Graphit Kropfmühl GmbH, Germany) was chemically oxidized to graphite oxide using a modified Hummers method.36 1.0 g of graphite and 25 mL concentrated sulfuric acid (Carl Roth GmbH und Co. KG, Germany) were mixed and sonicated for 1 h. At a temperature of 0°C and under stirring, 1.0 g sodium nitrate (Carl Roth GmbH und Co. KG, Germany) and 3.0 g potassium permanganate (Carl Roth GmbH und Co. KG, Germany) were slowly added for 5 h. Then, the mixture was heated up to 35°C and stirred for 18 h. For quenching, the flask was put into an ice bath and filled with 80 mL water. 10 mL hydrogen peroxide (30 wt%, VWR International GmbH, Germany) was added to decompose residual KMnO4. The mixture was washed and centrifuged a few times with 10% HCl and water. After removing rest water via rotary evaporation the brown solid was dried at 60°C for 48 h. Finally, graphite oxide was thermally reduced and exfoliated to obtain reduced graphene oxide. Therefore, the sample was put into a crucible filled with Ar and placed for 30 s in an oven with air atmosphere at 1050°C.36,37
Next to pure reduced graphene oxide, also a composite of rGO and ITO as Pt support for PEMFC application was synthesized. 50 mg of rGO was sonicated in 10 mL benzyl alcohol (Carl Roth GmbH und Co. KG, Germany) for 1 h. At the same time, 200.4 mg indium acetylacetonate (Sigma-Aldrich Chemie GmbH, Germany) and 40.9 mg tin tert-butoxide (Sigma-Aldrich Chemie GmbH, Germany) were dissolved in 20 mL benzyl alcohol to achieve the desired 10 wt% tin oxide doping. Both solutions were mixed and stirred for 24 h in N2 atmosphere. Afterwards, the mixture was transferred into an autoclave and stored at 200°C for 24 h to precipitate and crystallize 75 wt% ITO on 25 wt% rGO. The product was washed a few times with ethanol and chloroform, vacuum filtrated and dried at 60°C for 48 h.32,38
Finally, chloroplatinic acid (Thermo Fisher GmbH, Germany) was reduced to 20 wt% Pt nanoparticles on the supports, whereas ethylene glycol (Carl Roth GmbH und Co. KG, Germany) served as solvent and as reducing and nanoparticle stabilization agent. 66.4 mg H2PtCl6•6H2O was dissolved in 40 mL ethylene glycol. After adjusting pH to 12, 100 mg of support material was added and sonicated for 5 min. The reduction to metallic Pt was carried out at 140°C for 4 h under stirring. The obtained catalyst was washed with water, vacuum filtrated and dried at 60°C for 48 h.32
Physical characterization
For X-ray diffraction (XRD) analysis, a X'Pert Pro MPD device (PANalytical B.V., Netherlands) with Cu Kα radiation was used. Gonio scans were recorded in the 2θ range between 5° and 60° with 0.01° steps. Nitrogen adsorption measurements were carried out using TriStar II 3020 (Micromeritics GmbH, Germany) and the surface areas were determined using the BET formalism. Transmission electron microscopy (TEM) was done using the EM 902A (Carl Zeiss AG, Germany) with a tungsten cathode and CCD camera. An acceleration voltage of 80 kV and polyvinylformal coated Cu grids (200 mesh, Plano GmbH, Germany) were used for TEM measurements. To perform IL-TEM carbon film coated Au finder grids (H7, 400 mesh, Plano GmbH, Germany) were used to ensure electrical conduction during the electrochemical measurements.
Electrochemical characterization
Electrochemical measurements were performed inside a three electrode glass cell. A rotating disk electrode (RDE) consisting of glassy carbon (A = 0.2 cm²) jacketed with Teflon was used as working electrode. The counter electrode was a Pt wire and the reference electrode was the saturated calomel electrode (SCE, KCl-sat.) with salt bridge and luggin capillary. A potential conversion from SCE to the standard hydrogen electrode (SHE) allows the better comparison with literature and was carried out by consideration of the SCE standard potential of 0.24 V.39
The RDE was polished 5 min each with 1.0 and 0.25–0.30 μm alumina paste (Buehler, USA) and sonicated in isopropanol and in water for 5 min each. Then, the catalyst inks were freshly prepared and sonicated for 1 h. Polished and cleaned electrodes were uniformly deposited via drop casting under rotation. The detailed procedure of RDE preparation is listed in Table I. The proceeding for the supports was analogous to the appropriate catalysts.
Table I. Preparation of catalyst ink and coating of rotating disk electrodes.
| Ink Preparation | Electrode Deposition | |||||
|---|---|---|---|---|---|---|
| Catalysts | c / g L−1 | Isopropanol / Water Ratio | mNafion / µg | Rotation Speed / rpm | V / µL | Pt Loading / µg cm−2 |
| Pt/C, Pt/MWCNT | 1 | 1/3 | 17.7 | 700 | 3 × 10 | 30 |
| Pt/rGO, Pt/ITO-rGO | 1 | 1/2 | 17.7 | 300 | 3 × 10 | 30 |
The electrochemical measurements were carried out at room temperature in 0.1 M HClO4 (70 wt%, Sigma-Aldrich) solution. A bipotentiostat (Autolab PGSTAT128N or PGSTAT132N, Metrohm Autolab, The Netherlands) controlled by Nova 1.11 software served for the electrochemical experiments. First, the materials were activated by 100 potential cycles between −0.02 and 1.40 VSHE at a scan rate of 500 mV s−1 under Ar-/N2-saturation. In order to investigate catalyst and support aging, the materials were exposed to 1,000 potential cycles between −0.02 and 1.40 VSHE at a scan rate of 500 mV s−1 under oxygen-saturation. In case of Pt catalysts, an initial and a final characterization were performed, including the analysis of the EASA and the ORR kinetics. Cyclic voltammetry (CV) was done in the potential range between −0.02 and 0.94 VSHE at 50 mV s−1 in Ar- or N2-saturated 0.1 M HClO4 solution in order to calculate the EASA via hydrogen underpotential deposition (HUPD). CO stripping voltammetry (−0.02–1.04 VSHE, 50 mV s−1, Ar- or N2-saturated electrolyte) served for EASA analysis via CO oxidation on Pt. Platinum loadings were measured by mass spectrometry with inductive coupled plasma (ICP-MS, XSeries2, Thermo Fisher Scientific GmbH, Germany) after digestion of 2 mg catalyst in 1.6 mL HCl and 1.2 mL HNO3 and have been considered within EASA determination. For ORR investigation, CV curves from 0.10 to 0.98 VSHE at 5 mV s−1 under O2 saturation were recorded. To achieve steady state conditions, the electrodes were rotated at 400, 900, 1200, 1600, 2000 and 2500 rpm each.
For typical IL-TEM experiments, the grid was coated with catalyst first. 1 mg of catalyst was dispersed in 0.5 mL water via 1 h sonication. The grid was hold on an ink drop for a few seconds and then dried under air. In order to expose the catalyst to the same stability test described above, the coated grids were placed on the working electrode with glassy carbon and Teflon jacket and fixed with a suitable Teflon cover. Finally, the catalyst coated grid surface is in contact with the electrolyte, whereas the opposite grid surface should be in contact with the working electrode. Then, the potential cycling was carried out under the same conditions, as described before.
Results and Discussion
Physical characterization
First, the catalysts are physically characterized with respect to mean Pt particle sizes. The diameters of 300 nanoparticles were measured from TEM images. Figure 1 shows a representative TEM image and compares the size distributions for each catalyst. Pt particles are well-dispersed on every support. Only small differences in the mean Pt particle size are observed. Pt nanoparticles on both rGO substrates in Figures 1c and 1d show slightly smaller sizes (1.6 and 1.4 nm, respectively) than on carbon black and MWCNTs (1.7 nm each). Measuring 300 indium tin oxide nanoparticles on rGO resulted in a mean ITO size of 7.1 nm, but also some larger ITO crystals were observed under the microscope. Generally, TEM gives an insight into samples in nanometer range with a limiting overview of the whole bulk sample. Thus, anticipating the XRD results, the ITO crystal size was additionally estimated by use of the Scherrer equation.40–42 XRD analysis gave ITO crystals with 23 nm in mean diameter. Larger ITO crystals observed with TEM mainly dominate X-ray diffraction, leading to this higher ITO mean size of 23 nm.
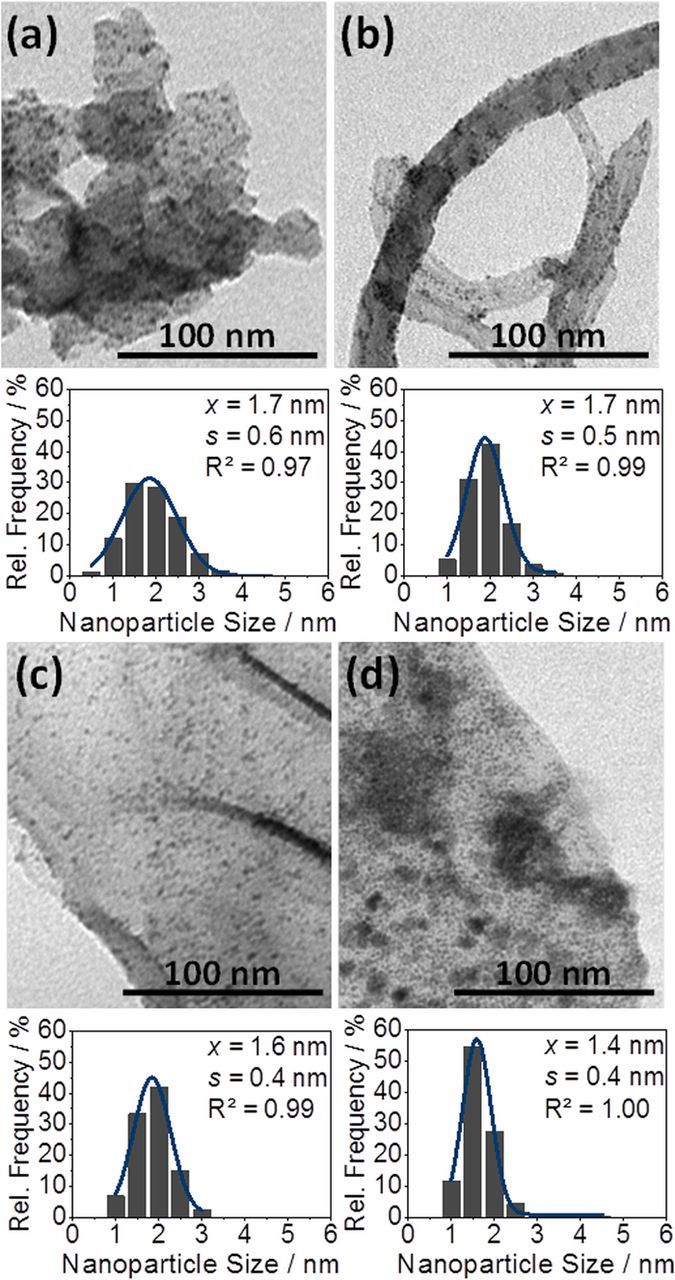
Figure 1. TEM images and Pt particle size distribution for (a) Pt/C, (b) Pt/MWCNT, (c) Pt/rGO and (d) Pt/ITO-rGO samples.
Figure 2 shows the X-ray diffraction patterns for each catalyst. Some reflections are present in all samples. The (002) reflection at around 27° (ICSD, 98-018-7640) is slightly shifted, depending on the carbon nanostructures. For example, in carbon black the reflection is located around 25°, indicating a larger atom layer distance. Furthermore, the two main (111) and (200) Pt signals at 40° and 47°, respectively (ICSD, 98-018-0980), appear in all catalyst samples. The Pt reflections are quite broad in all diffractograms evidencing Pt particles sizes in the nanometer range. In total, comparable Pt reflections confirm similar Pt crystallinity on the different supports. Further reflexes occurring in the Pt/ITO-rGO sample are associated to indium tin oxide crystals (ICSD, 00-001-0929).
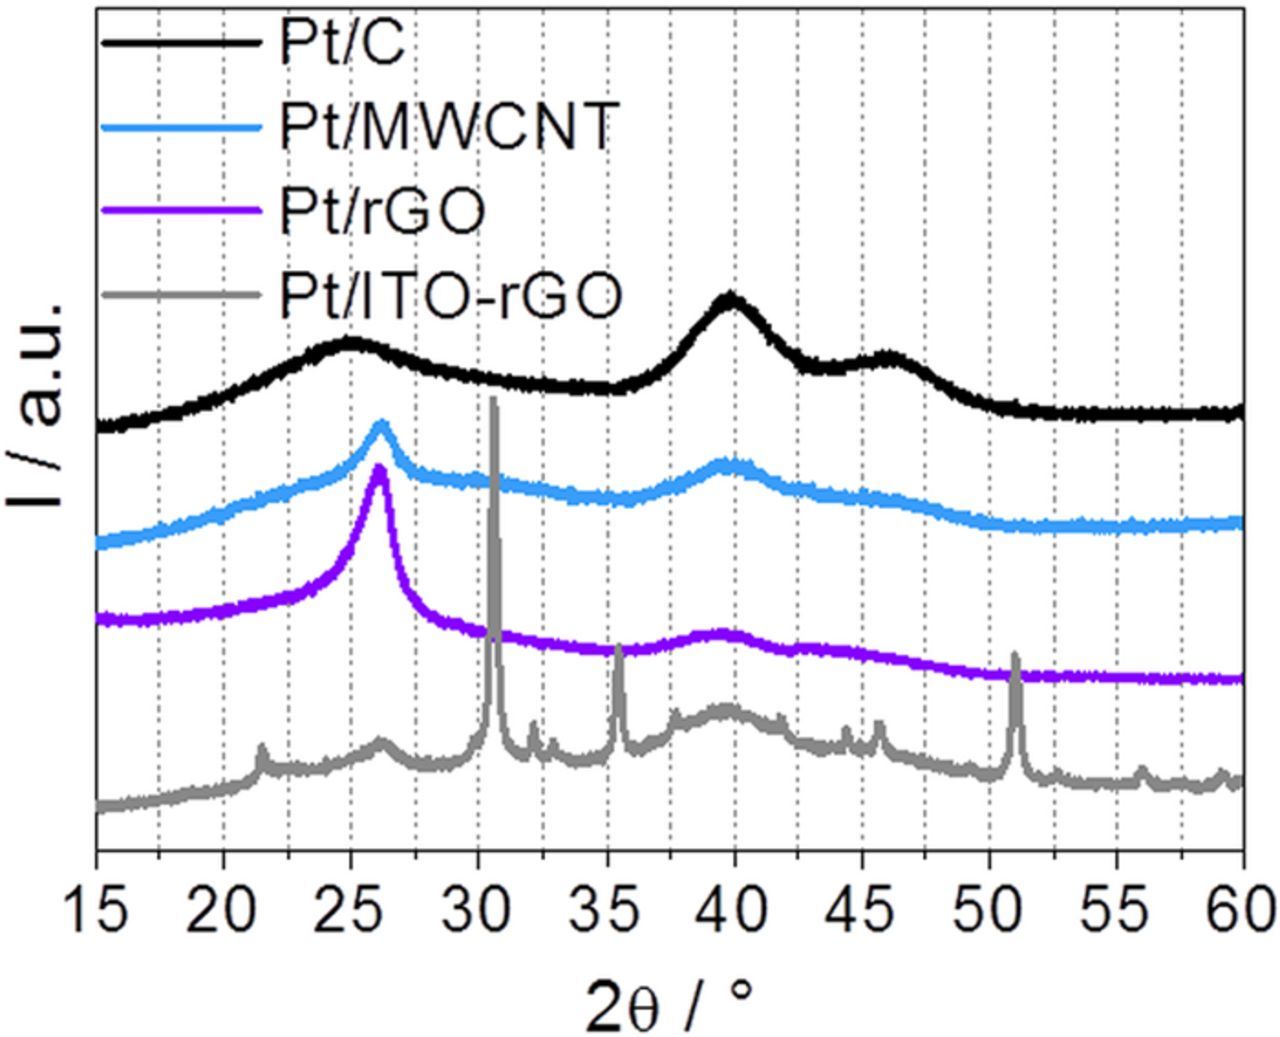
Figure 2. XRD patterns of Pt/C, Pt/MWCNT, Pt/rGO and Pt/ITO-rGO samples.
The supports are further investigated toward the graphitic interlayer distance d002 and crystallite size L002 via X-ray diffraction, since the graphitic degree can have influence on carbon stability.43 Furthermore, BET measurements allow determination of the specific support surface area. XRD analysis has been carried out using Bragg's Equation 2 and Scherrer's Equation 3 containing X-ray reflection angle θ, wavelength of Cu Kα radiation λ, cubic form factor K of 0.89 and fully peak width at half maximum FWHM. Next to the four substrates listed in Table II, natural graphite from rGO synthesis was measured via XRD to correct crystallite size data.
![Equation ([2])](https://content.cld.iop.org/journals/1945-7111/164/9/F995/revision1/d0002.gif)
![Equation ([3])](https://content.cld.iop.org/journals/1945-7111/164/9/F995/revision1/d0003.gif)
Table II. XRD analyses and BET surface areas of the different supports.
| Supports | 2Θ / ° | d002 / nm | FWHM / ° | L002 / nm | BET / m2 g−1 |
|---|---|---|---|---|---|
| C | 24.8 | 0.359 | 5.0 | 1.6 | 218 |
| MWCNT | 26.2 | 0.339 | 1.9 | 4.3 | 111 |
| rGO | 26.1 | 0.341 | 1.6 | 5.0 | 286 |
| ITO-rGO | 26.1 | 0.341 | 1.2 | 7.0 | 69 |
In Table II, carbon black had the lowest 2θ value of 24.8° and thus the highest interlayer distance of 0.359 nm, followed by rGO and ITO-rGO and last MWCNTs. Furthermore, C showed the highest FWHM and thus lowest crystallite size of 1.6 nm, assuming turbostratic structure of the spherical carbon black particles imaged via TEM in Figure 1a. In comparison, MWCNTs, rGO and ITO-rGO exhibit larger crystallite sizes so that increased graphitic structures are present in these materials. In literature, the same type of carbon black is compared to carbon nanofibers and nanospheres and carbon black also resulted in lowest graphitic degree.14 The specific surface areas decrease in the expected order rGO > C > MWCNT because rGO shows the most open, sheet-like structure and CNTs are typically most compact. By introduction of ITO nanoparticles to rGO (ITO-rGO) the surface area decreases as expected, since also Kou et al.32 measured decreasing BET values with increasing ITO content on rGO.
Catalyst degradation
For evaluating the impact of degradation on the electrocatalytic activity of Pt, the ORR investigations as well as EASA determination have been carried out. Figure 3 contrasts the ORR polarization curves of the four carbon-supported Pt catalysts before and after durability testing. Next to the Pt-based catalysts, also the ORR polarization curves of the supports are plotted. As expected, they show negligible electrocatalytic activities for the reduction of oxygen in 0.1 M HClO4 as compared to Pt. However, rGO is known for its ORR activity in alkaline environments.29,30 Qu et al.44 showed, that nitrogen doping leads to improved ORR activities in 0.1 M KOH, even higher than that of Pt/C.
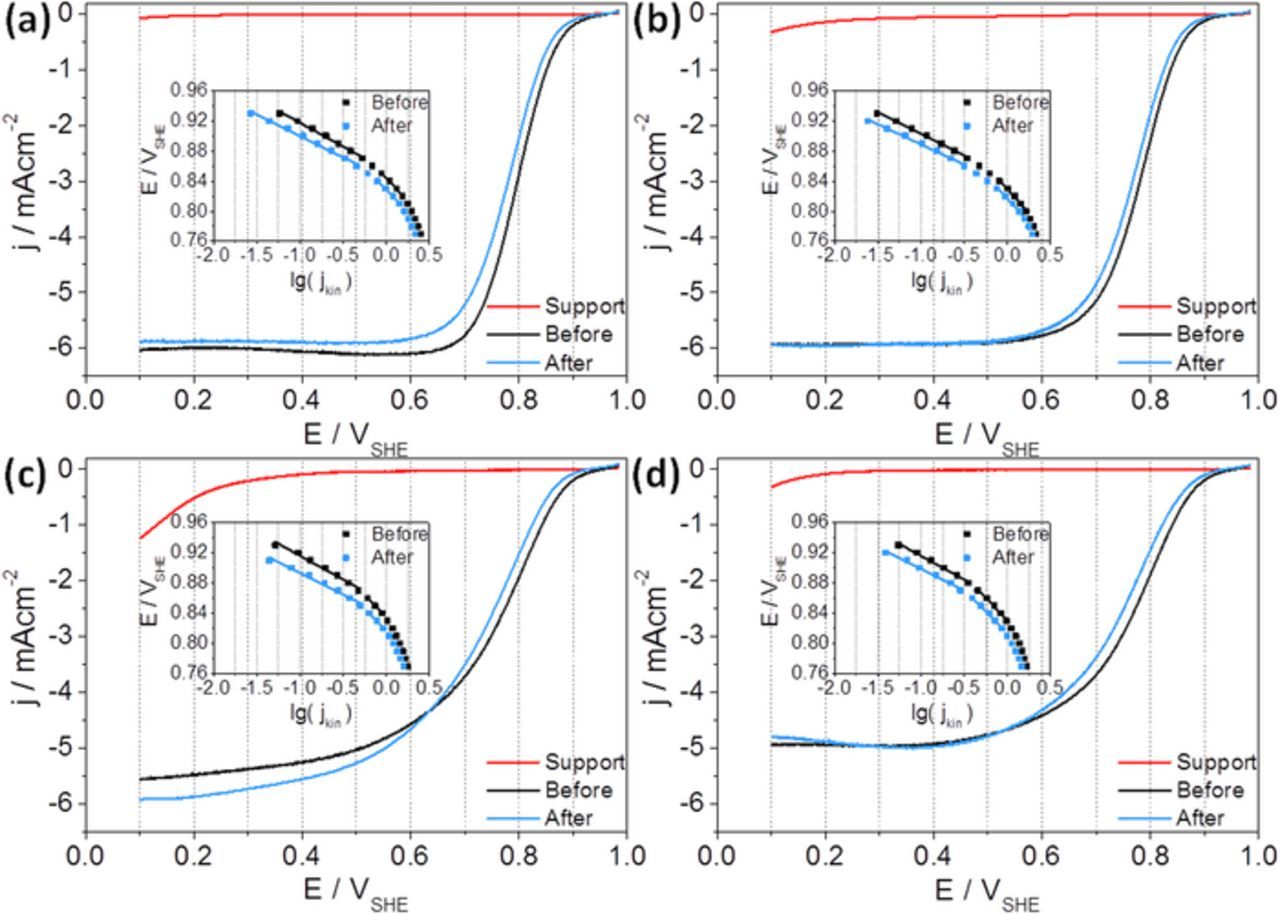
Figure 3. Cathodic scans at 1600 rpm of the catalysts before (black) and after (blue) the AST and of the supports (red) in O2-saturated 0.1 M HClO4 solution including Tafel plots (linear regressions in depicted potential ranges) as insets; (a) Pt/C, (b) Pt/MWCNT, (c) Pt/rGO and (d) Pt/ITO-rGO.
The Pt catalysts show similar ORR polarization curves. But differences in the diffusion limited current range (0.1–0.6 VSHE) can be observed. Pt nanoparticles supported on rGO and ITO-rGO (Figures 3c and 3d) show lower current density in the potential range of diffusion limitation (0.1 to ∼0.6 VSHE) than Pt/C and Pt/MWCNT in Figures 3a and 3b. On the one hand distribution of catalyst on the electrode can play a role, but on the other hand also the properties of support material may have an influence on the electrocatalytic properties.45 For instance, rGO has a lower electrical conductivity than carbon black or MWCNT.30 In case of Pt on titanium dioxide, Huang et al.35 also measured lower mass transport limited currents during ORR measurements than for Pt/C.
First, the kinetic current densities (jkin) were determined using Equation 4, where jlim is the diffusion limited current density and j the experimentally measured current density.
![Equation ([4])](https://content.cld.iop.org/journals/1945-7111/164/9/F995/revision1/d0004.gif)
Tafel plots have been generated via kinetic relations of Koutecky-Levich and Butler-Volmer.46–48 In insets of Figure 3 the potential is plotted against lg(jkin). In literature, two characteristic Tafel slopes in the region of 0.80–0.95 VSHE are described for oxygen reduction on Pt, −60 mV dec−1 (at low current densities) and −120 mV dec−1 (at high current densities).49 To estimate the slope values for Pt on the four different catalyst supports, Tafel slopes were calculated and averaged over all four catalysts. The slopes are −62 ± 2 mV dec−1 and −123 ± 4 mV dec−1, demonstrating a very low deviation between the catalysts and thus, similar ORR mechanism for Pt catalysts on different substrates and ORR independency of the support characteristics. These results are in good agreement with previous reports.50,51
Comparison of the ORR polarization curves before and after durability testing reveals a small shift to lower potentials. This means that catalyst degradation led to increased overpotentials for ORR. The Tafel slopes are unchanged after AST, showing no change of the ORR mechanism. However, in the Tafel plots also the negative potential shift is visible. In total, all four catalysts enable a similar electrocatalytic O2 reduction reaction behavior, but with activity losses due to Pt aging.
Figures 4a–4d presents the cyclic voltammograms before and after catalyst exposure to 1,000 potential cycles. The CV curves with dashed lines show the cyclic voltammetry in an inert gas saturated solution and the CV curves with solid lines pertain to CO stripping voltammetry. Some common features of the four catalysts are observed. The hydrogen oxidation and reduction signals (approx. at 0.0–0.3 VSHE) are decreased after the AST, indicating loss of EASA. Moreover, the signal maxima are shifted by about 20 mV in all cases. The hydrogen oxidation is shifted to higher potentials, whereas hydrogen reduction is shifted to lower potentials, indicating a change in H-adsorption/desorption on Pt. Similar results are observed during CO stripping voltammetry. The signal maxima of CO oxidation underlie a shift of 10–30 mV to lower potentials in all cases. Faster CO desorption due to a lower binding strength of CO on Pt is the cause. According to Maillard et al.52 an increased mean Pt particle size results in this negative potential shift of CO oxidation. Furthermore, all catalysts show a CO peak narrowing after the stability test, suggesting the formation more defined and ordered Pt nanostructures.
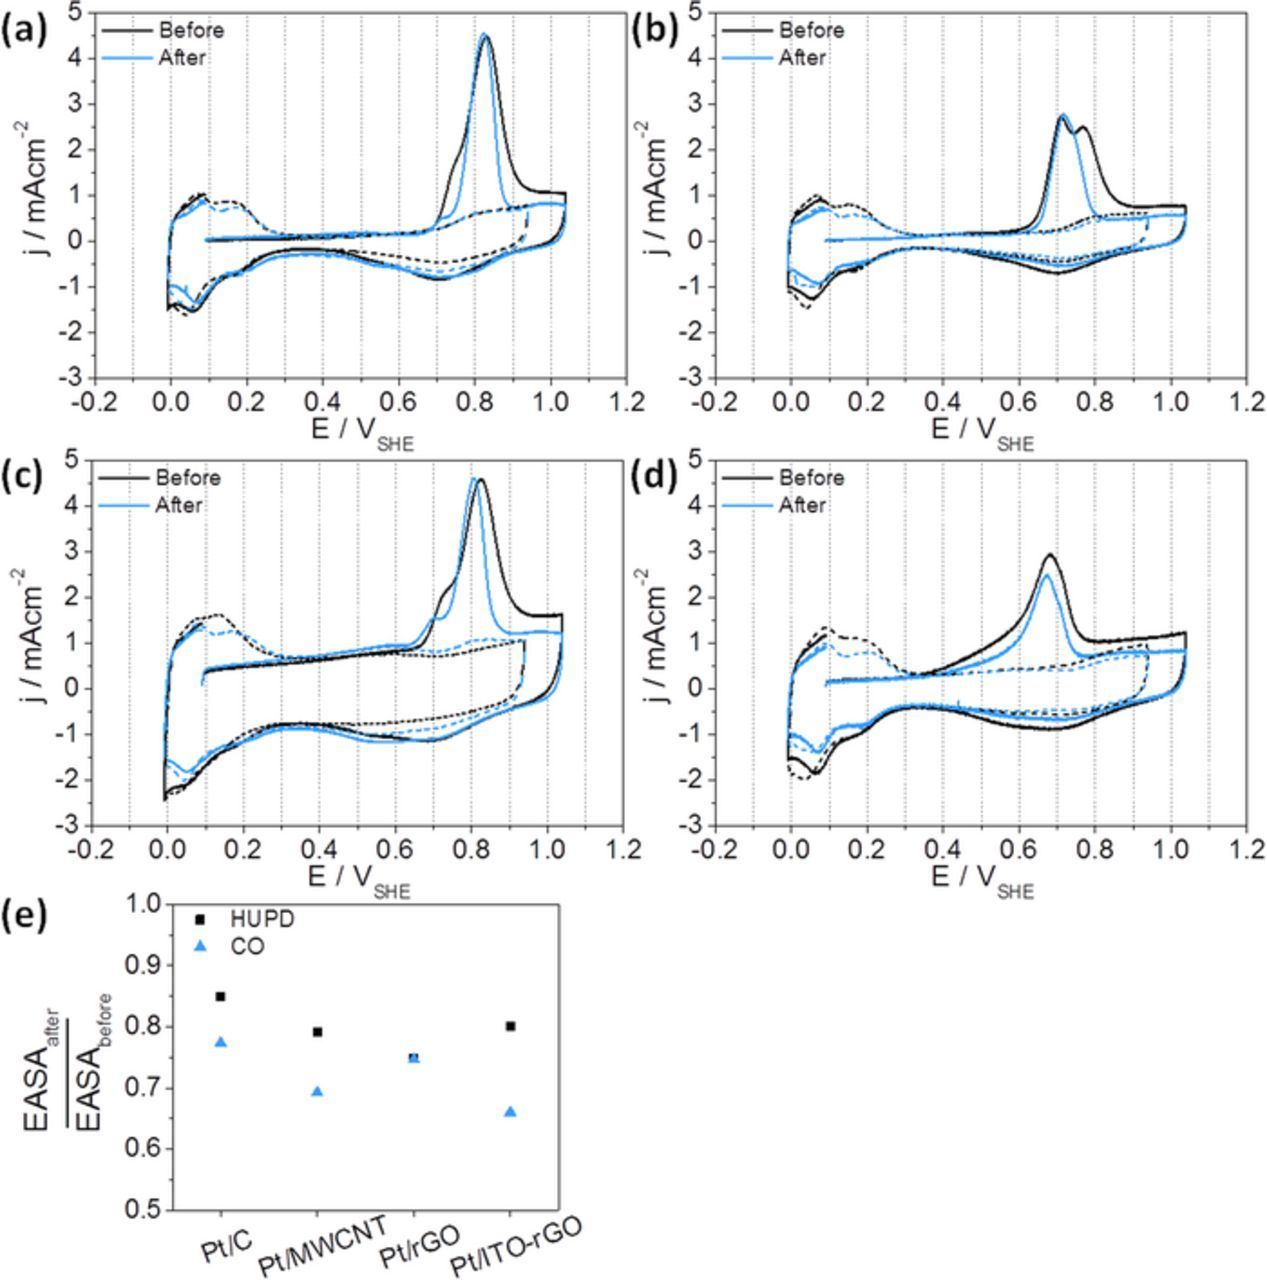
Figure 4. Cyclic voltammetry curves (−0.02–0.94 VSHE, 50 mVs−1, Ar-/N2-saturated 0.1 M HClO4, dashed lines) and CO stripping voltammograms (−0.02–1.04 VSHE, 50 mVs−1, Ar-/N2-saturated 0.1 M HClO4, solid lines) of (a) Pt/C, (b) Pt/MWCNT, (c) Pt/rGO and (d) Pt/ITO-rGO; EASAs derived from (e) HUPD and (f) CO adsorption.
Initial CO stripping voltammetry already reveals differences between the four catalysts in the Pt nanoparticle structure. The reason might lie in the direct synthesis of Pt, carried out in this work, including the nucleation and growth on the surface of the substrate. CO stripping voltammetry on Pt/C in Figure 4a gives the main signal at 0.82 VSHE with a distinct shoulder at lower potential. Taylor et al.53 also observed such peak shape for 20 wt% Pt on carbon black. They investigated different Pt loadings and found that the shoulder increased with rising Pt loading. Thus, it was related to the formation of Pt agglomerates. The main (111) surface site of Pt agglomerates is also visible in XRD (Figure 2). In total, the whole CO peak is narrower and shifted to lower potentials after stress testing, as discussed before.
In case of Pt supported on MWCNTs in Figure 4b two overlapping CO oxidation peaks with similar intensities occur in the initial curve, assuming higher numbers of Pt agglomerates. Moreover, the CO desorption takes place at lower potentials than Pt/C, assuming a lower CO binding. Because of the high CO sensitivity with regard to Pt surface structures,54 a different MWCNT support influence on Pt precipitation (Figure 4b) in comparison to the other carbon supports (carbon black in Figure 4a and rGO in Figure 4c) becomes apparent here. After finishing the stability test, mainly the left signal remained asymmetrically, which is caused by thermodynamically driven (111) Pt surface and agglomerate formation during potential cycling.53,54 IL-TEM measurements, shown later in this paper, confirm a strong Pt agglomeration during the stability test.
Pt/rGO in Figure 4c shows an initial CO oxidation peak at 0.82 VSHE, containing a second peak on the left side, similar to Pt/C. Jukk et al.26 prepared 20 wt% Pt nanoparticles on nitrogen-doped rGO by reduction of H2PtCl6 with ethylene glycol, the same synthesis route as used in this work. The CO oxidation peak center appears at a comparable potential of 0.83 VSHE, traced back to similar materials with same Pt precipitation on the support. Here, the final CO stripping voltammetry after AST shows a narrower peak with a shift to lower potentials due to Pt degradation, similar to Pt/C in Figure 4a.
CO stripping voltammetry on Pt/ITO-rGO is presented in Figure 4d. The CO adsorption on Pt/ITO-rGO significantly deviates from the other catalysts. Here, CO oxidation already starts below 0.4 VSHE and leads to an asymmetric peak, demonstrating the influence of indium tin oxide on the CO binding strength. The main signal occurs around 0.68 VSHE—located at lower potentials than in case of the other three materials (Figures 4a–4c)—and seems to overlap with a broad peak below 0.68 VSHE. Our study allows the direct comparison to CO sorption on Pt/rGO (Figure 4c), evidencing the distinct and negative peak potential shift of Pt/ITO-rGO in contrast to Pt/rGO. Although TEM analysis in Figure 1d shows also uniformly distributed platinum on rGO without ITO contact, the presence of ITO in this material seems to provide strong influence on CO stripping experiment. For verification, stripping voltammetry was also carried out on indium tin oxide nanoparticles. No adsorbed CO was observed on ITO, so that the ITO has no direct influence. Nevertheless, the CO binding on Pt is weaker for Pt/ITO-rGO, indicating an improved tolerance against carbon monoxide. Matsui et al.55 tested Pt on SnO2 and measured an oxidation peak of CO with the same shape. They assumed a positive effect on CO tolerance due to the Sn(II)/Sn(IV) redox couple.55 Ruiz Camacho et al.56 showed higher stretching frequencies of CO molecules adsorbed on Pt/SnO2–C in contrast to Pt/C via in situ infrared reflection absorption spectroscopy. Thus, metal oxides like tin (IV) oxide can have electronic influences on Pt which affects CO sorption significantly.
In order to investigate the EASA of platinum on alternative supports carefully, both established methods were applied and are contrasted in Figure 4e. The method of HUPD uses the charge from hydrogen oxidation on platinum at approximately 0.0–0.3 VSHE.6,57,58 The second method takes the oxidation of CO on platinum at around 0.6–1.0 VSHE.59 Equation 5 considers the revealed charge QPt of H2 or CO oxidation in correlation to the number of Pt surface atoms, the scan rate ν, the charge density ρ (HUPD with 2.1 C mPt−2 or CO with 4.2 C mPt−2) and the Pt loading on the electrode surface. EASA values have been related to Pt loadings measured by ICP mass spectrometry.
![Equation ([5])](https://content.cld.iop.org/journals/1945-7111/164/9/F995/revision1/d0005.gif)
Figures 4e shows the EASA values determined by these two methods for each catalyst. For Pt/C, HUPD gave an initial EASA of 84 m² gPt−1, whereas CO stripping gave a higher EASA of 90 m² gPt−1. In case of Pt/MWCNT it is reversed: EASA from HUPD is higher (71 m² gPt−1) than from CO stripping (64 m² gPt−1). Thus, no clear tendency of higher or lower EASA values can be observed between HUPD and CO stripping voltammetry. Every method includes assumptions for calculation. For instance, the HUPD method assumes the formation of a complete adsorbed hydrogen monolayer on Pt. One H atom is bound to one Pt atom. Although CO represents the stronger adsorbate, bridging bond condition of one CO molecule on two Pt atoms is presumed in Equation 5, which might actually differ since on-top adsorption is also possible.60 The mechanism of CO adsorption, oxidation and desorption depends on various conditions. Especially the Pt nanostructure and electronic effects of supports have an influence, which is clearly pointed out in Figures 4a–4d with respect to the deviating CO oxidation peak shapes.
But still, EASA losses are determined in Figure 4e for all four catalysts after AST, whereby losses determined through CO method (except Pt/rGO) are higher than EASA determination from HUPD. For example, the Pt/ITO-rGO results from both methods strongly deviate. HUPD gave a loss of 20%, whereas CO stripping gave a loss of 34%. Already the initial EASAs are very different for Pt on ITO-rGO. HUPD gave 58 m² gPt−1 and CO stripping 43 m² gPt−1. EASA-CO in this case deviates much more (26%) than for the other catalysts. The very early CO oxidation below 0.4 VSHE on Pt/ITO-rGO catalyst suggests a deviating CO adsorption mechanism with an incomplete CO coverage on Pt. Thus, HUPD values are considered for degradation estimates. These losses are very similar for the catalyst between 20% and 25%, whereas Pt on carbon black showed a change of 15%.
Sheng et al.24 investigated the durability of Pt/C and Pt/MWCNT, at 1.5 VSHE hold for 36 h. Pt on MWCNT showed a more stable EASA (loss of 35%) than Pt on carbon black (loss of 55%). Kou et al.32 exposed Pt/rGO and Pt/ITO-rGO to a chronoamperometric potential switching (22 h, 150 s 1.40 VSHE and 30 s 0.85 VSHE). Under these conditions, Pt/ITO-rGO seemed to be more stable than Pt/rGO. The durability of indium tin oxide under PEMFC conditions was examined in further studies. Wang et al.61 investigated Pt on very similar materials like in this work. Pt on 22 nm ITO particles (here, 23 nm ITO particles from XRD) and Pt supported on Vulcan XC72R (here, the same carbon black type) were compared. After 10,000 CV curves between 1.0 and 1.5 VSHE, the EASA loss of Pt on ITO was only 4% and the EASA loss of Pt/C was about 40%. Liu et al.18 compared Pt on 5 nm ITO particles with Pt/C. They performed the same AST like this study with 1,000 CV curves between 0.0–1.4 VSHE in O2 saturated 0.1 M HClO4. They showed a stable EASA in case of Pt/ITO due to higher durability, whereas the EASA of Pt on carbon black decreased about 35%. In total, the stability of Pt on ITO under cathodic fuel cell conditions is validated in two studies. Nonetheless, the combination of ITO with reduced graphene oxide could have a positive effect on the electrical conductivity,33 which is important for application as catalyst support.
Tiido et al.19 also prepared Pt on a hybrid containing a metal oxide and rGO. Pt/TiO2-rGO was tested under similar conditions reported here, which are 1,000 potential cycles between 0.05 and 1.3 VSHE. Large EASA loss about 80% was determined. Their results also showed an EASA loss for Pt/C about 75%. Here, Pt/C lost 15% (HUPD) of the EASA, whereas the EASA loss of Pt on ITO-rGO counted 20% (HUPD). Although the trends for Pt on nanocomposites and Pt/C are similar in this and Tiido's study, the here measured EASA losses are significantly lower. Maybe differences in the tested nanostructured materials and other test conditions are causes for this deviation between both studies. In general, TiO2 is known as insulator, whereas indium tin oxide represents an electrical conductive oxide.
Zamora et al.62 studied Pt on silicon carbide (SiC) alone and in combination with titanium carbide (TiC), and compared the results with Pt/C. After 400 cycles between −0.21 and 1.00 VAg/AgCl, EASA of Pt/C decreased more (34%) than Pt/SiC (22%) or Pt/SiCTiC (18% or 15%). Only platinum on the material with highest TiC content (30 mol%) showed a higher EASA reduction (39%). Concluding their results, these carbide supports can have a positive effect on Pt stability.
Support degradation
Support degradation can be electrochemically monitored by two different parameters. Firstly, the formation of hydroquinone/quinone species on the support surface provides an evidence of carbon corrosion. Oxidation of hydroquinone to quinone can be detected during cyclic voltammetry experiments at around 0.6 VSHE. The charge QHQ/Q is proportional to the amount of hydroquinone functionalities. Secondly, the double layer capacitance CDL can be used as an indication for the total electrode surface area that is wetted by the electrolyte. In case of the support materials, the direct investigation of CDL from CV curves is possible without interferences of faradaic processes at appropriate potentials. Thus, CDL is calculated at potentials of 0.10, 0.15 and 0.20 VSHE and averaged for each support material.
In case of Pt catalysts, the platinum reactions impede the CDL determination. To be able to determine the CDL the hydrogen adsorption was suppressed via adsorption of carbon monoxide on the Pt surface. Subsequently, the cyclic voltammetry was carried out in the potential window from −0.02 to 0.24 VSHE as proposed in the literature.46 In case of the substrates a continuous detection of both parameters (QHQ/Q and CDL) during the durability test is possible. However, the Pt catalysts are characterized on their support properties as part of the initial and final characterization using CO adsorption. Figure 5 points out the support degradation of the Pt catalysts before and after stability testing.
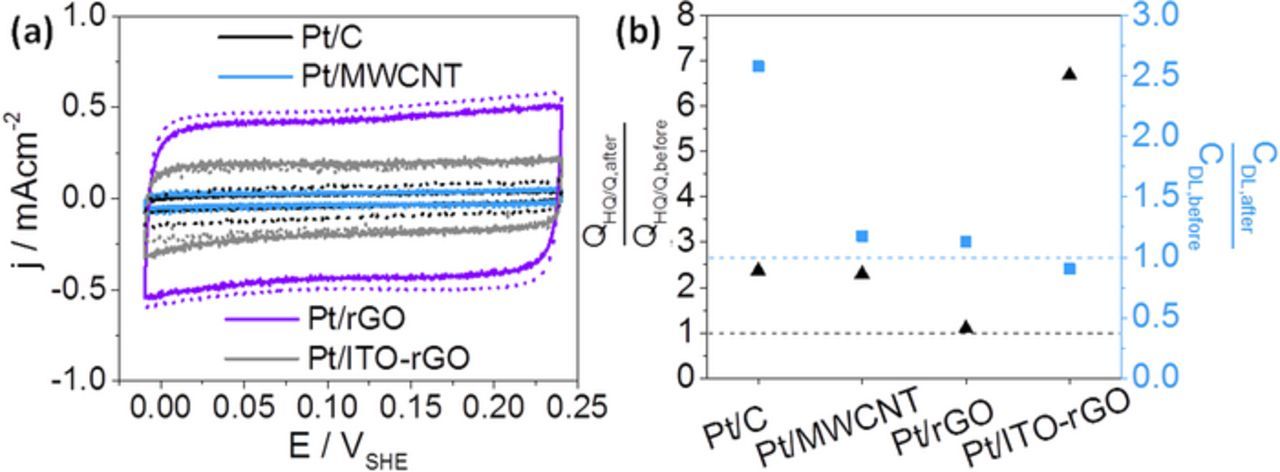
Figure 5. Cyclic voltammetry curves with adsorbed CO on Pt catalysts (−0.02–0.24 VSHE, 50 mVs−1, Ar-/N2-saturated 0.1 M HClO4; Before AST with solid lines and after AST with dashed lines) (a) and QHQ/Q and CDL ratios between before and after AST for Pt catalysts (b).
Cyclic voltammetry with adsorbed CO on Pt catalysts is shown in Figure 5a. The highest capacitive current density is obtained for Pt/rGO as a consequence of the highest support surface area, determined by N2 adsorption applying the BET formalism (286 m2 g−1 in Table II). Other influences next to electrode porosity are the electrolyte, CV scan rates and particularly surface hydrophilicities. Pt/MWCNT and Pt/C result in lowest capacitive current densities in Figure 5a and show very similar CV curves. By comparison of the CV curves before and after the potential cycling it is found that the studied materials exhibit significant differences in their stability. In contrast to Pt/MWCNT the double layer capacitance of Pt/C obviously changed to higher values.
Figure 5b gives a closer view on the support stabilities and compares changes in HQ/Q amounts with the change of the double layer capacitance. Ratios from values taken after and before the performance of potential cycling are shown, whereas the dashed lines indicate an unchanged state. Before discussing Figure 5b in detail, the consideration of changes in the Pt nanostructure during the performed test is required. The EASAs of platinum in Figure 4 and TEM images in Figure 7 reveal Pt degradation and especially agglomeration, leading to a decreased electrochemical active surface area in Figure 4, which should result into a reduction of the CDL.
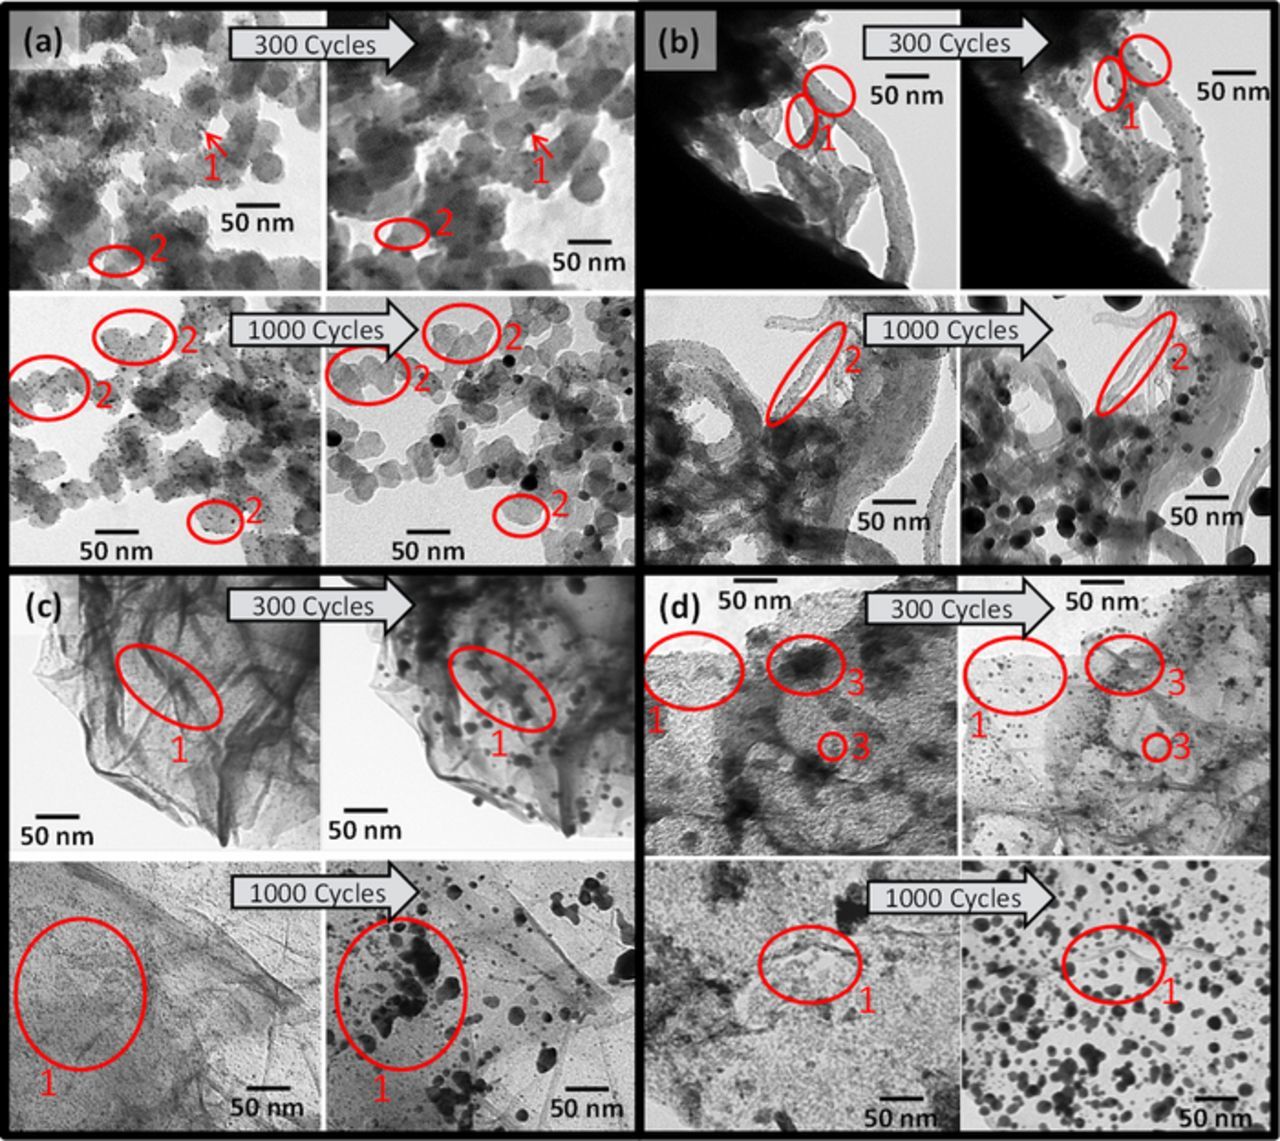
Figure 7. IL-TEM images of (a) Pt/C, (b) Pt/MWCNT, (c) Pt/rGO and (d) Pt/ITO-rGO before and after 300 or 1,000 CV curves (−0.02–1.40 VSHE, 500 mVs−1, O2-saturated 0.1 M HClO4); Pt agglomeration marked with 1, Pt detachment/dissolution marked with 2 and ITO particles marked with 3.
With regard to Pt/C an increased CDL by a factor of 2.6 is observed in Figure 5b, although the area of platinum has been decreased during the durability test. The double layer capacitance is also affected by the surface area of carbon black and its oxygen-containing surface groups, promoting better wettability. For the Pt/C catalyst an increase of HQ/Q species on carbon black by a factor of 2.4 is measured after the potential cycling, which can contribute to the rise in the CDL. Speder et al.13 also prepared Pt on Vulcan XC72R. They performed two different ASTs. The simulation of start-stop conditions at high potentials (27,000 CV curves, 1.0–1.5 VSHE) induced significantly more HQ/Q formation than cycling at lower potentials (9,000 cycles, square-wave potential steps, 3 s at 0.6 VSHE and 3 s at 1.0 VSHE). Thus, a significant degradation of carbon black in this work using a potential cycling from ∼0.0 VSHE up to a high potential of 1.4 VSHE was expected.
As it can be observed in Figure 5b Pt/MWCNT and Pt/rGO showed the smallest changes in the CDL. Although QHQ/Q in Pt/MWCNT increased by a factor of 2.3, its double layer capacitance is nearly unchanged after the durability test. For Pt/rGO both indicators for support degradation are nearly constant. Sheng et al.24 performed potential holding at 1.5 VSHE for 36 h and compared Pt/MWCNT with Pt/C. The double layer currents at 0.6 VSHE increased stronger in case of Pt/C (approximately by a factor of 2.2) than in case of Pt/MWCNT (approximately by a factor of 1.1), so that MWCNTs are apparently more stable under their experimental conditions. The here presented aging test leads to similar results of CDL (2.3 for Pt/C and 1.2 for Pt/MWCNT) and also evidences the better stability of MWCNTs in comparison to carbon black.
Furthermore, Figure 5b shows the strongest increase in HQ/Q of 570% for Pt/ITO-rGO. For comparison, Pt/rGO shows a negligible increase of QHQ/Q of 10%, although the double layer capacitance is nearly unchanged for both samples. The application of a nanocomposite with two materials (indium tin oxide and reduced graphene oxide) includes competitive Pt binding sites on one or the other material. The rGO surface might be more preferred for Pt precipitation than the ITO surface. In that case, the catalytic effect of Pt on carbon corrosion causes the stronger HQ/Q formation in Pt/ITO-rGO.4,63,64 An additional reason could be the previous suppression of HQ/Q redox activity caused by ITO anchoring on rGO surface groups, followed by possible ITO degradation and detection of HQ/Q which is not suppressed anymore. But no changes in cDL for Pt/ITO-rGO are visible, because platinum degradation may has a contrary effect on double layer capacitance than ITO aging.
The overall comparison of the four catalysts by consideration of HQ/Q as well as the double layer capacitance shows that carbon black exhibits the strongest support aging, whereas the lowest changes in Figure 5b are seen for MWCNTs and rGO. XRD analysis demonstrated the higher graphitic degree of MWCNTs and rGO, accompanied by lower cDL and QHQ/Q changes and in consequence higher electrochemical stability in contrast to carbon black. Moreover, Figure 5 outlines the absence of rGO stabilization through ITO.
In addition to the accelerated stress testing of the catalysts, the substrates without deposition of Pt nanoparticles were also aged using the same durability test. Due to the absence of platinum related reactions, the QHQ/Q as well as CDL can be evaluated in-situ over time of stress testing, allowing statement on time-dependent support degradation. Correspondingly, the behavior of the QHQ/Q and CDL for all supports during the stress tests is shown in Figure 6. In order to point out potential cycling induced changes, the values after AST are shown in relation to the values before AST.
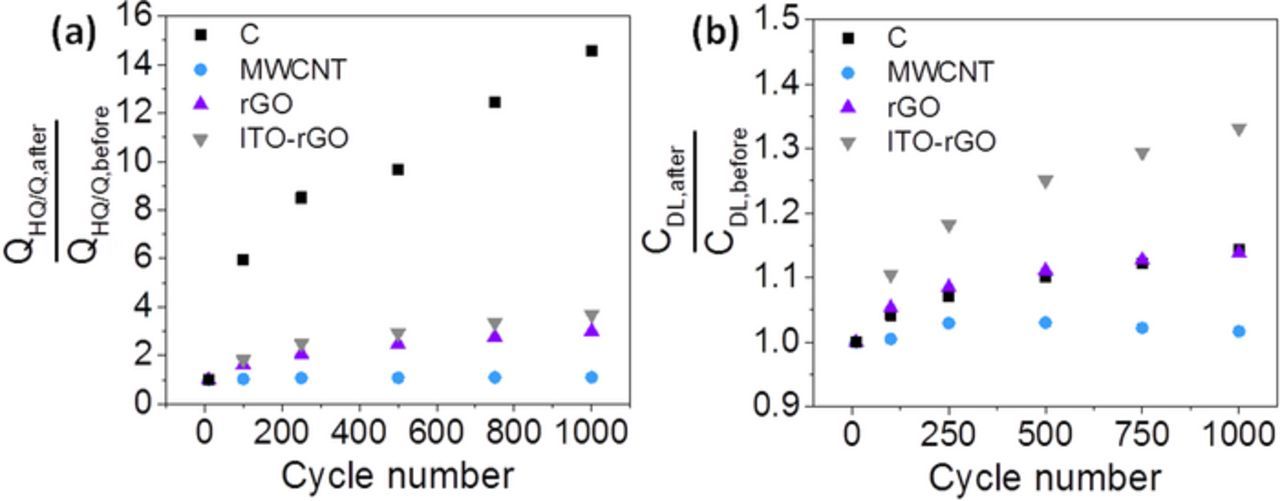
Figure 6. QHQ/Q (a) and CDL ratios (b) between before and after AST for the substrates. Repetitive potential cycling of the substrate materials was conducted in O2-saturated 0.1 M HClO4 (−0.02–1.40 VSHE, 500 mVs−1).
Figure 6a shows a significant growth of HQ/Q species on the surface of carbon black by a factor of 15 after 1,000 potential cycles. The highest HQ/Q formation is observed during the first 100 cycles. This HQ/Q formation affects also the double layer capacitance of carbon black in Figure 6b which in total increased by 14%. Nevertheless, the CDL is also affected by other surface functionalities and by the surface area. The strongest change in CDL also takes place during the first cycles so that a logarithmic aging of the carbon black support can be assumed with approximation to a more stable system.
In contrast, MWCNTs show constant behavior and no significant changes are visible during the stress cycling. QHQ/Q shows the lowest percentage of increase (10%) of all investigated materials. The higher resistance of MWCNTs against corrosion can be understood through consideration of the carbon nanomaterial structure. XRD in Table II showed lowest graphitic interlayer distance (0.339 nm) compared to the other materials and thus most similar to graphite (0.335 nm). The specific surface area was the lowest by comparing the carbon materials in Table II which might cause higher stability due to lower porosity. The MWCNT structure is characterized by rolled-up and highly ordered graphene sheets. Thus, these MWCNT sheets are stabilized and represent a closed structure, which complicates chemical attacks. Next to carbon black and rGO, the carbon nanotubes also possess defects. But these defects are less susceptible to the formation of oxides in comparison to the free and dangling defect sites in rGO and carbon black. The results show that MWCNTs are characterized by a higher resistance upon oxidation than other support materials, which is in good agreement with literature.65 Also the double layer capacitance is nearly unchanged so that MWCNTs represent in this study the most stable substrate.
In Figure 6a reduced graphene oxide and rGO with deposited ITO have a very similar HQ/Q formation over the number of cycles. The HQ/Q contribution comes from rGO and obviously underlies no impact of precipitated ITO nanoparticles. Changes of the double layer capacitance are shown in Figure 6b. Similar to observations in Figure 5, no positive effect on the stability induced by ITO nanoparticles is observed in Figure 6. Quite the contrary, CDL of ITO-rGO increased by 33%, whereas CDL of only rGO increased by 14%. Thus, the double layer capacitance of ITO-rGO rises significantly stronger with potential cycling which must be traced back to indium tin oxide as only difference between the two experiments. Kou et al.32 performed a carbon corrosion test of rGO as well as ITO-rGO (chronoamperometric potential holding from 0.8 to 1.6 VSHE). Reduced graphene oxide showed a higher corrosion current than ITO-rGO. Thus, Kou et al. suggested an improved stability of rGO due to ITO anchoring. In this work, a stabilization of rGO by ITO particles is not observed. The deviating observations might be caused by differences in the material, the performed stress test and in particular the measurement of other indicators for carbon corrosion.
In sum, the durability testing of Pt catalysts and the separate testing of the substrates give the result of the strongest support degradation in case of carbon black, whereas multiwalled carbon nanotubes are significant more stable under potential cycled conditions between ∼0.0–1.4 VSHE. The highest graphitic interlayer distance and the lowest crystallite size in XRD presumed higher instability of carbon black by means of lowered degree of graphitization and thus support the electrochemical findings in Figure 6.
Identical location TEM
Finally, identical location TEM was performed as additional tool to verify the electrochemical results of the platinum catalysts. Therefore, every catalyst was tested twice. The first samples were exposed to 300 potential cycles in order to provoke low Pt degradation and to allow identification of single Pt nanoparticles after potential cycling. The second series with each catalyst completed 1,000 potential cycles to allow direct comparison to the electrochemical results. IL-TEM images are discussed toward Pt degradation, but they are not used for investigations of carbon corrosion due to limited resolution.
Figure 7a demonstrates platinum agglomeration (marked with 1) on carbon black after 300 CV curves. In other areas Pt nanoparticles disappeared after 300 cycles (marked with 2) in the wake of detachment or dissolution. After 1,000 CV curves the platinum disappearance dramatically increased in larger areas (circles marked with 2). Rediscovering of Pt particles is hampered after 1,000 cycles, because on one hand strong Pt degradation took place and on other hand the electrochemical conditions up to 1.4 VSHE result into instability of the TEM grid. Gold atoms can dissolve and re-precipitate elsewhere (Au/Au3+ redox active at 1.36 VSHE).66,67 Because of this hampered Pt rediscovering, no measuring of Pt nanoparticle sizes from IL-TEM images after AST was done.
Zana et al.68 also investigated Pt/C aging using IL-TEM during different accelerated stability tests. They showed a dependence of degradation on the type of AST. Square-wave potential cycling between 0.6–1.0 VSHE (3 s each) provoked mainly Pt nanoparticle migration and Ostwald ripening. CV between 1.0–1.5 VSHE mainly led to detachment. Although the Pt particles have grown, Pt is still dispersed on carbon black, which leads to the appropriate EASA of Pt/C even after AST (Figure 4e, EASA loss of 15% using HUPD).
Figure 7b shows Pt aging on MWCNTs after 300 and after 1,000 potential cycles. Pt agglomeration and Pt disappearance can be seen (circles marked with 1 and 2). Pt on rGO in Figure 7c reveals Pt agglomeration (marked with 1), going along with a reduced dispersion of Pt on the rGO surface. The preferred re-deposition at wrinkled edges is observed. Pt/ITO-rGO in Figure 7d shows very similar aging with respect to platinum agglomeration (marked with 1). Next to Pt particles in Figure 5d, the larger ITO particles and particle aggregates are imaged, encircled and labeled with number 3. Although ITO identification is impeded due to precipitated Pt on the whole depicted support surface, we can identify ITO via differences in size (analysis of mean particle sizes in section Physical characterization). Already the microscopy after 300 cycles illustrates that some ITO particles obviously disappeared. This might refer to the inconstant double layer capacitance of ITO-rGO observed in Figure 6b.
Overall, IL-TEM reveals similar Pt aging on different substrates as confirmation to similar EASA loss rates and similar negative potential shifts of the ORR polarization curves. However, after 1,000 cycles the Pt particles on carbon black in Figure 7a seem to be slightly smaller than on the other supports. This goes along with lower EASA loss of Pt/C in HUPD, whereas instability of the golden TEM grid still inhibits final Pt identification.
Conclusions
Four different supports for platinum catalyst have been investigated toward their stability under conditions similar to PEMFCs. Next to commercial carbon black and MWCNTs, reduced graphene oxide and an ITO-rGO composite were prepared and studied on their durability.
- – CO stripping voltammetry showed a different mechanism of CO sorption on Pt/ITO-rGO, compared to the other carbon-based catalysts. Direct comparison to Pt/rGO without ITO revealed an early CO oxidation below 0.4 VSHE and thus improved CO tolerance of Pt on ITO-rGO. Due to CO sorption sensitivity, support influences on Pt precipitation become apparent. Pt/MWCNT provides different Pt surfaces than Pt/C or Pt/rGO.
- – The exposure to an accelerated stress test (−0.02–1.40 VSHE) showed similar EASA and ORR activity losses of platinum without significant dependence on the substrate.
- – However, analysis of double layer capacitance and changed amounts in HQ/Q species on the carbon surfaces revealed deviations in the degradation of the four substrates. While carbon black exhibits highest electrochemical instability, MWCNTs resulted in the lowest support degradation.
- – Interestingly, highest support instability in case of carbon black has not the consequence of stronger Pt degradation. For better understanding of the complex fuel cell aging, the applied stress test creates an almost similar Pt degradation on all four substrates although the different supports degrade to different extent. Thus, Pt detachment due to support aging is assumed to be a negligible degradation path and rather Pt dissolution and agglomeration are dominant.
- – Last, although rGO showed also higher stability than conventional carbon black, no further stabilization by ITO was achieved. Double layer capacitance and IL-TEM evidenced changes in ITO provoked by AST.
- – MWCNTs meet the stability criteria of low corrosion and stable electrode surface area for PEMFC application best.
Acknowledgments
The authors thank for financial support by the Bundesministerium für Wirtschaft und Energie in the framework of the project QUALIFIX. The funding for the research stay at the University of Tartu (Estonia) from the Bundesministerium für Bildung und Forschung in the framework of the project NETonia is greatly appreciated. Moreover, the authors thank Dr. Lidiya Komsiyska (NEXT ENERGY) and the members of the working group of Dr. Kaido Tammeveski (Tartu) for fruitful scientific discussions and Hendrik Multhaupt (University of Oldenburg) for BET measurements. This work was also supported by institutional research funding (IUT20-16) of the Estonian Ministry of Education and Research and by the EU through the European Regional Development Fund (TK141 "Advanced materials and high-technology devices for energy recuperation systems").