Abstract
Reduced capacity and rate capability at low temperature operation is a limiting factor for application of lithium-ion batteries in electro mobility. The visualization of electrode inhomogeneity resulting from low-temperature lithium transport limitations can illustrate the shortcomings of current electrode design. To study anode lithiation gradients and relaxation processes, we performed time-resolved in situ neutron diffraction measurements of a commercial high power LiCoO2/Graphite pouch bag battery operated in the temperature range of −20°C to 40°C.
With decreasing temperature, strong anode polarization is observed with phase coexistence of LiC12 and lower lithiated phases LiC18 and Li1-xC54 during and after discharge. Phase coexistence is maintained only briefly at 25°C but lasts over 6 hours at −10°C before equilibration. The long-term relaxation phenomena can be attributed to slow lithium transport within particles at low temperature. Analysis of the relaxation times and particle size distribution yields effective diffusion constants for lithium transport in graphite of 1.7 × 10− 10 cm2 s− 1 at room temperature and 0.7 × 10− 11 cm2s− 1 at −10°C. We find that a moderate discharge rate is sufficient to cause considerable anode polarization at low temperature, while at higher discharge rates up to 5C, self-heating reduces polarization and relaxation time.
Export citation and abstract BibTeX RIS

This is an open access article distributed under the terms of the Creative Commons Attribution 4.0 License (CC BY, http://creativecommons.org/licenses/by/4.0/), which permits unrestricted reuse of the work in any medium, provided the original work is properly cited.
Lithium-ion batteries are used in a range of applications, from small batteries in portable electronics to large battery systems in electric vehicles and stationary storage, because of their high energy density, safety and long-term stability. Some applications, such as electric vehicles (EV), hybrid electric vehicles (HEV)1 or aerospace,2 require operation at a wide temperature range. These ambient conditions are challenging, as low temperatures can affect lithium-ion batteries negatively in several ways. Lithium-ion cells show an energy and power loss at low temperatures.3 Charging may cause deposition of metallic lithium (lithium plating) at the anode.4 Prolonged cycling leads to increased electrode degeneration.5 Deep discharge can cause current collector corrosion.6 As a result, low temperature operation can cause safety problems including global battery failure.7
Temperature has a broad effect on the battery components and processes. Lithium transport through the electrolyte slows down with decreasing temperature as the electrolyte diffusivity and conductivity decrease.8,9 Similarly, lithium transport through the active material is deaccelerated due to decreasing solid diffusion coefficients of graphite10,11 and cathode materials.12 The overall cell impedance increases at low temperature, as shown with reference electrode experiments.13,14
Graphite anodes are particularly affected by low temperatures. Increased low frequency resistances are associated with hampered charge transfer processes at the solid electrolyte interface (SEI).15 With the potential of lithium intercalation into graphite close to the potential of metallic lithium Li/Li+ deposition ( ∼ 100 mV),16,17 Wang et al. argue that overpotentials at low temperature can quickly exceed this value and prevent intercalation.18 Furthermore, graphite is a complex material with a range of possible morphological and crystallographic configurations.19,20 The transport of lithium in particles depends on the graphite crystallinity and stage of lithiation.21,22 Charge transfer resistance decreases with increasing graphite surface area.23 Transport in the electrolyte depends on the tortuosity of the layer which depends on particle shape and radii distribution.24,25 Consequently, low temperature performance of graphite based anodes is generally considered to be a major obstacle in lithium-ion battery applicability.26 Efforts have been made to improve electrolyte low temperature properties, by using novel lithium salts27,28 or solvent combinations29–31 with a lower freezing point and a higher conductivity. At the cell level, batteries are developed with incorporated heating devices instead of less efficient external heating.32 Transport processes are simulated with physicochemical models to identify the critical parameters for an optimized electrode design.33
However, with the broad impact of low temperatures on batteries it is difficult to determine the dominating limitation in cells compared to laboratory systems. Measurements with large format cells close to application, preferably in situ, are needed due to the transient nature of the inhomogeneity caused by transport limitations. Several experimental techniques have been applied for this purpose. Electrochemical Impedance Spectroscopy (EIS) has been successfully applied to investigate low temperature effects in several experiments.10,15,21,27,34 More recently, neutron diffraction (ND) has been applied to lithium-ion batteries to study structure dynamics,35–37 lithium plating,4,38 overcharge, or current depending phase evolution.39,40 Neutrons have excellent sensitivity toward lithium and fast in-situ measurements are possible by focusing on a narrow angular range. Several diffraction experiments found multiple coexisting graphite phases as a result of transport limitations at a high discharge rate or lower temperature. These experiments, as well as our own previous investigation of graphite relaxation processes41 use commercial, high energy cylindrical cells. These cells are typically chosen due to their high active material weight fraction and radial symmetry, where best data quality can be achieved in combination with a large gauge volume. However, considerable potential42–45 and temperature gradients34,46–48 as well as local state of charge (SoC) differences49–51 have been observed in simulations and measurements of cylindrical cells. As the difficulty to interpret the observed graphite phases increases with the number of effects contributing to SoC inhomogeneity in the gauge volume, we use a small format pouch cell to reduce temperature and potential gradients within the gauge volume.
In our contribution, we study the graphite phase evolution during discharge and relaxation for a high power LiCoO2/graphite pouch battery by applying time-resolved in situ neutron diffraction. For further analysis of the ND data, additional information on electrode properties is acquired via post mortem investigation of graphite particle shape and size, as well as temperature dependence of cell impedance. We assess the rate and temperature dependence of the anode phase polarization and analyze the relaxation time in comparison to previous results obtained with cylindrical cells.
Experimental
Cells and cycling
A commercial lithium-ion battery (C1 = 540 mAh at 300 K, 3.7 V) with a graphite anode and LiCoO2 cathode was studied in the experiments. The electrolyte contains lithium hexafluorophosphate (LiPF6), ethylene carbonate (EC), and dimethyl carbonate (DMC). The battery is designed for high power use and allows 1C continuous charging and 12C continuous discharging in a temperature window of 0°C to 60°C. The specified storage temperature window is given as −10°C to 45°C. The battery dimensions are 5.0 cm × 3.1 cm × 0.54 cm (length × width × height) with 18 anode and 17 cathode sheets. The battery properties are summarized in Table I.
Table I. Battery properties.
| Layout | High power pouchbag |
|---|---|
| Active material | Graphite | LiCoO2 |
| Capacity | 540 mAh (C1 @ 25°C) |
| Max./ min./ avg. voltage | 4.2 V/3.0 V/3.7 V |
| Max. cont. current | +1C/−12C |
| Dimensions | 5.0 cm × 3.1 cm × 0.54 cm |
| Electrode sheets (a/c) | 18/17 |
| Areal capacity | 1.4 mAh cm−2 |
A BaSyTec GSM cell tester was used for determination of temperature dependent capacity and rated capacity. Rated capacity was determined for constant current (CC) discharging at 0.1C, 0.2C, 0.5C, 1C, 2C, 3C and 5C (3.0 V, 300 K; constant current constant voltage (CCCV) charging (ICC up to 1C, ICV<0.1C, 4.2 V)). Temperature dependent capacity was determined with CCCV (I<0.1C, 4.2 V, 300 K) charging and CCCV (I<0.1C, 3.0 V) discharging at 40°C, 25°C, 10°C, 0°C, −5°C, −10°C, −15°C and −20°C. Temperature dependent impedance was determined with a sample that was discharged ΔQ = 420 mAh from 100% SoC to a target SoC of 22%. At that SoC AC impedance was measured with constant potential with a Biologic VMP3 in the frequency range of 10 mHz to 10 kHz. All tests were performed in a Binder KT170 climate chamber.
During the neutron diffraction measurements, cycling was performed with a BioLogic VSP potentiostat equipped with a 100 A booster unit. Prior to each discharge and relaxation experiment, the battery was charged to 100% SoC using a constant current constant voltage (CCCV) procedure (4.2 V, 1C, I<0.05C). To prevent lithium-plating, all charging was performed at 300 K. For the diffraction experiment, the battery was placed onto a sample stick (Figure 1) and inserted into a cryostat. Helium was used as contact gas for thermal coupling.
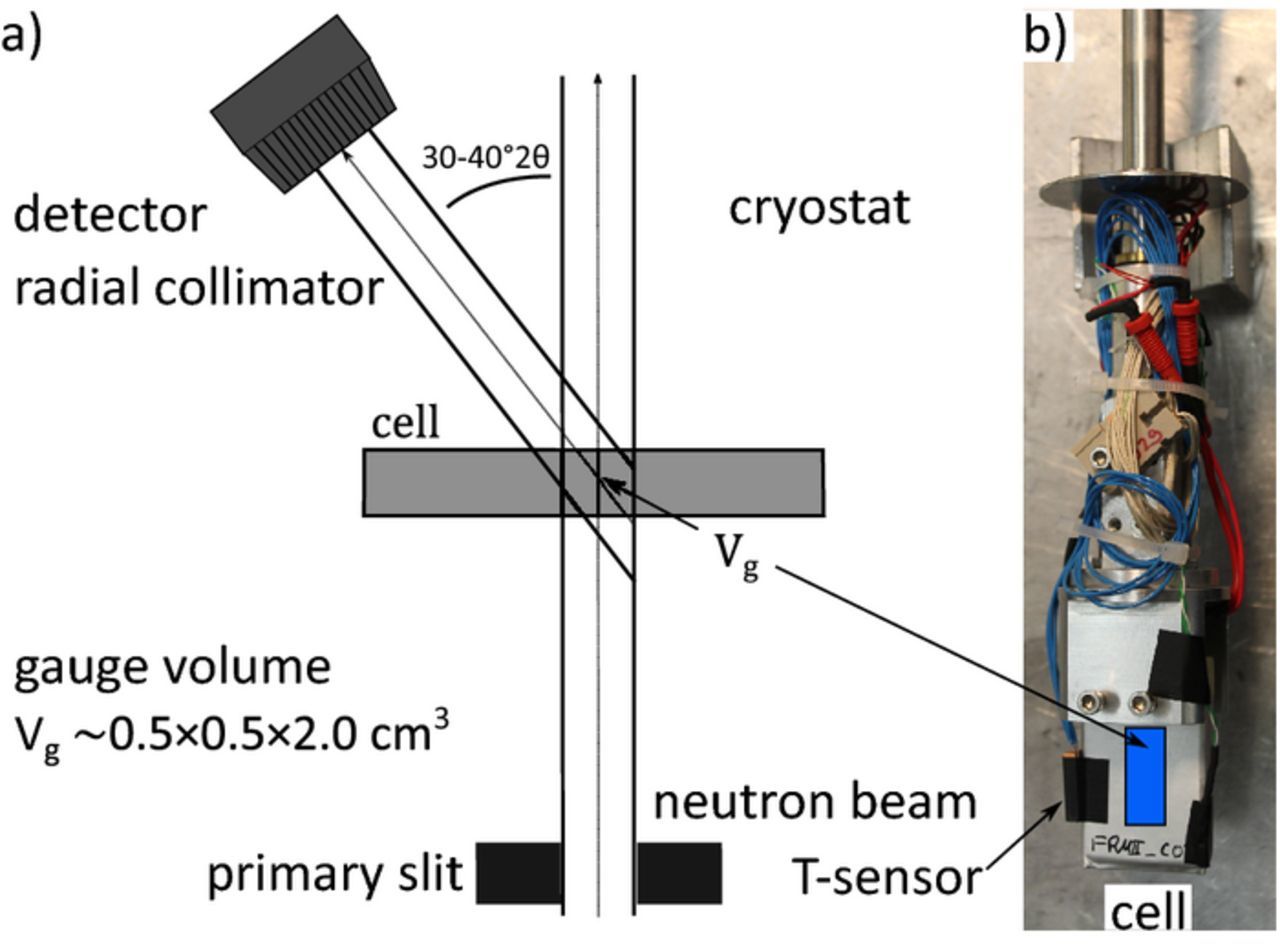
Figure 1. (a) Schematic of Stress Spec instrument with neutron beam trajectory. (b) Battery mounted on the sample holder of the cryostat. The area penetrated by the neutron beam is marked in blue.
Neutron diffraction
In situ neutron diffraction data were collected at the material science diffractometer STRESS-SPEC at Heinz Maier-Leibnitz Zentrum.52,53 The neutron wavelength was determined with NIST SRM 640d Si standard powder to λ = 2.0964(2) Å at room temperature. We observed a 0.227902 Å at room temperature. All data presented in this publication is corrected with this zero-shift. The scattering gauge volume Vg≈ 0.5 cm3 was set by a 5 × 20 mm2 entrance slit and a 5 mm radial collimator in front of the detector (Figure 1). Since our experiment focuses on lithiated graphite phases during discharge, we collected diffraction data in a limited 2θ range of 28° < 2θ < 42°. The limited fixed 2θ range allows for fast continuous data collection in 3 min intervals with sufficient signal quality. For measurements showing slow graphite phase changes during relaxation, data were combined to 6–30 min intervals to improve signal to noise ratio. The raw data correction and reduction were carried out with StressTextureCalculator.54 Pawley analysis of the integral intensity of Li1-xC6 reflections was performed using Highscore55 and Matlab to fit the data. Integral intensities were determined using pseudo Voigt profiles. For strongly overlapping peaks the FWHM (full width at half maximum) was constrained between reflections.
Post mortem analysis
A fully discharged cell was disassembled in a glove box with argon atmosphere (MBRAUN; < 1 ppm H2O & < 1 ppm O2) to extract the graphite anode. Top view and cross view scanning electrode images (SEM, Instrument: JEOL JSM 6000) were taken from a washed (20 min in DMC) and vacuum dried anode. Particle size and shape distribution were determined using BruggemanEstimator.25 Li-metal/electrode half-cells were built for DVA analysis using 14 mm diameter electrode material and 16 mm diameter metallic lithium in 2032 coin cells with 160 μl electrolyte (1M LiPF6 in EC:EMC (3:7) + 2% VC).
Test procedure
Multiple scenarios were monitored to study the impact of discharge rate and battery temperature on the homogeneity of the graphite anode during discharge and relaxation. From a fully charged state, discharge at a rate of 0.9C (1.25 mA/cm2) was performed for controlled temperatures of −10°C, 0°C and 25°C. At 0°C, additional higher rate discharges at 1.8C (2.5 mA/cm2), 3.5C (5.0 mA/cm2) and 5.3C (7.5 mA/cm2) were conducted. For the sub-ambient temperature discharge experiments, the battery was cooled down to the target temperature for a cooling period of 45 minutes. In order to achieve the same state of lithiation in the graphite anode independent from temperature-induced polarization or a reduced capacity due to limited rate capability, an Ah-based discharge limit was used instead of a voltage cutoff. The battery was discharged to a target SoC of 22% which corresponds to a fixed discharged amount of ΔQ = 420 mAh. The subsequent relaxation was monitored up to 6 hours.
Discharge target SoC
The particular target SoC of 22% was chosen as a result of the following examination. As the full cell is discharged, the carbon in the anode is delithiated and undergoes a well-known structural change from LiC6 over LiC12 and several lower lithiated phases Li1-xC6 to graphite. Figure 2 shows the two-phase regime of LiC6 (0 0 1 reflection, 33.28° 2θ) and LiC12 (0 0 2 reflection, 34.66° 2θ) at 100% - 70% SoC. As the intensity of LiC6 decreases, the intensity of LiC12 increases until only a single reflection is observed (70% - 40% SoC). At about 40% SoC, the LiC12 reflection broadens and a continuous peak shift to higher 2θ values is observed. At 0% SoC (3.0 V cut off voltage) we attribute the reflection to graphite at 36.28° in 2θ. The corresponding c-axis (d = 6.729 Å) is in agreement with Dolotko et al. (d = 6.722 Å)56 but higher than what is observed by Trucano et al. (d = 6.711 Å),57 which indicates some residual lithitation in our measurement.
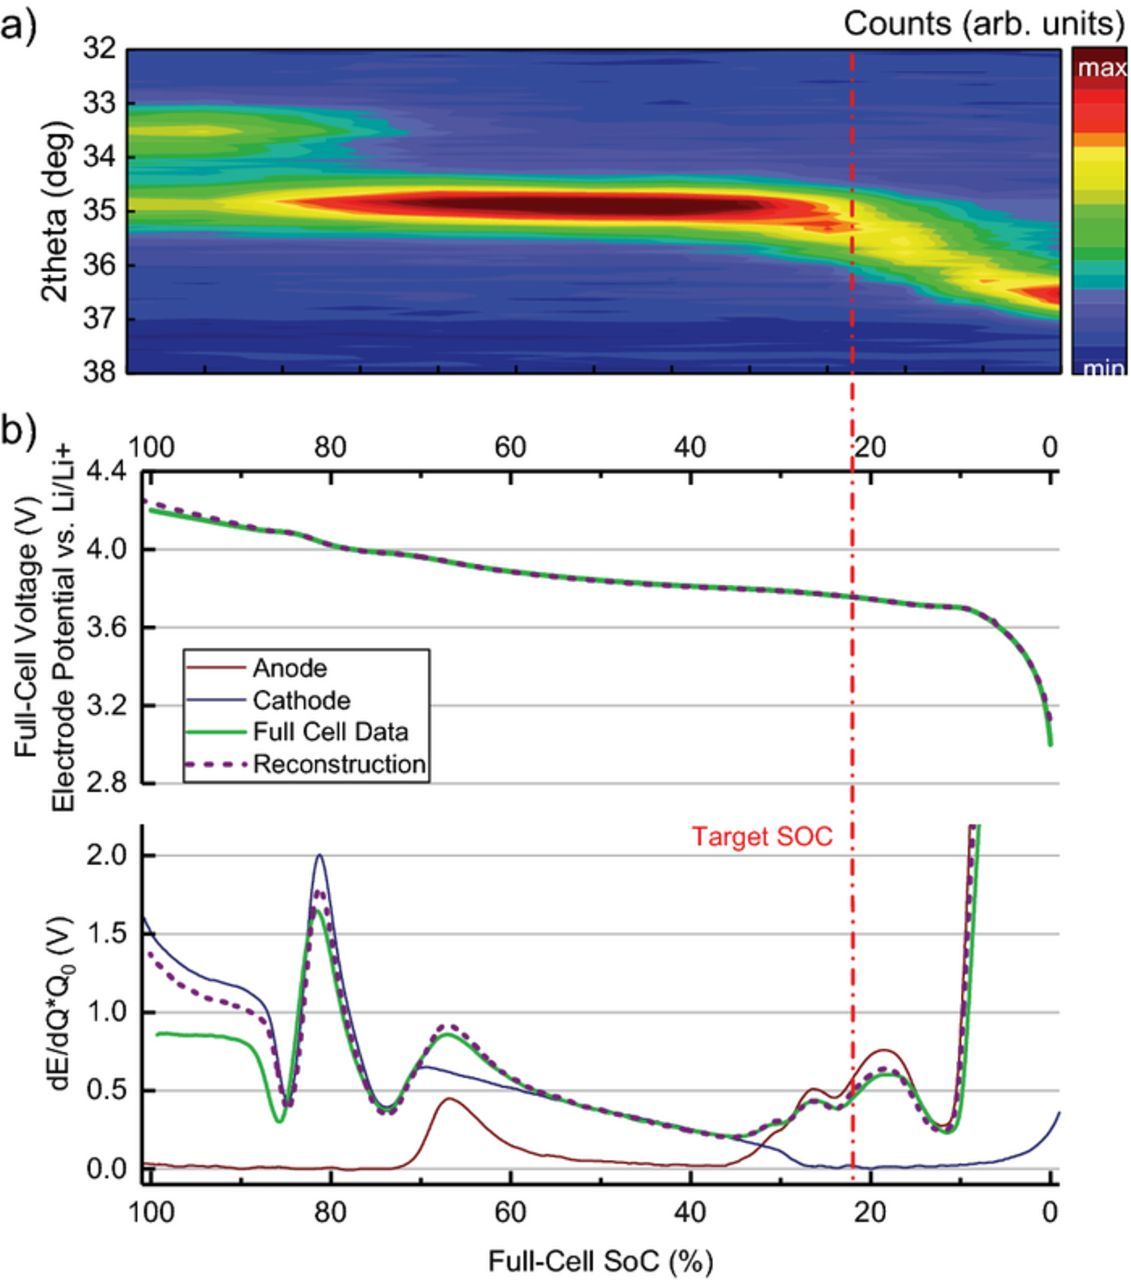
Figure 2. (a) Diffraction pattern of graphite reflection during discharging from 100% to 0% SoC at 0.8C. (b) LiCoO2 and Graphite half-cell profiles from extracted electrodes along with the dE/dQ profile. The target SoC is marked as a dashed line in red.
Figure 2 shows the full cell open circuit voltage (OCV) (C/100) and OCV reconstruction as well as differential voltage profiles of anode and cathode half-cell data (graphite vs. Li/ Li+, LiCoO2 vs. Li/Li+). Good agreement between half-cell reconstruction and full cell OCV was achieved through scaling and shifting of the individual contributions of anode and cathode half-cell data. In agreement with the diffraction data, E(x) reconstruction shows the graphite voltage plateaus during phase transition regimes at 100–70% SoC (80 mV) and 60–40% (110 mV) full cell SoC. The dE/dQ data shows changes in slope and additional maxima at 25% SoC (155 mV) and 20% SoC (200 mV) where the ND data shows a shift to lower 2θ angle values toward graphite.
If a temperature or rate induced inhomogeneity in the electrode matrix or graphite particles is present during discharge, a fraction of the active material will deviate from the average state of lithiation of the electrode. With the target SoC set at 22% SoC, the diffraction measurement is sensitive to phase coexistence as more delithiated states are shifted toward higher °2θ values. Graphite phases not yet affected by the discharge remain at 34.66° 2θ (LiC12). In contrast, inhomogeneity at 70–40% full cell SoC cannot be tracked as graphite does not show a change in intensity and angular position. A drawback of this approach is, that while the intensity and the existence of additional phases can be tracked, the degree of lithiation of each phase at low degree of lithiation cannot be directly determined as it is done for the LiC6/LiC12 fraction, since the description for intermediate states between LiC12 and graphite is subject of debate.
Structural analysis limitations
According to the stage formation model, the transition from LiC12 to graphite is described by a periodic array of unoccupied layer gaps at low concentrations of intercalated lithium-ions.16,17,58 While the staging model is well accepted for LiC6 (Stage I) and LiC12 (Stage II), varying accounts of higher order stages (s>II) are given. Some recent diffraction experiments find a continuous change in d-spacing at lower lithiated states (x<0.33).35,59 Senyshyn et al. observe a quasi-solid-solution structural behavior with seven higher order phases (IIL, IV, V, VIII, XIV, XXVIIIp, XXVIIIpp) during discharge and propose an alternative transition mechanism, which they call twisted bilayer formation.35
Since only medium resolution diffraction data of a limited angular range were collected, we cannot comment on the details of the phase transition during graphite deintercalation at lower lithiation states. We aim at providing a qualitative picture of the temperature and rate dependent phase inhomogeneity during discharge and the timescale until homogeneity is achieved. In accordance with Dolotko et al.35 and our previous investigations of charging4,38 and discharging41 processes, we refer to lower lithitated phases as Li1-xC18 and Li1-xC54 to indicate a certain level of lithiation but without discussing structural features.
Results
The performance of the battery is highly temperature dependent. This section discusses the impact of low temperatures on the capacity and impedance followed by the analysis of anode inhomogeneity during discharge and relaxation.
Low temperature performance
At room temperature and CCCV discharge with 1C (I<0.1C), the battery capacity is 540 mAh. The battery maintains its capacity at high rates with 530 mAh at 5C (see supplementary Figure S1). With lowering temperature down to −5°C the available capacity decreases only slightly, but an increasingly larger share of capacity is discharged through the CV phase. At −15°C more capacity is discharged in the CV phase (273 mAh) than in the CC phase (233 mAh).
The decrease in capacity at low temperatures is accompanied by an increase in cell impedance. Figure 3 shows the real part of the cell impedance for 0.01 Hz to 10 kHz. The corresponding Nyquist plots are given in Figure S2 in the supplement. From 40°C to −10°C, the impedance increases moderately for high frequencies and more strongly at mid to low frequencies. The EIS mid to low frequency arcs are commonly attributed to the Li+ diffusion across the SEI and charge transfer process at the electrode/electrolyte interface. The full cell EIS contains anode and cathode contributions. We attribute the full cell impedance at low temperatures predominantly to the anode, based on LiCoO2/graphite three-electrode experiments that observed higher activation energy and higher charge transfer resistance for the anode below 25°C.60 The extended constant voltage phase and increase in charge transfer resistance show a limitation of charge transfer kinetics at the graphite surface in addition to the observation of multiple coexistent graphite phases at low temperatures.
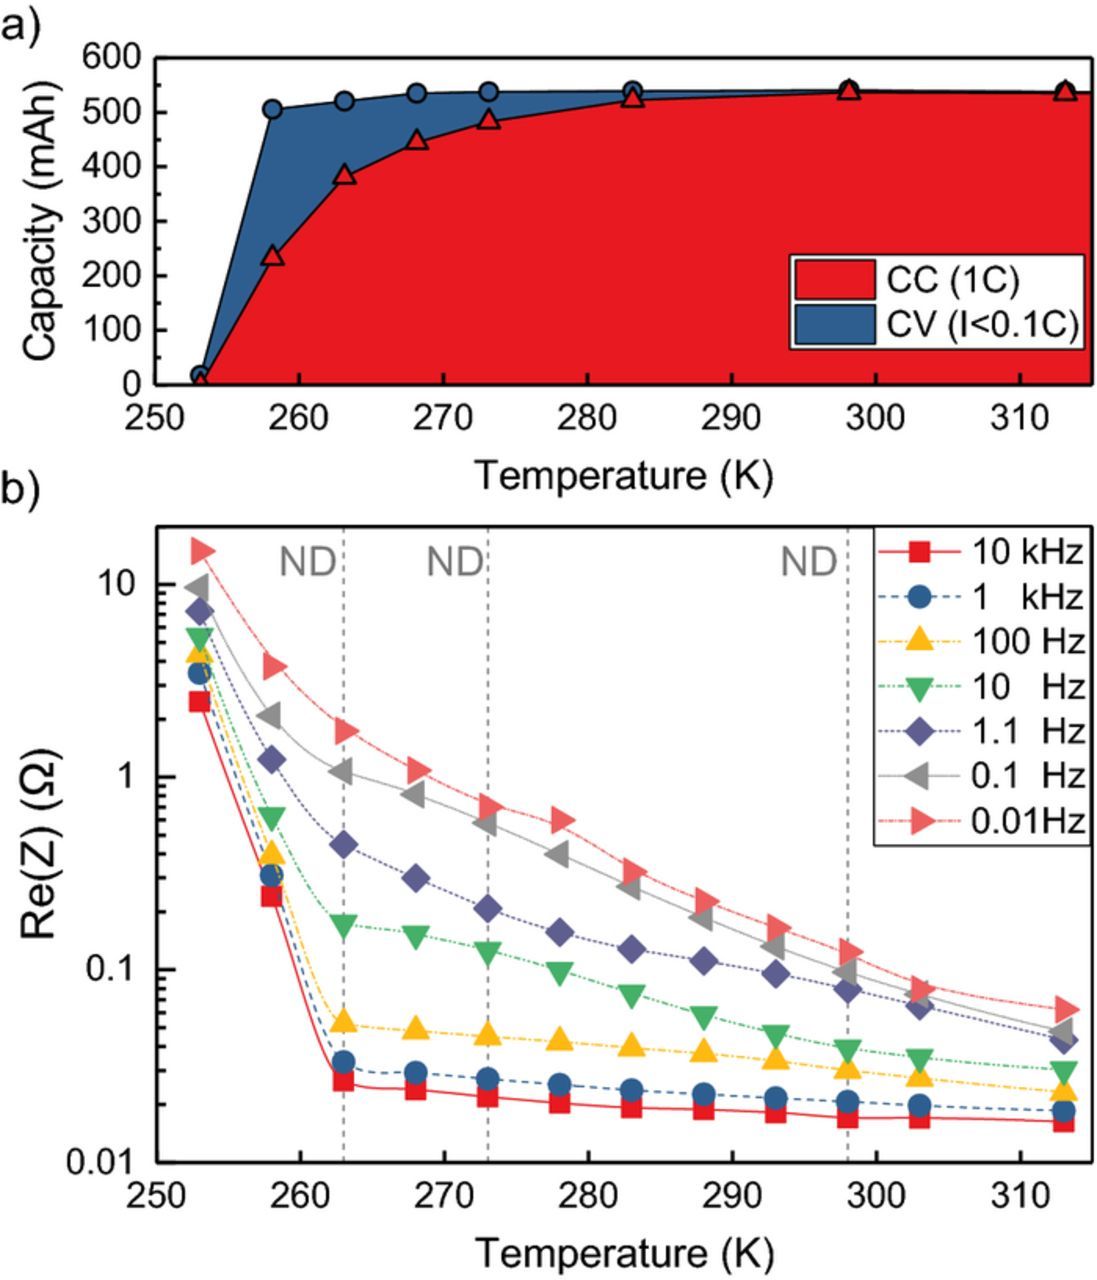
Figure 3. Battery capacity with CCCV (1C, I<0.1C, 3.0V) discharge at various temperatures (a). Charging was performed with CCCV (1C, I<0.1C, 4.2V) charging at 25°C. Real part of cell impedance measured at 22% SoC for various frequencies (b). The dashed lines mark the battery temperature states during the diffraction experiment.
Rather abruptly, at −20°C, very little capacity can be discharged in the CV phase and cell impedance overall increases sharply. We attribute this to electrolyte freezing. EC/DMC/LiPF6 electrolyte has a well-known, poor low temperature performance due to the high melting points of EC (36°C) and DMC (0.5°C).31 Smart et al. observe a similar sharp drop to 15% remaining dischargeable capacity at −20°C for LP30 (1.0M LiPF6 in EC:DMC (3:7)).61 Senyshyn et al. see reflections emerging below −15°C in a diffraction measurement of LP30 indicating an additional long range ordered phase not present at higher temperatures.62 We conclude that electrolyte freezing did not occur during our diffraction experiment, since no electrolyte features were observed in the ND data and the cell temperature (−10°C) was kept above the threshold of sharp overall impedance increase at −15°C (Figure 3b).
Potential and temperature profiles of discharge and relaxation
To study the impact of cell temperature on graphite phase inhomogeneity during discharge and relaxation, a fully charged cell was discharged (ΔQ = 420 mAh) to the target SoC at a moderate C-rate of 0.9C and varying temperature; 25°C, 0°C and −10°C. At 0°C cell temperature additional discharges at higher rate of 1.8C, 3.5C and 5.3C were performed.
The cell voltage during discharge and relaxation at varying temperature is presented in Figure 4a. The average voltage during the partial discharge is 3.84 V at 25°C but drops considerably by ∼ 200 mV (0°C) and ∼ 400 mV (−10°C) at lower temperature. Consequently, the cell voltage at the end of discharge differs for 25°C (3.65 V), 0°C (3.36 V) and −10°C (3.01 V). The discharge ends and relaxation begins at 0.88 hours. Relaxation was monitored for ∼ 2 hours at 25°C and 6 hours at −10°C where the highest degree of inhomogeneity was expected. The voltage relaxation is slower at lower temperatures. Voltage differences of 50–100 mV remain between −10°C and 25°C for ∼ 1 hour during the rest period.
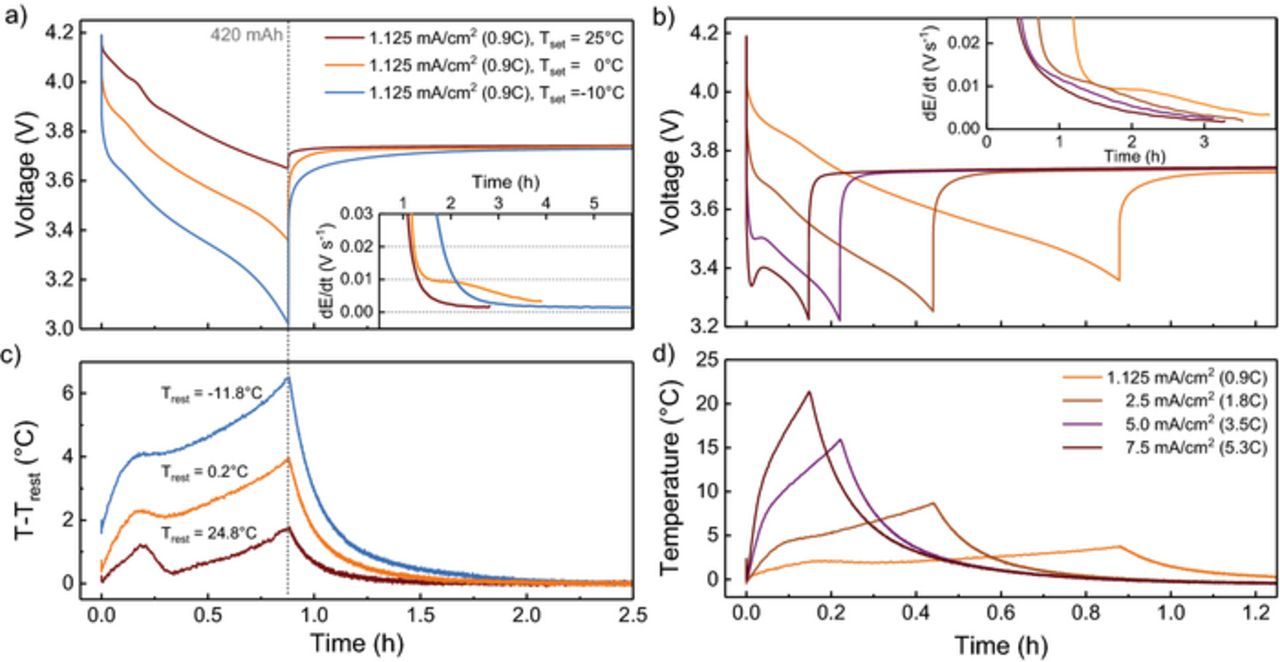
Figure 4. (a) Cell voltage during discharge (0.9C, 1.25 mA/cm2, ΔQ = 420 mAh) and relaxation at 25°C, 0°C and −10°C. (b) Cell voltage during discharge and relaxation at 0°C for various discharge rates (0.9C, 1.8C, 3.5C, 5.3C; ΔQ = 420 mAh). The inlets show the derivative dE/dt during relaxation. The gray dotted line marks the end of discharge. The temperature change during discharge and relaxation with respect to the final resting temperature (Trest) is shown in (c) and (d).
The cell voltage during discharge and relaxation at higher rates is presented in Figure 4b. With a higher rate, the polarization increases and the average discharge voltage decreases to 3.55 V (1.8C), 3.41 V (3.5C) and 3.36 V (5.3C). A minimum and a subsequent maximum in the cell voltage is observed for the rates 3.5C and 5.3C shortly after the beginning of discharge. This is due to an improvement of transport properties and a resulting reduction in overpotentials as the battery heats up. The cell voltage at the end of discharge is 3.25 V for 1.8C and 3.22 V for 3.5C and 5.3C, higher than for 0.9C at −10°C. With the last recorded voltage 3.737 V at 0°C taken as reference, voltage relaxation is quickest at 5.3C (0.51 h) but only slightly slower at 3.5C (0.66 h) and 1.8C (0.72 h). In all cases, relaxation is faster than for the reference slow discharge (1.40 h).
The cell temperature change is presented in Figures 4c and 4d. During discharge, the sample heats up, reaches maximum temperature at the end of discharge and cools down during the relaxation period. With respect to the final resting temperature, the cell temperature increases by 1.8°C (Trest = 25°C), 3.8°C (Trest = −0.2°C) and 6.5°C (Trest = −11.8°C) for the varying temperature discharges (Figure 4c) and by 9°C (1.8C), 16°C (3.5C) and 21°C (5.3C) for the higher rate discharge. The cell heats up strongly at higher rates due to the absence of forced convection cooling inside the cryostat chamber. During relaxation, the cell cools down and T-Trest decreases below 0.5°C within 0.6 h (−10°C), 0.4 h (0°C) and 0.17 h (25°C). Despite the significant temperature increase at higher rates, the time needed to cool down below 0.5°C is similar for all cells; 0.52 h (1.8C), 0.63 h (3.5C), and 0.71 h (5.3C).
During relaxation at 0°C, the voltage shows a qualitatively different behavior compared to 25°C with a dE/dt plateau at 1.2 to 2 hours after discharge (Figure 4a inlet). The periods of constant voltage increase can be explained through graphite multi-phase formation. Due to transport limitations, a fraction of the graphite remains at LiC12 while some of the graphite is delithiated to lower lithiated stages LiC18 and Li1-xC54. As the anode potential vs. Li/Li+ is constant at 150 mV at stage II/IIL, it increases strongly at lower lithiated phases (Figure 2b). During relaxation, the cell establishes thermodynamic equilibrium and the anode relaxes into single or two Li1-xCy phases close to the mean lithium content of the discharge target SoC. The lithiation of overshooting (Bauer et al.)63 graphite phases causing a voltage drop in the half cell potential is visible as maximum or plateau in the full cell dE/dt plot. Our observations are consistent with Bauer et al. who find such behavior at low (0 < SoC < 0.25) and medium SoC (0.3 < SoC < 0.6) in the voltage and dilation relaxation after charging. They find that intercalation of plated lithium and temperature gradients can cause a similar and overlapping effects on the battery voltage during relaxation. We can exclude lithium plating as cause for the voltage relaxation features in our experiment, since we measure relaxation after discharge and the samples were charged at a moderate rate at 25°C where no plating is expected for a high power battery.38 We can also exclude that the voltage response is caused by the temperature change of the battery, considering that the shoulder in the dE/dt plateau is observed for up to 2.5 hours at 0°C and the temperature gradients for only 0.4 hours (T-Trest < 0.5°C). In agreement with Bauer et al., the effect is not observed at higher temperatures (25°C). In contrast to Bauer et al., the multi-phase voltage feature diminishes with higher rate (1.8C, 3.5C) and is not present at 5.3C. This can be explained by the up to 20°C temperature increase at higher rates compensating a potential increase in polarization due to higher currents.
Neutron diffraction data of low temperature discharge and relaxation
The in situ neutron diffraction data of the Li1-xC6 reflections during discharge and relaxation at 25°C (a, d) 0°C (b, e) and −10°C (c, f) are shown in Figure 5. For comparison, selected moments in time are marked in the contour plot and the reflection intensity is shown in the subplots a, b, c. The time evolution of the integral intensity (a) and d-spacing (b) of the graphite phases present during relaxation is presented in Figure 6. While all three measurements show at the beginning of discharge equal LiC6/LiC12 balance and a subsequent decrease in LiC6 intensity with a corresponding intensity increase of LiC12, pronounced differences arise at the later stages of discharge and relaxation that support the multi-phase interpretation of the voltage relaxation feature.
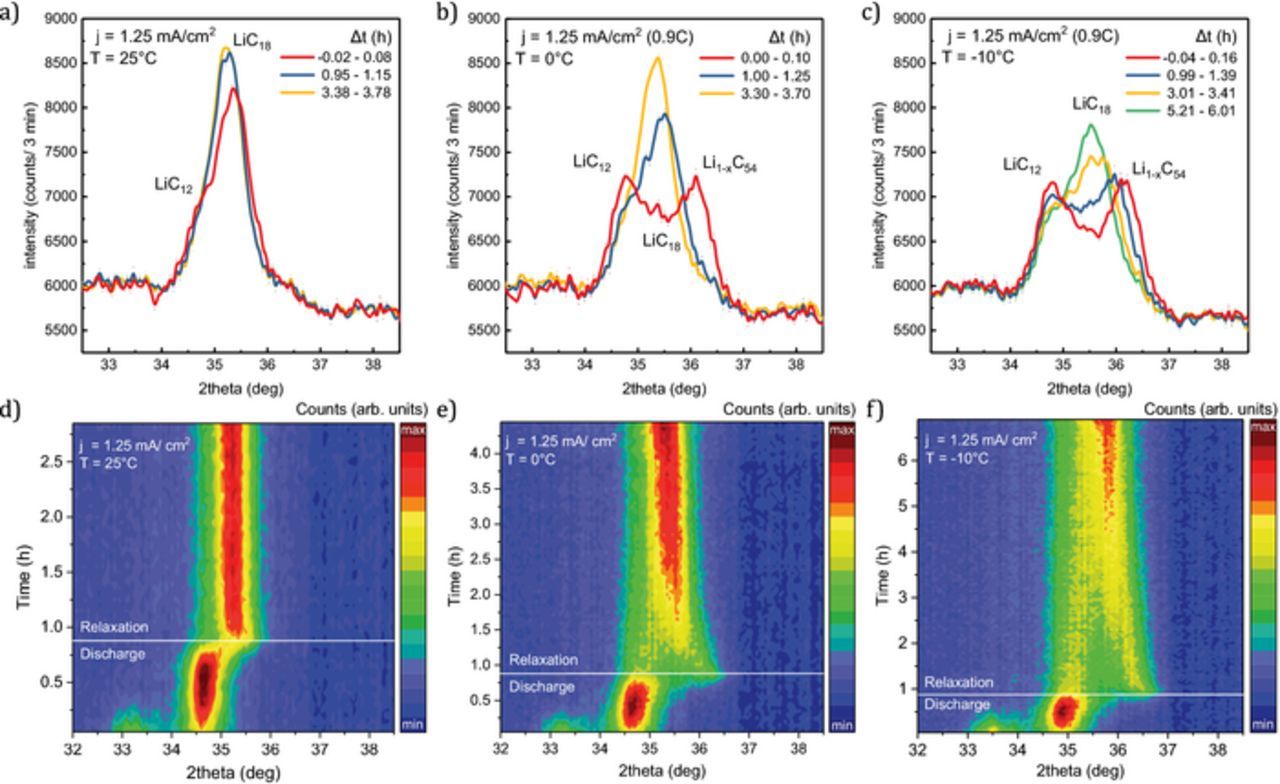
Figure 5. Diffraction data collected during discharge (0.9C, ΔQ = 420 mAh) and subsequent relaxation at temperatures 25°C (a, d), 0°C (b, e) and −10°C (c, f). The top row (a-c) shows the Li1-xC6 reflections at the end of discharge ( ∼ 0 h, red) and later during discharge ( ∼ 1 h: blue, ∼ 3 h: yellow, ∼ 6 h: green). The bottom row (d-f) shows the corresponding surface plot of all patterns. Each pattern is collected over 3 minutes. (high intensity: red, low intensity: blue).
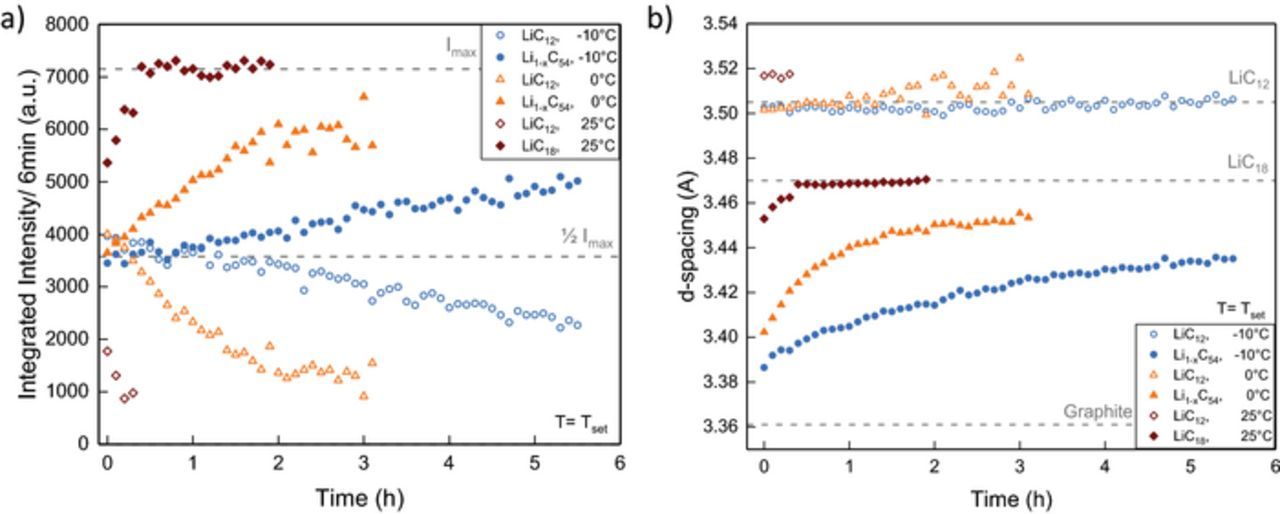
Figure 6. Integral reflection intensities (a) and corresponding d-spacing (b) of LiC12 and lower lithiated phases Li1-xC6 during relaxation after discharge at 25°C, 0°C and −10°C. Intensity and d-spacing reference values are marked with a gray dashed line as a guide for the eye.
At 25°C, a slightly broadened reflection with some remaining LiC12 (34.9°) and a second, lower lithiated phase (35.5°) shifted to higher angle is observed at the end of discharge. The integral intensity of the LiC12 is about 1400 a.u. at the end of discharge and decreases quickly during relaxation while the intensity of the second phase increases. The d-spacing of the lower lithiated phase increases continuously from 3.455 Å to 3.471 Å while the LiC12 reflection intensity reduces. In agreement with previous work4,41 we identify this phase as Li1-xC18. After 30 minutes, little change is seen in the ND data (Figures 5a, 5d) and the profile can be fitted well with only a single Li1-xC18 phase.
In comparison to 25°C, the anode shows greater polarization after discharge at 0°C (Figures 5b, 5e; Figures 6a, 5b). Two distinct phases, LiC12 (34.9°) and a lower lithiated phase (36.2°) are observed with about equal integral intensity ( ∼ 3800 a.u). With a d-spacing of 3.402 Å, this phase is identified as Li1-xC54 in agreement with previous work.4,41 Similar to what is observed at 25°C, the reflection intensity and thus the amount of LiC12 decreases during relaxation while the Li1-xC54 phase is lithiated for both experiments at 0°C and −10°C. Consequently, the reflection intensity increases and the graphite phase is shifted to higher d-spacing values. Compared to 25°C, this process is much slower at 0°C. One hour after the end of discharge LiC12 still maintains 30% of the combined reflection intensity. After 1.8 hours the intensity change and Li1-xC54 reflection shift slows down markedly. The anode maintains a degree of polarization until the end of measurement at 3.7 hours. The lower lithiated phase, initially identified as Li1-xC54, reverts back to Li1-xC18 (d = 3.453 Å) toward the end of the measurement. The slightly lower d-spacing, compared to the final state of LiC12 at 25°C (d = 3.471 Å), is explained by some lithium remaining in the LiC12 state.
At −10°C the diffraction data show an even greater polarization and a slower relaxation process than for 25°C and 0°C. Similar to the situation at 0°C, we observe two phases with about equal integral intensity, LiC12 (4000 a.u.) and Li1-xC54 (3450 a.u.) at the end of discharge at −10°C. Li1-xC54 is shifted to d = 3.387 Å, which indicates a slightly lower degree of lithiation compared to corresponding graphite intercalation phase (d = 3.402 Å) at 0°C. Over several hours, phase separation is clearly visible during relaxation (Figure 5). After 5.8 h relaxation, LiC12 (d = 3.510 Å) remains with 28% of the combined integral intensity. The final d-spacing of the Li1-xC54 reflection (d = 3.435 Å) is lower than observed at 0°C (d = 3.453 Å) which can be attributed to the temperature effect. The broadening of the anode reflection due to multiple phases present causes a lower observed maximum intensity for the last measured reflection data at −10°C (7750 counts/3 min), 0°C (8450 counts/ 3 min) and 25°C (8650 counts/3 min).
Notably, the d-spacing of LiC12 differs at the beginning of the relaxation process between measurements at 25°C (3.517 Å) and at lower temperatures, 0°C and −10°C (3.502 Å) (Figure 6b). The difference of 0.015 Å can be partially explained by thermal contraction. With a thermal expansion coefficient of αc = 6.5 × 10− 5 Å K− 1 for lithiated graphite,64 we find that the temperature change from 25°C to −10°C corresponds to a shift of −0.008 Å (3.517 Å → 3.509 Å). The remaining difference of 0.007 Å is within the combined d-spacing uncertainty of 0.004 Å for both phases.
In summary, the multiphase interpretation of the voltage relaxation feature is in good agreement with the phase coexistence observed in the anode during discharge and relaxation. At 25°C neither voltage nor diffraction measurements show lasting phase coexistence. At 0°C the intensity change slows and Li1-xC54 reflection shift decreases for up to 1.8 hours after end of discharge (2.6 hours after start of discharge), which is the same time that the end of the dE/dt plateau is observed.
Interpretation of graphite phase coexistence
The observed graphite phase evolution and voltage relaxation can be explained well with phase separation due to transport limitations at low temperatures. This section discusses whether we can localize the phase separation and differentiate between transport limitations on cell, layer, or particle level based on the sample and electrode design. Figure 7 shows potential contributions to graphite inhomogeneity observed in neutron diffraction experiments.
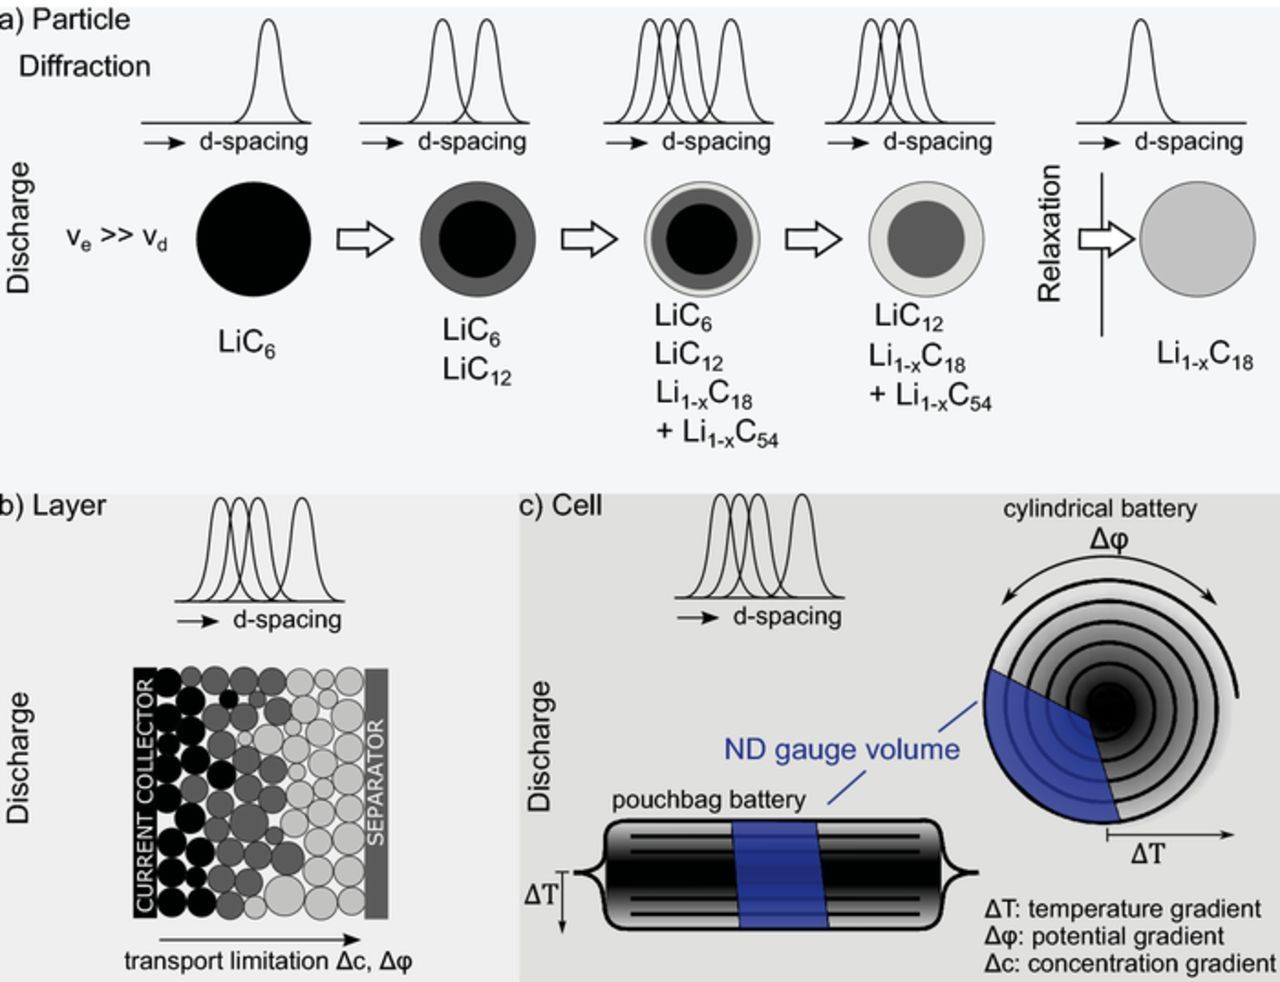
Figure 7. Possible causes for graphite inhomogeneity observed in neutron diffraction experiments at particle, layer, and cell level. a) Particle: Model of lithium distribution in a simple spherical particle and expected diffraction patterns if the rate of lithium extraction (ve) is higher than the diffusion within the particle (vd). Partially reprinted from Zinth et al.41 with permission from Elsevier. See Zinth et al. for ve << vd. b) Layer: Different degrees of lithiation between particles due to particle properties (size distribution) and transport limitations. c) Cell: Macroscopic SoC inhomogeneity in the cell due to temperature gradients (core – surface) or potential gradients (current collector).
Potential gradients
With the neutrons fully penetrating the cell, data were commonly collected from large scattering gauge volume (Figure 7). Simulations and experiments show that potential gradients due to the ohmic resistance of the current collector can cause local SoC inhomogeneity.49,65 This is pronounced for high-energy cylindrical cells with a single or few tabs and current collectors of ∼ 1 meter length (18650).43,49 Thus, the gauge volume of an in situ ND measurement of a cylindrical cell typically comprises electrode layers with varying distance to the tab. If a potential gradient induced local SoC difference is present, multiple simultaneously-present graphite states will be observed. Similarly, temperature gradients within a cell with a typically convection cooled surface and hotter core can cause local SoC differences due to lower overpotentials and improved kinetic transport processes at higher temperatures.8,12 Both effects are present in cylindrical and pouch bag batteries, but the contribution to the neutron diffraction pattern is significantly smaller for the chosen small format pouch cell. In our previous relaxation experiment with a cylindrical cell, the gauge volume averaged over 15 layers corresponding to ∼ 50 cm tab distance (single tab).4 For the sample cell, we average over 20 layers but the variation in tab distance is < 2 cm. Despite the 1/25 reduction in tab distance we still observe pronounced graphite phase coexistence at low temperatures as reported by Zinth et al.4 This supports the assertion that the measured lithiation gradients are not caused by local SoC gradients due to current collector induced potential drops.
Temperature homogeneity
Good thermal homogeneity is given in all test scenarios. The maximum distance between center to surface is 0.27 cm for the sample cell compared to 0.9 cm for an 18650 cell configuration. Assuming identical electrode properties and thus similar heat transfer properties orthogonal to the electrode layers, the heat transfer resistance from surface to center is about three times lower for the pouch cell reducing the temperature gradient in high rate test scenarios. The surface-center temperature gradient can be approximated with the Biot number B.66

With a total thickness tBatt of 5.4 mm and assuming a convective heat transfer coefficient h = 5 Wm−2K−1 (no ventilation in cryostat) at the cell surface and a thermal conductivity k⊥ = 1 Wm−1K−1 and k|| = 33.9 Wm−1K−1,67 we assess B⊥ < 0.02 in orthogonal direction and B|| < 0.003 in the in-plane direction. It follows that the temperature at the core of the battery, and thus in the observed volume in the center, deviates by less than 2% from the measured surface temperature.68 The temperature deviation is thus less than 0.5°C in the test scenario with the strongest heating (I = 7.5 mA/cm2, ΔT = 21°C). We conclude that for all test scenarios the temperature variations in the gauge volume are too small to cause the observed graphite phase differences, given the small influence of less than 1°C temperature change on electrolyte conductivity and diffusion coefficient.8
Anode properties
The graphite phase coexistence can be explained well with particle and electrode transport limitations (Figure 7), which can be shown by analyzing the electrode properties. Figure 8 shows top view (a) and cross view (b) SEM images of the anode. The particle size (c) and shape (d) is determined by matching 110 particles with an elliptical shape. The visual impression of spherical particles is confirmed by the ratio of long axis c and short axis a which is c/a < 1.2 for the majority of particles (d). Idealizing the particles as spherically shaped, the diameter distribution can be plotted and fitted well with normal distributions (c). The average diameter is d50 = 16.4 μm (d10 = 10.5 μm, d90 = 22.4 μm).
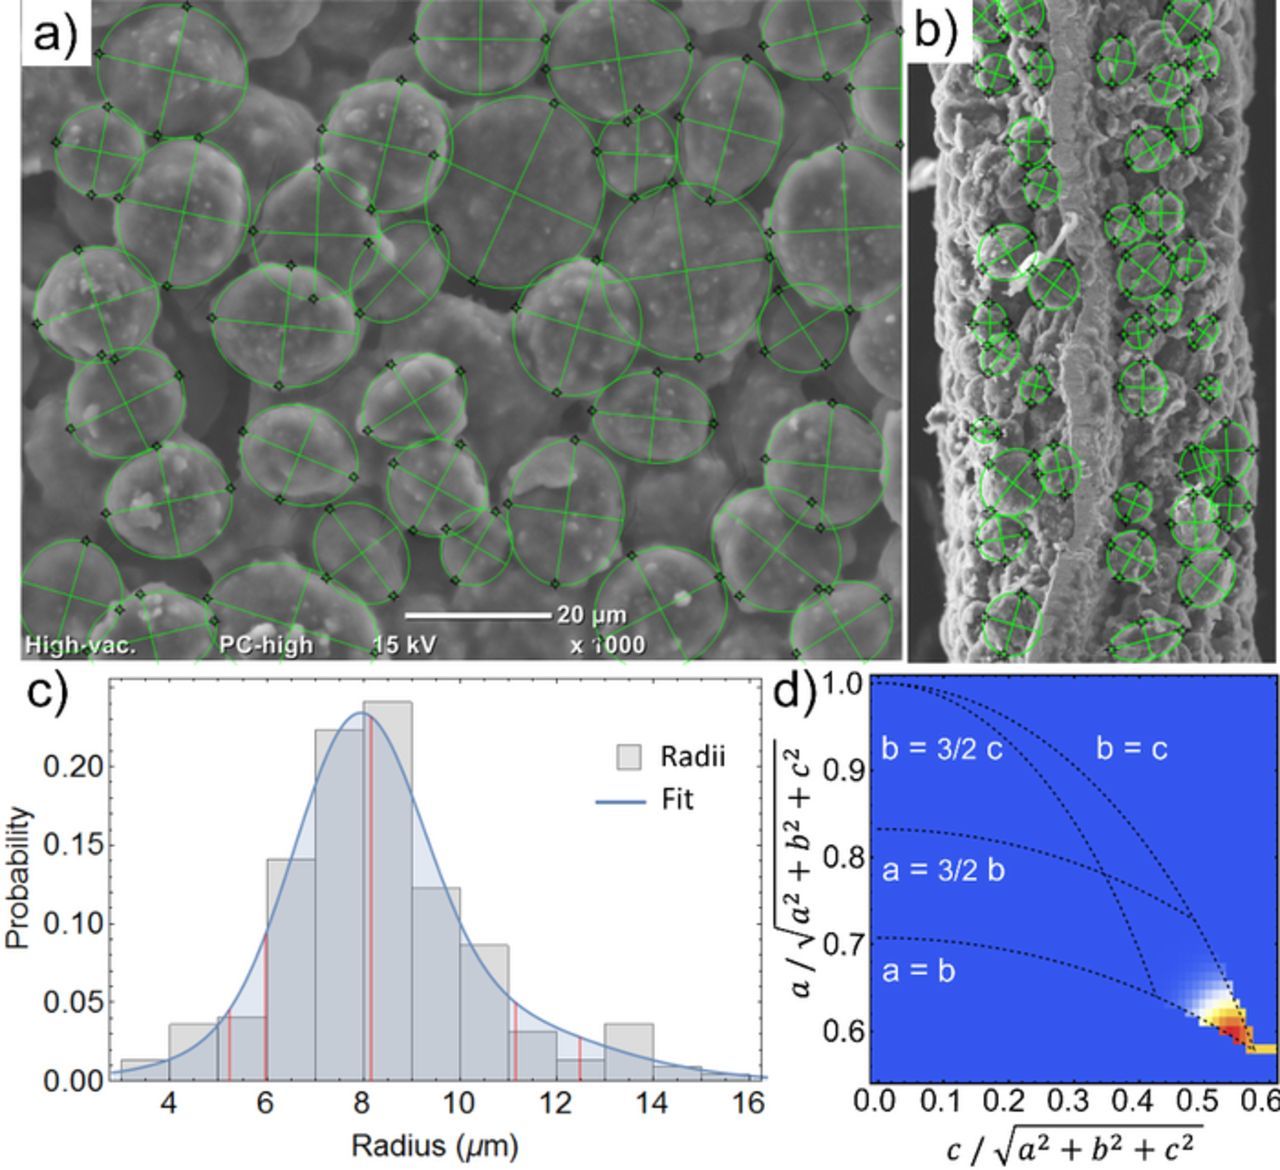
Figure 8. Top view (a) and cross view (b) SEM images of the anode. (c) Visually extracted graphite particle diameter distribution histogram and distribution fit. Red lines mark d95, d90, d50, d10 and d5 quantile values. Particle shape distribution showing the short axis a plotted against the long axis c (d). Red pixels in the color map mark the most common axis ratio.
Solid diffusion limitations
The observed phase coexistence can be explained by lithiation gradients within particles due to slow lithium diffusion. Figure 7 shows an idealized graphite particle upon delithiation with the speed of delithiation exceeding the transport within the particle. In a process described by Hess et al. as shrinking annuli model,69 the outer volume of the particle is delithiated causing layers with graphite at different stages of lithiation. Since the neutron wavelength is small enough to resolve these areas, each layer contributes to the diffraction pattern. At the end of discharge, a set of differently lithiated graphite layers remains, depending on the target SoC. During relaxation, lithium diffuses into less lithiated regions until thermodynamic equilibrium is achieved. In the example given in Figure 7, graphite LiC12, Li1-xC18 and Li1-xC54 equalize until only Li1-xC18 is present and the corresponding diffraction pattern, initially showing the corresponding three reflections, shows only the remaining LiC1-xC18 reflection. Whether the final state of relaxation is a single stage (e.g. LiC12) or a phase transition regime with two simultaneously present stages (e.g. LiC12 – Li1-xC18) depends on the average lithiation after discharge.
As shown in Figure 7, solid diffusion limitations of lithium in graphite can in principle describe the observed diffraction patterns. To test this assumption, we compare the observed relaxation time with what is expected from the solid diffusion process for the given particle size. The diffusion time τ for a given path can be approximated with τ = x2/(4 De) with De being the solid diffusion constant in Fick's law.12 Given the symmetrical shape of the particle, the radius of a large particle d90/2 = 11.2 μm is used as the diffusion length x. We estimate the diffusion coefficients De25 = 1.7 × 10− 10 cm2 s− 1 at room temperature and De0 = 2.8 × 10− 11cm2 s− 1 at 0°C. For −10°C at the end of measurement time we find De − 10 = 1.5 × 10− 11cm2s− 1 and De − 10E = 0.7 × 10− 11 cm2s− 1 for the extrapolated time of equilibrium. The results are summarized in Table II. For a proper assessment of these values, one has to consider that graphite is a complex material with a range of different morphological configurations19,20 and a varying degree of crystallinity, as well as temperature dependent,10,11 anisotropic,22,70 and stage dependent diffusion parameters.21,22
Table II. Estimated effective graphite solid diffusion constants.
| Relaxation | Effective diffusion | |
|---|---|---|
| Temperature (°C) | time (h) | constant (10−11 cm2 s−1) |
| 25 | 0.5 | 17 |
| 0 | 3.1 | 2.8 |
| −10 | 5.8* | 1.5 |
| −10 | 13.3** | 0.7 |
We find that graphite bulk diffusion is three to four orders of magnitude faster than the observed relaxation times and thus cannot explain the phase coexistence. Based on Persson et al. who measured an in-plane diffusivity of highly ordered pyrolytic graphite (HOPG) of 4.4 × 10− 6 cm2s− 1 in an experiment and 10− 7 − 10− 8 cm2s− 1 based on first principle simulations of stage I and II graphite,22 we calculate the relaxation time for a polarized HOPG particle of equivalent size (d90) to 0.07 s. Additionally, at 22% SoC in our experiment, the graphite is at a low degree of lithiation where the lithium ions are expected to have even increased mobility (liquid like stages defined as L) compared to stage I and II graphite (dense stages). Levi et al. and Umeda et al. found one order of magnitude higher diffusivity for liquid like stages compared to dense stages.71,72 With the shrinking annuli description as described in Figure 7, phase boundaries between segments with different degree of lithiation are present within a particle. Consequently, the solid diffusion coefficients calculated from the particle size and relaxation time are only effective values averaging over these layers. Additionally to the stage dependence of diffusion speed, limitations through diffusion at phase boundaries have to be taken into account. Persson et al. find much slower lithium ion transport along grain boundaries ( ∼ 10− 11 cm2s− 1), which is slightly lower than what we approximated at room temperature but higher than what is observed at −10°C. Overall, this is in better agreement with our data which suggests the limiting factor is the transport between crystallite boundaries rather than bulk transport. This is also consistent with earlier investigations of the graphite diffusion mechanism with galvanostatic intermittent titration technique (GITT),73 potentiostatic intermittent titration technique (PITT),74 and other electrochemical methods10 that find diffusion constants ∼ 10− 9 − 10− 11 cm2s− 1 for non-highly ordered graphite. The slowdown in relaxation with the temperature drop from 25°C to −10°C corresponds roughly to a reduction of the effective diffusion constant by one order of magnitude. This is in good agreement with Kulova et al.11 who reports a similar slowdown from 1.9 × 10− 10 cm2s− 1 (23°C) to 1.2 × 10− 11 cm2s− 1 ( − 15°C) and Zhang et al. who reports a drop from ∼ 10− 9 cm2s− 1 to ∼ 10− 10 cm2s− 1,10 The diffusion coefficient De − 10E estimated for −10°C is in agreement to the results of our previous work4 with a high energy cylindrical cell after charging.
Layer contribution
The gauge volume of 0.5 cm3 collects the signal of a large number of particles and thus covers the whole size distribution and particles at various positions in the electrode layer. The state of lithiation of a particle may deviate from the average lithiation of the electrode due to numerous causes such as particle size, transport limitations, and electrical isolation. Smaller particles have a surface to volume ratio more favorable for fast lithiation since the ratio decreases with 3/r for spherical particles. Some particles may be less connected in the layer due to resistance differences from less contact area in the conductive network.75 Lithium concentration gradients may arise in the layer due to electrolyte transport limitations,76,77 especially in highly tortuous electrodes,24 causing graphite lithiation gradients through the layer with, i.e. greater delithiation close to the separator during discharge (Figure 7). All these effects lead to multiple, simultaneously observed graphite phases in the diffraction pattern. Despite these additional effects, the observed timescale of lithiation processes and effective diffusion constants agree with a core-shell mechanism as outlined by Hess et al.69 and Seidlmayer et al., who observed gradual particle lithiation in small angle scattering experiments of anodes during discharge at a moderate rate.78
High-rate discharge and relaxation at low temperature
The neutron diffraction data of the graphite reflections (32° to 38° 2θ) during discharge and relaxation at 0°C under variation of discharge rate is shown in Figure 9. The fully charged cell is discharged at 1.8C (a,d), 3.5C (b,e) and 5.3C (c,f) while diffraction data were continuously recorded over 3 min intervals. The time evolution of the integral intensity (a) and d-spacing (b) during relaxation is shown in Figure 10. Despite a rate increase by a factor of two to six, the anode shows a lower degree of polarization and faster relaxation compared to 0.9C measurements at 0°C and −10°C.
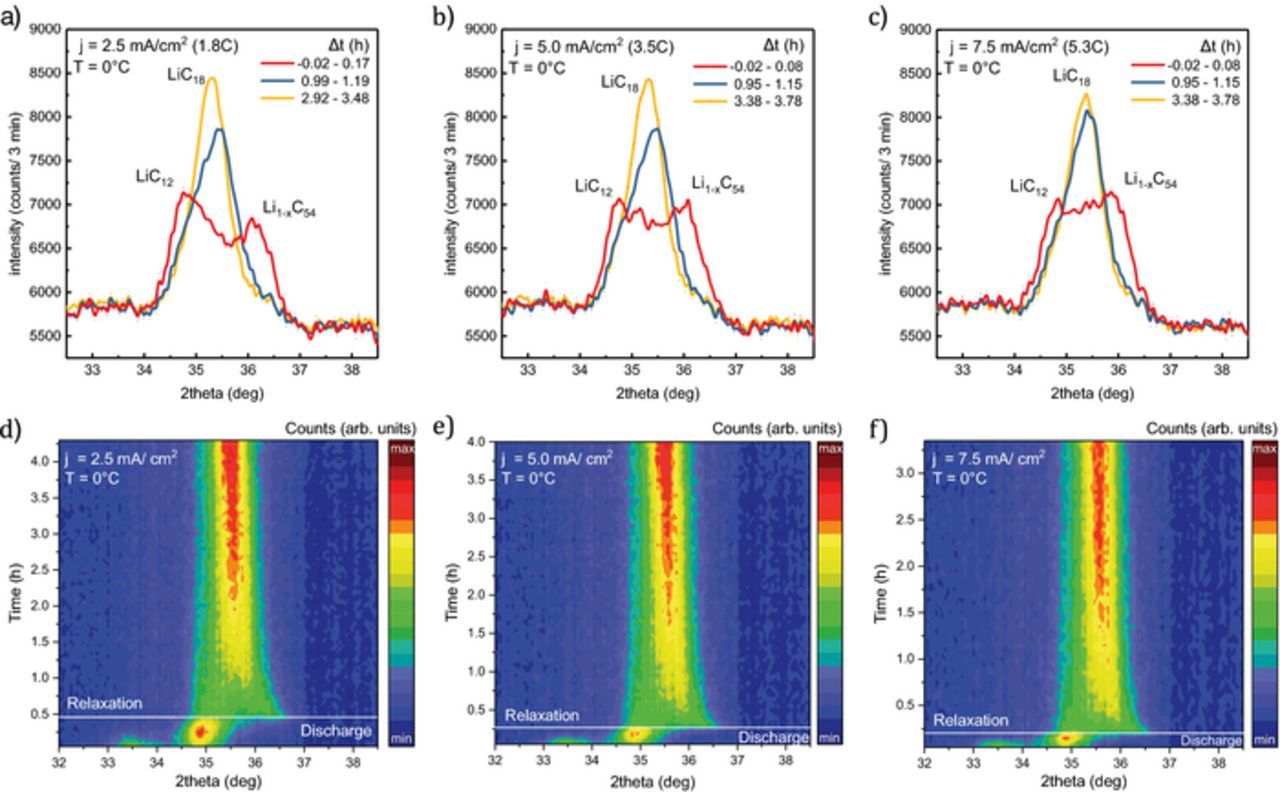
Figure 9. Diffraction data collected during discharge at 0°C (ΔQ = 420 mAh) and subsequent relaxation at discharge rates of 1.8C (a, d), 3.5C (b, e) and 5.3C (c, f). The top row shows the Li1-xC6 reflections at the end of discharge ( ∼ 0 h: red) and during relaxation ( ∼ 1h: blue; ∼ 3h: yellow). The bottom row shows the corresponding surface plot of all diffraction patterns. Each pattern is collected over 3 minutes. (high intensity: red, low intensity: blue).
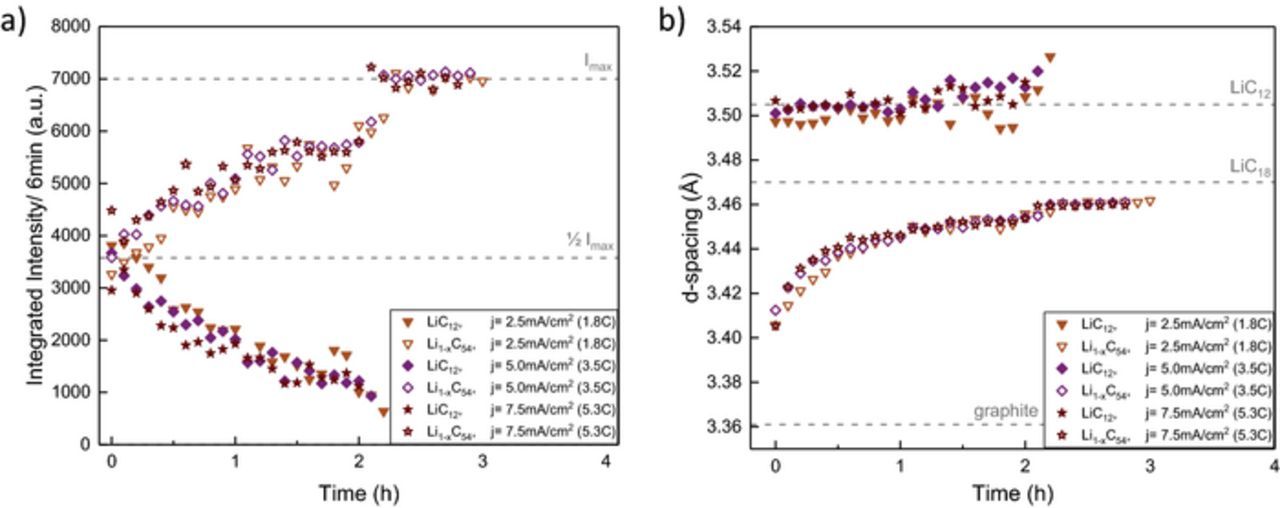
Figure 10. Integral reflection intensities a) and corresponding d-spacing b) of LiC12 and lower lithiated phases Li1-xC18 and Li1-xC54 during relaxation after discharge at 0°C and 1.8C, 3.5C and 5.3C. Intensity and d-spacing reference values are marked with a gray dashed line as a guide for the eye.
Polarization of the anode with some remaining LiC12 and at least one additional phase with lower degree of lithiation (Li1-xC54) is observed for all rates. At 1.8C, the phases are well separated with more LiC12 integral intensity (3800 a.u.) than Li1-xC54 (3200 a.u.). In comparison, the contribution of the lower lithiated phase has approximately equal share in intensity at 1.8C. Similar to the low rate discharge at 0°C the d-spacing of the Li1-xC54 phase shifts to 3.406 Å (at 1.8C), 3.412 Å (at 3.5C), and 3.406 Å (at 5.3C) respectively. At one hour after discharge, relaxation is well advanced for all higher rates. The remaining LiC12 contribution of appoximately 25% is seen in the asymmetry of the reflection in Figure 9 (blue). The Li1-xC54 phase after 5.3C discharge is lithiated slightly faster during relaxation than at lower rates, which causes an earlier shift to higher d-spacing values (Figure 10) and a less broadened reflection with a higher maximum intensity (8000 counts/3 min) compared to (7800 counts/3 min) at 1.8C and 0.9C.
In summary, the cell shows a similar degree of polarization and slightly faster relaxation process at higher rates compared to the slow discharge at 0°C. This can be explained by the increased heating of the cell at higher rates that causes a temperature increase of 9°C (1.8C) to 21°C (5.3C) compared to only 4°C at 0.9C. The self-heating of the cell reduces charge transfer resistances (Figure 3) and increases diffusion rates in solid and liquid phases8,11 and thus compensates the effect of higher rate. After one hour, when the cell has the same temperature for all discharge scenarios, intensity change and Li1-xC54 reflection shift continue at similar speed. In addition to the effect of cell heating, the lack of polarization increase at higher rates is consistent with the high power layout of the sample in contrast to our previous results with a high energy cylindrical cell where we observe a more pronounced inhomogeneity at higher rates.41 The anode layer thickness of 51 ± 2 μm corresponds to the sum of three average particle diameters. With the close to spherical particle shape the electrode has a low tortuosity of τz = 1.6 and a McMullin Number of NM = 4, as determined from SEM 2D reconstruction, finding a Bruggeman exponent of αz = 0.51. This is close to the often used Bruggeman approximation α = 0.5 for ideal spheres.79 While limitations of the 2D reconstruction compared to 3D tomography25 and other methods24 have to be considered, tortuosity and McMullin Numbers are low compared to flake graphite.24 We conclude that the neutron diffraction data do not show a contribution of additional layer inhomogeneity at higher rates since we do not observe a qualitative change in polarization or relaxation time. The low temperature and medium rate discharge scenario is most critical in terms of anode polarization since self-heating improves transport parameters and reduces polarization as well as relaxation time at higher rates.
It is less clear to which extent particles differ in lithiation due to differences in size and surface area. Phase inhomogeneity and equalization between particles if present, would be visible in the anode diffraction data in similar manner as solid diffusion limitations. Equalization between particles through lithium exchange with the electrolyte slows considerably at low temperatures due to lower lithium diffusivity in the electrolyte and higher charge transfer resistance at the electrolyte particle interface. With graphite particle radii ranging from 4 μm to 16 μm (Figure 8) in the sample cell, a contribution to the observed phase coexistence cannot be excluded.
Conclusions
A combination of neutron diffraction, electrochemical cycling, and impedance measurements was applied to study the performance of a high power LiCoO2/graphite pouch bag battery in the temperature range of −20°C to 40°C. The battery shows decreasing capacity and increasing charge transfer resistances as well as greater polarization during discharge with decreasing temperature.
In situ diffraction data of the anode during discharge and subsequent relaxation show an inhomogeneous lithiation of graphite with multiple coexistent phases. After discharge, the graphite phases equalize toward a single or two phases close to mean lithium content. We find that phase changes during relaxation are not only observed in diffraction but can also be seen directly in the full cell voltage response during relaxation. While barely polarized at room temperature, the graphite lithiation is strongly inhomogeneous after discharge at −10°C with relaxation processes lasting longer than 6 hours. A rate of less than 1C is sufficient to cause strong polarization at 0°C. Higher rates up to 5C do not increase polarization but rather decrease the relaxation time due to considerable self-heating of the battery. Our experiments show that in absence of active cooling the low rate low temperature use case is most prone for high anode polarization. Expanding on previous work with high energy cylindrical cells, we are able to exclude SoC inhomogeneity in the gauge volume due to internal temperature gradients as origin for the observed lithiation gradients, by sample choice of a small format pouch cell. Similarly, SoC gradients due to potential drops along the current collector were strongly reduced. The observed effects can best be explained with slow lithium diffusion in the solid phase. Through analysis of the relaxation times, an effective solid diffusion constant of 1.7 × 10− 10 cm2 s− 1 at room temperature and 0.7 × 10− 11 cm2s− 1 at −10°C could be derived. We attribute this to slow lithium transport limited by grain boundaries between different phase domains or crystallites within the particles rather than in-plane transport. We suggest further investigation of electrodes with narrow particle size distributions to clarify the extent of inhomogeneity between particles of different size and surface area as well as potential long term equalization effects.
In situ neutron diffraction during discharge and equilibration processes provides lower and upper limits on graphite phase inhomogeneity. This approach can be applied to investigate the effectiveness of novel methods of electrode optimization, such as electrode structuring, in a complete cell system.
Acknowledgment
This work was financially supported by the German Federal Ministry of Education and Research (BMBF) in the ExZellTUM project under grant number 03 × 4633A. We thank Irmgard Buchberger for insightful discussions along with Veronika Zinth and Weimin Gan for help with the experiment.
ORCID
Jörn Wilhelm 0000-0002-5649-2580