Abstract
Unitized regenerative fuel cells (URFCs) with Pt and Ir as catalysts can potentially provide required buffering capacity for the intermittent renewable energy. While a relatively good catalytic activity of Pt-Ir catalysts has been shown, data on dissolution stability is less convincing. In this work, two representative oxygen bifunctional catalysts for application in URFCs are synthesized by depositing Pt nanoparticles on hydrous Ir oxide (Pt/IrOx) and rutile Ir oxide (Pt/IrO2). A set of spectroscopy and microscopy techniques is used to characterize the synthesized materials. Regarding the catalytic activity, it is shown that Pt/IrO2 and Pt/IrOx are superior for oxygen reduction reaction (ORR) and oxygen evolution reaction (OER), respectively. Further, the catalysts' stability toward dissolution is evaluated using a scanning flow cell coupled to an inductively coupled plasma mass spectrometer (SFC-ICP-MS) setup. Dissolution data reveal that Pt is relatively stable in either ORR or OER potential ranges. On the other hand, dissolution of Ir in the OER protocol is considerable. In the ORR-OER potential range, dissolution of both elements enhances significantly. Especially critical is high dissolution of Pt, which limits lifetime of the catalysts. These results must be considered in the development of novel bifunctional catalyst to be used in URFC.
Export citation and abstract BibTeX RIS

This is an open access article distributed under the terms of the Creative Commons Attribution 4.0 License (CC BY, http://creativecommons.org/licenses/by/4.0/), which permits unrestricted reuse of the work in any medium, provided the original work is properly cited.
The problems caused by the widespread use of fossil fuels, together with the increasing world energy demand, have encouraged the research and use of renewable resources. However, the most promising alternative sources, such as the wind and solar power, still face the barrier of intermittence.1–3 Therefore, in order to utilize the full benefits of renewable energy, appropriate energy storage capacities must be provided. Hydrogen is currently pointed as a viable solution for energy storing, since its storage capacity is higher compared to batteries or capacitors.4 This fuel can be produced in water electrolyzers, in which water is split into hydrogen and oxygen through the supply of electric energy. Renewable hydrogen can be re-electrified using fuel cells in both stationary and mobile applications, forming water as the only chemical product.
Alternatively, the aforementioned processes can be achieved using the so-called unitized regenerative fuel cells (URFCs). URFCs are single unit electrochemical devices that operate, alternately, as a water electrolyzer and as a fuel cell. Between the suggested URFCs, those employing a proton exchange membrane (PEM) have the most developed status.5 The use of a single device for both operation modes has several advantages over the use of a system with separate electrolyzer and fuel cell, such as compactness, significantly lower capital cost, and a higher specific energy.5,6 In light of these advantages, URFCs for mobile, stationary and aerospace applications have been proposed.6 In this context, great effort on the development of URFCs components, such as new proton exchange membranes, gas diffusion layers, and bipolar plates, has been made.7 Nonetheless, considerable challenges in terms of efficiency, durability, and cost of these devices still need to be overcome,8 and for that, the development of active and stable bifunctional electrocatalysts for the URFC is of paramount importance.
In the hydrogen electrode of the URFC, the hydrogen evolution/oxidation reactions occur during the electrolyzer and fuel cell operation modes, respectively. Generally, these reactions take place with low overpotentials in acid media when Pt is used as the electrocatalyst,9 which means that Pt, even at very low catalyst loadings, can be safely employed as a bifunctional hydrogen catalyst in the URFCs. On the other hand, the oxygen evolution/reduction reactions involve much more complex mechanisms, resulting in a slower kinetics and occurring with higher values of overpotential in the oxygen electrode. For fuel cells, Pt-based materials are the state-of-the-art catalysts for the oxygen reduction reaction (ORR),10 while for electrolyzers operation, Ir oxide is the preferred catalyst for the oxygen evolution reaction (OER), due to the combination of its activity and stability in comparison to other materials, such as Ru-based catalysts.2,11–13 Therefore, for URFC applications, the use of oxygen catalysts obtained by the combination of Pt and IrO2 or IrOx (here and below, for simplicity's sake, IrO2 and IrOx denote crystalline rutile and hydrous amorphous Ir oxides, respectively), ideally benefiting from the relatively high activity of both materials, have been proposed.14
There are several ways on how such combination of catalysts can be formed. Bifunctional oxygen catalysts with good performance in the electrolyzer and fuel cell operation modes of URFCs were previously obtained by physical mixing of Pt and Ir oxide catalysts.15,16 In another approach, bifunctional oxygen catalysts were obtained by depositing Pt over Ir oxide, and for these, the OER and ORR activities depend on how catalyst was prepared and what was the nature of Ir oxide.17–21 Despite the previously reported promising results in terms of catalytic activity of different Ir/Pt-based bifunctional electrodes, their stability is still relatively little explored. Especially, effect of Ir catalyst structure, viz. IrOx vs. IrO2, which shows very different stability during the OER22,23 and issues with transient Pt dissolution,24 on the overall catalyst OER and ORR activity and stability during potential transients requires a thorough investigation. Such investigation is presented in the current work.
Particle coalescence, migration, agglomeration, and detachment are the mostly discussed mechanisms responsible for the degradation of electrocatalysts in PEM fuel cells (PEMFCs)25 and water electrolyzers.26,27 Regarding bifunctional catalysts, Da Silva et al. evaluated the stability of a Pt/IrO2 catalyst under cycling in the ORR, OER, and ORR-OER potential windows.28 A higher degradation rate was observed for the catalyst cycled in the combined ORR-OER potential window. Using the identical location transmission electron microscopy (IL-TEM) technique, the authors identified that the particles coalescence, growth, and detachment are the responsible mechanisms for the Pt/IrO2 instability. Kong et al. studied the stability of Pt supported on IrOx and Pt/IrO2 cycling between 0.05–1.2 V vs. RHE (reversible hydrogen electrode). Although the changes in the OER and ORR activities were not evaluated, the authors observed a higher reduction in the Pt electroactive surface area for the material supported in the amorphous Ir oxide29 than for the Pt/IrO2 catalyst.30 When cycling in the OER potential window, between 1.2–1.6 V vs. RHE, the same authors observed a reduction of 15% and 20% in the OER activity of the catalysts supported on IrOx (2,000 cycles) and IrO2 (5,000 cycles), respectively.29,30 These results suggest that the bifunctional catalysts' stability depends on both used catalyst support (IrOx/IrO2) and applied potential range.
Dissolution is another process that contributes to the loss of activity of electrocatalysts. Moreover, dissolution is a primary degradation process initiating secondary processes like Ostwald ripening. Although the dissolution rates are relatively low for noble-metals-based catalysts, they cannot be ignored during the long-term operations.24 Over recent years, using a scanning flow cell inductively coupled plasma mass spectrometry (SFC-ICP-MS) approach, our group has been active in investigating dissolution of both Pt and Ir, as summarized in recent reviews.24,31 Thus, we have shown that the dissolution of bulk Pt is a transient phenomenon, which takes place during both Pt oxidation and reduction.32 A similar behavior was observed in the dissolution study of Pt nanoparticles supported on carbon,33 as was also confirmed by other groups.34 Concerning the electrocatalysts used for the OER, it was shown that bulk IrO2 is more stable in terms of electrochemical dissolution compared to Ru, RuO2, and Ir.12 It was also shown that for both Ir and IrO2 dissolution is accelerated at higher anodic potentials, which can be explained in terms of common intermediates for the OER and electrochemical dissolution.35,36 Similar results were obtained using nanocrystalline catalysts.36,37 Based on these works, however, a solid conclusion cannot be drawn on the overall dissolution stability of Ir/Pt based bifunctional catalysts, when Ir and Pt are put together as synergistic stabilizing effects cannot be ruled out.
In this work, dissolution stability of the two most promising classes of the Ir/Pt bifunctional catalysts, viz. Pt/IrOx and Pt/IrO2 is critically evaluated. For this, two bifunctional oxygen catalysts are synthesized by depositing Pt nanoparticles on hydrous (Pt/IrOx) and rutile (Pt/IrO2) Ir oxides and their activities for the ORR and OER are tested using a three electrodes cell. The stability of the bifunctional materials in terms of electrochemical dissolution is evaluated under three protocols (ORR, OER, and ORR-OER potential windows) using the SFC-ICP-MS setup.
Experimental
Catalysts synthesis
The hydrous Ir oxide (IrOx) was prepared using a hydrothermal synthesis method.38 Initially, a solution containing 5 g of H2IrCl6.xH2O (99 wt%, Alfa Aesar) in 100 mL of ultrapure water (18.2 MΩ cm, Milli-Q) was prepared. Then, a 1 M LiOH solution (99 wt%, Sigma-Aldrich) was added to 10 mL of the Ir precursor solution, under stirring, at a rate of 0.2 mL h−1, until a final ratio of [OH−]/[Cl−] = 6 was achieved. In the next step, the obtained Ir blue suspension was transferred to a polytetrafluorethylene (PTFE) chamber in a stainless steel autoclave reactor, and heated at 180°C for 24 h. After the 24 h heating, the IrOx black precipitate was filtered, washed with boiling water, and dried at 50°C for 1 h.
The rutile Ir oxide (IrO2) was obtained after heat treating the IrOx catalyst at 400°C for 1 h, under air atmosphere.
The Pt/IrOx and Pt/IrO2 bifunctional catalysts with Pt:Ir atomic ratios of 1:1 were synthesized by depositing Pt nanoparticles on the Ir oxide supports using a formic acid method.39 In the first step, the oxide support was ultrasonically dispersed in 30 mL of a 2 M formic acid solution (98 wt%, Sigma-Aldrich) and heated to 80°C. After that, an aqueous 5g/100 mL H2PtCl6.xH2O (99 wt%, Alfa Aesar) solution was added dropwise, under stirring. Five minutes after adding the Pt precursor, the solution was allowed to cool down, the catalyst was filtered off, washed with boiling water, and dried at 50°C for 1 h.
Physicochemical characterization
Energy dispersive X-ray spectroscopy (EDS) was performed with a Leica-Zeiss LEO 440 scanning electron microscope (SEM) operating at 40 kV. Powder X-ray diffraction was conducted with a Bruker D8 Advance X-ray diffractometer (XRD) with 1.5406 Å Cu Kα radiation; data was collected over a 2θ range of 10–100°, at a scanning rate of 0.075° s−1. The Rietveld refinement method was used to obtain the structural parameters of the synthesized catalysts.40
Transmission electron microscopy (TEM) images were acquired with a JEOL JEM 2100 microscope, fitted with a LaB6 filament, operating at 200 kV accelerating voltage. Scanning transmission microscopy (STEM) and EDS mapping images were obtained with a field emission gun FEI Tecnai G² F20 microscope operated at 200 kV acceleration voltage. In both TEM and STEM analysis, the catalyst powders were dispersed in isopropanol and deposited on a Formvar carbon-coated copper grids (EMS, 400 mesh).
X-ray photoelectron spectroscopy (XPS) was carried out with a ScientaOmicron ESCA+ spectrometer equipped with a high-performance hemispheric analyzer (EA 125), and a monochromatic radiation of 1487 eV; the biding energies of all XPS spectra were calibrated according to the C 1s peak energy at 284.8 eV.
Electrochemical measurements
Electrochemical characteri-zation
Electrochemical experiments were performed in a conventional three-electrode PTFE cell, with an Ag/AgCl (3 M KCl) and a graphite rod as reference and counter electrodes, respectively. A catalyst ink was prepared by dispersing 3 mg of the catalyst and 15 μL of a Nafion solution (5 wt%, Alfa Aesar) to 2 mL of ultrapure water (18.2 MΩ cm, Milli-Q) using an ultrasonic horn. The ink was deposited on a glassy carbon disc substrate (A = 0.196 cm²) to a final loading of 0.38 mgmetal cm−2 (Pt+Ir). All measurements were conducted in 0.5 M H2SO4 electrolyte at 25°C. All potentials are referred to a reversible hydrogen electrode (RHE), which was obtained using a Pt foil as working electrode, and the H2 saturated electrolyte.
The initial characterization was carried out with cyclic voltammetry (CV) between 0.05–1.2 V at 50 mV s−1. Carbon monoxide stripping experiments were used to estimate the Pt electroactive surface area (AECSA) of the catalysts. Briefly, CO was purged in the electrolyte for 5 minutes while the working electrode potential was hold at 0.1 V. Then, the gas purging was switched to Ar for 25 minutes in order to remove any non-adsorbed CO. Subsequently, three voltammetry cycles between 0.1–1.0 V, at 5 mV s−1, were obtained. The AECSA values were calculated considering a charge of 420 μC cmPt−2 for the oxidation of a CO monolayer.
OER and ORR catalytic activity
The catalysts' activities for the OER and ORR were evaluated in a rotating disc electrode (RDE) setup using a Radiometer Analytical rotator. The ORR activities were studied in O2 saturated electrolyte at rotation speeds between 100–2500 rpm; linear sweep voltammograms (LSVs) in the potential range of 0.1–1.1 V were collected at 5 mV s−1. The OER activity measurements were performed with LSV between 1.1–1.6 V at 5 mV s−1. To avoid oxygen bubbles accumulation on the electrode surface, the working electrode was rotated at 1600 rpm. The ORR and OER activities of IrOx, IrO2, and a commercial Pt black (HP 6000, Engelhard) catalysts were tested for comparison purposes.
Catalysts' electrochemical dissolution stability
Electrochemical dissolution tests were performed in a scanning flow cell (SFC) hyphenated to a Perkin Elmer NexION 300X inductively coupled plasma mass spectrometer (SFC-ICP-MS), as described elsewhere.41 Briefly, for the dissolution measurements, a catalyst ink was prepared by dispersing 4 mg of the catalyst and 15 μL of a Nafion solution (5 wt%, Alfa Aesar) to 5 mL of ultrapure water (18.2 MΩ cm, Milli-Q) using an ultrasonic horn. Small catalysts spots (Ø = ∼0.8 mm) were obtained by drop casting 0.5 μL of the ink on a glassy carbon plate, resulting in a final catalyst loading of 0.08 mg cm−2. Three protocols were used to evaluate the catalysts' stability: i) three potential cycles between 0.6–1.1 V at 5 mV s−1, ii) three potential cycles between 1.1–1.6 V at 5 mV s−1, and iii) three potential cycles between 0.6–1.6 V at 5 mV s−1, which comprises the potential window for the ORR, OER, and ORR-OER, respectively. An Ar purged 0.1 M H2SO4 solution was used as electrolyte, and the flow rate through the cell was 175 μL min−1. A graphite rod and an Ag/AgCl (3 M KCl) were used as counter and reference electrodes, respectively. The ICP-MS calibration was performed on each day of experiments using calibration standards with concentration of 0, 0.5, 1, and 5 ppb. The Ir and Pt dissolution were evaluated monitoring the intensities of 193Ir and 195Pt isotopes, while a steady performance of the ICP-MS was ensured by recording a signal from a 187Re internal standard. The specific Pt dissolution was calculated considering the Pt electroactive area obtained in the RDE measurements, and that this area is proportional to the Pt mass in the prepared spots. For Ir, the specific dissolution was obtained considering the deposited Ir mass in each spot, the Ir oxide density, and the average particle size obtained from the XRD and TEM results.
Results
Physicochemical characterization
Firstly, physicochemical characterization of the studied bifunctional catalysts was undertaken. Atomic and mass compositions of the studied Pt/IrOx and Pt/IrO2 bifunctional materials were estimated using energy-dispersive X-ray spectroscopy (EDS) with results presented in Table S1. The EDS results show that Pt deposition on the IrOx and IrO2 supports was successful, resulting in Pt/IrOx and Pt/IrO2 catalysts with Pt:Ir atomic ratios close to the nominal value of 1:1. Considering the oxygen content in the catalysts, an empirical formula of PtIrO2 and PtIrO1.7 can be obtained for the Pt/IrOx and Pt/IrO2 materials, respectively. It has to be noted, however, that IrOx support has relatively complex structure, not reflected by this formula. As an example, using the thermogravimetric analysis to elucidate the composition of hydrothermally prepared IrOx, Bestaoui and Prouzet suggested that the compound consisted of a hydrated Ir oxihydroxide, with formula IrO1.45(OH)1.10·1.5H2O, while rutile IrO2 phase can be obtained upon calcination.38
The X-ray diffraction (XRD) profiles of the IrOx and IrO2 materials before Pt loading are shown in Figure S1. The XRD diffractogram of the IrOx catalyst exhibits the existence of two broad peaks with low intensity, characteristic of an amorphous material. These peaks are attributed to the most intense reflections of the rutile42 and hollandite43,44 phases of IrO2 and iridate solid solutions, respectively. This result is in line with literature reports.45 Regarding the IrO2 support, the diffraction peaks corresponding to the tetragonal IrO2-rutile structure (PDF 15-870) are clearly seen. The crystalline structure of the support materials is also reflected in the XRD data of the bifunctional catalysts presented in Fig. 1a. Due to the amorphous nature of the IrOx, the Pt/IrOx catalyst only exhibits peaks corresponding to the reflection of the Pt face-centered cubic (fcc) (PDF 4-802) phase, while for the Pt/IrO2 material, peaks corresponding to the reflection of tetragonal IrO2-rutile (PDF 15-870) and (fcc) Pt are observed.
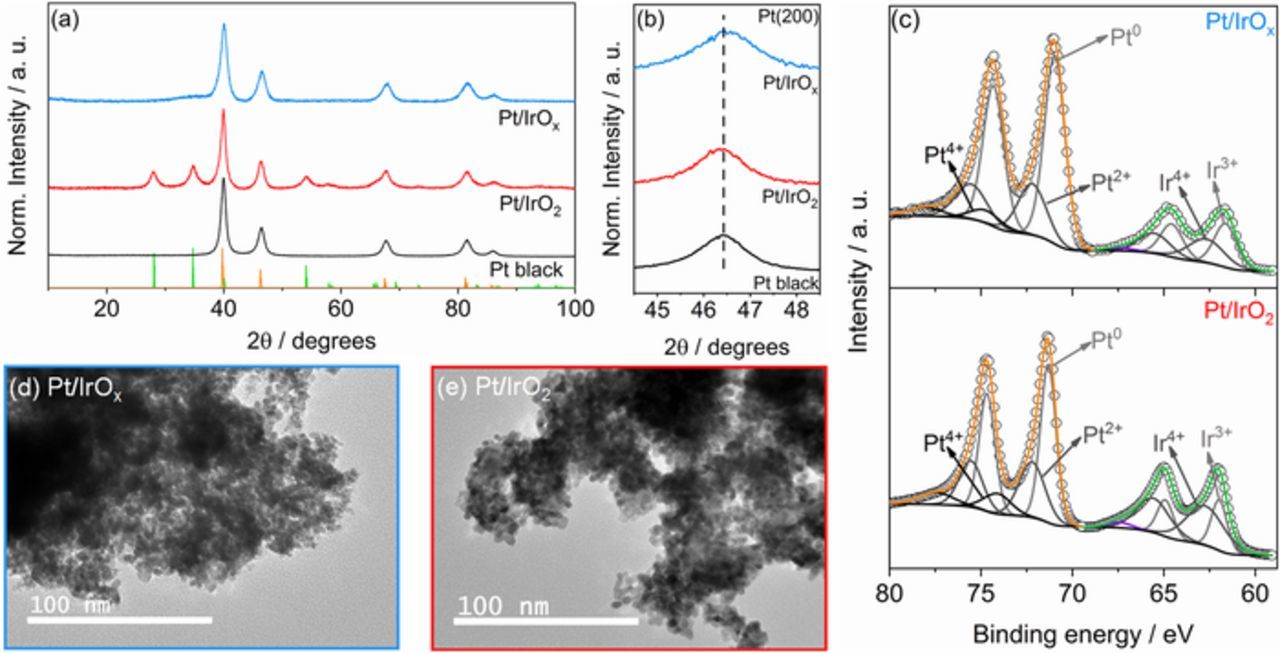
Figure 1. (a) Normalized XRD diffractograms of the bifunctional Pt/IrOx and Pt/IrO2 catalysts. Vertical lines correspond to the IrO2-rutile (PDF 15-870) and Pt face-centered cubic (PDF 4-802) crystallographic structures. (b) Magnified region of the Pt(200) diffraction peaks. The vertical dashed line corresponds to the peak position of Pt black. (c) High-resolution XPS spectra of the Ir 4f and Pt 4f orbitals. Transmission electron micrographs of the (d) Pt/IrOx and (e) Pt/IrO2 bifunctional catalysts.
Fig. 1b shows the magnified region of the Pt(200) diffraction peaks, which was chosen as it does not overlap with any diffraction peaks of the IrO2 structure. Here, a shift to a higher angle can be observed for the Pt/IrOx catalyst, while for the Pt/IrO2 material the Pt(200) peak position coincides with that of the Pt black, which is in line with literature.17 It is suggested that there is a lattice contraction in the Pt crystalline structure supported by IrOx. The mean crystallite sizes and lattice parameters of the studied catalyst were calculated using the Rietveld refinement technique40 and the results are compiled in Table S2. The calculated mean crystallite sizes (D) of the Pt phase in the Pt/IrO2 and Pt/IrOx catalysts are 3.8 and 9.9 nm, respectively. Regarding the lattice parameters (aexp), the calculated value for the Pt/IrOx material was 3.908 Å, smaller than those of Pt/IrO2 (3.923 Å) and Pt black catalysts (3.918 Å), confirming a contraction in the Pt lattice for Pt/IrOx. For the IrO2 phase in the studied catalysts, an increase in the IrO2 crystallite size is observed after the Pt deposition procedure, ranging from 3.4 for the IrO2 material to 5.9 for the Pt/IrO2 catalyst. The origin of this particles increase is still to be clarified. The structural parameters of the IrOx phase could not be calculated due to its amorphous nature.
The catalysts' surface composition was evaluated using the X-ray photoelectron spectroscopy (XPS) technique. The high resolution spectra of the Pt 4f and Ir 4f orbitals of the Pt/IrOx and Pt/IrO2 catalysts are shown in Figure 1c. The Ir XPS spectra can be deconvoluted into two doublets, which correspond to the Ir 4f7/2 and Ir 4f5/2 spin-orbit components with energy separation of 3.2 eV and fixed area ratio (Ir 4f5/2: Ir 4f7/2) of 3:4. Table S3 summarizes the Ir 4f7/2 binding energies and the percentage contribution of the different Ir species in the bifunctional catalysts. The first peak centered at the lower binding energy corresponds to the Ir3+ oxidation state, while the second peak is attributed to the higher oxidation of Ir4+.46 The XPS data shows that for Pt/IrOx catalyst 53% of the Ir species are in the Ir3+ oxidation state, while for the Pt/IrO2 material most of the Ir atoms are in the Ir4+ form (66%). The presence of Ir3+ species in the IrO2 support implies that the calcination at 400°C for 1 hour is not enough to fully convert the amorphous hydrous oxide to the rutile. Higher crystallization can be obtained using a higher calcination temperature and/or with a longer calcination time.22,38,47 An additional peak centered at ∼67.5 eV can be observed in both Ir 4f spectra, which corresponds to a satellite due to the conduction-band interactions during the electrons photoemission.48 Figure S2 shows the XPS spectra of the O 1s orbital of the bifunctional catalysts. A shift to lower binding energies can be seen for the O 1s spectrum of the Pt/IrO2 catalyst compared to the one of the Pt/IrOx material, which corresponds to a conversion of the oxihydroxide in the amorphous support to the rutile Ir oxide in the Pt/IrO2 catalyst.
Regarding the Pt 4f XPS data, the spectra can be deconvoluted into three doublets with peaks separation of 3.35 eV and area ratio (Pt 4f5/2: Pt 4f7/2) of 3:4, which corresponds to Pt in the Pt0, Pt2+, and Pt4+ oxidation states.49 The binding energies of the Pt 4f7/2 components and the percentage contribution of the different species are shown in Table S3. The Pt surface atoms in both catalysts are mostly found in the metallic form (Pt0); for the Pt/IrOx catalyst, the Pt0 percentage is close to 70%, while for the Pt/IrO2 material a lower percentage was found (56%). The XPS data was also used to estimate the Pt/Ir ratios in the catalysts' surface layer. The calculated Pt/Ir ratios for the Pt/IrOx and Pt/IrO2 catalysts are close to 3/1 and 2/1, respectively. Here, since Pt nanoparticles are deposited on the Ir oxide supports, and XPS is a surface-sensitive technique, the obtained Pt content is higher than that from EDS data (Table S1), which corresponds to a bulk analysis.
The TEM micrographs of the bifunctional Pt/IrOx and Pt/IrO2 materials are displayed in Figures 1d and 1e, respectively. The images show that for both materials the Pt and IrOx/IrO2 nanoparticles are highly agglomerated, making the distinction between the Pt phase and the oxide support difficult. Because of the agglomeration of the catalyst, the mean particle sizes cannot be precisely estimated. The TEM images of the IrOx and IrO2 catalysts without Pt are shown in Figure S3. The IrOx catalyst is composed by spherical nanoparticles with particle size in the 1–2 nm range (Fig. S3a). The smaller IrOx particles favors the deposition of Pt over itself, resulting in bigger crystallite size, and, consequently, in a higher Pt concentration in the catalyst surface, as shown in the analysis of XPS data. For the IrO2 material, the agglomeration and particle size increase as consequence of the calcination procedure (Fig. S3b).
To better understand how Pt nanoparticles are dispersed on the oxides supports, EDS chemical mapping was performed, and the results for the Pt/IrOx and Pt/IrO2 materials are exhibited in Figures S4 and S5, respectively. One can note that for both catalysts the Pt nanoparticles are well distributed over the entire surface of IrOx and IrO2 materials. For the Pt/IrO2 catalyst, some Pt richer regions can be distinguished, which is the result of some particles agglomeration.
Electrochemical characterization
The cyclic voltammetry (CV) profiles of the investigated bifunctional Pt/IrOx and Pt/IrO2 catalysts are exhibited in Fig. 2. For comparison purposes the CV profiles of the Pt black, IrOx and IrO2 materials are also shown in Fig. S6. Both CVs in Fig. 2a have higher double-layer currents compared to that of pure Pt (Fig. S6a). The main difference between the voltammetric profiles of the Pt/IrOx and Pt/IrO2 is observed in the so-called "hydrogen region" in the 0.05–0.4 V range. While the Pt/IrO2 catalyst exhibits well-defined peaks corresponding to the adsorption/desorption of hydrogen on Pt, in a similar way to Pt black (Fig. S6a) and others Pt/IrO2 catalysts,20,21 for the Pt/IrOx material no peaks can be seen, resulting in a profile comparable to that for the IrOx (Fig. S6b) and others hydrous Ir oxides.50,51
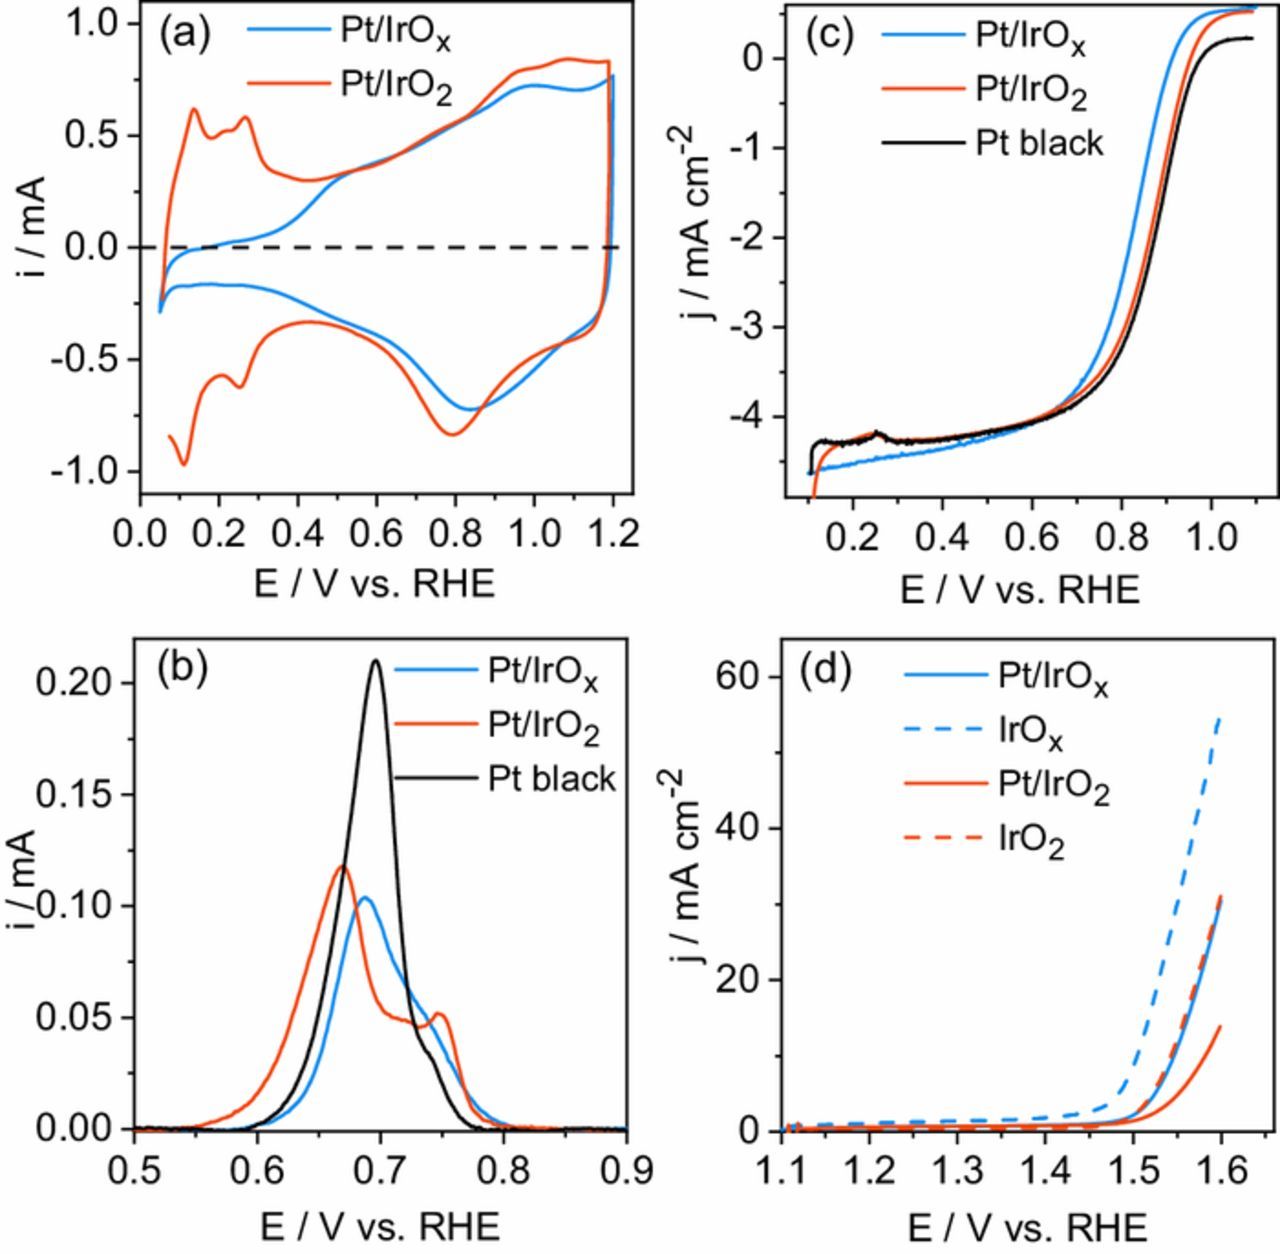
Figure 2. (a) Cyclic voltammograms of the Pt/IrOx and Pt/IrO2 catalysts obtained at 50 mV s−1. (b) Baseline corrected CO stripping profile recorded at 5 mV s−1. (c) ORR polarization curves of the Pt/IrOx, Pt/IrO2, and Pt black catalysts. (d) OER polarization curves of the Pt/IrOx, Pt/IrO2, IrOx, and IrO2 catalysts. The ORR and OER polarization curves were obtained at 5 mV s−1, and rotation speed of 1600 rpm.
The CO stripping voltammetry profiles of the bifunctional catalysts are displayed in Fig. 2b, which also includes the data obtained for the Pt black catalyst. The Pt/IrOx stripping profile exhibits a single peak centered at ∼0.69 V with a shoulder at ∼0.73 V, such profile is similar to that of Pt black material, and had also been reported for others Pt catalysts.52,53 Regarding the Pt/IrO2 catalyst, the CO stripping profile exhibits two peaks: a main peak at ∼0.67 V and a higher potential peak at ∼0.75 V. The Pt electroactive surface areas (AECSA) were calculated by integration of stripping peaks of Fig. 2b, and the values are shown in Table I. The AECSA values for the Pt/IrOx and Pt/IrO2 materials are 10.5 and 14.0 m² gPt−1, respectively, which are bigger than that for the Pt black catalyst (7.7 m² gPt−1).
Table I. Electrochemical active surface area (AECSA) and ORR/OER current densities at 0.85/1.55 V for the studied catalysts in sulfuric acid electrolyte.
| ORR@0.85 V | OER@1.55 V | |||||
|---|---|---|---|---|---|---|
| AECSA/m² gPt−1 | j/mA cm−2 | jSA/μA cmPt−2 | jm/mA mgPt−1 | j/mA cm−2 | jm/mA mgIr−1 | |
| Pt black | 7.7 | 2.5 | 85.3 | 15.5 | – | – |
| Pt/IrOx | 10.5 | 1.3 | 65.3 | 9.8 | 11.2 | 60.4 |
| Pt/IrO2 | 14.0 | 2.3 | 87.1 | 35.1 | 4.7 | 24.5 |
| IrOx | – | – | – | – | 30.3 | 79.6 |
| IrO2 | – | – | – | – | 12.2 | 32.0 |
Oxygen reduction reaction polarization curves in sulfuric acid electrolyte are presented in Fig. 2c. A positive current at E > 0.9 V can be observed for the bifunctional catalysts as a result of the influence of IrOx/IrO2 capacitive currents. Argon-corrected polarization curves can be seen in Fig. S8. The current densities (j) at 0.85 V are summarized in Table I. The Pt/IrO2 (2.3 mA cm−2) catalyst exhibits a similar current density to that of the Pt black (2.5 mA cm−2), even with just half the Pt loading, and higher than that of the Pt/IrOx catalyst (1.3 mA cm−2). A similar trend is obtained considering the specific activity values (jSA). In this case, the Pt/IrO2 (87.1 μA cmPt−2) and Pt black (85.3 μA cmPt−2) catalysts exhibit similar jSA values, and those are ∼30% higher than that for the Pt/IrOx material (65.3 μA cmPt−2). The catalysts' mass activities of the studied materials are shown in the mass transport corrected Tafel diagrams in the Fig. S9a. All curves exhibit two linear regions with slopes close to 60 and 120 mV dec−1 (for the sake of simplicity just shown for Pt black). At potential values lower than 0.9 V (E < 0.9 V), the Pt/IrO2 has an ORR mass activity higher than that of Pt black, while the Pt/IrOx catalyst presents the poorer catalytic performance. Mass normalized currents (jm) calculated using the Koutecky-Levich diagrams (not shown) are presented in Table I. The Pt/IrOx and Pt/IrO2 catalysts exhibit jm values of 9.8 and 35.1 mA mgPt−1, respectively. The jm value obtained for the Pt/IrO2 catalyst is ∼2.3 times higher than that of Pt black (15.5 mA mgPt−1), while that for the Pt/IrOx is ∼40% lower than that of the pure material.
The catalysts' activities for the OER are shown in the polarization curves in Fig. 2d. The current density values at 1.55 V are presented in Table I; the Pt/IrOx catalyst exhibits a current density of 11.2 mA cm−2, a value almost 2.5 times higher than that for the Pt/IrO2 material (4.7 mA cm−2), and similar to that of pure IrO2 (12.2 mA cm−2), even with half the Ir load. Mass normalized OER polarization curves are displayed in Fig. S9b, while the mass activities (jm) currents at 1.55 V are shown in Table I. The current density of the Pt/IrO2 and IrO2 catalysts at 1.55 V are 24.5 and 32.0 mA mgIr−1, respectively. Regarding the Pt/IrOx catalyst, the jm at 1.55 V is 60.4 mA mgIr−1, also lower than that of pure IrOx (79.6 mA mgIr−1). However, the polarization curves in Fig. S9b show that for potentials values higher than 1.58 V the Pt/IrOx catalyst becomes more active than the IrOx material, which may be related to better electronic conductivity or improved gas release.
Dissolution stability
The catalysts' stability in terms of electrochemical dissolution was evaluated using an SFC-ICP-MS setup under three protocols, comprising cycling in the ORR (0.6–1.1 V), OER (1.1–1.6 V), and ORR–OER (0.6–1.6 V) potential windows. Potential resolved dissolution profiles for Pt and Ir are displayed in Fig. 3.
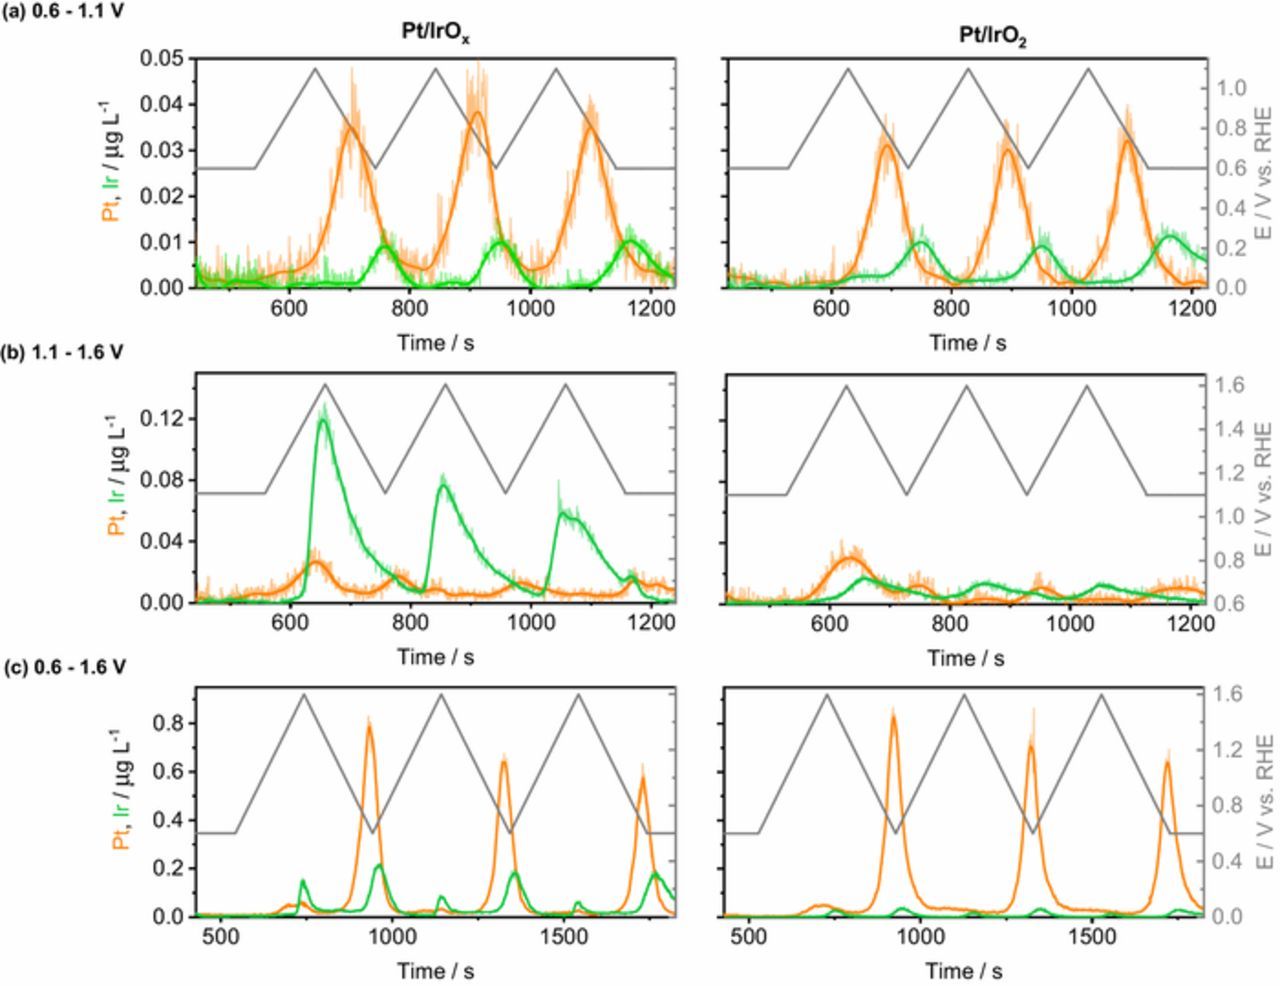
Figure 3. Dissolution profiles of Pt/IrOx and Pt/IrO2 catalysts cycled between (a) 0.6–1.1 V, (b) 1.1–1.6 V, and (c) 0.6–1.6 V, at 5 mV s−1, in 0.1 M H2SO4.
Results for the ORR potential range in Fig. 3a reveal that while the Pt dissolution process cannot be clearly resolved during the positive-going sweep (anodic dissolution), the dominating dissolution process is taking place during the negative-going sweep (cathodic dissolution). Previous dissolution data for polycrystalline Pt and Pt nanoparticles shows that at the chosen scan rate, using the current experimental setup, both dissolution processes can only be resolved when cycling to higher potentials.24,32 Similarly to Pt, cathodic dissolution is the main Ir degradation process, which is in line with results for electrochemically grown IrOx.54 Considering the cathodic dissolution for the first cycle, the potential onset, estimated as the potential at which signal-to-noise S/N = 3, for Pt and Ir dissolution is ∼1.0 V and ∼0.7 V. These values are similar to that of metallic Pt and Ir electrodes.54,55 In this protocol, the dissolution amount of Pt is almost 3 times higher than that for Ir in the Pt/IrOx and Pt/IrO2 materials. For both materials, dissolution of Pt and Ir is rather constant along cycles.
Fig. 3b shows the dissolution profiles of the bifunctional catalysts cycled in the OER potential region. One can see that during the first cycle both materials exhibit a Pt anodic dissolution peak with potential onset at 1.20 V, accompanied by a less intense reduction peak at 1.15 V. In the second and third cycles the anodic dissolution peaks are almost imperceptive, while cathodic Pt dissolution, although small, is still observed. The anodic dissolution of Ir from IrO2 and especially IrOx supports is higher in this potential region than in the ORR potential range (Fig. 3a). The potential onsets for Ir dissolution of Pt/IrOx and Pt/IrO2 catalysts are 1.45 V and 1.52 V, respectively. These values are in line with the OER onsets shown in Fig. 2d, and are higher than those reported for electrochemically grown IrOx (0.7–0.8 V)54 and for IrO2 (1.30 V) catalyst obtained at 450°C.23 Ir is not dissolving cathodically in this region as much lower cathodic potential is required to reach cathodic dissolution on Ir.54
Finally, when cycled between 0.6–1.6 V (Fig. 3c), the transient dissolutions of Pt and Ir, composed of an anodic and cathodic counterparts, are clearly seen. Compared to the protocols used in Figs. 3a and 3b, cycling in between 0.6–1.6 V increases the catalysts' instability. In this protocol dissolution of Pt is much higher, which is in line with literature reporting high Pt dissolution when potential protocol includes potentials of Pt oxidation and reduction.24 Also cathodic dissolution of Ir is higher in this protocol.
The Pt and Ir dissolved amounts in each protocol can be calculated by the integration of dissolution profiles in Fig. 3. Summarized data on dissolution of Ir and Pt in the studied protocols are shown in Fig. 4. While cycling in the ORR region (0.6–1.1 V), the calculated (three cycles-averaged) dissolved amounts of Pt and Ir for the Pt/IrOx catalyst are 7.3 ± 0.7 and 2.5 ± 0.4 pg cycle−1, and for the Pt/IrO2 material values are 6.6 ± 0.2 and 2.1 ± 0.03 pg cycle−1, respectively. Cycling in the OER region (1.1–1.6 V), one can note an increase in the amount of dissolved Ir; for the Pt/IrOx catalyst, the measured Ir dissolution is 21.6 ± 1.0 pg cycle−1, a value more than 4 times higher than that for the Pt/IrO2 (5.1 ± 0.4 pg cycle−1). Regarding the Pt dissolution, cycling in higher potentials do not cause a significant increase in the dissolved amounts for the Pt/IrOx (7.4 ± 0.3 pg cycle−1) and Pt/IrO2 (7.9 ± 0.3 pg cycle−1) bifunctional catalysts compared to the protocol involving cycling in the ORR region. Significantly higher dissolution rates are observed when the catalysts are cycled in the 0.6–1.6 V range. The calculated dissolved amount of Ir for the Pt/IrOx material is 45.1 ± 8.6 pg cycle−1, and 23.6 ± 4.3 pg cycle−1 for the Pt/IrO2 catalyst. For Pt dissolution, the calculated amounts are even higher, being 115.2 ± 1.5 pg cycle−1 for the Pt/IrOx, and 143.9 ± 2.8 pg cycle−1 for Pt/IrO2. The dissolution rate calculated for the Pt black material (Fig. S10) under the same protocol is 130.4 ± 2.1 pg cycle−1, this value is similar to that of the bifunctional catalysts, even with double Pt loading, and shows that supporting Pt in IrOx and IrO2 does not increase its stability in terms of dissolution.
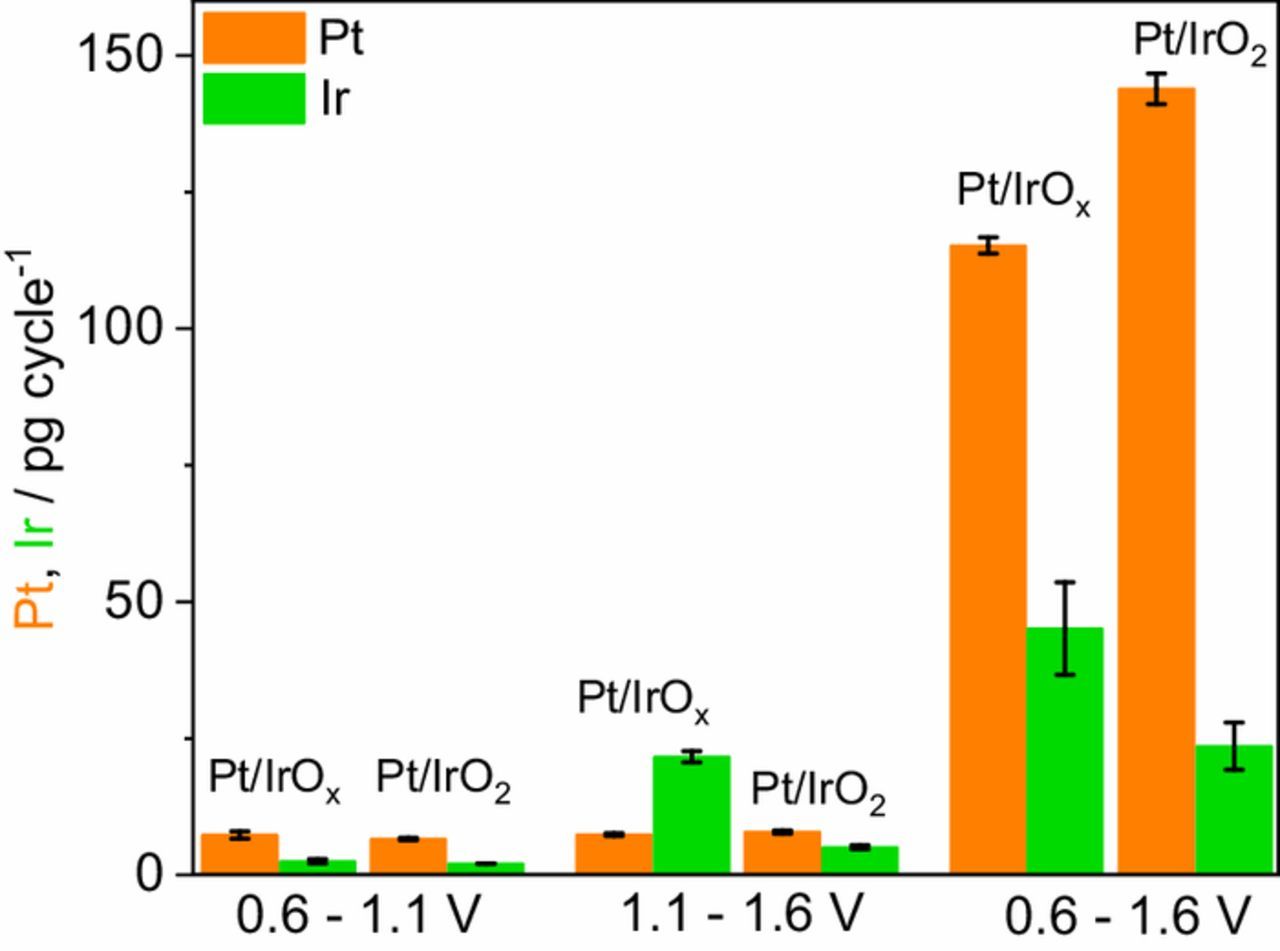
Figure 4. Calculated dissolved amounts of Pt and Ir for the Pt/IrOx and Pt/IrO2 catalysts in the different protocols. The values are an average of three independent measurements.
Discussion
Electrochemical characterization and catalytic activity
The Pt/IrOx and Pt/IrO2 catalysts exhibit higher currents in the so-called double-layer and Ir oxidation/reduction potential regions compared to the Pt black material, which is due to the capacitive behavior of the oxide supports, especially IrOx. Interestingly, both bifunctional catalysts show comparable currents in these regions. This can be explained by higher pseudocapacitance of IrOx support (Fig. S6) but smaller Pt particle size in the Pt/IrO2 material. On the other hand, the two catalysts behave very differently in the hydrogen region. Similar CV profiles were also reported by Yao et al. for both mixed and deposited Pt on IrOx. The authors suggested that the hydrogen adsorption/desorption on Pt is affected in some way by the amorphous support.17 We suggest that the observed absence of the typical Pt Hupd characteristics for IrOx supported Pt can be related to the lower conductivity of the IrOx support in the 0.05–0.4 V potential range. Indeed, studies on the electrochromic effect of IrOx, showing that a transition from a semiconducting to metallic behavior at E > 0.5 V vs. RHE,56,57 confirm this statement.
Unlike hydrogen, it seems like CO can adsorb on the surface of Pt even if it supported by IrOx, as after the CO adsorption taking place in the discussed above low conductivity region of IrOx (0.1 V vs. RHE), clear CO stripping signal was recorded. While of a very high importance, the full understanding of the difference between hydrogen and carbon monoxide adsorptions on Pt/IrOx requires a more detailed study and is beyond the scope of the present work. For both Pt/IrOx and Pt/IrO2 catalysts one can note the existence of several CO stripping peaks. The existence of multiple peaks for CO oxidation on Pt nanoparticles is still not fully understood and is typically assigned to several factors such as particle size, particles agglomeration, CO adsorption on different Pt sites (terraces, edges, and corners), and even the nature of the used support.58 It's worth noting that CO adsorbs only on Pt, as no CO oxidation peaks were observed for the IrOx and IrO2 supports (Fig. S7). The latter implies the absence of metallic Ir on the surface. This is also supported by the XPS data (Fig. 1), while XRD discards any significant amount of metallic Ir in bulk.
Adsorption of CO on Pt for both catalysts allows one to estimate electrochemical surface area, AECSA, of Pt. As summarized in Table I, AECSA increases in the order Pt/IrO2 > Pt/IrOx > Pt black, and reflects a decrease in the Pt size of the bifunctional materials, in agreement with the XRD results in Table S2. It is worth noting, however, that the AECSA values of the Pt/IrO2 (14.0 m² gPt−1) catalysts is smaller than those reported for Pt/C catalysts with similar particle sizes.59 This difference can be explained by a higher degree of Pt nanoparticles agglomeration on IrO2 (Figs. 1d and 1e) and even by some blockage of the Pt surface by the oxide support.60
With respect to the catalysts activities, in line with the literature results for Ir-based OER catalysts, bifunctional IrOx-supported catalysts were more active toward OER. The higher activity of both chemical and electrochemical grown amorphous Ir oxide catalysts,22,47,61,62 is typically assigned to its chemical and electronic structures, like the presence of an Ir hydroxo (Ir-OH) layer,63 and the combined existence of Ir3+ sites and vacancies in the oxygen electronic structure.64 Recently we have shown that the participation of lattice oxygen makes OER faster on such catalysts.36 Comparing to literature, the OER activity of the Pt/IrOx catalyst studied here is higher than those previously reported for others similar bifunctional materials in sulfuric acid electrolyte.17,45 In terms of ORR activity, among the materials studied here, Pt/IrO2 (35.1 mA mgPt−1) catalyst exhibits the best gravimetric ORR kinetic currents, which can be attributed to the smaller Pt particle size. With respect to the specific activity values (jSA), the current density obtained for the Pt/IrO2 (87.1 μA cmPt−2) is close to that of Pt black (85.3 μA cmPt−2), and both are more active than the Pt/IrOx catalyst (65.3 μA cmPt−2). Similar activity was also reported by Kong et al. for Pt/IrO2 catalysts.20,30 Tafel coefficients of 60 and 120 mV dec−1 have been extensively reported for Pt-based electrodes and are explained in terms of the coverage degree of the electrode by adsorbed oxygen, following the conditions described by a Temkin or Langmuir isotherms at low and high overpotential values, respectively.65 Similar Tafel slopes for the bifunctional catalysts and for Pt black implies that the ORR mechanism is not affected by the presence of the IrOx and IrO2. Thus, one can summarize that while Pt/IrOx is more active for OER, Pt/IrO2 performs better during ORR.
Catalysts' stability
According to literature, potential cycling in the relatively mild ORR potential region during the long-term stability tests results in the degradation in active surface area and catalytic performance.28–30 As shown in this work, degradation during the cycling in the 0.6–1.1 V potential window can be attributed to dissolution of both Ir and Pt. Indeed, the onsets of measurable anodic dissolution for Pt and electrochemically grown hydrous Ir oxide in H2SO4 are at ca. 0.95–1.1 V,66 0.7–0.8 V,54 respectively, and thus within the potential window range of the ORR degradation protocol. Despite the lower onset, dissolution of Ir is significantly lower, which is explained by a higher stability of IrOx and IrO2 toward the cathodic dissolution. Comparing the two studied materials, Pt and Ir dissolution rates for both Pt/IrOx and Pt/IrO2 are similar, although it seems like the latter is slightly more stable. In contrast to these results, Jovanovič et al. showed that dissolution of Ir from IrO2 is two order of magnitude lower compared to metallic Ir or electrochemically grown hydrous Ir oxide when cycled.37 This discrepancy may be related to the existence of the less stable IrOx species in our Pt/IrO2 catalyst. Based on these results, it can be summarized that while staying in the ORR potential region it is the stability of Pt which is of the highest concern. Although significantly lower, dissolution of Ir, however, should not be completely disregarded.
The dissolution profiles are very different when catalysts are investigated in the OER potential region. Thus, concerning the Pt dissolution, there is a substantial difference between the first and the subsequent cycles. Also, while for the first cycle most of Pt dissolves anodically, subsequent dissolution is predominantly cathodic. This behavior of Pt is attributed to Pt passivation by formation of stable oxides.24 Small cathodic dissolution peaks reveal that already at 1.1 V some dissolution takes place, which is in line with our recent analysis undertaken for polycrystalline Pt in which the onset of Pt cathodic dissolution was found at 1.25 V vs. RHE.55 In that study, the anodic Pt dissolution on the partially reduced Pt surface was assumed to explain this dissolution process. Regarding the Ir dissolution, the anodic dissolution peaks with dissolution onsets similar to those of OER are observed. These results are in accord with previous Ir dissolution results stating that beyond the OER onset the Ir dissolution increases, and that the oxygen evolution and Ir dissolution share common intermediates.35,54,67 In terms of dissolved amounts, a reduction in the Ir dissolution peaks of the Pt/IrOx material in the second and third cycles of Fig. 3b, should also be noted, which can be a result of the partial blockage of Ir active sites by oxygen bubbles, and/or to conversion of IrOx to IrO2.68 The lower dissolution stability of IrOx compared to IrO2 in the OER region is in accordance with literature,22,37 and is consistent with other works stating that while amorphous Ir oxide is more active for the OER, the crystalline IrO2 has higher electrochemical stability.22,23,47,69 Employing the recently introduced stability number concept,36 it is calculated that both material have a similar S-number of ca. 104. The calculated S-number for the IrO2 support is 2–3 orders of magnitude lower than that reported by Geiger et al., reflecting a relatively high content of Ir(III) species in the IrO2 prepared in this work. The latter is a consequence of the relatively low calcination temperature.22,23 Comparing Pt and Ir dissolution, one can see that the Pt and Ir dissolution peaks have similar intensities for the Pt/IrO2 material in the OER potential range, while for the Pt/IrOx catalyst the Ir dissolution is more pronounced than that of Pt.
Significantly higher dissolution of both Pt and Ir is observed when potential protocol involves both ORR and OER. In this protocol, the anodic and cathodic dissolution processes for Pt and Ir are easily resolved, confirming the transient dissolution of both metals.32 A significant increase in Pt dissolution rates during transitions from low to high potentials for commercial Pt/C catalyst was previously reported by Pizzutilo et al.70 Besides dissolution, also other degradation processes such as particles coalescence, growth, and detachment, as identified by IL-TEM measurements, accelerate in this potential window.28 As already pointed in the analysis of Figure 3b, Ir dissolution for the Pt/IrOx catalyst is higher than that for the Pt/IrO2. Nonetheless, dissolution of Pt is of the highest concern here. The observed higher Pt dissolution for the Pt/IrO2 catalyst may reflect some effect in the nanoparticles size difference,34 although other effects like catalysts' porosity, and the catalytic layer thickness can have an important role in the dissolution process.33,71 Regarding the specific dissolution values (normalized by electroactive surface area), the Pt dissolution rate of ∼5.5 ng cm−2 cycle−1 was found for the Pt/IrOx and Pt/IrO2 materials, while the specific Ir dissolution of ∼0.09 ng cm−2 cycle−1 and ∼0.14 ng cm−2 cycle−1 were found for Pt/IrOx and Pt/IrO2, respectively. These results are in line with those reported for polycrystalline Pt,32 Pt/C,33 metallic Ir,67 and electrochemically grown hydrous Ir oxide films.54 Therefore, one can conclude that no specific bifunctional stabilization effect can be derived for the Pt/IrOx and Pt/IrO2 catalysts.
General remarks on the performance of the bifunctional catalysts
The catalytic activity results attest that a superior ORR performance is obtained with the IrO2 supported Pt material. Regarding the OER, higher currents are achieved while using the Pt/IrOx material. The adequate catalyst should thus be chosen considering if the fuel cell or electrolyzer mode of the URFC is a priority.
The calculated dissolved Pt amounts for the Pt/IrOx and Pt/IrO2 bifunctional catalysts in the 0.6–1.6 V range suggest that this could become a significant problem while using these catalysts in the oxygen electrode of URFC. Moreover, since in such devices the catalysts would be submitted to even higher anodic potentials (1.5–1.7 V and higher for smaller catalyst loadings) during the electrolyzer mode operation, with subsequent potential decrease to (0.5–0.7 V) in the fuel cell operation, even higher dissolution rates are expected. Assuming a constant dissolution rate per cycle, the complete dissolution of Pt would be reached after ∼1,700 cycles and ∼1,500 cycles for the Pt/IrOx and Pt/IrO2 catalysts, respectively. Thus, if the operation mode of a URFC is switched twice a day, after 10,000 hours of operation about half of the Pt loading in these catalysts would be dissolved (steady dissolution is not considered here). Regarding the Ir dissolution, the complete degradation of the IrOx and IrO2 supports would take place after ∼4,000 and ∼9,000 cycles between 0.6–1.6 V, respectively. It should be noted, however, that unlike dissolution of Pt which seems to be similar in aqueous and fuel cell environments,24 Ir is significantly more stable in proton exchange membrane water electrolyzers.36 Moreover, by employing a higher calcination temperature, even higher stability toward Ir dissolution can be easily achieved.
This new finding put the whole concept of using Pt and Ir as a bifunctional oxygen catalyst under question. Since the main issue lays in the intrinsic instability of Pt toward transient dissolution, new strategies of replacing Pt with a more stable catalyst have to be suggested. While current work is not aimed to present such solutions, it clearly shows that dissolution stability must be always considered during the development of new materials. Moreover, it points on the bottleneck of such catalysts stability, i.e. dissolution of Pt, while stability of Ir may be considered sufficient.
Conclusions
In order to investigate dissolution stability of Pt-Ir based URFC catalysts, two bifunctional catalysts were synthesized by depositing Pt on hydrous (Pt/IrOx) and crystalline (Pt/IrO2) Ir oxides. It was found that, while the former is more active toward OER, the latter shows better activity during the ORR. The main focus of this study was put on the dissolution stability of Pt and Ir. For this, the catalysts dissolution was quantified under three potential protocols using an SFC-ICP-MS setup. It was found that, cycling potential in the ORR (0.6–1.1 V) potential range results in relatively low amounts of dissolved Pt and Ir in the electrolyte. Cycling in the OER potential window (1.1–1.6) resulted in an increased amount of dissolved Ir, with Pt/IrOx catalyst showing lower stability. Significantly higher dissolution rates, especially for Pt, were detected while cycling between 0.6–1.6 V. The latter was attributed to the transient dissolution of Pt taking place during the metal/oxide and oxide/metal transitions. It was estimated that due to Pt dissolution the lifetime of the URFC is limited to only several thousand cycles. This new finding suggests that in order to achieve a longer lifetime of PEM-based URFCs, new strategies to stabilize or replace Pt must be proposed, even if activity is to be compromised.
Acknowledgments
G.C. da Silva and E.A. Ticianelli thank the financial support from FAPESP (n° 2013/16930-7). G.C. da Silva thanks CNPq for the sandwich PhD scholarship (n° 200321/2017-0).
ORCID
Gabriel C. da Silva 0000-0001-5852-7495
Serhiy Cherevko 0000-0002-7188-4857