
Abstract
The anodic oxidation stability of battery components like the conductive carbon black (Super C65) and the co-solvent ethylene carbonate (EC) is of great relevance, especially with regards to high-voltage cathode materials. In this study, we use On-line Electrochemical Mass Spectrometry (OEMS) to deconvolute the CO and CO2 evolution from the anodic oxidation of carbon and electrolyte by using a fully 13C-isotope labeled electrolyte based on ethylene carbonate with 2 M LiClO4. We present a newly developed two-compartment cell, which provides a tight seal between anode and cathode compartment via a solid Li+-ion conducting separator, and which thus allows us to examine the effect of trace amounts of water on the anodic oxidation of carbon (12C) and ethylene carbonate (13C) at high potentials (> 4.5 V) and 10 to 60°C. Moreover, we report on the temperature dependence of the water-driven hydrolysis of ethylene carbonate accompanied by CO2 evolution. Finally, by quantifying the evolution rates of 12CO/12CO2 and 13CO/13CO2 at 5.0 V, we demonstrate that the anodic oxidation of carbon and electrolyte can be substantial, especially at high temperature and in the presence of trace water, posing significant challenges for the implementation of 5 V cathode materials.
Export citation and abstract BibTeX RIS

This is an open access article distributed under the terms of the Creative Commons Attribution Non-Commercial No Derivatives 4.0 License (CC BY-NC-ND, http://creativecommons.org/licenses/by-nc-nd/4.0/), which permits non-commercial reuse, distribution, and reproduction in any medium, provided the original work is not changed in any way and is properly cited. For permission for commercial reuse, please email: oa@electrochem.org.
The requirements placed on Li-ion battery technology have changed from powering small portable electronics to applications demanding high energy and high power density, such as hybrid and plug-in electric vehicles.1,2 As a result, high-voltage cathode materials have been developed that raise the cell voltage from 3.7 V in the case of a traditional LiMO2 (M = Co, Ni, Mn) cathode to 4.8 V in new cathodes such as the high-voltage spinel LiNi0.5Mn1.5O4 (LNMO) or LiCoPO4 (LCP).3–6 The state-of-the-art electrolyte, a mixture of ethylene carbonate (EC) and diethyl carbonate (DEC), dimethyl carbonate (DMC), and/or ethyl methyl carbonate (EMC) with dissolved LiPF6 salt, tends to decompose on the surface of the delithiated cathode at potentials higher than 4.5 V vs. Li/Li+, especially at high temperature.7–12 Thus, the practical application of these high-voltage materials remains hindered by several obstacles:13–18 (i) the limited anodic stability of electrolyte solvents and salts as well as of binders, (ii) the loss of active Li+-ions, (iii) the corrosion of the aluminum current collector, and (iv) the instability of conductive carbon additives due to anion intercalation and/or carbon oxidation.
While the corrosion of conductive carbons is suggested by the frequently observed increase of the electrical resistivity of long-term cycled high-voltage cathodes,15 quantitative measurement on the anodic decomposition of carbons have only been made in the context of Li-air battery research, making use of isotopically labeled battery components to decouple electrode and electrolyte related CO2 evolution. For example, Thotiyl et al. used a 13C carbon cathode in DMSO and tetraglyme-based electrolyte to study CO2 evolution from decomposition products formed with the carbon electrode (13CO2) and the electrolyte (12CO2) by in-situ differential electrochemical mass spectrometry (DEMS).19 The carbon electrode was found to decompose in the presence of Li2O2 upon charging above 3.5 V, yielding 13CO2. In another study, McCloskey et al. employed a 13C carbon cathode and performed a discharge/charge cycle in EC:DMC-based electrolyte.20 The authors concluded that only a small amount of carbon oxidation occurred that accounted for < 4% of all CO2 evolution and indicated that electrolyte decomposition is the primary source of CO2 on charge of Li-air cells. To our knowledge, there has only been one study for Li-ion batteries, where a deconvolution of evolved CO and CO2 during the storage of charged anodes, cathodes, and full cells (LiNixCoyAll-x-yO2/graphite charged to 4.2 V and held at 85°C) into electrolyte and non-electrolyte (binder and conductive carbon additive) contributions was made.21 By means of 13C-labeled EC and DEC, the authors concluded that about one third of the evolved CO and CO2 derived from the oxidation of non-electrolyte components. Even though the study did not allow to determine which of the non-electrolyte components contributed predominantly to the CO/CO2 evolution shown to originate from the cathode electrode, the authors hypothesized that it may have been carbonate impurities in the cathode material which were the main contributors, rather than the conductive carbon and the binder (PVdF).
To quantify the CO/CO2 evolution rates at high potentials without interference from the active cathode material, the present study uses PVdF-bonded carbon electrodes without active-material, so that the corrosion of carbon and binder can be clearly distinguished from that of the 13C-labeled electrolyte. Since there is ample evidence from the fuel cell literature that the corrosion of carbon can be enhanced by the presence of water and at elevated temperatures,22,23 both are clearly critical parameters to describe the corrosion behavior of conductive carbons, but also of the binder and the electrolyte. In Li-ion batteries, the effect of water has mostly been evaluated with regards to battery formation, i.e., with regards to its effect on the solid electrolyte interphase (SEI) formation on graphite anodes.24–27 For example, Joho et al. performed DEMS measurements in half-cells with different water concentrations, and demonstrated that the evolution of ethylene during the SEI formation is inversely proportional to the water concentration in the electrolyte.26 Recently, Bernhard et al. examined the frequently observed gassing of Li-ion batteries based on lithium titanate Li4Ti5O12 (LTO) anodes, showing a direct correlation between the amount of evolved hydrogen during charge/discharge and the water content of the electrolyte.28 Two recent articles by the group of Jeff Dahn looked also into the effect of intentionally added water to the electrolyte and compared the implications for the performance and cycle-life of LiCoO2/Li4Ti5O12 (LCO/LTO) cells and LiCoO2/graphite cells.29,30 No severe detrimental effects on the cell performance were observed, however, concentrations above 2000 ppm water at elevated temperature (> 50°C) began to negatively affect cycling performance for LCO/LTO cells. To our knowledge, no quantitative studies were done on the enhancement of conductive carbon, binder, and/or electrolyte oxidation by trace water at high potentials in Li-ion battery cells.
In this study, we use On-line Electrochemical Mass Spectrometry (OEMS) to deconvolute the corrosion of carbon (Super C65), PVdF binder, and electrolyte, by using a fully isotope labeled electrolyte based on ethylene carbonate (further referred to as "13C3 EC"), which is an essential constituent of commercial electrolyte formulations. Since our electrolyte contains only ethylene carbonate and 2 M LiClO4, it is clearly not suitable for use in real batteries, but is particularly suitable for mass spectrometry studies where its very low background signals due to its low vapor pressure enable highly precise signal quantification. For similar reasons, it has been used as model electrolyte solvent in previous studies.31,32 Our studies are conducted in a newly developed two-compartment cell, which provides a tight seal between anode and cathode compartment via a solid Li+-ion conducting separator, and which thus allows us to examine the effect of trace amounts of water on the anodic oxidation of carbon (12C), binder (12C), and electrolyte (13C) at high potentials (up to 5.5 V) and elevated temperatures (up to 60°C). Besides studying the anodic potential-driven oxidation of carbon, binder, and electrolyte, we also report on the potential-independent rate of the hydrolysis reaction of ethylene carbonate with water, which becomes significant at elevated temperatures. While the anodic oxidation of PVdF does not significantly contribute to CO/CO2 formation under the investigated conditions, carbon and electrolyte oxidation occur at comparable rates, which are quite significant at already 5 V, presenting a significant challenge for the use of the new class of near 5 V cathode materials (e.g., LiCoPO4 and LiNi0.5Mn1.5O4).
Experimental
Sealed two-compartment cell
In order to investigate the effect of electrolyte additives and water on the cell chemistry of Li-ion and Li-air batteries, a novel cell design featuring separate compartments for anode and cathode was developed (see Figure 1). This design allows to add the investigated species selectively to one compartment and to study their effect on either anode or cathode. In half-cell studies, it shields the investigated species from exposure to the strongly reducing environment of the lithium counter-electrode.
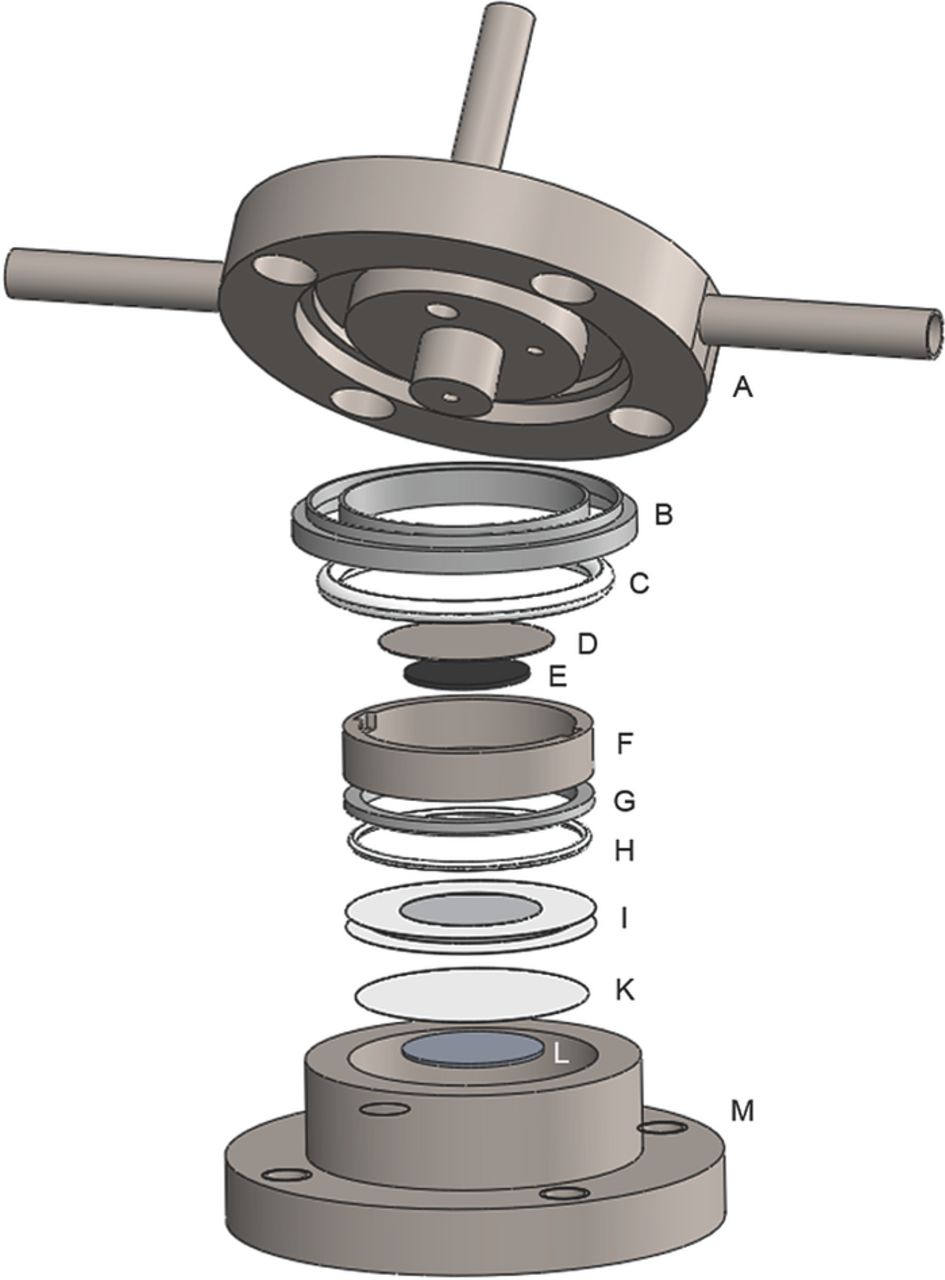
Figure 1. Isometric view of the sealed two-compartment cell: (A) upper stainless steel (SS) cell body with inlet (left), outlet (right) and connection to OEMS (top); (B) Kel-F insulation rings; (C) large virgin PTFE O-ring; (D) SS mesh current collector; (E) positive electrode; (F) SS screw; (G) SS guide ring; (H) small virgin PTFE O-ring; (I) Li+-ion conductive glass ceramic from Ohara, laminated with 40 μm thin polypropylene foil; (K) separator; (L) negative electrode; (M) lower SS cell body with inside-thread for SS screw.
The sealed two-compartment cell was constructed on the basis of the Li-air cell design employed by our group.33 It consists of a 316L stainless steel (SS) cell body (part M, in Figure 1), which exhibits a step in the bottom for aligning the lithium counter-electrode (L, diameter 17 mm, thickness 0.45 mm, 99.9%, Rockwood Lithium, USA) and the separator sheet (K, glass microfiber filter, 691, VWR, Germany) or any other suitable counter-electrode. Moreover, the SS body defines a cylindrical cell volume (8.5 ml) with a thread on its inner side that hosts a SS screw (F). The two compartments are separated by a Li+-ion conductive glass ceramic (LICGC, diameter 1 inch, thickness 150 μm, conductivity 10−4 S/cm, Ohara, Japan) that was also employed in some of our previous work and to which we will refer to as "Ohara glass" in the following text.28,34 The Ohara glass (I) is only permeable for Li+-ions and serves as a diffusion barrier for liquids and gases between the anode and the cathode compartment. In order to enhance the stability of the fragile glass ceramic and to obtain an area that can be compressed for sealing, the glass was laminated with two concentric annuli of polypropylene foil (18 mm inner diameter and 30 mm outer diameter, thickness 40 μm, Profol, Germany) in a hydraulic heated-platen press (Dr. Collin GmbH, Germany) at 150°C and 10 bar for 5 min (this sealing method had been proposed previously35). Thus, the area sealed exclusively by the foil, namely between the outer diameter of the Ohara glass and the outer diameter of the foil, amounts to 2.0 cm2. To achieve an effective sealing between the compartments, a virgin-PTFE O-ring (H, cord diameter 1.07 mm, inner diameter 27 mm, Angst+Pfister, Switzerland) held by a SS guide ring (G) is pressed onto the lamination foil. The pressure on the O-ring is generated by screwing the SS screw (F) into the lower cell body (M). Once the lower cell compartment is sealed, separator sheets and the working-electrode (E) can be placed onto the Ohara glass, and even large volumes of electrolyte containing water or other additives can be pipetted into the upper compartment without exposing them to the counter-electrode. A gastight sealing of the two-compartment cell is ensured by another virgin-PTFE O-ring (C, cord diameter 2.62 mm, inner diameter 30 mm, Angst+Pfister, Switzerland) positioned in the upper cell body (A). Electrical contact between the upper cell body and the working-electrode is provided through a SS spring (not shown in Figure 1, 2.3 N/mm, 0.5 inch diameter and length, Lee Springs, UK) attached to the upper cell body (A) and pressing onto a SS mesh current collector (D, diameter 21 mm, wire diameter 0.22 mm, openings 1.0 mm, Spörl KG, Germany) placed on top of the working-electrode. For electrical insulation between the upper and the lower cell body, two Kel-F insulation rings (B) are placed into the sealing notch of the upper cell body (A). The cell assembly is completed by closing the cell with four screws at a torque of 6 Nm.
A schematic representation of the cell design is shown in Figure 2, illustrating the polypropylene edge-sealed Ohara glass (I) and the O-ring (H) which provide the seal between the working-electrode (E) and the counter-electrode (L).

Figure 2. Schematic cross-section of sealed two-compartment cell used in the anodic oxidation experiments, in which the Super C65 carbon working-electrode (E) is coated onto a Celgard C480 separator and placed onto two glass fiber separators (K) which serve as electrolyte reservoirs. In all experiments, the upper compartment (1) is the working-electrode compartment and the lower compartment (2) is the counter-electrode compartment. For a description of D-L see caption of Figure 1.
Electrodes and electrolyte
For the study at hand, non-labeled 12C carbon black (CB) electrodes are prepared from Super C65 carbon (BET surface area 68 m2/g, TIMCAL, Switzerland). The electrode slurries were prepared by adding 50 wt% of polyvinylidene fluoride binder (PVdF, Kynar HSV 900, Arkema, France) to the carbon and mixing both components with 1-methyl-2-pyrrolidinone (NMP, anhydrous, 99.5%, Sigma-Aldrich, Germany) for 5 min at 2000 rpm and 50 mbar in a planetary orbital mixer (Thinky, USA). The obtained slurry was coated onto a C480 separator (Celgard, USA) using a 250 μm gap bar coater (RK PrintCoat Instruments, UK). After drying on a hot plate at 60°C for at least 12 h, the coating was punched out to obtain electrodes with a diameter of 15 mm. All electrodes are further dried at 95°C for at least 12 h under dynamic vacuum in a glass oven (drying oven 858, Büchi, Switzerland) and then transferred for cell assembly into an argon filled glove box (O2 and H2O < 0.1 ppm, MBraun, Germany), avoiding any exposure to ambient air. The average carbon loading of the electrodes was determined to be ≈1 mgC/cm2, with an average porosity of 60%.
The electrolyte was prepared with 2 M lithium perchlorate LiClO4 (battery grade, 99.99%, trace metals basis, Sigma-Aldrich, Germany) vacuum-dried at 120°C for at least 3 days prior to mixing it with ethylene carbonate. Two types of ethylene carbonate were employed in this study: commonly used non-labeled 12C3 ethylene carbonate (anhydrous, chemical purity 99%, Sigma-Aldrich, Germany), further on referred to as "12C3 EC" and fully isotope labeled 13C3 ethylene carbonate (isotopic purity 97 atom%, chemical purity 97%, ISOTEC by Aldrich, USA) referred to as "13C3 EC". The latter was vacuum dried at room temperature for at least 3 days to remove any residual water. Upon mixing the two solid components LiClO4 and EC, a liquid solution of 2 M LiClO4 in EC is obtained due to freezing point depression.31 The as-prepared electrolyte contained < 20 ppm water as determined by Karl-Fischer titration (Titroline KF, Schott Instruments, Germany) and the amount of electrolyte added to the upper and lower compartment was 240 and 160 μl, respectively. Deionized water (18 MΩcm, Merck Millipore, Germany) was used for preparing electrolytes with 4000 ppm of H2O (mass basis), a concentration which was chosen to mimic trace water in the battery cell, as this is an amount which could easily be introduced if, e.g., the electrodes or the separators had not been dried properly or if the cells had been assembled in ambient air, rather than in a glove box or a dry room (this may be compared to the 2000 ppm H2O added in the experiments by Burns et al.29,30). LiClO4 was chosen as a salt in order to enable the addition of water without triggering any side reactions like HF formation known for fluorinated lithium salts (LiPF6, LiBF4, etc.)36 and without leading to a partial consumption of the added water before the actual start of the experiment.37,38 Note that in other studies examining the effect of water, LiTFSI28 or LiClO425,26 salt was used to avoid reaction between water and the salt; however, LiClO4 was chosen for this study, since it does not contain any carbon atoms which would interfere with the interpretation of the CO/CO2 signals.
On-line Electrochemical Mass Spectrometry
After assembly and sealing in the glove box, the cell was placed into a controlled-temperature chamber held at temperatures of 10, 25, 40 or 60°C (KB 23, Binder, Germany). A crimped capillary leak (Vacuum Technology Inc., USA) connects the two-compartment cell to the mass spectrometer system (QMA 410, Pfeiffer Vacuum, Germany), permitting a constant flow of ≈1 μl/min from the cell head space (8.5 ml) to the cross-beam ionization source of the mass spectrometer. Our OEMS system is equipped with a secondary electron multiplier (SEM), allowing the detection of masses between 1 and 128 amu; for details see our previous work.39 To avoid signal fluctuations due to minor pressure/temperature changes, all mass signal currents (IZ) were normalized to the ion current of the 36Ar isotope (referred to as IZ/I36). The cell was first held at OCV for 2 h; subsequently a linear sweep voltammetry (LSV) procedure was applied at a scan rate of 0.2 mV/s (Series G300 potentiostat, Gamry, USA) from OCV (≈2.8 - 3.2 V) to 5.5 V vs. Li/Li+. The gas evolution during this procedure was recorded by OEMS. Conversion of the mass spectrometer currents to concentrations was done for oxygen, the 12CO2 and 13CO2 carbon dioxide isotopes, the 12CO and 13CO carbon monoxide isotopes, and hydrogen using a calibration gas (Ar with 2000 ppm H2, O2, CO and CO2, Westfalen, Germany) and considering the 1.1% natural abundance of 13C.
Correcting for isotopic impurity and system specific mass fractionation, the ion current signals were processed as described in the following. The isotopic purity of the 13C-labeled EC electrolyte was determined by measuring the 12CO2/13CO2 ratio of the CO2 produced during the anodic oxidation of 13C3 EC with 2 M LiClO4 using a binder-free carbon black electrode based on 13C-labeled carbon (isotopic purity 99%, BET surface area 145 m2/g, Sigma-Aldrich, Germany). The resulting 12CO2/13CO2 ratio of 0.034 ± 0.005 corresponds to an isotopic purity of 96.6 ± 0.5%. The 12CO2 signal (m/z = 44) which represents the corrosion of carbon and/or PVdF is obtained by subtracting 3% of the current at m/z = 45 (13CO2 from oxidation of the labeled 13C3 EC electrolyte) in order to account for the 3% isotopic 12C impurity in the labeled 13C3 EC (isotopic purity 97 atom%, see discussion of Figure 11 for details): I44 (carbon+PVdF) = I44 - 0.03·I45. An analogous correction was applied to obtain the 12CO signal (m/z = 28) derived from carbon and/or PVdF in addition to subtracting 14% of the measured m/z = 44 signal to account for the CO2 fractionation in our mass spectrometer system: I28 (carbon+PVdF) = I28 - 0.03·I29 - 0.14·I44 (note that for the used electron energy of 70 eV, one would expect roughly 11% fractionation,40 while the exact value for our system determined with a 10% CO2 in Ar calibration gas was 14%). Similarly, the 13CO signal (m/z = 29) derived from electrolyte oxidation is corrected for the 14% mass fractionation of 13CO2: I29 (electrolyte) = I29 - 0.14·I45.
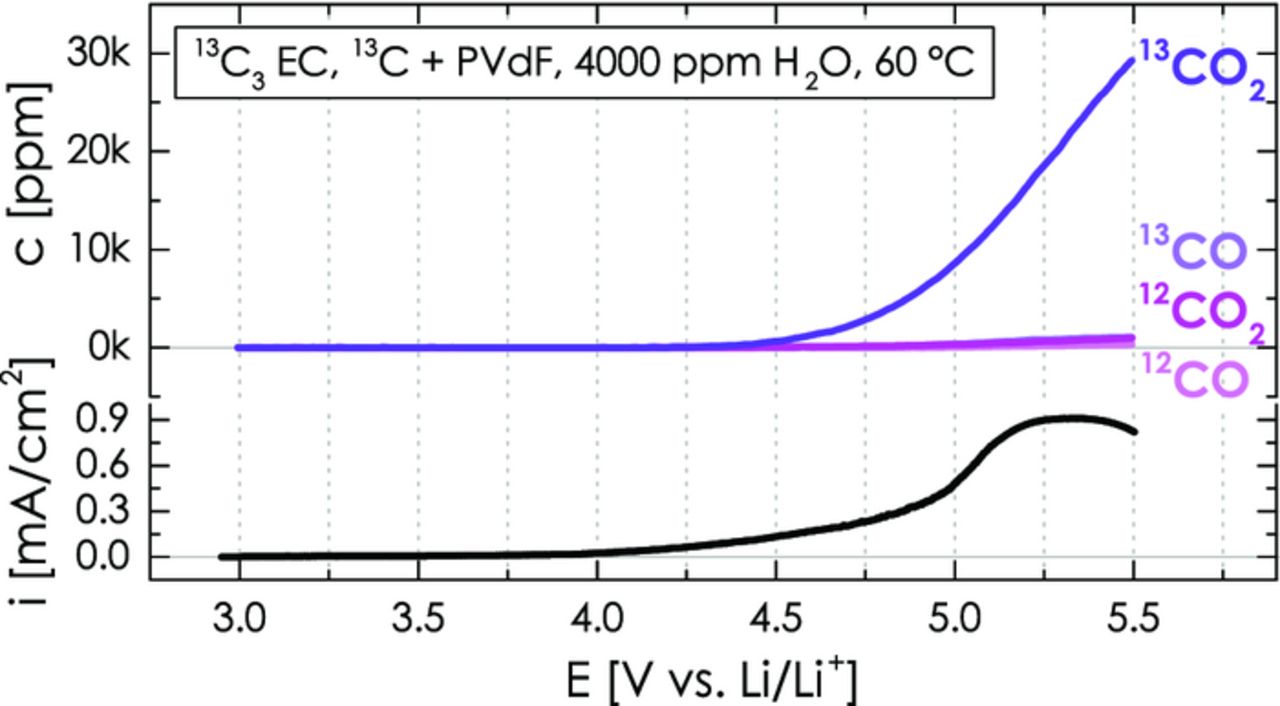
Figure 11. CO2 and CO evolution as well as overall oxidation current during the anodic oxidation of a 13C carbon/PVdF (67/33 wt/wt) working-electrode with 4000 ppm H2O-containing 2 M LiClO4 in isotopically labeled 13C3 EC (240 μl) during a LSV scan from OCV to 5.5 V vs. Li/Li+ at 0.2 mV/s. The lower-compartment with a lithium metal counter-electrode contains 160 μl dry 13C3 EC with 2 M LiClO4. The signals are not corrected for isotopic impurity of 13C3 EC to show that 12CO2 comes from 12C impurities and not from PVdF.
Results
Performance of sealed two-compartment cell
The performance of our two-compartment cell is assessed in the following by electrochemical charge/discharge tests and by its ability to truly separate anolyte and catholyte compartment. Figure 3a compares the galvanostatic charge/discharge curves at a C-rate of 0.1 h−1 of a 80/10/10 LiFePO4/CB/PVdF working-electrode (3.3 ± 0.2 mgLFP/cm2) vs. a lithium metal anode in the two-compartment cell and in a conventional Swagelok T-cell with LP30 electrolyte (1 M LiPF6 in EC:DMC 1:1 wt/wt, Merck, < 20 ppm H2O). The good agreement in specific capacity of ≈160 mAh/gLFP, which is close to the theoretical value for LiFePO4, demonstrates that the two-compartment cell functions properly.41 The only difference is that the voltage hysteresis between the charge and discharge plateaus is substantially larger in the two-compartment cell (≈380 mV, i.e., ≈190 mV in each direction) compared to a conventional one-compartment Swagelok cell (≈160 mV, i.e., ≈80 mV in each direction), indicating a higher internal resistance in the former. This potential difference is substantially larger than one would expect based on the difference in ohmic resistance: the areal resistance of the Ohara glass is ≈190 Ω·cm2 (0.8·10−4 S/cm conductivity at a thickness of 150 μm)42 vs. ≈5 Ω·cm2 in the conventional cell, yielding an iR-based voltage drop of only ≈20 mV for the applied current density of 0.12 mA/cm2 (referenced to the smaller LFP electrode area), i.e., roughly 5 times lower than the observed ≈110 mV difference. Therefore, the observed voltage hysteresis cannot be explained by a simple iR-based voltage drop and it is most likely due to an additional interfacial resistance between the Ohara glass and the liquid electrolyte, analogous, as was proposed previously for the interface between solid Li+-ion conductors and liquid electrolytes.35 This, however, should not significantly affect our slow potential scan experiments.
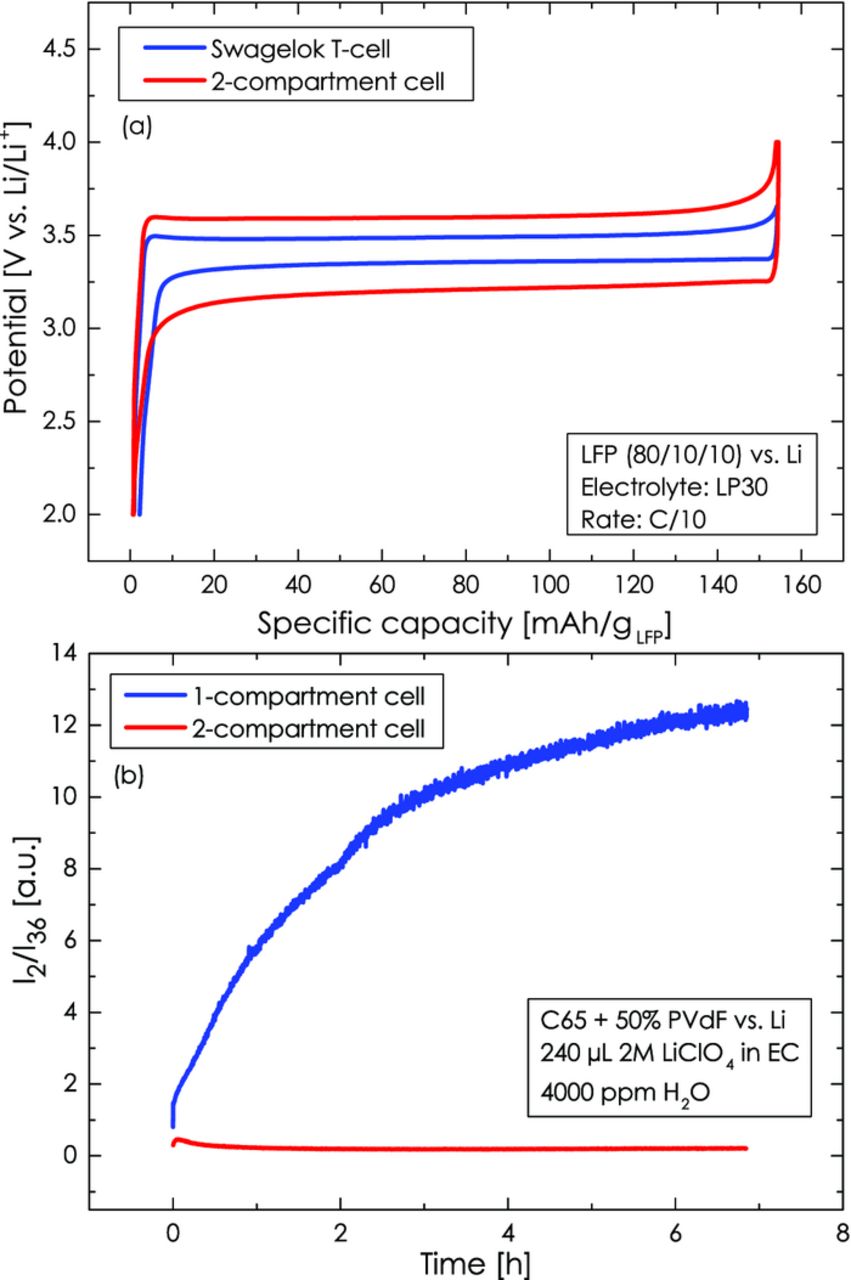
Figure 3. (a) Electrochemical performance of the sealed two-compartment cell in comparison to a Swagelok T-cell for galvanostatic C/10 charge/discharge of an LFP working-electrode against a lithium metal counter-electrode in LP30 electrolyte at room temperature. (b) Comparison of the hydrogen evolution from water-containing electrolyte on the lithium counter-electrode during a 7 h OCV phase between a one-compartment cell (blue line) and a two-compartment cell (red line). 240 μl of 2 M LiClO4 in EC electrolyte containing 4000 ppm H2O was used in the one-compartment cell and in the upper compartment of the two-compartment cell (water-free electrolyte was used in its lower compartment); the working-electrode is a Super C65 carbon electrode at its OCV.
Another test was conducted to demonstrate the good sealing between anolyte and catholyte, i.e., that liquid diffusion between the electrolyte in the upper compartment and the electrolyte in the lower compartment can be suppressed effectively by the laminated Ohara glass and the O-ring seal. This was done by deliberately adding 4000 ppm H2O to the 2 M LiClO4 EC electrolyte in the upper compartment, while using "dry" electrolyte (< 20 ppm H2O) in the lower compartment. Any diffusion of water-containing electrolyte to the lithium metal electrode in the lower compartment would lead to the instantaneous formation of hydrogen according to 2Li + 2H2O → 2LiOH + H2↑. The comparison between the I2/I36 signals for the two-compartment cell and a one-compartment cell (identical cell design, except that it has no Ohara glass between anode and cathode) reveals that over an OCV phase of 7 h almost no hydrogen is evolved in the former (red line in Figure 3b), while substantial hydrogen evolution is observed for the latter (blue line in Figure 3b). This clearly confirms that the two-compartment cell indeed provides an excellent barrier to electrolyte diffusion between anode and cathode compartments.
Electrolyte background signals
For the detection of small signals in mass spectrometry, it is critical to have a low level of background signals on the m/z channels of interest. For this study, we are particularly interested in detecting the CO2 isotopes 12CO2 and 13CO2 as well as the CO isotopes 12CO and 13CO, which have their main ion current signal on m/z = 44 and m/z = 45 as well as on m/z = 28 and m/z = 29, respectively. Unfortunately, most alkyl carbonate-based electrolyte formulations have a relatively high vapor pressure due to the ethyl methyl carbonate (EMC) or dimethyl carbonate (DMC) component (see Table I).
Table I. Boiling point and vapor pressure of commonly used alkyl carbonates.44
| Solvent | Boiling point | Vapor pressure (at 25°C) |
|---|---|---|
| Dimethyl carbonate (DMC) | 90°C | 7.5 kPa |
| Ethyl methyl carbonate (EMC) | 107°C | 3.6 kPa |
| Ethylene carbonate (EC) | 248°C | 2·10−4 kPa |
Consequently, electrolytes containing these volatile components exhibit large OEMS background signals as shown in Figure 4a and 4b for the commonly used formulations LP30 (1 M LiPF6 in EC:DMC 1:1) and LP57 (1 M LiPF6 in EC:EMC 3:7). For assessing the background signals of these electrolytes, we assembled two cells with 240 μl of the respective electrolyte contained in a glass fiber separator. Apart from that, the cell was empty and its head space was filled with Ar. Upon scanning for 3 h (2 h rest for signal equilibration not shown), a stable background from the gas phase components can be obtained. Both, LP30 and LP57 exhibit the largest background signals on m/z = 15, 29, 31 and 45. This is in agreement with the mass spectroscopic fractionation pattern of the DMC molecule (m/z [%signal]: 15 [100%], 45 [95%], 29 [75%], 31 [70%]) and the EMC molecule (m/z [%signal]: 45 [100%], 29 [80%], 31 [60%], 15 [20%]).40 That we do not get an exact agreement in the relative signal strengths is probably related to the fact that the fractionation strongly depends on the electron energy (here 70 eV) and other setup specific aspects (note that the same fractionation pattern is observed for pure EMC and pure DMC solvents). In particular the background signals at m/z = 45 and m/z = 29 would be problematic for the quantification of 13CO2 and 13CO, since small signal changes would be difficult to quantify on top of these high background signals. On the other hand, Figure 4c shows the OEMS background signals for the purely EC-based electrolyte with 2 M LiClO4. By avoiding the volatile components DMC and EMC, the background signals from the electrolyte could be lowered by a factor of ≈100 (note the 100-fold magnified y-axis scale in Figure 4c), thus rendering this type of electrolyte particularly suitable for mass spectrometry. There is effectively no background on the channels for 12CO2, 13CO2, and 13CO and only a small background on the channel for 12CO, which was the reason to employ this electrolyte formulation for the subsequent experiments.
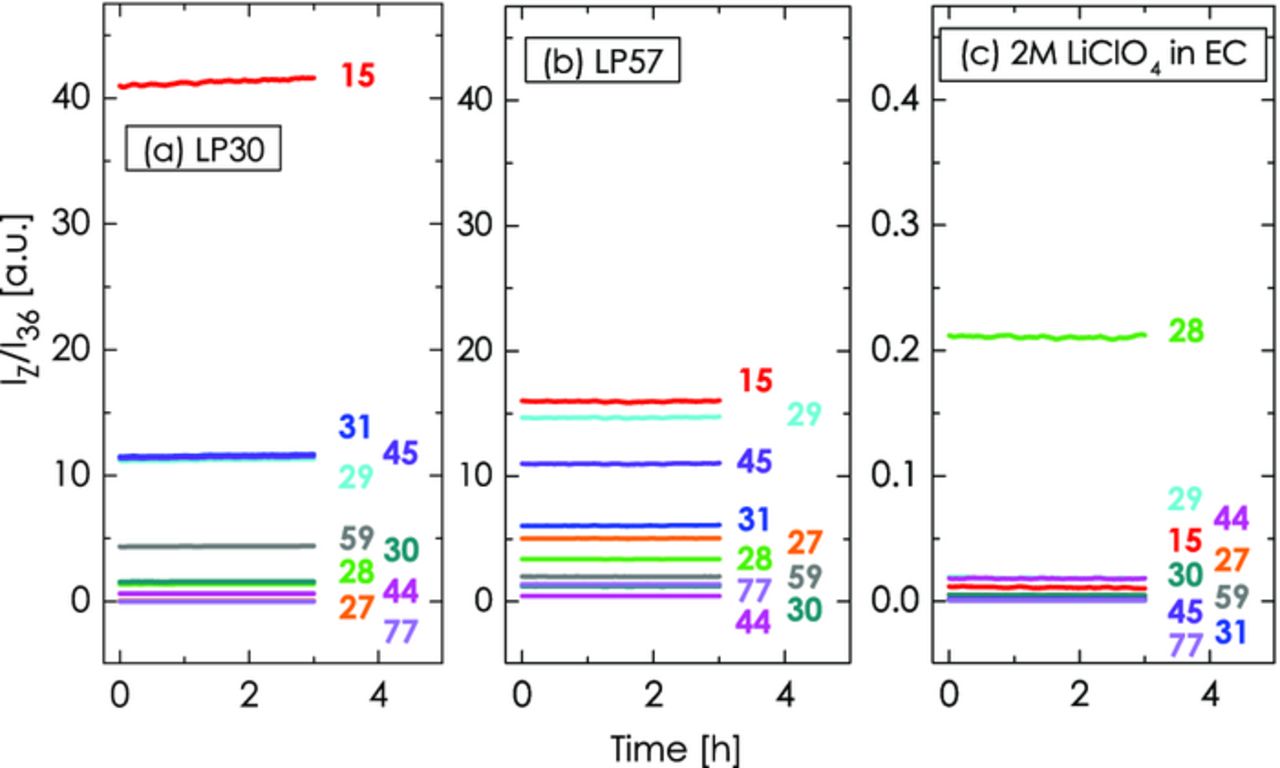
Figure 4. Background signals for OEMS cell filled with 240 μl of (a) LP30 = 1 M LiPF6 in EC:DMC 1:1, (b) LP57 = 1 M LiPF6 in EC:EMC 3:7, and (c) 2 M LiClO4 in EC.
H2O-driven hydrolysis of ethylene carbonate
Since the corrosion stability of conductive carbon and ethylene carbonate shall be studied in the presence of water, it is essential to first determine any background signals from a possible chemical reaction between EC and H2O. According to Yang et al., ethylene carbonate undergoes a potential-independent H2O-driven hydrolysis reaction to form ethylene glycol and CO2:45
![Equation ([1])](https://content.cld.iop.org/journals/1945-7111/162/7/A1123/revision1/A1123equ1.jpeg)
Figure 5 shows the potential-independent CO2 evolution from the reaction of EC with H2O as a function of temperature, which was measured by pipetting 240 μl of 1.5 M LiClO4 in EC containing 4000 ppm H2O into an empty OEMS cell and holding the temperature at 10, 25, 40 and 60°C for 4 h each. The plot shows that essentially no H2O-driven hydrolysis is observed at room temperature or below. At 40°C, a slow but steady increase of the CO2 signal is observed, which increases substantially at 60°C, leading to a CO2 concentration of ≈700 ppm in the cell. Consistent with the mechanism proposed by Yang et al.,45 no gases other than CO2 are evolved and, in the absence of H2O, no CO2 evolution is observed.

Figure 5. CO2 evolution from H2O-driven hydrolysis of EC at various temperatures between 10 and 60°C measured in the OEMS cell containing only 240 μl of 1.5 M LiClO4 in EC with 4000 ppm H2O.
The reaction rates for the different temperatures are calculated using the slope of the CO2 mass trace and the cell volume of the standard one-compartment OEMS cell (9.5 ml). This results in H2O-driven hydrolysis rates of 0.5·10−12 mol/s and 10.9·10−12 mol/s at 40 and 60°C, respectively. While the rates at 10 and 25°C were unfortunately too low to be quantified, one can still estimate an activation energy of ≈133 kJ/mol from the data at 40 and 60°C, which seems reasonable for the ring-opening reaction. Referenced to the mass of EC, the H2O-driven hydrolysis rates at 40 and 60°C in the presence of 4000 ppm H2O would be roughly 2.1·10−12 mol/(s·gEC) and 45·10−12 mol/(s·gEC). Assuming second order reaction kinetics and an Arrhenius-type behavior, the H2O-driven EC hydrolysis rate could be roughly estimated for any given water content (x ppmH2O) by:
![Equation ([2])](https://content.cld.iop.org/journals/1945-7111/162/7/A1123/revision1/jes_162_7_A1123eqn1.jpg)
where T is the temperature in Kelvin. While measuring the kinetics of this reaction has not been the focus of the present work, Equation 1 might be useful to understand electrolyte degradation at high temperature and potential, as water was shown to be produced at potentials above 4.6 to 4.9 V.34,46,47 For the following anodic oxidation experiments, any CO2 evolution from the potential-independent hydrolysis of EC will be subtracted as constant background.
Analysis of CO2 evolution data
Having determined the rate of H2O-driven potential-independent EC hydrolysis, which is only noticeable at ≥ 40°C, we will now turn to examine the anodic oxidation of conductive carbon, PVdF, and ethylene carbonate, using the sealed two-compartment cell in a configuration with dry electrolyte (< 20 ppm H2O) in the lower compartment (counter-electrode compartment) and either dry electrolyte or electrolyte with 4000 ppm H2O in the upper compartment (working-electrode compartment). As for all of the following experiments, a Super C65 carbon PVdF-bonded working-electrode and a lithium metal counter-electrode were employed.
Starting out with a configuration where no isotopically labeled ethylene carbonate is used (i.e., 12C3 EC only), Figure 6a depicts the evolution of the 12CO2 (m/z = 44) and the 13CO2 (m/z = 45) isotope upon an initial 2 h OCV phase and a subsequent LSV scan from OCV to 5.5 V vs. Li/Li+ for cells with and without water. As expected, no 13CO2 signal is observed in either case (light and dark purple lines in Figure 6a). In the absence of water, no 12CO2 is evolved until about 4.7 h (i.e., until ≈5 V), at which point 12CO2 evolution becomes discernible and its concentration is continuously increasing (light magenta line in Figure 6a). When a 4000 ppm water-containing electrolyte is used in the upper compartment (dark magenta line in Figure 6a), there is an unexpected strong evolution of the 12CO2 isotope already during the OCV period. This constant 12CO2 evolution rate (indicated by its constant slope) is at first potential-independent and then increases at about the same time when the 12CO2 evolution was observed in the absence of water. Having seen that the H2O-driven hydrolysis of EC only yields negligible amounts of CO2 at 25°C (see Figure 5), this potential-independent 12CO2 evolution has to be of different origin. It should be noted, that the only gas evolved in the initial ≈4.7 h is 12CO2 and H2 (not shown, but discussed in the next section).
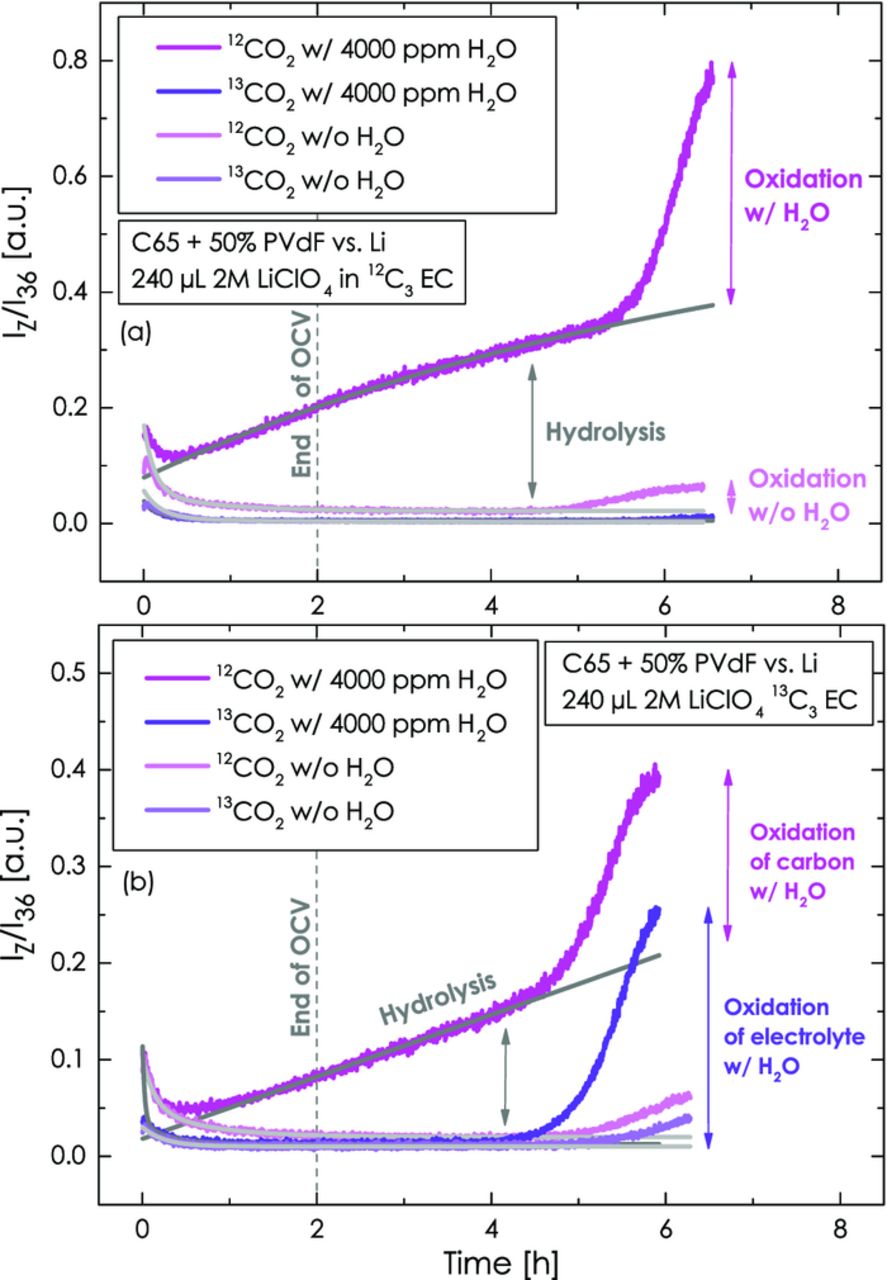
Figure 6. CO2 evolution during the initial 2 h OCV period and the subsequent potential scan from OCV (≈2.8 - 3.2 V) to 5.5 V at 0.2 mV/s: (a) 12C3 EC with 2 M LiClO4 either dry or with 4000 ppm H2O in the upper compartment (working-electrode); (b) 13C3 EC with 2 M LiClO4 either dry or with 4000 ppm H2O in the upper compartment (working-electrode). The lower compartment (counter-electrode) always contains dry 12C3 EC with 2 M LiClO4. The working-electrode consists of Super C65/PVdF (50/50 wt/wt) with 240 μl electrolyte and the counter-electrode is metallic lithium with 160 μl electrolyte.
In order to elucidate the origin of the unexpected constant CO2 evolution rate during OCV and during the initial part of the potential scan, we have repeated the experiment, this time using labeled 13C3 EC-based electrolyte in the upper compartment and non-labeled 12C3 EC-based electrolyte in the lower compartment. In this case, we expect the evolution of 12CO2 from the anodic oxidation of carbon and PVdF and 13CO2 from the anodic oxidation of the electrolyte. In the absence of water, Figure 6b shows the onset of 12CO2 and 13CO2 evolution at again ≈4.7 h (light magenta and purple line, respectively), while no gases are evolved during OCV and the initial part of the voltage scan, as one would expect. The same holds true for the 13CO2 signal in the presence of 4000 ppm water in the working-electrode compartment (dark purple line in Figure 6b), except that the onset of 13CO2 evolution is somewhat earlier than in dry electrolyte and that a much stronger 13CO2 evolution is observed, clearly indicating that the anodic oxidation of electrolyte is enhanced by the presence of water. What is surprising again is the potential-independent increase of the 12CO2 signal when water is present in the working-electrode compartment, starting already at OCV and continuing throughout the initial part of the potential scan (dark magenta line in Figure 6b). Only later on in the scan, at ≈4.3 h (≈4.7 V), the 12CO2 evolution rate accelerates, which could be consistent with the onset of the anodic oxidation of carbon and/or PVdF. However, since it is without question that carbon and PVdF (only 12C components in the upper working-electrode compartment) are stable at the OCV potential (≈2.8 - 3.2 V), the initial potential-independent 12CO2 evolution rate must have a different cause.
At this point, the only feasible explanation is that this 12CO2 signal comes from the counter-electrode compartment. While we have shown in Figure 3a that the Ohara glass seal clearly prevents the diffusion of liquid electrolyte and water between the working- and the counter-electrode compartment, the polypropylene edge-seal area nevertheless has a non-negligible permeability for water vapor, H2, and CO2,48 which must be considered. It was shown recently, that water can get electrochemically reduced at potentials below 2 V,28 so that water vapor diffusing to the lithium counter-electrode compartment will get reduced to H2 and OH−:
![Equation ([3])](https://content.cld.iop.org/journals/1945-7111/162/7/A1123/revision1/A1123equ2.jpeg)
Hydroxide formed at the counter-electrode is a much stronger nucleophile than water, so that the nucleophilic decomposition of ethylene carbonate by OH− should clearly be a much faster reaction than the reaction with H2O:
![Equation ([4])](https://content.cld.iop.org/journals/1945-7111/162/7/A1123/revision1/A1123equ3.jpeg)
Further evidence for this unintended side reaction is the fact that we observe a H2 concentration at ≈4.3 V (at the end of the potential-independent 12CO2 evolution rate) which is exactly half of that of the CO2 concentration, as would be predicted by reactions 3 and 4. The reason why the H2 formation from the water vapor permeating through the polypropylene edge-seal was not evident in Figure 3b (red line), is the difference in scale (note that the y-axis scale in Figure 6b is ≈25-fold enlarged compared to Figure 3b). The OH−-driven decomposition of ethylene carbonate (reaction 4) has also been observed previously.28,49
If the above hypothesis were correct, the 12CO2 evolution rate during the OCV period and during the initial part of the voltage scan would have to be the same (or smaller) than the water permeation rate through the polypropylene edge-seal. The latter can be calculated from the polypropylene water vapor permeability of 2.5·10−12 cm3STP·cm/(s·cm2·Pa) at 25°C,28,50 considering the edge-seal area (2.0 cm2) and thickness (8·10−3 cm). What is also required is the water vapor pressure, pH2O, above the electrolyte containing 4000 ppm water (corresponding to a water mole fraction of xH2O ≈ 0.02), which for an ideal solution could be estimated by Raoult's Law:
![Equation ([5])](https://content.cld.iop.org/journals/1945-7111/162/7/A1123/revision1/jes_162_7_A1123eqn2.jpg)
With these values, the water permeation rate would amount to 1.6·10−12 mol/s, which is about one order of magnitude lower than the CO2 evolution rate of 14·10−12 mol/s obtained from Figure 6b. This apparent discrepancy, however, is most likely due to the inaccuracy of Raoult's Law for low xH2O in EC, assuming that the H2O/EC binary system behaves similar to the H2O/PC (propylene carbonate) binary system. For the latter, pH2O at xH2O < 0.04 is roughly one order of magnitude larger than what would be predicted based on Raoult's Law,51 which suggests that the actual water permeation rate is indeed consistent with the CO2 evolution rate.
Since the permeability increases with temperature with an apparent activation energy of ≈40 kJ/mol,50 and since the water vapor pressure increases with temperature, the water permeation rate through the edge-seal will also increase with temperature. Therefore, based on the above mechanism, the 12CO2 evolution rate during OCV and in the initial part of the voltage-scan should also increase with temperature. As shown in Figure 7, this is the case, and the initial 12CO2 evolution rate increases with an apparent activation energy of ≈44 kJ/mol. This is a rather low activation energy for a chemical reaction and indeed confirms that the reaction is likely limited by water vapor diffusion.
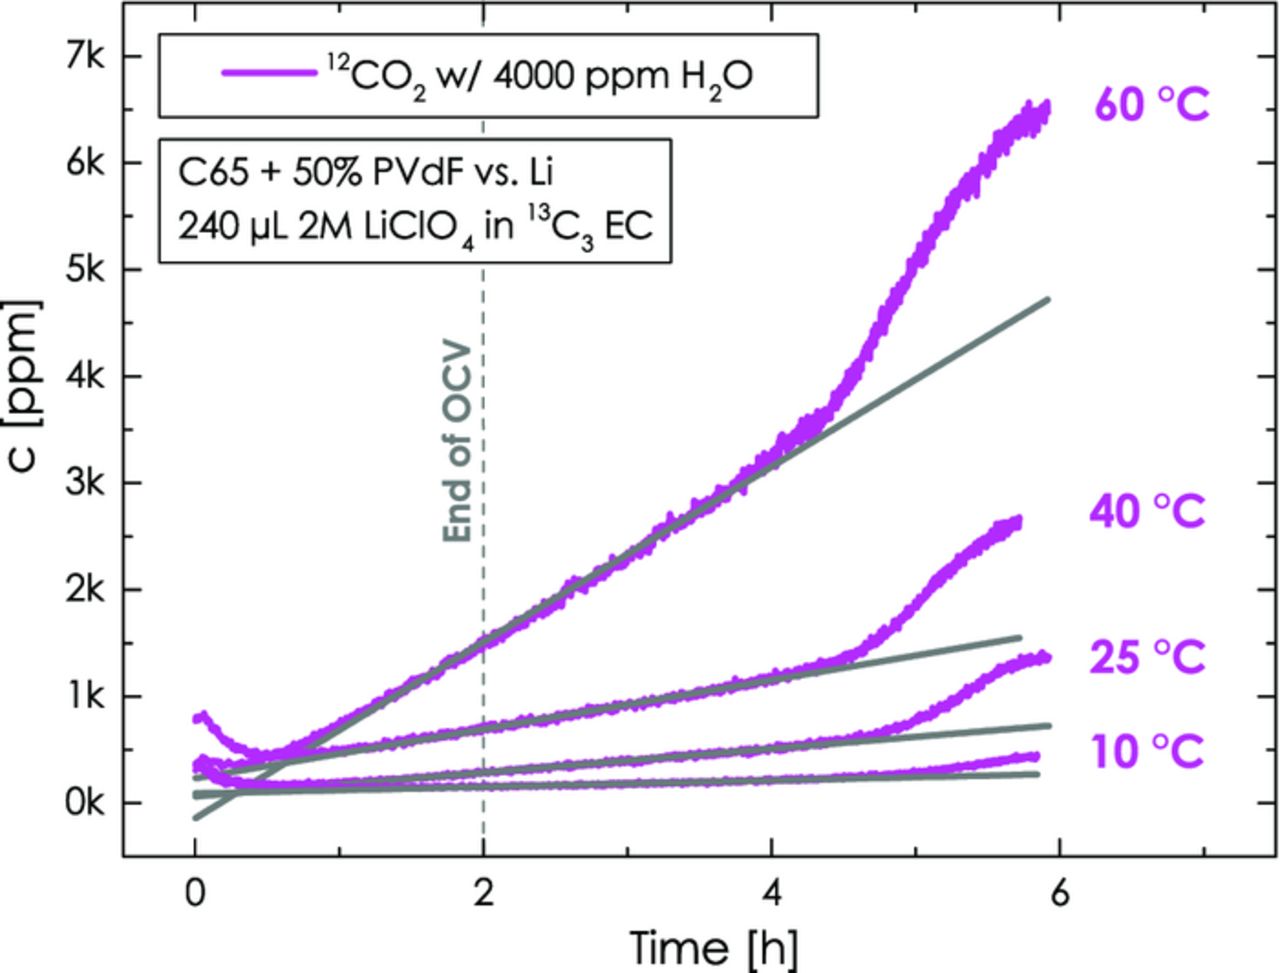
Figure 7. 12CO2 evolution at different temperatures during the initial 2 h OCV period and the subsequent potential scan from OCV (≈2.8 - 3.2 V) to 5.5 V at 0.2 mV/s: 13C3 EC with 2 M LiClO4 with 4000 ppm H2O in the upper compartment (working-electrode) and dry 12C3 EC with 2 M LiClO4 in the lower compartment (counter-electrode). The working-electrode consists of Super C65/PVdF (50/50 wt/wt) with 240 μl electrolyte and the counter-electrode is metallic lithium with 160 μl electrolyte.
In summary, the evolution of 12CO2 is an experimental artifact derived from the gas permeability of the polypropylene edge-seal. We are currently investigating gas impermeable edge-sealing concepts, but have not yet found a suitable solution. Nevertheless, owing to the perfectly constant 12CO2 evolution rate (i.e., the 12CO2 signal from this process following a straight line as indicated by the gray lines in Figure 7), it can be subtracted with high precision from the overall signal, yielding the potential-dependent 12CO2 evolution due to carbon and/or PVdF oxidation.
Correction of the background derived from ethylene carbonate hydrolysis
In order to quantify the potential-dependent anodic oxidation of carbon, PVdF, and ethylene carbonate as a function of temperature and water content, the above discussed potential-independent signals from the H2O-driven (see Figure 5 and reaction 1) and OH−-driven (see Figure 7 and reactions 3 and 4) hydrolysis of ethylene carbonate must be subtracted. This is illustrated in Figure 8 for non-labeled electrolyte (i.e., 12C3 EC in both compartments), where the CO2 signal derived from the potential-independent EC hydrolysis reaction (see gray baselines in Figure 6 and 7) was subtracted from the overall CO2 signal (note that 14% of this signal were also subtracted from the CO signal, as explained in the Experimental Section). The resulting potential-dependent concentrations of CO, CO2, and O2 as well as the corresponding oxidation current in 12C3 EC with 2 M LiClO4 are shown vs. the applied potential in the absence of added water (Figure 8a) and with 4000 ppm H2O (Figure 8b).
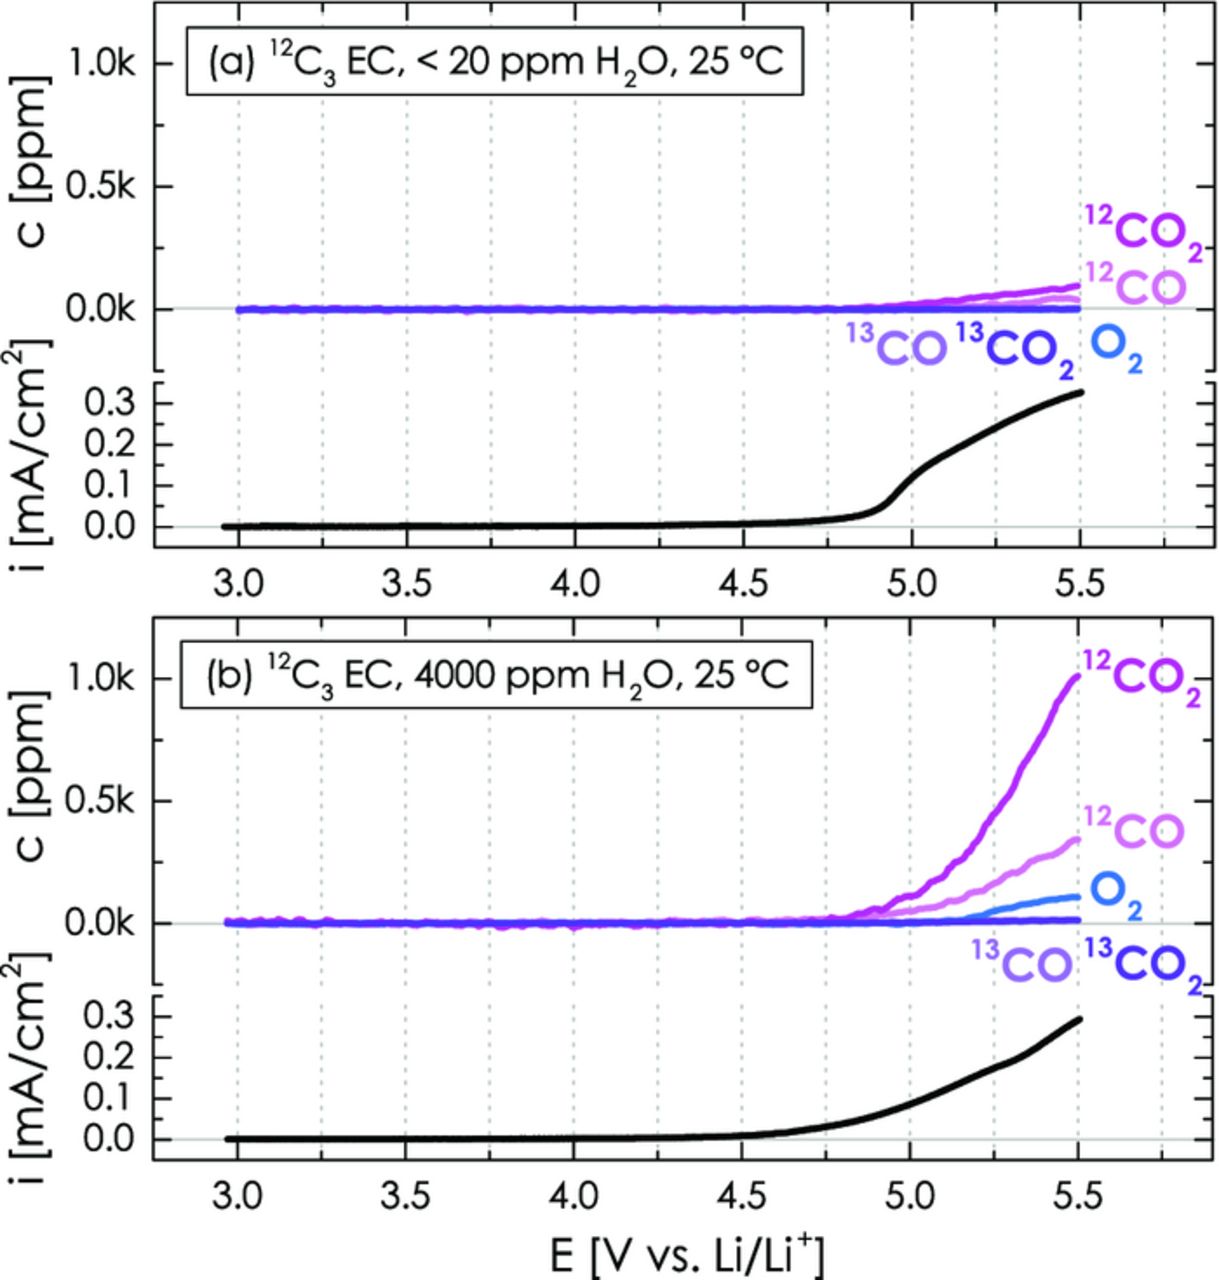
Figure 8. Potential-dependent CO2, CO, and O2 evolution as well as overall oxidation current during the anodic oxidation of a Super C65/PVdF (50/50 wt/wt) working-electrode with dry (a) and 4000 ppm H2O-containing (b) 2 M LiClO4 in 12C3 EC (240 μl). LSV scan from OCV to 5.5 V vs. Li/Li+ at 0.2 mV/s. The lower-compartment with a lithium metal counter-electrode contains 160 μl dry 12C3 EC with 2 M LiClO4.
For the dry electrolyte, 12CO (m/z = 28) and 12CO2 (m/z = 44) evolution is observed for potentials > 4.8 V during the potential scan from OCV to 5.5 V vs. Li/Li+ at 0.2 mV/s (see Figure 8a). Since none of the working-electrode constituents are isotopically labeled in this experiment, the mass traces of the 13CO (m/z = 29) and 13CO2 (m/z = 45) isotopes stay flat for the entire potential scan and, furthermore, one cannot differentiate between carbon, PVdF, and electrolyte corrosion. At the end of the potential scan, the concentrations of 12CO2 and 12CO in the battery head space amount to ≈95 ppm and ≈40 ppm, respectively. In the presence of 4000 ppm H2O, both 12CO2 and 12CO evolution are enhanced by a factor of ≈10, yielding ≈1010 ppm and ≈345 ppm, respectively (see Figure 8b). This finding suggests that the anodic oxidation of carbon, PVdF, and/or electrolyte are substantially enhanced in the presence of water. This is also indicated by the fact that the onset of the corrosion current and of the 12CO/12CO2 evolution is shifted negatively by ≈100 mV to ≈4.7 V. In the presence of 4000 ppm H2O, the onset of oxygen evolution is observed at ≈5.3 V vs. Li/Li+, which is produced by the anodic oxidation of water on the carbon surface (2H2O → O2↑ + 4H+ + 4e−).
Anodic oxidation of carbon/PVdF vs. electrolyte in the absence of H2O
In order to distinguish between the anodic oxidation of carbon/PVdF and the electrolyte, the following experiments are now conducted with dry 13C-labeled EC electrolyte (13C3 EC) in the working-electrode compartment. Figure 9 shows the evolution of CO and CO2 as a function of the applied linear potential sweep from OCV to 5.5 V vs. Li/Li+ at different temperatures, ranging from 10 to 60°C. At 10°C, the anodic oxidation rates are so slow that hardly any gases are released when the potential of the carbon electrode is ramped up to 5.5 V. At 25°C, however, both CO2 isotopes are clearly detected, with the formation of 12CO2 marking the anodic oxidation of carbon/PVdF and with the formation of 13CO2 marking the anodic oxidation of ethylene carbonate. Consequently, both carbon/PVdF and ethylene carbonate are anodically oxidized to CO2 at 25°C once the potential reaches roughly 4.8 V vs. Li/Li+, even in the absence of added water. With increasing temperature, the onset potential for CO2 evolution moves negatively (≈4.6 V at 60°C), and the CO2 concentration increases dramatically, indicating strongly temperature activated processes. In addition to CO2, we also observe the formation of CO from the anodic oxidation of both the carbon/PVdF (12CO) and the electrolyte (13CO), whereby the CO concentration is always minor compared to that of CO2. The gas concentrations produced once the positive potential limit of 5.5 V is reached are shown in Table II.
Table II. Concentration of CO2 and CO derived from the anodic oxidation of carbon/PVdF (12CO2, 12CO) and electrolyte (13CO2, 13CO) after the LSV scan to 5.5 V vs. Li/Li+ using dry and 4000 ppm H2O-containing electrolyte based on 2 M LiClO4 in isotopically labeled 13C3 EC (data from Figures 9 and 10).
| From carbon/PVdF anodic oxidation | From electrolyte anodic oxidation | |||||
|---|---|---|---|---|---|---|
| H2O content / temperature | 12CO2 [ppm] | 12CO [ppm] | 12CO + 12CO2 [ppm] | 13CO2 [ppm] | 13CO [ppm] | 13CO + 13CO2 [ppm] |
| <20 ppm H2O/10°C | 30 | <10 | <40 | <10 | <10 | <20 |
| <20 ppm H2O/25°C | 100 | <10 | <110 | 60 | <10 | <70 |
| <20 ppm H2O/40°C | 235 | 95 | 330 | 335 | 20 | 355 |
| <20 ppm H2O/60°C | 810 | 310 | 1120 | 2930 | 435 | 3365 |
| 4000 ppm H2O/10°C | 90 | 20 | 110 | 45 | <10 | 45 |
| 4000 ppm H2O/25°C | 450 | 245 | 695 | 590 | 50 | 640 |
| 4000 ppm H2O/40°C | 930 | 370 | 1300 | 1690 | 130 | 1820 |
| 4000 ppm H2O/60°C | 1540 | 460 | 2000 | 12980 | 230 | 13210 |
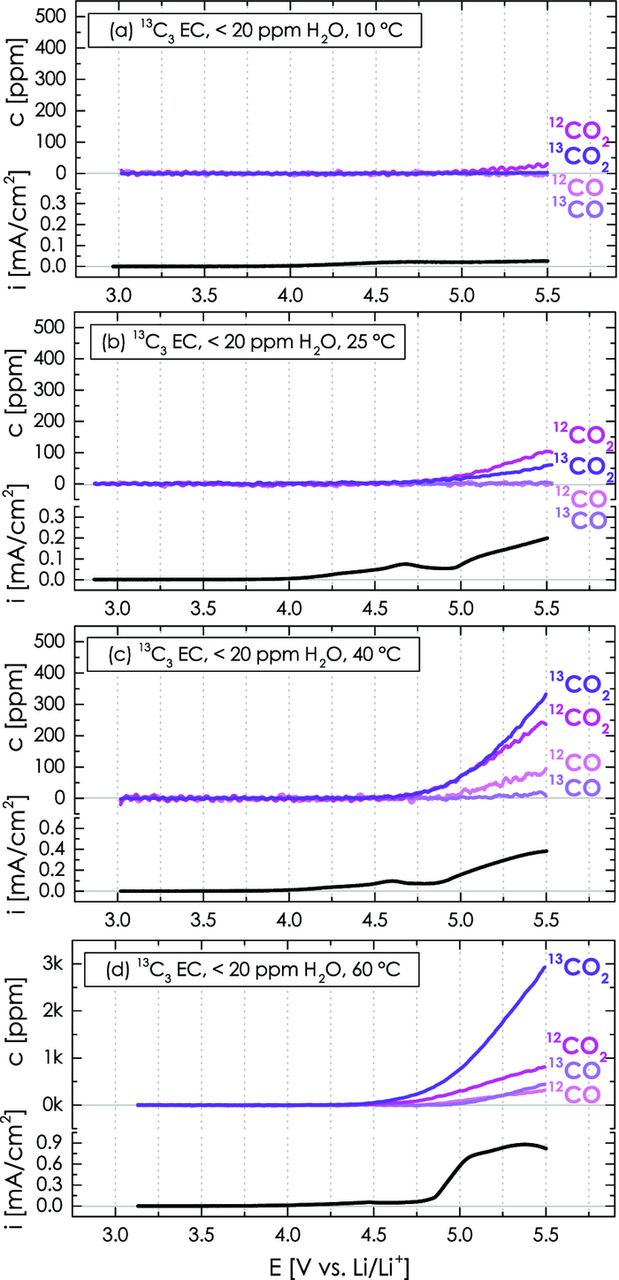
Figure 9. Temperature effect on the CO2 and CO evolution as well as on the overall oxidation current during the anodic oxidation of a Super C65/PVdF (50/50 wt/wt) working-electrode with dry 2 M LiClO4 in isotopically labeled 13C3 EC (240 μl) during a LSV scan from OCV to 5.5 V vs. Li/Li+ at 0.2 mV/s. The lower-compartment with a lithium metal counter-electrode contains 160 μl dry non-labeled 12C3 EC with 2 M LiClO4.
Comparing the evolution of 12CO2/12CO from carbon/PVdF with that of 13CO2/13CO from the electrolyte (see Figure 9 and Table II), it is apparent that the initially higher anodic oxidation rate of carbon/PVdF increases less strongly with temperature compared to that of the electrolyte, so that at 40°C and above, electrolyte oxidation is the major contributor to the overall CO2/CO formation. This is qualitatively consistent with the study by Onuki et al.21 who showed that roughly two thirds of the CO2 and CO produced during 85°C storage of a charged cell (LiNixCoyAll-x-yO2/graphite charged to 4.2 V using 13C-labeled EC/DEC electrolyte) derived from the anodic oxidation of electrolyte vs. roughly one third from non-electrolyte components.
Anodic oxidation of carbon/PVdF vs. electrolyte in the presence of 4000 ppm H2O
In Figure 10, the same set of temperatures was tested with 4000 ppm H2O in the upper compartment, containing 13C-labeled EC with 2 M LiClO4. In contrast to the 10°C data in dry EC (Figure 9a), significant gas evolution is observed at this temperature in the presence of 4000 ppm H2O (see Figure 10a). At all temperatures, the 12CO2/12CO formation from the anodic oxidation of carbon/PVdF and the 13CO2/13CO formation from the anodic oxidation of electrolyte are substantially enhanced in the presence of 4000 ppm H2O (see Table II). As in the case of the dry electrolyte (Figure 9), the increase of CO2/CO formation with temperature is less pronounced for the carbon/PVdF (12CO2, 12CO) compared to the ethylene carbonate (13CO2, 13CO), with the latter exceeding that of the former at 40°C and above. This will also be apparent when comparing the anodic oxidation rates at 5.0 V in the Discussion Section, after we have determined the contribution of PVdF binder to the 12CO2/12CO gas evolution.
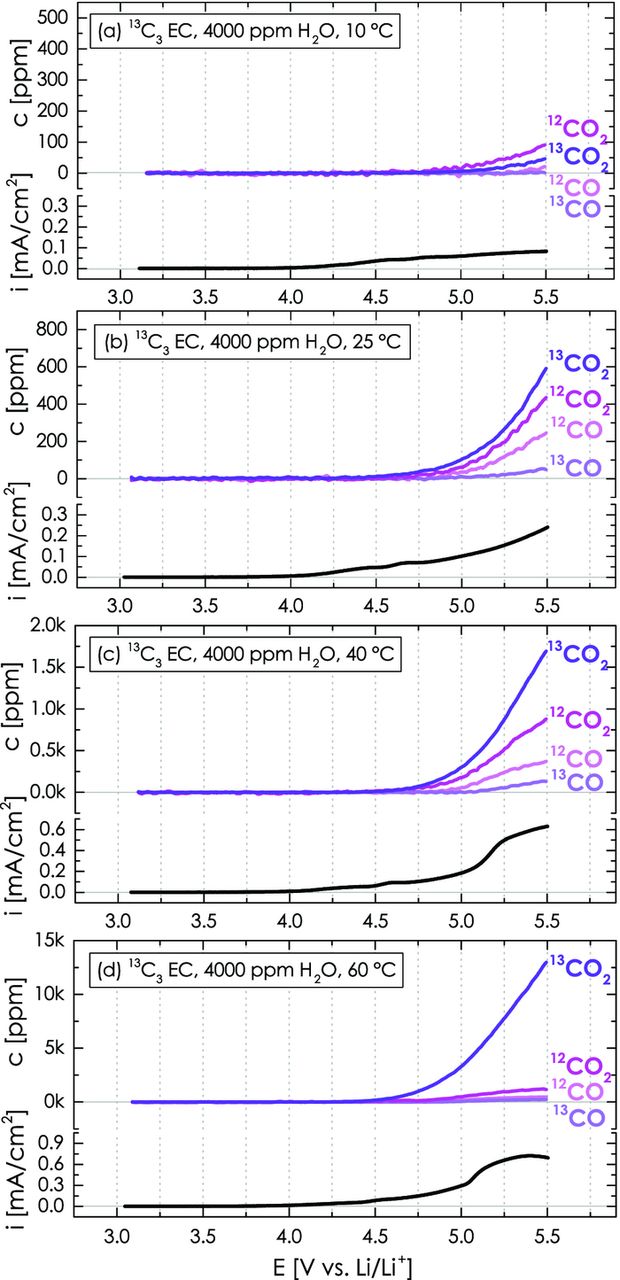
Figure 10. Temperature and water effect on the CO2 and CO evolution as well as on the overall oxidation current during the anodic oxidation of a Super C65/PVdF (50/50 wt/wt) working-electrode with 4000 ppm H2O-containing 2 M LiClO4 in isotopically labeled 13C3 EC (240 μl) during a LSV scan from OCV to 5.5 V vs. Li/Li+ at 0.2 mV/s. The lower-compartment with a lithium metal counter-electrode contains 160 μl dry non-labeled 12C3 EC with 2 M LiClO4.
As a consistency check, the gas formation at 25°C with 4000 ppm H2O in the 13C-labeled EC (Figure 10b) may also be compared with those under identical conditions in the 12C-labeled EC (Figure 8b), whereby the amount of 12CO2 + 13CO2 at the end of the scan of the former (1040 ppm, see Figure 10b and Table II) should be the same as that of 12CO2 at the end of the scan of the latter (1010 ppm, see Figure 8b). Reasonably good consistency is observed for the CO concentration at the end of the scan (i.e., c(12CO + 13CO) = 295 ppm in Figure 10b vs. c(12CO) = 345 ppm in Figure 8b).
Contribution of PVdF to 12CO2 signal
Up to this point, we had only been able to distinguish between the anodic oxidation of carbon/PVdF and ethylene carbonate based on the evolution of 12CO2/12CO vs. 13CO2/13CO, respectively. In order to investigate the contribution of PVdF corrosion to the 12CO2 and 12CO signals, the Super C65 carbon working-electrode was replaced by an electrode composed of fully 13C-labeled carbon (isotopic purity 99 atom%, BET surface area 145 m2/g) bonded with PVdF (33 wt% PVdF) at a comparable loading of ≈1 mgC/cm2. By using 13C3 EC with 2 M LiClO4 as electrolyte, PVdF is now the only source of 12C in the working-electrode compartment, apart from the 12C impurities in the 13C3 EC (isotopic purity of 96.6 ± 0.5%; see Experimental).
Figure 11 shows the evolution of the 12CO2/12CO and 13CO2/13CO isotopes for a potential scan of such a PVdF-bonded 13C carbon electrode (against a metallic lithium counter-electrode) from OCV to 5.5 V vs. Li/Li+ under the most extreme conditions of 60°C and 4000 ppm H2O in the electrolyte. As expected at these conditions (compare to Figure 10d), a strong evolution of the 13CO2 signal is observed in Figure 11, originating from the anodic oxidation of the electrolyte and of the 13C carbon in the electrode. On the other hand, the 12CO2 signal amounts to only ≈3.2% of the 13CO2 signal (i.e., c(12CO2)/c(13CO2) = 945 ppm/29280 ppm ≈ 3.2%) and could either stem from the oxidation of PVdF to CO2 and/or the anodic oxidation of the 12C impurities in the 13C3 EC-based electrolyte to CO2. The fact that this number reflects the 12CO2/13CO2 ratio of 3.4 ± 0.5% obtained with a binder-free 13C carbon pellet (corresponding to an isotopic purity of the 13C3 EC of 96.6 ± 0.5%, see Experimental Section) suggests that the 12CO2 signal in Figure 11 is essentially completely accounted for by the 12C impurities in the 13C3 EC. The evolution of 13CO and 12CO is negligible compared to the strong 13CO2 evolution at these conditions (compare to Figure 10d). Therefore, we can conclude that the 12CO2/12CO signals observed in Figures 9 and 10 do not derive from the anodic oxidation of PVdF and can be exclusively attributed to the anodic oxidation of the Super C65 carbon. This is consistent with the high anodic stability of PVdF reported previously.14
Interestingly, the concentration of 13CO2 in the cell head space after the LSV scan to 5.5 V is ≈2.3 times higher than for the same experiment with Super C65 carbon (viz., 29280 ppm in Figure 11 vs. 12980 ppm in Figure 10d). This ratio corresponds to the BET surface area ratio of the 13C-labeld carbon and that of Super C65 (145 m2/g for 13C carbon vs. 68 m2/g for Super C65), suggesting that the anodic carbon oxidation current is directly proportional to its BET surface area, as one would expect if both carbons have a similar degree of graphitization. The latter was indicated by Raman spectroscopy measurements, which showed similar D/G band ratios for both carbons (data not shown).
Discussion
Corrosion rates of carbon and electrolyte at 5.0 V
In order to put the obtained values for the gas evolution from the anodic oxidation of carbon and electrolyte into perspective with the anodic decomposition of conductive carbon and electrolyte in actual Li-ion batteries, the local slopes of the 12CO/12CO2 and 13CO/13CO2 concentrations vs. potential were determined at E = 5.0 V vs. Li/Li+. The potential of 5.0 V was chosen, since the anodic stability of battery components at this potential is relevant for the new class of 5 V cathode materials.3–6 The slope of the CO2 and CO concentration vs. potential for each isotope at 5.0 V was estimated by a linear regression fit between 4.975 V and 5.025 V from Figures 9 and 10, yielding the anodic oxidation rates (in units of [ppm/s]) of carbon and electrolyte into CO and CO2. These were then converted into molar evolution rates (in [mol/s]) using the volume of the employed cell (8.5 ml). In order to quantify the overall molar anodic oxidation rates of carbon and ethylene carbonate, the molar evolution rates of CO2 and CO were added for each isotope, yielding rC (in units of [molC/s]) from 12CO + 12CO2, and rEC (in units of [molEC/s]) from 13CO + 13CO2. Finally, since the carbon oxidation rate is proportional to the carbon mass (for the same type of carbon) and since the decomposition of electrolyte on the carbon surface is a heterogeneously catalyzed process that scales with the available electrochemically active surface area, all rates were normalized by the carbon loading of the electrodes (≈1 mgC/cm2). The resulting anodic oxidation rates of carbon (in units of [molC/(s·gC)]) and of ethylene carbonate (in units of [molEC/(s·gC)]) are summarized vs. temperature and water content in Figure 12 as an Arrhenius-type plot. As will be shown later, these normalized rates allow for an estimate of the stability of Super C65 conductive carbon and ethylene carbonate in high-voltage cathodes of Li-ion batteries.
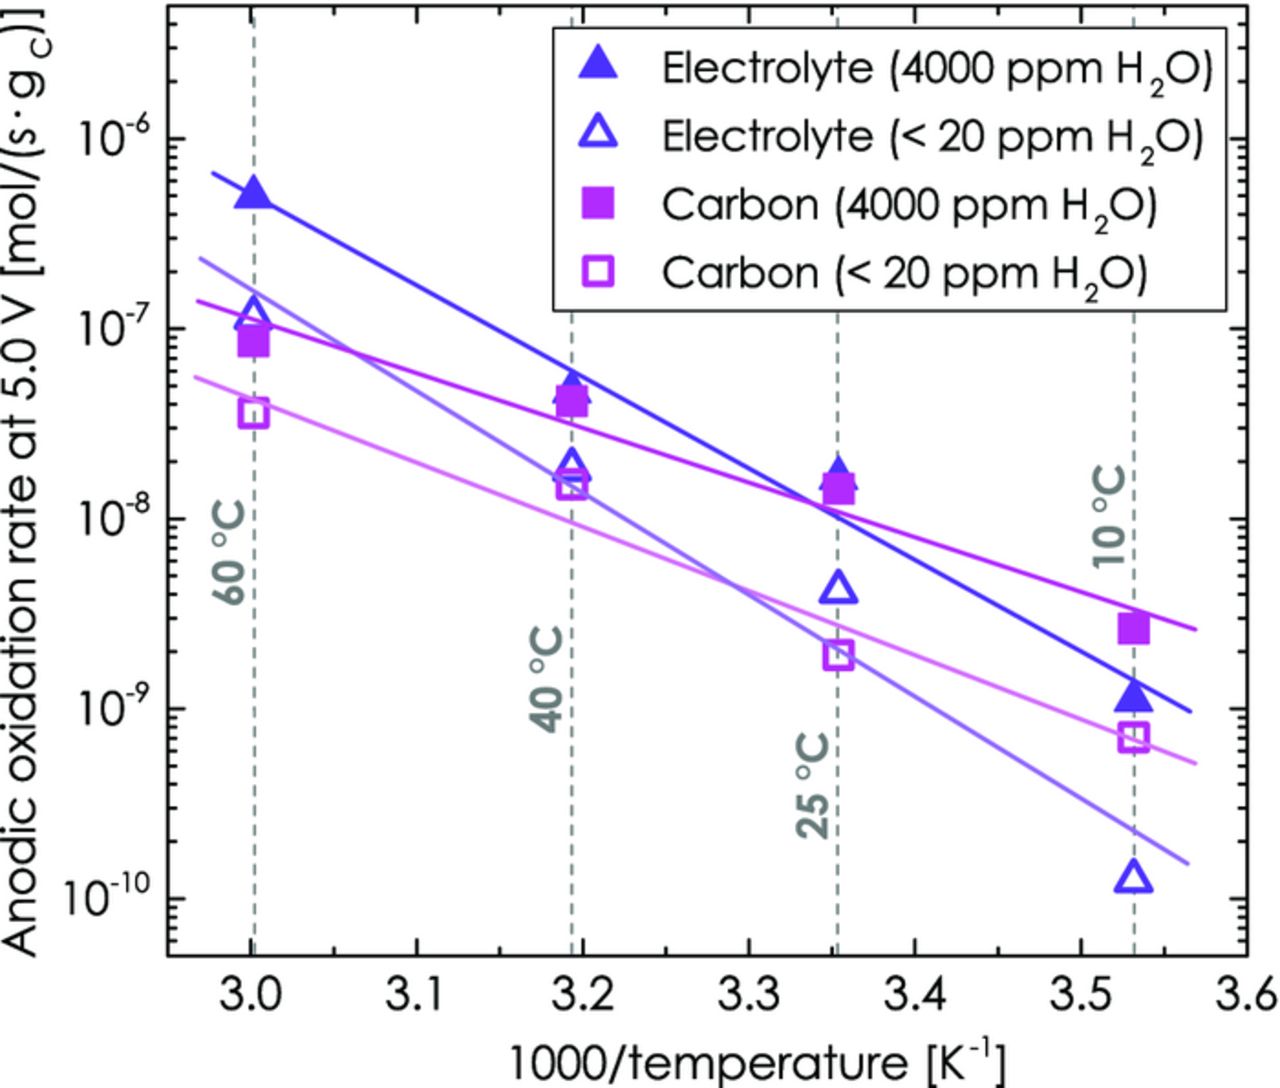
Figure 12. Arrhenius plot for the anodic oxidation rates of Super C65 carbon to 12CO2 + 12CO and of ethylene carbonate to 13CO2 + 13CO at a potential of 5.0 V for temperatures between 10 and 60°C in both dry electrolyte (< 20 ppm H2O, open symbols) and water-containing electrolyte (4000 ppm H2O, solid symbols). The molar anodic oxidation rates are normalized to the mass of carbon and the electrolyte is based on 13C3 EC with 2 M LiClO4.
Figure 12 shows that the corrosion rates with 4000 ppm H2O (solid symbols) are higher than without water (open symbols) for both, carbon (magenta symbols) and electrolyte (purple symbols). Accordingly, water does not favor the corrosion of one particular component, but enhances both carbon and electrolyte corrosion. The enhanced corrosion of carbon in the presence of water can be understood from the well-known anodic oxidation mechanism of carbon in proton exchange membrane fuel cells,43 which would be consistent with the enhanced formation of CO and CO2 in the presence of water:
![Equation ([6])](https://content.cld.iop.org/journals/1945-7111/162/7/A1123/revision1/jes_162_7_A1123eqn3.jpg)
![Equation ([7])](https://content.cld.iop.org/journals/1945-7111/162/7/A1123/revision1/jes_162_7_A1123eqn4.jpg)
Based on our measurements (see Figure 10 and Table II), the ratio of CO2 to CO from the anodic oxidation of carbon is ≈2:1, independent of temperature. We hypothesize that a similar reaction takes place in the water-enhanced anodic decomposition of EC (13C3 EC + H2O → 13CO2 + ...), whereby CO2 is found to be the main product in the absence of added water (CO2/CO ratio > 6:1, see Table II), consistent with the observations by Onuki et al.21 In the presence of water, the CO2/CO ratio increases substantially (≫ 10:1, see Table II), suggesting that water favors the reaction pathway of EC to CO2. A mechanism for this reaction is proposed in our forthcoming article.46
While the apparent activation energies determined from the linear regression lines in Figure 12 differ substantially for the anodic oxidation of carbon and electrolyte, they are very similar without (thin lines in Figure 12) and with added water (thick lines in Figure 12): ≈65 kJ/mol vs. ≈54 kJ/mol for carbon in dry and 4000 ppm H2O-containing electrolyte (this may be compared to the apparent activation energy of ≈67 kJ/mol for carbon oxidation in fuel cells53) and ≈104 kJ/mol vs. ≈92 kJ/mol for ethylene carbonate in dry and 4000 ppm H2O-containing electrolyte. This finding indicates that the underlying mechanism for the anodic oxidation of carbon and ethylene carbonate is identical, no matter if water is added or not. To understand this, it is important to note that water is generally believed to be produced in the anodic oxidation of alkyl carbonate electrolytes at potentials above 4.6 to 4.9 V.34,46,47 The observed similar apparent activation energies with and without water are thus an indication that in-situ produced water might largely be responsible for the anodic oxidation process of carbon and electrolyte. This would be consistent with the somewhat larger oxidation rate enhancement by water at the lowest temperature of 10°C (see Figure 12), since the in-situ formation through electrolyte oxidation at 5.0 V and 10°C is much smaller than at higher temperatures, which in turn leads to a stronger effect of the externally added water at low temperatures.
Projected Super C65 weight loss in high-voltage cathodes (at 5.0 V)
Using the carbon weight-normalized anodic oxidation rates shown in Figure 12 (in units of [molC/(s·gC)] and multiplying them by the molecular weight of carbon (12 g/mol), the relative carbon weight loss rate (in units of [gC/(s·gC)] vs. time at 5.0 V can be estimated. Figure 13a shows the relative carbon weight loss over 100 h (in units of [wt%/100 h]) for 25, 40 and 60°C in electrolyte with < 20 ppm H2O and with 4000 ppm H2O (note that the anodic oxidation rates at 10°C were too low to be of any significance). This mimics, for example, a scenario in which a battery is cycled at a rate of 1C for 50 charge/discharge cycles with a 5 V cathode material, i.e., at a charge/discharge voltage plateau of ≈5.0 V.
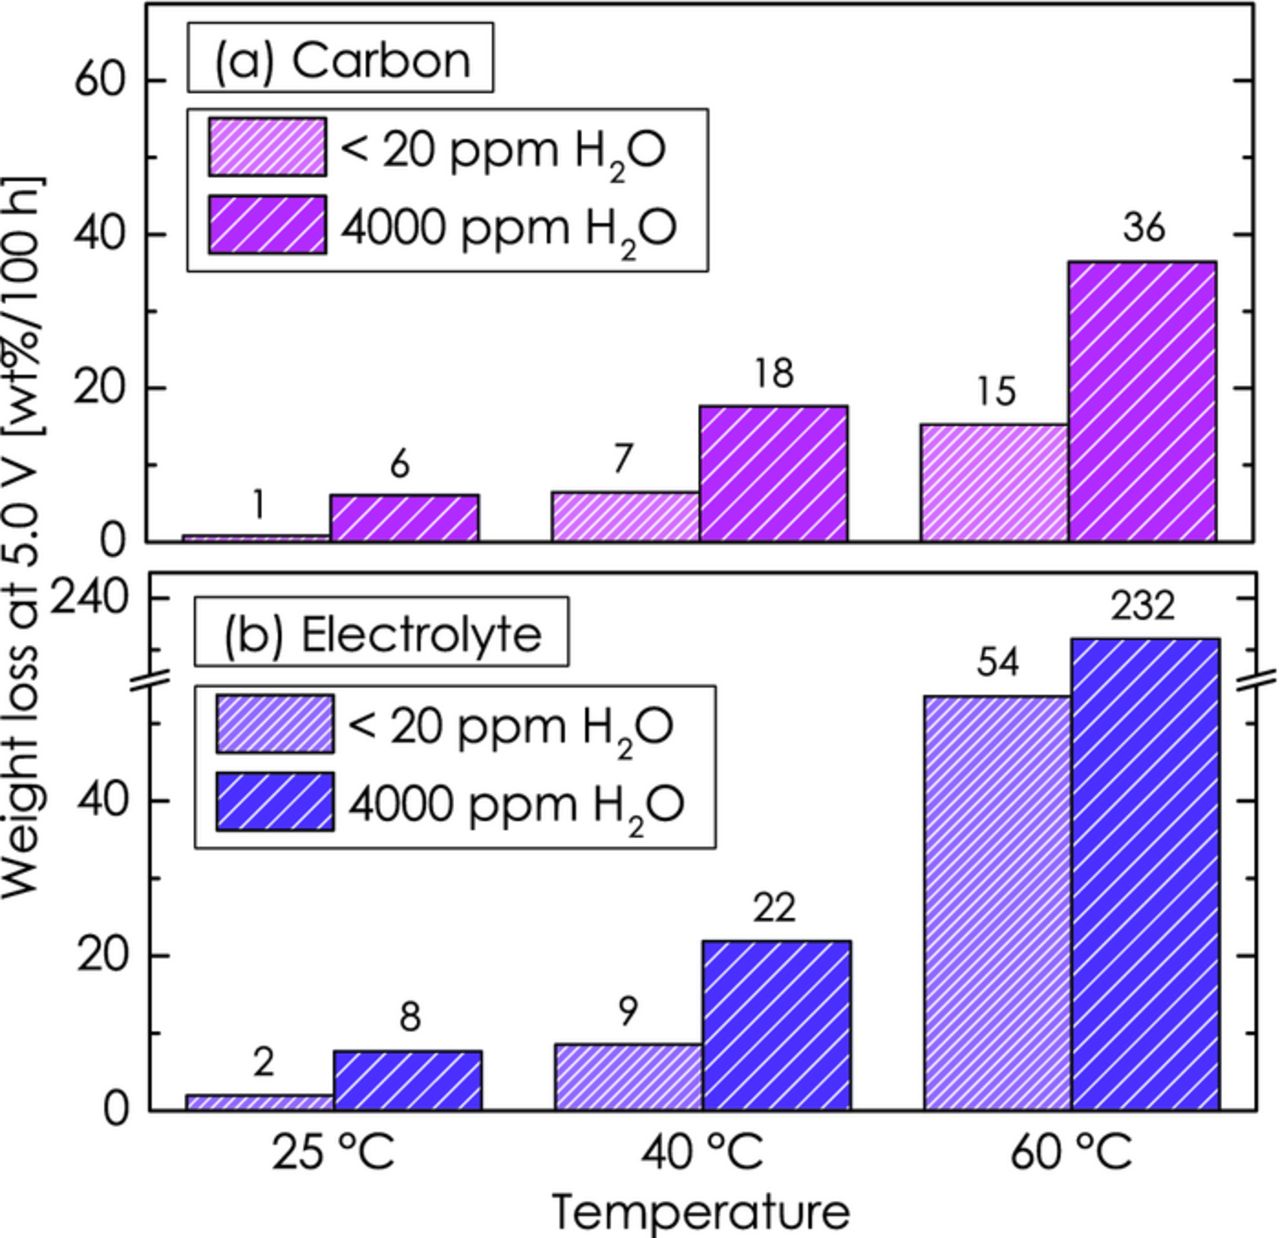
Figure 13. Accumulated weight loss of conductive carbon (a) and electrolyte (b) over 100 h at a potential of 5.0 V for temperatures of 25, 40 and 60°C with <20 ppm H2O and with 4000 ppm H2O.
Figure 13a reflects the observed trends in Figure 12, illustrating that the carbon weight loss increases with temperature and that it is strongly amplified by water. In nominally dry electrolyte at 25°C, only ≈1% of the carbon would be oxidized at 5.0 V over 100 h (e.g., over 50 cycles at a rate of 1C), so that the loss of conductive carbon is likely to not influence the cathode performance over even 1000 h of charge/discharge cycling. On the other hand, at 60°C ≈15 wt% carbon would be oxidized in only 100 h, which is likely to lead to a noticeable loss of electrical conductivity of the cathode electrode. While there are no detailed studies in the literature, we would assume that a loss of conductive carbon on the order of 10% could lead to a severe decrease in electrode performance, particularly when contact points in the carbon network and between the carbon and the cathode active-material are affected. In the presence of 4000 ppm water, the projected life-time of the conductive carbon is reduced by another factor of 2 to 6. In consequence, elevated temperature cycling of high-voltage cathode electrodes is expected to lead to a significant loss of conductive carbon in the cathode electrode, which would be drastically increased in the presence of the intrusion of small amounts of water. The pronounced anodic oxidation of carbon at 5.0 V, particularly at high temperatures, also puts into question the viability of conductive carbon coatings on high-voltage cathode materials, as will be shown in our forthcoming publication.46
Projected weight loss of ethylene carbonate at high-voltage cathodes (at 5.0 V)
In the following, the weight loss of electrolyte shall be calculated from the anodic oxidation rates of the ethylene carbonate based electrolyte shown in Figure 12. For this calculation, we assume: (i) that the active-material (AM) in the cathode does not have an enhanced catalytic activity for electrolyte oxidation, i.e., that its rate is simply proportional to the overall surface area in the electrode; (ii) that the total surface area of active-material is small compared to that of the conductive carbon (e.g., in a typical electrode composed of 90 wt% AM with 1 m2/g and 5 wt% Super C65 with 68 m2/g, ≈80% of the total surface area are that of the carbon); and, (iii) that the carbon weight-normalized ethylene carbonate oxidation rates given in Figure 12 therefore provide a reasonable estimate for the oxidation rate in a typical cathode electrode. According to Wagner et al.,52 the weight ratio of the electrolyte and the cathode active-material in a typical battery is ≈0.35/1 gelectrolyte/gAM, which for an assumed conductive carbon content of 5 wt% results in an electrolyte to carbon ration of ≈7/1 gelectrolyte/gC. By dividing the electrolyte oxidation rates in Figure 12 (in units of [molEC/(s·gC)]) by the gelectrolyte/gC ratio and by multiplying the latter by the molecular weight of EC (88 g/mol), one obtains the fractional electrolyte loss rate.
Figure 13b shows a projection of the obtained values to 100 h for the temperatures 25, 40 and 60°C. In the absence of water, the projected EC weight loss would be minor at 25°C (≈20 wt% over 1000 h), but quite drastic at 60°C, where more than 50 wt% of the electrolyte are projected to be oxidized after only 100 h. Thus, the operation of high-voltage cathodes at 5.0 V at elevated temperature over even 100 h is not feasible with EC-based electrolytes. In addition to electrolyte consumption, the accumulation of electrolyte degradation products on the electrode surface is likely to further reduce battery life-time at these conditions. As in the case of carbon, the weight loss of EC is strongly enhanced in the presence of water.
As a sense-check, we have also determined the anodic oxidation of ethylene carbonate at 60°C and 4.4 V, which is the typical charging potential of LiNixMnyCozO2 (NMC).54 In this case, the anodic oxidation rate in < 20 ppm H2O electrolyte obtained from Figure 9d is ≈1.1·10−8 molEC/(s·gC), which under the above listed assumptions would correspond to an EC weight loss of ≈5 wt%/100 h. This is roughly one order of magnitude lower than the value at 5.0 V (see Figure 13b) and would suggest a life-time of hundreds of hours, consistent with what one would expect based on life-time data in EC-based electrolytes at 60°C and 4.4 V.54–56
Conclusions
In this study, we presented a novel two-compartment battery cell design that allows us to independently study anode and cathode related processes. We benchmarked this cell by comparing its electrochemical performance with a Swagelok T-cell and demonstrated its effectiveness in preventing liquid electrolyte diffusion between the two compartments. Using this cell, we were able to demonstrate the reaction of ethylene carbonate (EC) with trace amounts of water and to determine the reaction rate of the H2O-driven hydrolysis of EC. At room temperature, the homogenous liquid-phase reaction of EC with water to form CO2 is negligible, but at 60°C, the reaction is strongly accelerated.
Furthermore, we were able to deconvolute the CO and CO2 evolution from the anodic oxidation of carbon and electrolyte by using an electrolyte composed of isotopically labeled ethylene carbonate (13C3 EC) and 2 M LiClO4. We demonstrated that the anodic oxidation of conductive carbon (Super C65) to 12CO/12CO2 and the oxidation of electrolyte to 13CO/13CO2 is strongly enhanced by the presence of 4000 ppm H2O in the battery cell (no 12CO/12CO2 were observed from the PVdF binder). Measurements from 10 to 60°C revealed that the anodic oxidation of the electrolyte increases much stronger with temperature than that of the conductive carbon.
By calculating the carbon weight-normalized anodic oxidation rates of ethylene carbonate and Super C65, we were able to estimate the weight loss of these components if they were used with high-voltage cathodes operating at ≈5.0 V. At 60°C, ≈15 wt% of the conductive carbon and ≈50 wt% of the electrolyte would be lost after 100 h of cycling at potentials ≥ 5.0 V vs. Li/Li+. All in all, the anodic oxidation of carbon and electrolyte at ≈5.0 V can be substantial at high temperature and in the presence of trace water, posing significant challenges for the implementation of 5 V cathode materials.
Acknowledgment
The authors gratefully acknowledge BASF SE for financial support of this research through the framework of its Scientific Network on Electrochemistry and Batteries. In particular, we thank Dr. Arnd Garsuch (BASF SE) for the coordination of this network and Prof. Brett Lucht (University of Rhode Island) for helpful advice. We would also like to thank Dr. Christoph Stinner (BMW AG) for his invaluable and insightful contributions to this work in many discussions.