Abstract
A discrete transmission line model (TLM) for the impedance of the positive electrode in a Li-ion cell was studied to investigate causes of impedance increase for Li[Ni0.42Mn0.42Co0.16]O2 (NMC442) positive electrodes operated at high voltage (> 4.4 V vs. Li/Li+). The TLM included contact resistance between the conductive carbon and the active particles (Rc), electrical path resistance through the carbon network (Re), ionic path resistance through the bulk electrolyte (Ri) and transfer resistance/capacitance (Rs, C) through the SEI layers formed on the active particles. It was found that an increase in any of Re, Ri or Rc was necessary to increase the high frequency intercept of the impedance spectra. A limited increase in the spectrum diameter of the TLM was achievable by increasing Re or Ri, but an unlimited increase was only possible by increasing the SEI resistance Rs. Comparison with experiment concluded that the high voltage impedance growth observed in NMC442/graphite cells is primarily due to increases in Rs, while minor increases in Re, Ri or Rc may occur. A brief investigation of inhomogeneous SEI capacitance/resistance produced impedance spectra with a range of heights and asymmetries. This can explain in part the variety of shapes of impedance spectra from real impedance measurements of Li-ion cells.
Export citation and abstract BibTeX RIS

This is an open access article distributed under the terms of the Creative Commons Attribution 4.0 License (CC BY, http://creativecommons.org/licenses/by/4.0/), which permits unrestricted reuse of the work in any medium, provided the original work is properly cited.
Lithium-ion batteries have enjoyed widespread use in portable electronics for over two decades, and are increasingly relevant for electric vehicles as operational life and energy density continue to increase. The use of high voltage LiMO2 (M = Ni, Mn, Co), or NMC (Li[NxMnyCo1-x-y]O2), positive electrode materials improves the energy density of the cell, but difficulties arise in maintaining calendar life and coulombic efficiency, especially at voltages greater than 4.3 V.1 The internal impedance of a cell is closely associated with its health,2–4 so electrochemical impedance spectroscopy (EIS) is a powerful diagnostic technique. It is important to connect the features seen in EIS spectra with the correct internal processes occurring within a cell. A comprehensive circuit model for the impedance of a cell is needed to understand these processes.
Figure 1a shows capacity vs cycle number for two NMC442/graphite Li-ion pouch cells (240 mAh). The high magnitude of the high frequency impedance is due to the two-wire measurement apparatus. The impedance of the wires contributes to the overall series resistance measured. The exact electrode composition in the studied cells was: Positive electrode - 96.2%:1.8%:2.0% = active material : carbon black : PVDF Binder; negative electrode - 95.4%:1.3%:1.1%:2.2% = active material : carbon black : CMC : SBR. The pouch cells used were so called 402035 size which were 40 mm long by 20 mm wide by 3.5 mm thick. The positive electrode coating had a total (both coatings and current collector) thickness of 105 μm and was calendared to a density of 3.55 g/cm3. The negative electrode coating had a total thickness of 110 μm and was calendared to a density of 1.55 g/cm3. The positive electrode coating had an areal density of 16 mg/cm2 (one side) and the negative electrode had an areal density of 9.5 mg/cm2 (one side). Both the positive and negative electrodes were coated on both sides, and the electrodes were spirally wound yielding an active area of around 100 cm2. One was cycled between 2.8 V and 4.4 V with a 24 h hold at 4.4 V, and the other was cycled between 2.8 and 4.5 V with a 24 h hold at 4.5 V (see Figure 1b). Additional information on the preparation of these cells is outlined by Nelson et al.1 The 4.5 V cell shows considerable capacity fade after 30 cycles, whereas the 4.4 V cell has good capacity retention for the first 80 cycles. Figure 1c shows the impedance spectra of the 4.4 V cell taken at 4.4 V and Figure 1d shows spectra for the same cell at 3.8 V. Cycle number increases from red to blue in both Figures 1c and 1d. As cycle number increases, the spectra shift to the right but their diameters do not grow significantly. Figure 1e shows the impedance spectra of the 4.5 V cell taken at 4.5 V. The shifting of the spectra is seen, accompanied by large growth of the diameter of the semicircle in the mid-frequency regime at 4.5 V. Figure 1f shows impedance spectra for the same cell taken at 3.8 V. The diameter of the semicircles are much smaller than in Figure 1e, indicating that the impedance growth at high voltage is largely reversible. However the diameters of the spectra are still increasing slowly with cycle number irreversibly. The spectra in Figures 1c–1f have inductive tails at high frequency due to the internal inductance of the measurement device used to collect the data.
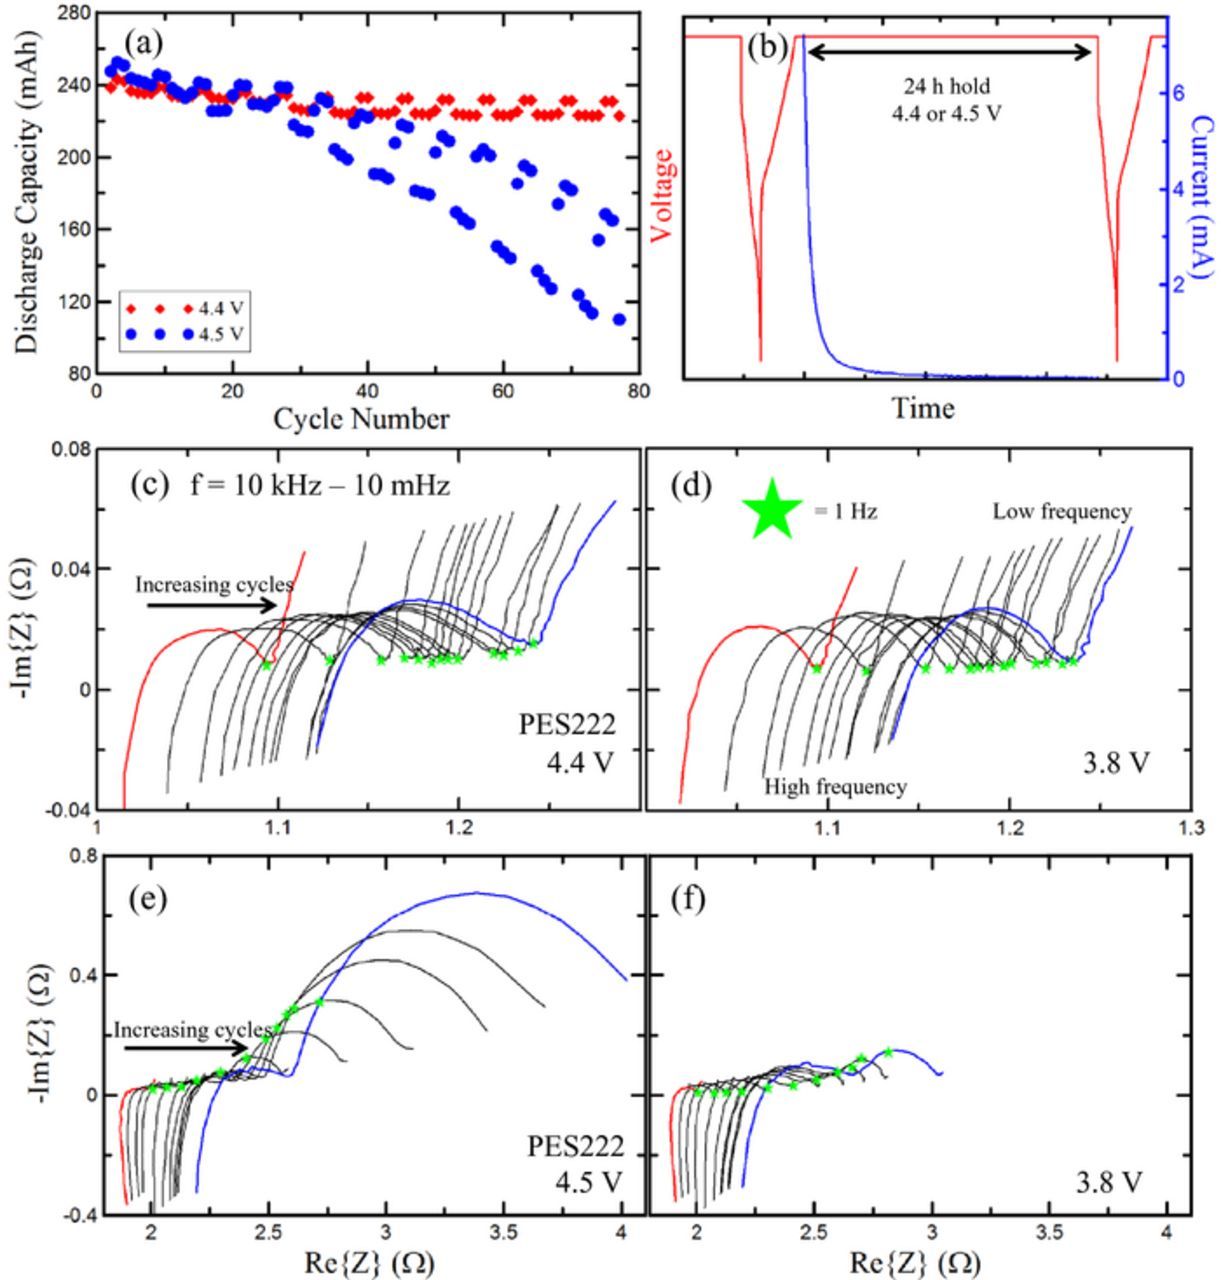
Figure 1. (a) Capacity vs cycle number for PES222 cells cycled to 4.4 V (red) and 4.5 V (blue). (b) Example charge profile for both cells plotting current and potential vs time. (c) Nyquist spectra for 4.4 V cell taken at 4.4 V with cycle number increasing from red to blue. The frequency range is 10 kHz–10 mHz and was the same for all impedance spectra. (d) Nyquist spectra for 4.4 V cell taken at 3.8 V. Difference between this set of spectra and the spectra of (c) are minor. Low and high frequency regions are labelled and are the same for every spectrum in this figure. (e) Nyquist spectra for 4.5 V cell taken at 4.5; (f) Nyquist spectra for 4.5 V cell taken at 3.8 V. Difference between this set of spectra and the spectra of (e) are substantial.
It has been previously established by Chen et al. that this impedance growth exemplified by Figure 1 is mainly due to degradation of the positive electrode.5 To support this claim, Figure 2 plots symmetric cell impedance plots for LaPO4-coated Li[Ni0.42Mn0.42Co0.16]O2/graphite (NMC442) pouch cells.6 Figure 2a plots the positive electrode symmetric cell impedance and Figure 2b plots the negative electrode impedance. The green stars signify the 1 Hz points. The positive electrode has greater impedance than the negative electrode by a full order of magnitude. Additionally, the positive electrode symmetric cells exhibit extremely high impedance at frequencies lower than 1 Hz, whereas the negative electrode symmetric cells exhibit much lower impedance at frequencies higher than 1 Hz. This indicates that the high impedance seen in Figure 1e is because of positive electrode effects, both due to the order of magnitude and the frequency regime in which it is found.
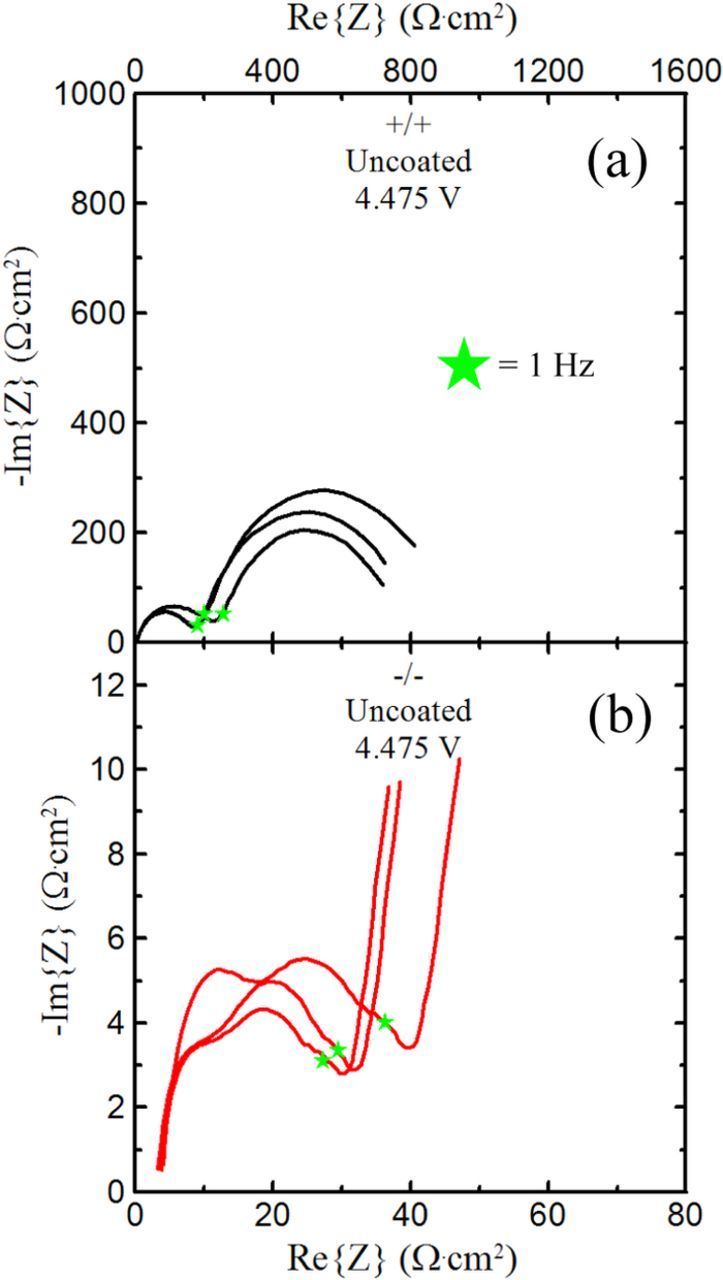
Figure 2. Symmetric cell impedance for lanthanum phosphate coated NMC442/graphite Li-ion pouch cells. (a) Positive electrode impedance. (b) Negative electrode impedance. Impedance of the positive electrode is greater by an order of magnitude.
The exact cause for the reversible and irreversible increases in impedance at high voltage is still a matter of discussion. The work of Kerlau et al. postulates electrical contact resistances between the carbon black particles and the active particles in the cathode develop as the cell cycles.7 These additional resistances are claimed to cause a substantial increase in the diameter of the Nyquist spectra without significantly affecting the high frequency intercept. Metzger et al. claim anodic oxidation of carbon black in the cathode and ethylene carbonate in the electrolyte prevents the cell from operating close to 5 V.8 Metzger et al. also claim the oxidation of the carbon black leads to degradation of the electronic conduction path in the electrode. Nelson et al. suggest reversible impedance growth is caused by surface compounds that form on the cathode particles at high voltage and return to solution at low voltage,1 i.e. a dynamic solid electrolyte interphase (SEI). Irreversible impedance growth was suggested to be primarily due to continued SEI growth on the positive electrode surface during cycling as well as electrolyte degradation.
The transmission line model (TLM) theory of the internal impedance of an electrode mimics the geometry and interfaces in the electrode. Figure 3b shows a simplified diagram of a cell positive electrode and Figure 3a shows a possible corresponding discrete transmission line model.9 Re represents the electronic path resistance through the carbon black. Ri represents the ionic path resistance through the electrolyte solution in the electrode pores. In this model, Re and Ri have the same overall effect on the circuit. C represents the capacitance of the SEI double layer that forms on the surface of the active particles as the cell cycles. Rs represents the associated charge transfer resistance of this SEI layer. Rc represents the contact resistance between the carbon black and the active particles, as outlined by Kerlau et al. in Figure 7b of their paper.7 Their model placed Rc resistors in series with the RC pairs that represented the SEI of the active particles. The Rc resistors in this TLM model have been added in the same place in order to make a direct comparison with their results. Further complexity can also be included such as a parallel RC pair to represent the contact impedance between the electrode and current collector as outlined by Atebamba et al., but that will not be included here.9 In addition, Warburg impedances can be added to mimic solid state diffusion,10,11 which affects the lowest frequency sections of the impedance spectra, but Warburg impedances will not be considered here. "Constant phase elements" which have questionable physical significance are often used to replace transmission line circuits with less complex equivalent circuits.12,13 In this paper, constant phase elements are not used to try to maintain simplicity and physical reality.

Figure 3. (a) Discrete transmission line model circuit with five links. All five circuit components (Re, Ri, Rs, Rc, C) discussed in the model are present. (b) Schematic of Li-ion cell positive electrode with each relevant effect highlighted and connected to its corresponding circuit component.

Figure 7. (a) Rct (the spectrum diameter) plotted vs Re or Ri (red), Rs (blue) and Rc (green). Rc has no effect on Rct; Re and Ri have a moderate effect that is asymptotically bounded and Rs has a large effect. (b) Position of the high frequency intercept plotted vs Re or Ri, Rs, and Rc. Rs has no effect on the intercept; Rc has a moderate, unbounded effect while Re and Ri have the largest effect.
Continuous transmission line models for cylindrical pores have already been developed and explored.14–17 While they are mathematically concise, they often assume constant resistivity and permittivity for the associated components in the model. As such, they cannot account for inhomogeneities in the positive electrode particles. In this study, a discrete transmission line model is solved using circuit dynamics for various circuit parameters. By systematically altering the circuit parameters and observing the changes in the impedance spectra, a guide to understanding changes in measured impedance spectra is developed.
Theoretical
The complex impedance of the transmission line model shown in Figure 3 was calculated both analytically and numerically via SPICE simulation.18 Figure 4 shows the process by which the transmission line was reduced from 5 links to 4 links using Y-Δ transforms.19 This process was executed repeatedly until the circuit was solved. In the homogeneous case, the value of each circuit component was constant from link to link. In the inhomogeneous case, each individual circuit element could have a unique value. The number of links in the TLM was chosen to be five for the following reasons:

Figure 4. Decomposition process for solving the TLM circuit analytically. Circuit components were consolidated to simplify the circuit to a ladder geometry (1–3). Y-Δ transforms were implemented to simplify the circuit (3–4), and further consolidation reduced the complexity of the circuit (4–5). This process was repeated until the circuit was reduced to one element.
SEM images of NMC positive electrode particles in Figure 9 of Li et al.'s publication show a particle diameter ranging between 15–20 μm.20 SEM images of NMC particles from commercial 18650 cells (Figure 7 in the paper by Burns et al.21) show the particles to be about 15 μm. Commercial NMC positive electrodes are coated on both sides of an aluminum current collector which is normally about 10–15 μm thick. Gyenes et al. list a total positive electrode thickness of 105 μm in Table I of their paper22 which suggests a single side coating with a thickness of about 50 μm. NMC cells designed for energy applications may have thicker positive electrodes, perhaps up to as much as 100 μm. Positive electrode coatings between 50 and 100 μm thick are only about 4 to 10 particles "deep". That is why a 5 link TLM was selected. Similar statements can be made for LiCoO2 (LCO) and Li[Ni0.8Co0.15Al0.05]O2 electrodes where large particles are used, but not for typical LiFePO4 electrodes where much smaller particles are used and hundreds or thousands of links would be required.
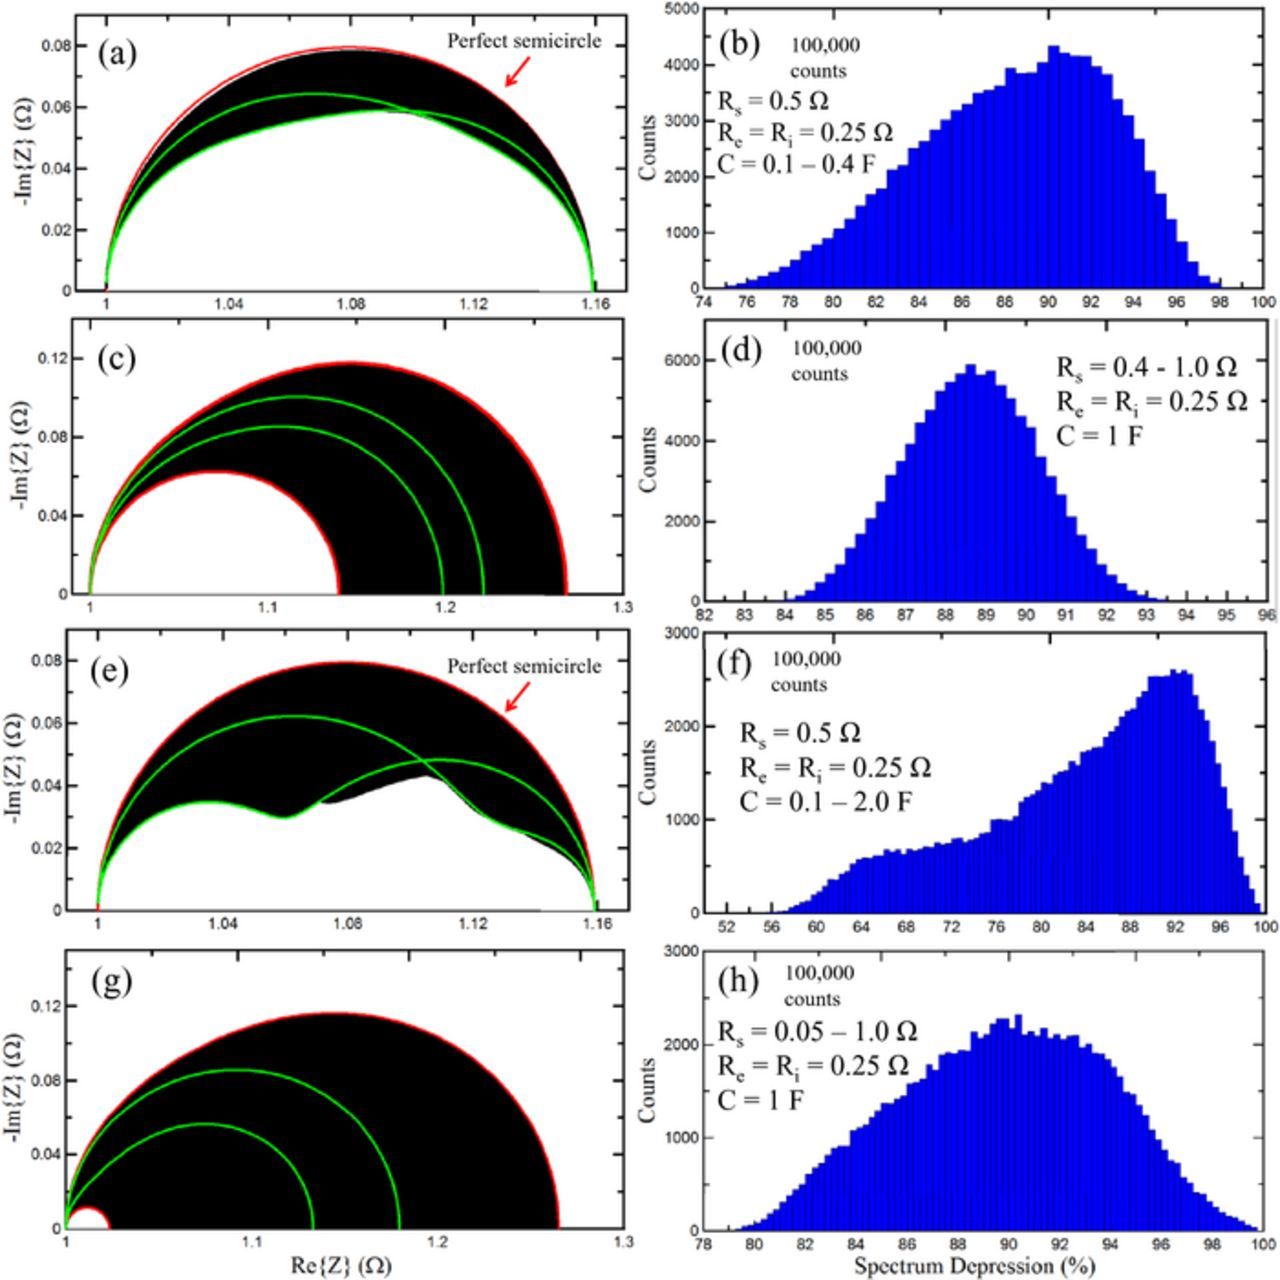
Figure 9. (a) Range of possible impedance spectra that result from randomized capacitances between 0.1–0.4 F. Example spectra are plotted in green. (b) Histogram of spectrum depression for 100,000 trials. (c) Range of possible impedance spectra that result from randomized SEI resistance between 0.4–1.0 Ω. Red curves represent smallest and largest Rct produced by these trials. (d) Histogram of spectrum depression for data in 8c. (e) Randomized capacitances between 0.1–2 F with the same format as 8a. (f) Histogram of spectrum depression for data in 8e. (g) Rs = 0.05–1 Ω with same format as 8c. (h) Histogram of depressions for data in 8g.
The impedance spectra produced by the theoretical calculation were compared to SPICE simulations of the same circuit, and were found to be in agreement. In the homogeneous case, the equation for the impedance of the five link TLM circuit is:
![Equation ([1])](https://content.cld.iop.org/journals/1945-7111/163/3/A522/revision1/d0001.gif)
where:
![Equation ([2])](https://content.cld.iop.org/journals/1945-7111/163/3/A522/revision1/d0002.gif)
and j is the imaginary unit. For the inhomogeneous case, or in the case of more links, the impedance was solved procedurally using a computer algorithm written in Python.23 This TLM excludes the resistance or capacitance due to the movement of electrons through the aluminum current collector.9 The surface area of the aluminum current collector is much lower than the total surface area of the SEI on the active particles. Since the resultant capacitance is lower, any capacitive effect due to the metal substrate will be seen at high frequency.9 This offers an explanation for the small peak at high frequency in Figures 1e and 1f. During manufacturing of a Li-ion cell, the positive electrode material is calendared at high pressure to the current collector, minimising the resistance. Its contribution is evidently small compared to the mid-frequency impedance growth and has been omitted from the model for the sake of simplicity.
Results and Discussion
Figure 5 shows impedance spectra generated by the discrete TLM. The spectra were generated to roughly coincide with the measured data in Figures 1c and 1e. The red curve in Figure 5a corresponds to Re = 0.26 Ω. Re increases linearly for the intermediate spectra and ends at 0.32 Ω, represented by the blue spectrum. If Re were held at 0.25 Ω and Ri were allowed to vary between 0.26–0.32 Ω, the resultant spectra would be the same. This is reflected in the fact that Ri and Re have identical effects on the circuit. As Re increases, the diameters of the spectra increase slightly, but the dominant effect is an appreciable increase in the real part of the impedance intercept at high frequency. In the context of Figure 1a, this indicates that the electronic path or the ionic path resistance is increasing in the cell during the aggressive charge-hold-discharge cycling in Figure 1. A change in the charge transfer resistance is not necessary to explain the shift in the real part of the cell's impedance. Figure 5b was generated similarly to Figure 5a with Re increasing from 1.25 Ω (red) to 1.5 Ω (blue). Additionally, the red curve corresponds to Rs = 0.3 Ω and the blue curve corresponds to Rs = 3.5 Ω. The black curves correspond to intermediate values of Rs and Re. An increase in the SEI resistance of the double layer was necessary to produce the large diameter growth between the red curve and the blue curve. Changing Rs alone was ineffective in shifting the high frequency intercept. This is consistent with the model outlined in Figure 3 because the capacitors have near-zero impedance at high frequency. This causes the SEI resistors to be in parallel with a short circuit at high frequency, rendering them ineffective. As a result, the position of the high frequency intercept is not affected by changes in the SEI resistance. This indicates that the dominant process causing the shift in the high frequency intercept was still present in the cell that was cycled to 4.5 V. An additional effect causing the diameter increase seen in Figures 1e and 1f is attributed to an increase in the charge transfer resistance, Rs, in the TLM. This agrees well with the hypothesis of Nelson et al.1

Figure 5. (a) Impedance spectra engineered to approximately coincide to the spectra seen in Figure 1c. Re increases from red to blue. Only a change in Re is necessary to produce good agreement. (b) Impedance spectra engineered to coincide to the spectra seen in Figure 1e. A change in both Re and Rs is necessary to produce good agreement.
A closer examination of the individual effects of each circuit component was conducted. Figure 6a shows the transmission line model used to examine the effects of different circuit elements. Figure 6b shows Nyquist plots for impedance spectra. The base values for the circuit parameters were Rs = Rc = 1 Ω, Re = Ri = 0.25 Ω and C = 1 F. The Nyquist spectrum of the circuit with these parameters is shown in black. The blue Nyquist curves represent the impedance of the TLM when Rs was doubled to 2 Ω and quadrupled to 4 Ω respectively with all other parameters held constant. The red impedance spectra were produced by increasing Re or Ri to 0.5 Ω and 1 Ω with Rs = 1 Ω and all other parameters held constant. The spectra shown in green represent Rc being increased to 2 Ω and 4 Ω with all other parameters held constant. Rs has the most significant effect on the diameter of the spectra. An increase in Re or Ri also increased the spectrum diameter, but it was also accompanied by a significant increase in the high frequency resistance. A change in Rc had no effect on the spectrum diameter. However, it caused an appreciable increase in the real part of the high frequency impedance. This is in disagreement with the hypothesis of Kerlau et al., who make the spurious claim that contact resistances have no effect on the high frequency intercept, but significantly increase the spectrum diameter.7

Figure 6. (a) Discrete TLM circuit used in simulation. (b) Assorted Nyquist plots examining changes in Rct (the diameter of the spectrum). The parameters written in black correspond to the black curve. The blue, green and red curves correspond to the increase of Rs, Rc and Re or Ri, respectively, with all other parameters held constant. Changing Rs has the largest effect on Rct.
To understand the individual effects of each resistor element on the spectrum diameter, one must examine the high and low frequency intercepts in the context of DC resistance of the TLM. The value of the low frequency intercept is the DC resistance of the TLM if the capacitors were removed from the circuit. The value of the high frequency intercept is the DC resistance of the TLM if the capacitors were replaced with short circuits. Because a short circuit in parallel with a resistor is equivalent to a short circuit, this is equivalent to shorting the charge transfer resistors and removing the capacitors. In this context, it is clear that increasing Rs in the TLM will have the most significant effect on the spectrum diameter. Increasing Rs alone cannot cause the high frequency intercept to shift, but it will cause the value of the low frequency intercept to increase because the DC resistance of the TLM is now larger. This increases the distance between the two intercepts and causes the diameter of the spectrum to increase accordingly. Increasing Re has a small effect on the spectrum diameter because current in the circuit favors certain charge transfer paths, specifically ones that minimize transit through the increased resistance of the electronic path resistors. Because the bulk of the current travels through fewer charge transfer pathways which are in parallel, the charge transfer resistance increases. This is analogous to the fact that 2 resistors in parallel constitute a more resistive system than 5 resistors of the same value in parallel due to the reduction in electronic pathways. In the limit of large Re, all the current will travel through the closest charge transfer pathway. Thus, if Rs is held constant and Re increased, the total charge transfer resistance of the circuit (Rct) will asymptotically approach Rs. The presence of contact resistances has no effect on the spectrum diameter, because it is present in the circuit at both low and high frequency, and it does not increase the conductivity of some electronic pathways over others. The effect of each of these components on the impedance of the TLM is summarized in Figure 7. Figure 7a plots total charge transfer resistance (the spectrum diameter or Rct) vs. Re or Ri, Rs and Rc. The base parameters of the circuit were Rc = Rs = 1 Ω, Re = Ri = 0.25 Ω and C = 1 F. The order of magnitude of these values was motivated by empirical observation of the experimental resistance and frequency data in Figure 1. As one parameter varied, the others in each graph were held constant. The effect of Rs (shown in blue) is the most significant. Changes in Re or Ri have a small effect on Rct and Rc has virtually no effect at all. This indicates that a large increase in the spectrum diameter, as seen in Figure 1e for example, must be attributed to an increase in the charge transfer resistance of the active particles in the positive electrode. Figure 7b shows the position of the high frequency intercept vs. Re or Ri, Rs and Rc. The base parameters are the same as in Figure 7a. Changes in Rs have no effect on the high frequency intercept as previously discussed. However, Re, Ri and Rc can all potentially contribute to the shift on the real axis. Learning how to determine experimentally which of these components is responsible for increases in the high frequency intercept is a project we are now pursuing. One method currently under investigation is to measure impedance as a function of temperature, as the underlying mechanisms behind carbon resistance and electrolyte resistance have temperature dependencies that are distinct from each other. As of yet, no publishable data has been collected.
The TLM was also used to investigate the effect of inhomogeneities in a cell cathode. Realistically the cathode particles have a distribution of sizes, surface species have non-uniform thickness, and some active particles have stronger contact with the carbon black network than others. This suggests that each circuit component in the TLM can take on a range of values rather than just one. Figure 8a examines inhomogeneity in the electrical path resistance. The curve in blue is for a TLM with no electrical path resistance. The other circuit parameters are Ri = 0.25 Ω, Rs = 0.5 Ω and C = 1 F. The red curves each represent a TLM where each electrical path resistor is a random value between 0–0.2 Ω picked from a square probability distribution. The overall DC resistance of the circuit increases with the addition of electrical path resistors, both at high and low frequency. More current pathways are favored with the addition of electrical pathway resistors, so the diameter necessarily decreases. Figure 8b shows the impedance spectra of the TLM when electrical contact resistors are inhomogeneous. The blue curve represents a TLM with no Rc resistors. The circuit parameters are Rs = 0.5 Ω, Re = Ri = 0.25 Ω and C = 1 F. The red curves show impedance spectra for the TLM with each Rc resistor having a random value between 0–1 Ω. The red spectra are all shifted on the real axis for the same reason as in Figure 8a. An increase in the charge transfer resistance is possible because inhomogeneity in the electrical contact resistors can increase favorability for some electronic pathways. As discussed previously in the context of increasing Re, this effect limits the total charge transfer resistance to being less than or equal to Rs. Thus, while the development of inhomogeneous contact resistances can increase the spectrum diameter, it is not sufficient to explain impedance growth seen on the scale of Figure 1e.
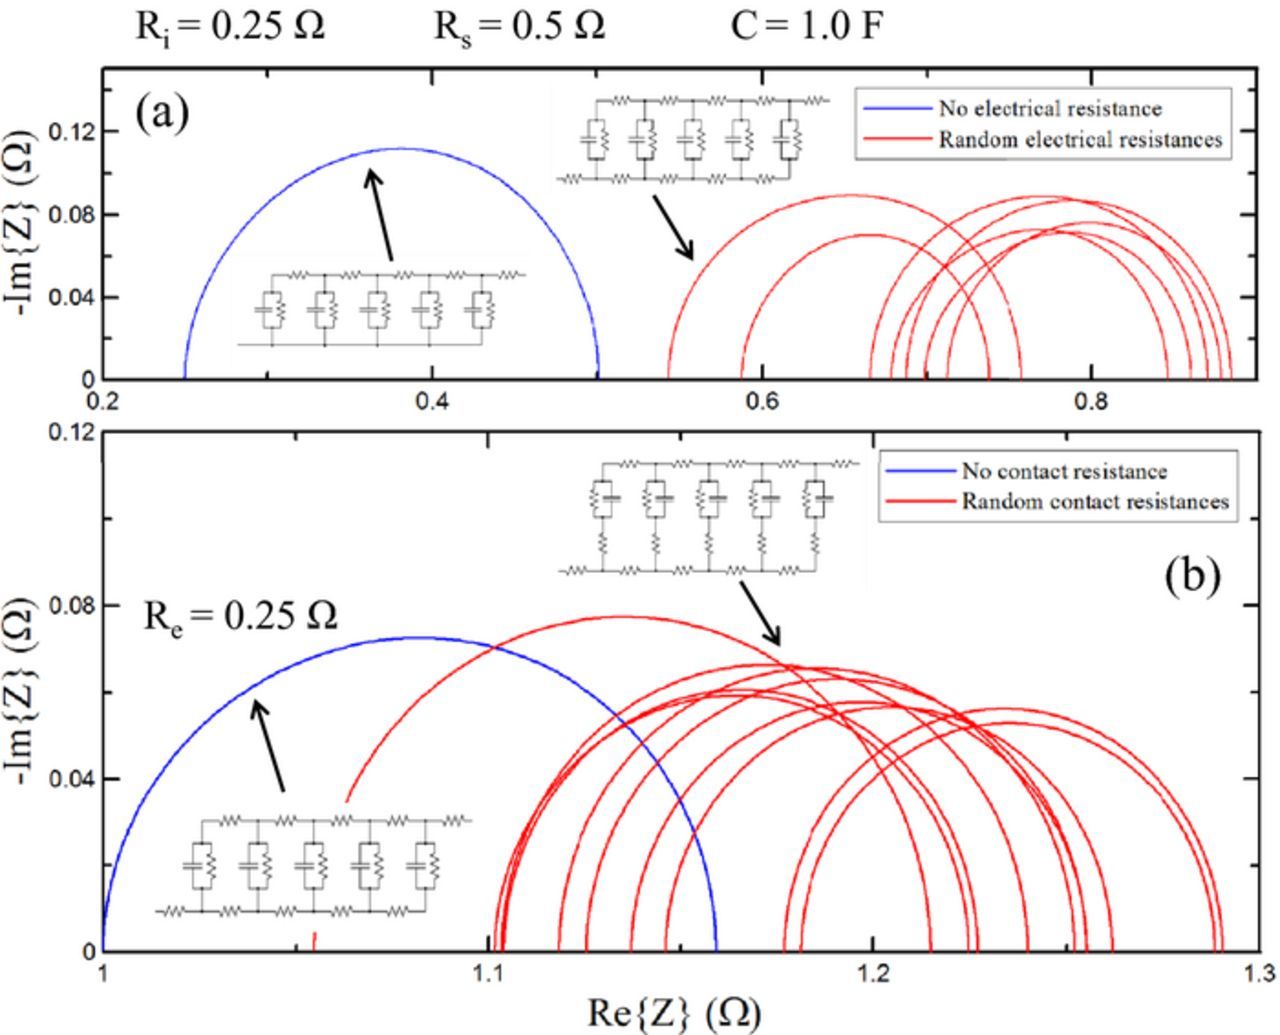
Figure 8. (a) Blue: TLM with no electrical path or contact resistance. Circuit parameters are given above. Red: TLM spectra with randomized contact resistances between 0–0.2 Ω. The high and low frequency intercepts increase due to increased resistance of the TLM, but the charge transfer resistance (the diameter of the spectrum) is reduced. (b) Blue: TLM with no electrical contact resistance. Circuit parameters are the same as in (a) with the addition of Re = 0.25 Ω. Red: TLM with randomized contact resistances between 0–1 Ω. The low and high frequency intercepts increase and Rct generally decreases. An increase in Rct is possible, but it is limited by Rs in this case.
Inhomogeneities in Rs and C create a distribution in RC times for each charge transfer pathway. This can cause a "spreading" of the high and low frequency intercepts without a proportional change in the peak position, or it can cause the peak position to depress without a proportional change in the charge transfer resistance. Figure 9a shows the variety of spectrum shapes that can result from inhomogeneity in the double layer capacitance of the active particles. The TLM circuit parameters are Rs = 0.5 Ω, Re = Ri = 0.25 Ω and Rc = 0 Ω. 100,000 trials were conducted where each SEI capacitor was assigned a random value between 0.1–0.4 F. The red curve is a perfect semicircle. The region highlighted in black is the space that the 100,000 Nyquist spectra occupied. Two sample curves in green have been plotted to demonstrate how this black region can be occupied by a Nyquist plot. Depending on the set of C values, the Nyquist spectrum could be near semicircular, or asymmetric and depressed. A "depression coefficient" is defined to quantify the degree of "flattening" of the Nyquist spectrum: 0% denotes a straight line along the real axis and 100% represents a perfect semicircle, where the height and width of the Nyquist spectrum are used for the calculation of the depression coefficient. Figure 9b shows a histogram of the depression coefficients for the 100,000 trials conducted. Spectra as flat as 76% were observed, with the most common depression being close to 90%. Figure 9c shows a similar 100,000 trial graph where Re = Ri = 0.25 Ω, C = 1 F and the charge transfer resistors were each assigned a random value between 0.4–1.0 Ω. The upper red curve and the lower red curve represent the Rs arrangements that gave the highest and lowest Rct respectively. The black region is the space that the intermediate Nyquist spectra occupied, and two example spectra have been plotted in green. Figure 9d shows a histogram of the spectra depression for all 100,000 trials. Depression is evenly centered close to 89%. In Figure 9e, the range of capacitances was increased to a factor of 20. The black region terminates at a significantly lower value of –Im{Z}, and the example curves in green show that the spectra can exhibit large asymmetries and multiple peaks. Figure 9f plots the spectrum depressions for this trial. Spectra that reached depression under 60% were observed. In Figure 8g the range of Rs was increased to a factor of 20. Depression down to 80% was observed in Figure 8h. The purpose of this figure is to explain why real impedance spectra can have asymmetries and can be measurably flatter than perfect semicircles. This effect can be compounded further if the RC time constant of the SEI in the negative electrode differs moderately from that of the positive electrode. The two peaks will overlap and resemble a flattened spectrum.
Conclusions
A discrete transmission line model for the impedance of a Li-ion positive electrode was explored. The impedance of the TLM circuit was solved analytically using Y-Δ transforms and the solutions were verified using SPICE. The TLM model was applied to example data that showed large growth in Rct at high voltage during aggressive charge-hold-discharge cycling. It was found that in order to increase the real resistance at high frequency, any of Re, Ri or Rc had to increase. However, only Rs could be responsible for the large increase in Rct. It was found that any effect other than changing Rs that was able to change the total charge transfer resistance was asymptotically limited by Rs. This suggests that high voltage impedance growth is due to continued SEI growth on the active particles, or the presence of surface species at high voltage.
An inhomogeneous set of electronic path resistances increased the high and low frequency resistance, but reduced the total charge transfer resistance of the circuit. An inhomogeneous set of contact resistances was able to cause an increase in the spectrum diameter, but it was limited to the value of Rs and could not explain high voltage impedance growth seen in aggressively cycled real cells. A range of random SEI capacitance/resistance values were used to simulate surface inhomogeneity in the positive electrode. The simulations produced "flattened" and asymmetric spectra in comparison to a semi-circle. This agreed qualitatively with the flat and asymmetric spectra seen in impedance measurements of real cells.
These simulations and comparisons to real data suggest avenues for improving the positive electrodes in NMC/graphite cells destined for high voltage operation:
- (1)The electrode/electrolyte interface must be improved by changes to the electrolyte or the electrode surface.
- (2)The integrity of both the electronic path and the ionic path must be maintained. The conducting diluent cannot be oxidized and pores cannot be blocked by electrolyte decomposition products.
- (3)The current collector/electrode interface must also be maintained.
Based on the work shown here, dealing with the electrode/electrolyte interface is most critical, but all of 1), 2) and 3) must be solved to guarantee success.
Acknowledgments
The authors acknowledge the financial support of NSERC and 3M Canada under the auspices of the Industrial Research Chairs program. DWA thanks NSERC and the Faye Sobey Student Undergraduate Research Endowment for scholarship support. KJN, a Nova Scotia Graduate Scholar, thanks NSERC for scholarship support through the CREATE DREAMS program at Dalhousie University and also through the PGS-D program.