Abstract
We present an unbalanced compositionally-symmetric flow cell method for revealing and quantifying different mechanisms for capacity fade in redox flow batteries that are based on molecular energy storage. We utilize it, accompanied in some cases by a corresponding static-cell cycling method, to study capacity fade in cells comprising anthraquinone di-sulfonate, di-hydroxy anthraquinone, iron hexacyanide, methyl viologen, and bis-trimethylammoniopropyl viologen. In all cases the cycling capacity decay is reasonably consistent with exponential in time and is independent of the number of charge-discharge cycles imposed. By introducing pauses at various states of charge of the capacity-limiting side during cycling, we show that in some cases the temporal fade time constant is dependent on the state of charge. These observations suggest that molecular lifetime is dominated by chemical rather than electrochemical mechanisms. These mechanisms include irrecoverable chemical decomposition and recoverable interactions with cell materials. We conclude with recommendations for cell cycling protocols for evaluating stability of single electrolytes.
Export citation and abstract BibTeX RIS

This is an open access article distributed under the terms of the Creative Commons Attribution Non-Commercial No Derivatives 4.0 License (CC BY-NC-ND, http://creativecommons.org/licenses/by-nc-nd/4.0/), which permits non-commercial reuse, distribution, and reproduction in any medium, provided the original work is not changed in any way and is properly cited. For permission for commercial reuse, please email: oa@electrochem.org.
Growing interest in redox flow batteries (RFBs) for grid-scale energy storage has prompted development of new redox-active organic and organometallic molecules synthesized from commonly available raw materials containing earth-abundant elements such as carbon, nitrogen and oxygen. Flow batteries based upon these synthetic compounds might achieve lower electrolyte capital costs than current vanadium-based technologies without the scarcity risks associated with finite resources.1 To become a cost-effective solution for matching of intermittent renewable energy supply to demand, these flow batteries should retain most of their capacity over decadal time scales. As opposed to the elements of the periodic table, e.g. transition metals, traditionally used for the redox-active components of flow batteries, these new organic and organometallic compounds may be susceptible to molecular decomposition, leading to an additional mechanism for flow battery charge storage capacity fade.2 Typically, capacity fade in conventional flow batteries can occur through various mechanisms such as precipitation of reactant species or crossover of these species through the membrane.3,4 Some of these sources of capacity loss are theoretically reversible while others are not. Some are related to device engineering, such as electrolyte leakage, whereas others are intrinsic to the electrolyte chemistry. RFBs that rely upon electrolytes with different dissolved redox-active species on either side, such as the chromium/iron cell, suffer from irreversible crossover of these species unless their electrolytes are balanced by putting both species on both sides, thereby doubling the cost of active materials.5 a The all-vanadium RFB was developed to avoid these problems by having a single common redox-active species on both sides of the cell such that any asymmetric crossover of active species could be reversed by rebalancing the electrolytes by simple remixing.6 Other examples of capacity fade that can be recovered by electrolyte rebalancing methods include those due to heterogeneous side reactions, such as hydrogen evolution, or from homogeneous side reactions, such as species oxidation from surrounding air. Both of these side reactions can eventually limit the accessible state of charge (SOC) of one side, thereby limiting the capacity of the battery. For redox flow batteries with dissimilar active species in their two electrolytes, remixing is not an option; hence these systems require alternative rebalancing methods such as passing one of the electrolytes through a separate electrolysis cell to correct the SOC drift and recover lost capacity.7,8 Another form of capacity fade that may affect all types of RFBs is the precipitation of dissolved species.b This is a common problem for the vanadium flow battery due to the precipitation of vanadium pentoxide in the posolyte (positive electrolyte) at moderately high temperatures.9
All the capacity fade mechanisms mentioned above can also occur in RFBs with molecular active species. In addition to those mechanisms, however, these compounds can also decompose or convert into redox-inactive molecules, leading to irreversible capacity loss over time. To aid the development of improved compounds for flow batteries it is critical to refine experimental methods to differentiate between these capacity fade mechanisms and adopt metrics that make it possible to adequately compare electrolytes. The vast majority of flow battery studies published to date report capacity fade rates in percent per cycle; this rate has been used to suggest the expected lifetime of a hypothetical system cycled daily to provide grid scale storage. This metric may be appropriate for solid state deposition or intercalation battery systems because their capacity fade can be related to cycling-related mechanisms such as dendrite formation or mechanical electrode damage, respectively.10–12 In contrast, if loss of flow battery capacity is primarily due to decomposition of chemically unstable redox active species, then a temporal metric is more appropriate such as the capacity fade per day, introduced by Beh et al. in 2017.13 Moreover, lifetime comparisons between electrolytes are not well captured by a cycle-denominated metric unless several factors other than cycling regimen, such as concentration, reservoir size, flow velocity and membrane area, are standardized between the electrolyte chemistries being evaluated.c
For flow batteries to reach the decadal lifetimes that are ideal for grid storage, it is critical to separate and quantify the contributions of each source of capacity fade. To this end, methods for controlling certain contributions while measuring others are essential. As a phenomenon common to all redox flow batteries with unlike dissolved redox-active species on the two sides, crossover can be reduced or eliminated as a source of fade by symmetric cell testing.14 By using two separate reservoirs with identical redox active species concentrations, Milshtein et al. further demonstrated how this method could be used to study the capacity retention of a single electrolyte and pointed out the advantages of the method over bulk electrolysis such as improved mass transfer and elimination of cross contamination by other species.15,16 In the present study, we further develop the method with experimental variations that provide more specific information about possible causes of capacity fade.
We utilize reservoir volume differences to impose a capacity limiting side (CLS) and a non-capacity-limiting side (NCLS), such that the instantaneous fade rate can be uniquely attributed to the state of the CLS. We call this the unbalanced compositionally-symmetric cell method to reflect the fact that the volumes are unbalanced whereas the compositions are symmetric. Validation of the method is performed using a simple and robust case for which capacity fade is not expected, namely Fe2+/Fe3+. The method is then expanded to include cycling pauses at various SOC of the CLS to separately determine the stability of oxidized and reduced forms of the redox-active species. These pauses suggest that electrolytes containing either 2,7-anthraquinone disulfonic acid (AQDS) or 2,6-dihydroxy anthraquinone (DHAQ) lose capacity more rapidly while the molecules are held in reduced form than in oxidized form. In addition, we utilize pauses in electrolyte flow to demonstrate the interaction of the electrolyte with cell materials in the case of ferricyanide at high pH. Furthermore, we contrast two viologen-based examples to illustrate and quantify the benefits of molecular design for protection against decomposition mechanisms. Finally, the pros and cons of symmetric cell methods are discussed, and standard protocols are suggested for careful characterization of loss rates of novel flow battery chemistries.
Methodology
Cell assembly
All unbalanced compositionally-symmetric flow cell cycling tests were performed with a 5 cm2 cell (Fuel Cell Tech, Albuquerque, NM) equipped with POCO sealed graphite flow plates with serpentine flow fields. Each side of the cell contained a stack of four sheets of Sigracet SGL 39AA porous carbon paper that had been pretreated by baking in air at 400°C for 24 h. In most cases the cell was assembled with a Nafion N117 membrane pretreated by immersion in a blank electrolyte (i.e. missing the redox-active species) for at least 72 hours. Cells for alkaline electrolytes such as DHAQ or Fe(CN)6 contained Nafion membranes soaked in 1 M KOH, whereas those prepared for acid electrolytes contained membranes soaked in 1 M H2SO4. In contrast, cells prepared for neutral pH viologen-based electrolytes contained Selemion DSV (Asahi Glass Co., Ltd.) anion exchange membranes which had been soaked in 1 M NaCl. In all cases, Viton (PVDF) gaskets were used to seal the electrodes between the membranes and graphite flow fields. Flow of electrolytes at 100 mL/min. was forced with a Cole-Parmer Masterflex L/S peristaltic pump, which required a small length of Viton peristaltic tubing. All other tubing and electrolyte reservoirs were made from chemically resistant fluorinated ethylene propylene (FEP). An example of this setup is shown in Fig. 1a. Static cells were also developed for unbalanced compositionally-symmetric cell tests and the details for these can be found in the SI.
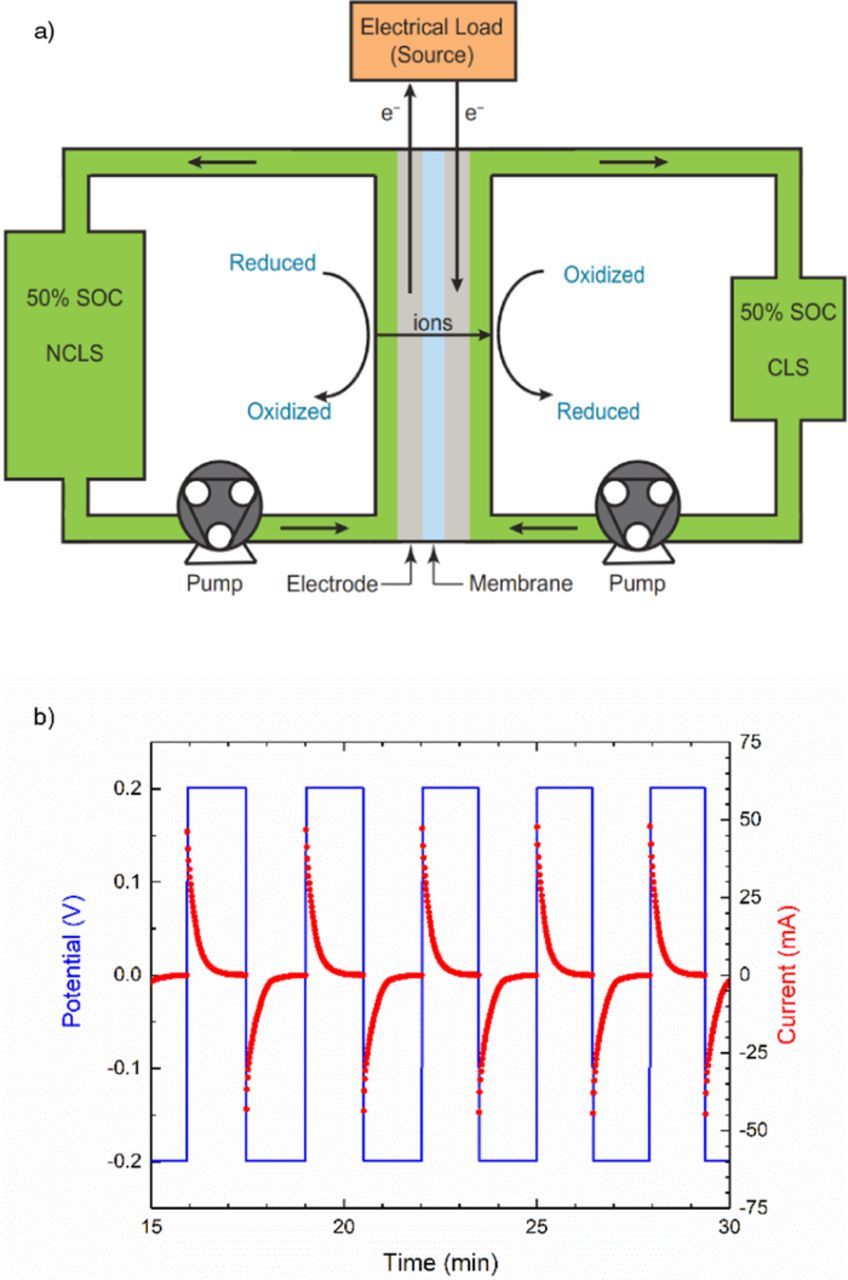
Figure 1. a) Schematic of symmetric flow cell. b) Example of potentiostatic symmetric cell cycling protocol.
Electrolyte preparation
All electrolytes were prepared in roughly 0.1 M concentrations to make comparisons as relevant to battery operation as possible while staying within the limits of solubility of all species. In most cases, 50% SOC electrolytes were prepared by charging a portion of initially-uncharged electrolyte in a full cell (against ferrocyanide in the case of DHAQ, against ferrocene in the case of viologen, and against hydrogen in the case of AQDS) until the theoretical capacity was attained or the current decayed to a steady state value typically under 5 mA, and then mixing this charged electrolyte in equal proportions with uncharged material. In the case of Fe2+/Fe3+, a 0.1 M 50% SOC solution was prepared directly by adding FeCl2 and FeCl3 to 1 M H2SO4. Similarly, K3[Fe(CN)6] and K4[Fe(CN)6] were mixed directly into 1 M KOH to make a 0.1 M 50% SOC [Fe(CN)6]4−/[Fe(CN)6]3− electrolyte.
Cell cycling protocol
Potentiostatic cycling of all cells was performed in a nitrogen-filled glove box with < 2 PPM of oxygen with a Biologic VSP 300 potentiostat. Unless otherwise specified, the potential limits were set to ± 200 mV to access over 99% of the CLS capacity. An example of this cell cycling protocol is shown in Fig. 1b. In all two-electrode symmetric cells, one reservoir was filled with an excess of 50% SOC electrolyte to make the other side of the cell capacity limiting. For high potential posolyte species such as Fe2+/Fe3+ and [Fe(CN)6]4−/[Fe(CN)6]3−, this excess was only marginal (10-20% more volume) to mitigate any possible effect of electrolyte asymmetry. For low-potential negolyte species such as AQDS and DHAQ, this excess was increased (roughly double the volume) to ensure that oxidation of the NCLS electrolyte by low levels of oxygen in the glove box would not lead to both sides becoming capacity limiting and fading at the rate of oxidation. In addition, small aliquots of 50% SOC electrolyte were occasionally added to the NCLS to confirm that the NCLS had not become limiting.
Ex situ testing
Cyclic voltammetry of cycled material was performed with a Gamry 3000 potentiostat using a silver/silver chloride reference electrode, a platinum wire counter electrode and a glassy carbon working electrode. For the data presented in this study, a scan rate of 100 mVsec−1 was used in all cases and the data were corrected by subtracting the background current of the supporting electrolyte. For the Fe(CN)6 UV-vis spectra, 4 μL of each electrolyte was diluted into 2 ml of 1 M KOH and the spectra recorded with 50 ms of integration time using an Ocean Optics Flame-S Spectrometer Assembly.
Results and Discussion
Symmetric cell method description and validation
Before using the unbalanced compositionally-symmetric cell method to characterize capacity fade due to reactant instability, it is necessary to validate and understand the limits of the method by using it on a redox couple that is known to be stable. To this end, the Fe2+/Fe3+ redox couple was selected as a control test case. If all other forms of capacity fade are controlled for, then a symmetric cell with this redox couple should be indefinitely stable. Eliminating all other sources of capacity loss is therefore essential to this method. A first step in this direction is to utilize potentiostatic modes of cycling with current cutoff values, rather than the typically-utilized galvanostatic cycling conditions with potential limits. The capacity realized during galvanostatic cycling with potential limits is directly related to the polarization resistance of the cell. This includes effects such as changes in membrane and electrolyte resistance, changes in mass transport conditions within the cell, and changes in kinetics due to, e.g., changes in electrode surface conditions. None of these effects relate to the amount of charge capacity available in the CLS of the cell. By using potentiostatic cycling with steady state current cutoffs approaching the background current, it becomes possible to access nearly 100% of the theoretical capacity with negligible sensitivity to changes in cell polarization resistance. As discussed later, in some cases it may be more appropriate to restrict the applied overpotentials to purposefully access significantly less than 100% of the capacity.
Other sources of capacity loss include those due to side reactions in the NCLS of the cell. With a pH-independent equilibrium potential of +0.77 V vs. SHE, this redox couple sits near the middle of the water stability window at pH 0. By constraining the applied overpotential within ± 0.500 V of the equilibrium potential of a 50% SOC solution, it is therefore expected that no water splitting side reactions will occur. To be even more conservative and still access above 95% of the theoretical capacity for this one-electron redox reaction, only ± 0.150 V is applied to the CLS of the flow cell in this case. Although oxidation of ferrous iron by atmospheric oxygen is not expected in acidic conditions, flow cell cycling was conducted within the glove box to standardize conditions across all chemistries. In the absence of such heterogeneous and homogeneous side reactions, we anticipate that the only remaining causes of capacity fade are crossover, precipitation, and electrolyte leakage/permeation. As mentioned previously, by using the same initial 50% SOC Fe2+/Fe3+ electrolyte on both sides of the cell with only a small excess volume on the NCLS, the net flux of iron species from one side to the other should be canceled and crossover induced capacity fade should be eliminated. It is, however, possible that large disparities in both half-cycle durations and individual ion permeabilities could eventually lead to differences in concentration between both sides, especially if the starting SOC deviates significantly from 50%. Potentiostatic cycling to SOC extremes produces larger concentration gradients across the membrane, which could lead to changes in overall concentration if one species crosses faster than the other. This effect would be reversed and nullified during the following half-cycle if the duration of the reverse SOC extreme is equal. Hence, it is theoretically possible for vestiges of crossover effects to remain in symmetric cell testing, but these effects should be negligible if the starting SOC is nearly 50% and starting volumes are nearly equal, or if a sufficiently thick membrane with sufficiently low permeability is chosen. If such crossover can be neglected, only decomposition and precipitation would remain as mechanisms that are intrinsic to the chemistry; neither of these is expected for Fe2+/Fe3+ at this concentration.
Regarding electrolyte leakage and permeation into cell materials, this can be overcome with judicious material selection and careful cell assembly. Although some variation between cell builds is to be expected, if the anticipated fade mechanisms are managed then a symmetric cell with this redox couple should not experience any capacity fade. A representative example of such unbalanced compositionally-symmetric cell data is shown in Fig. 2a. In this test roughly 5 ml of 0.1 M Fe2+/Fe3+ are placed in each reservoir for initial cycling. With equal volumes on both sides, it is unknown which side is capacity limiting. Hence, after 15 hours of cycling, 1 ml is added to one side and 3 ml added to the other to impose a capacity limiting condition on the smaller reservoir. With 6 ml of electrolyte in the CLS and 8 ml in the NCLS, the theoretical capacity of the cell is 57.9 C. The average reduction capacity measured over the remaining 15 days of the experiment is 56.1 ± 0.2 C, which is 96.9% of the theoretical capacity.
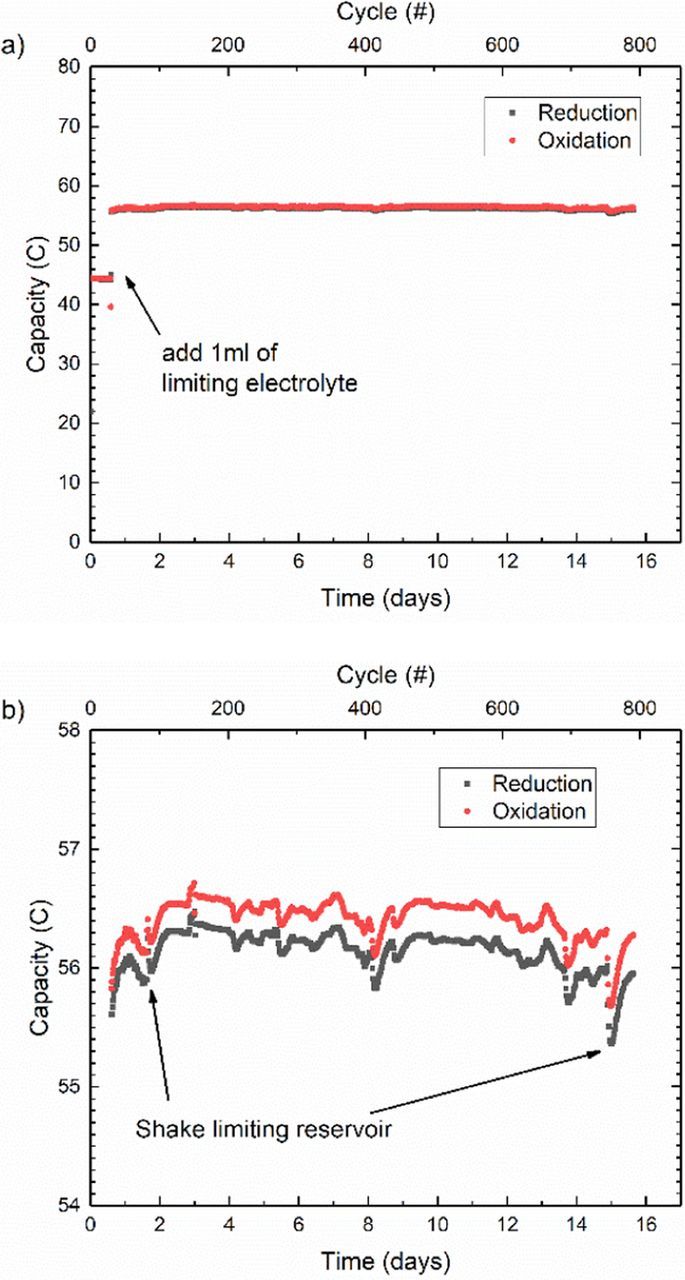
Figure 2. a) Unbalanced compositionally symmetric cell potentiostatic cycling of 0.1 M Fe2+/Fe3+ in 1 M H2SO4, b) with zoomed in vertical scale.
It is informative to zoom into the cycling capacity data as in Fig. 2b. This reveals important phenomena that alter the data from the ideal horizontal line. Firstly, the excessive noise in the data relates to the experimental setup and the inherent complexity of a flow battery. While capacity is contained within the electrolyte, it is ultimately measured via the diffusive mass transport of reactants to the electrodes. Hence, any change in accessibility between the reactants and the electrodes affects the measured capacity. Formation of stagnant zones in the reservoirs or permeation of electrolyte to small recesses in tubing junctions will contribute to losses in capacity. More importantly, any liquid that becomes stranded due to liquid droplets forming on the walls of the CLS electrolyte reservoir also lead to a spontaneous decrease in measured capacity. When the reservoir is manually shaken to allow the droplets to fall back into the accessible electrolyte, the capacity returns to the previous level, as shown in Fig. 2b. Counterintuitively, this capacity recovery happens over nearly a day and over several cycles, rather than in the expected incremental fashion expected for a discrete amount of liquid returning to the reservoir on a timescale shorter than half a cycle. This demonstrates how capacity measurements can be affected by other transient phenomena such as concentration equilibration due to droplets being sequestered in a particular state of charge. Although it is difficult to avoid the formation of droplets due to peristaltic pump pulsation and splashing, there are some sections of the data that do not appear to have this problem. Between day 10 and 11, the capacity fade seems regular with a rate of 0.038 ± 0.005%/day; however, this slope is different from those of other seemingly unwavering sections like between days 2.3 and 2.8, and between days 3.0 and 3.9. If instead, we merely take the endpoints to be the 'recovered' capacity after each shaking of the reservoir (days 2.2 and 15.6), then the overall fade rate between these points is closer to 0.031%/day. These numbers highlight the inherent ambiguity of selecting limits for determination of a true capacity fade rate in the presence of significant experimental noise.
Once that fade rate is determined, how can it be assigned to a specific mechanism for capacity loss? To the best of our understanding, there is no mechanism intrinsic to the chemistry that would lead to loss of concentration or redox activity of the dissolved species. Therefore, only asymmetric crossover or experimental variation due to cell build, such as leakage or permeation, would be suspected in this case. With a CLS reservoir volume of only 6 ml, however, 0.03%/day is equivalent to a loss of only 1.8 μL per day. We present these symmetric cell data to emphasize the experimental difficulty of characterizing stable electrolytes in flow cell geometries and to motivate the development of simpler and potentially higher accuracy systems such as the static cells described in the supplementary information.
The reader accustomed to working with full cells will immediately notice the difference between the reduction and oxidation capacity seen in Fig. 2, which initially suggests some form of side reaction or net crossover of active species. This apparent coulombic inefficiency, present to a certain degree in all the data in this study, relates to the steady state background current in each direction. In this case, this difference amounts to a relatively constant 0.24 C between the reduction and oxidation half cycles. The possibility of side reactions was eliminated by testing for and observing no dependence of this background current on applied overpotential. The possibility of crossover was also excluded due to the amount of hypothetical crossover required being substantially more than the total capacity of the system (0.24 C × 792 cycles = 190 C). More generally, the constant nature of the apparent current inefficiency is simply uncorrelated to any measurable fade rate and hence must be related to instrumental precision. Current offsets, which fall within the specifications of the potentiostat, were observed during CV measurements through a simple resistor and would account for the measured background currents responsible for the differences in capacity.d Fortunately, this systematic current bias has no effect on long term cycling trends such as capacity fade. As explained above, in this case the slow capacity fade is uncorrelated to the coulombic efficiency and the precision with which the fade rate can be measured depends on experimental noise due to the pumped electrolyte and cell variation. In cases where capacity fade is significant and becomes correlated to the coulombic efficiency, higher precision coulometry would reduce such systematic biases and could enable more quantitative determination of which operation – oxidation or reduction – is responsible for capacity fade.17–19 In the case of flow batteries with dissimilar electrolytes, these measurements are likely to be dominated by crossover of reactants. Alternatively, cycling pauses such as those presented in the next section can be used to gain similar information for flow battery electrolytes.
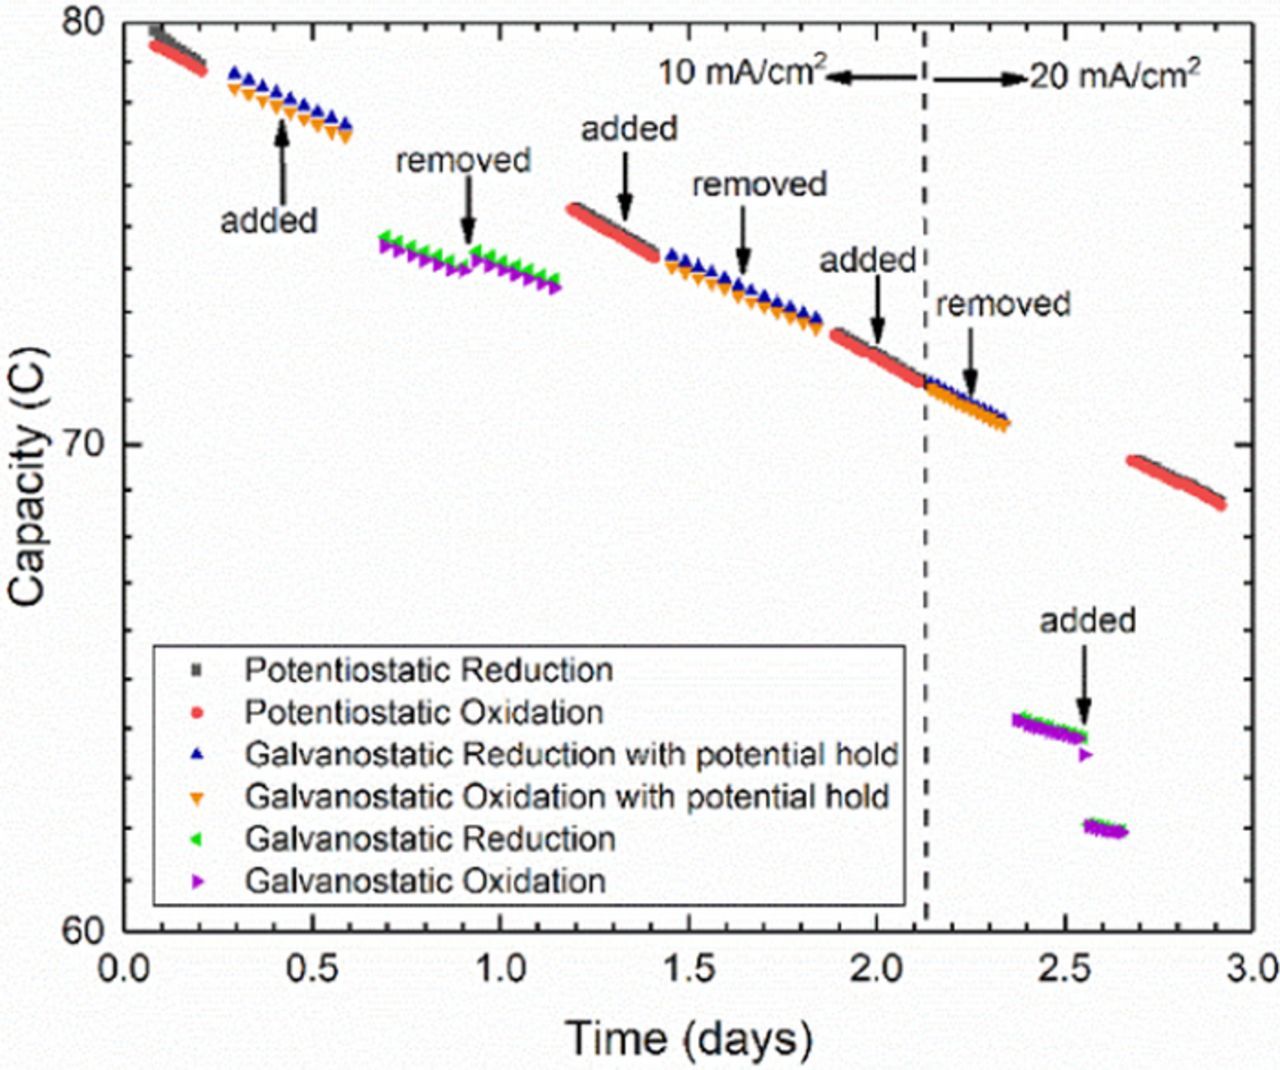
Figure 11. Semi-log plot of unbalanced compositionally symmetric cell cycling of DHAQ, showing equivalence of potentiostatic and galvanostatic cycling with same potential holds. In both cases cycling was performed by imposing voltage holds at ± 200 mV and switched when current density dropped to 1 mA/cm2. Galvanostatic conditions were started at 10 mA/cm2 and increased to 20 mA/cm2 after roughly 2 days. Vertical arrows indicate times at which a 0.1 Ω resistor was added and removed in series with the cell. The jumps in measured capacity demonstrate the dependence of measured cycling capacity on cell resistance when strictly galvanostatic conditions are used.
Pauses in cycling for investigating different states of charge of DHAQ
In contrast to the stability of transition metal ions, organic molecules such as DHAQ are expected to decompose under certain conditions. When paired with potassium ferrocyanide at pH 14, Lin et al. showed that DHAQ produces a 1.2 V battery with a previously reported fade rate of 0.1%/cycle when limited by the DHAQ negolyte.20 With no sign of decomposition of the oxidized form of DHAQ, and no sign of crossover into the posolyte, the authors attributed this fade rate to hydraulic leakage. When converted to a temporal metric, this yields a capacity fade of about 7.6%/day. As demonstrated above, this kind of leakage can be reduced to a very low level and would vary across cell builds. We observed similar fade rates during repeated tests with DHAQ symmetric cells, however (Fig. S2), and set out to reassess the possibility of chemical or electrochemical decomposition by introducing cycling pauses to hold the electrolyte in different SOCs.
With few exceptions, capacity fade is very nearly exponential in time (Fig. S2), which is characteristic of unimolecular decomposition kinetics. Consequently we report the instantaneous temporal fade rate as the slope of fits such as that in Fig. S2-d), i.e. –ΔlnC/Δt, where C(t) is the time-dependent capacity. With unimolecular kinetics, the instantaneous fade rate is independent of time and its reciprocal is the characteristic decay time constant τ; the half-life is τ ln 2. Thus the fade rate of the capacity of the 50% SOC 0.1 M DHAQ solution shown in Fig. S2 is 8.8%/day, or 0.23%/cycle; the corresponding time constants are 11 days and 430 cycles, respectively. For some experiments that are long enough for a substantial fraction of the initial capacity to be lost while the cycling regimen is punctuated by pauses at various SOC, the instantaneous fade rate is observed to change with time. This suggests kinetics that are more complicated than unimolecular; nevertheless we report the instantaneous fade rate that we measure and we leave it to future work to establish the kinetics and the time constants.
The results of a long DHAQ cycling experiment in which holds at various SOC were introduced are shown in Fig. 3. The data show capacity fade behavior for which electrolyte leakage is an untenable explanation. Each data point corresponds to one potentiostatic cycle and the horizontal axis is plotted as time to demonstrate the direct connection between capacity fade and time. The cell contains roughly 5 ml of 50% SOC electrolyte on the CLS, and 10 ml of the same 50% SOC electrolyte on the NCLS with an initial cycle period of roughly 20 minutes. With no induction time, the capacity starts to fade immediately at an instantaneous fade rate of 0.076%/cycle or 5.8%/day over the first segment of cycling data. The cycling is then stopped with the CLS electrolyte in an oxidized state, still being pumped through the cell. The cell is held in this state for 24 hours and then cycling is continued. As indicated in Fig. 3, no appreciable capacity was lost during this pause in an oxidized state. When cycling resumes, the instantaneous fade rate of the 2nd segment is slightly lower at 5.3%/day. Again, cycling is paused for 24 hours and pumping is continued, with the CLS electrolyte in a 50% SOC this time. A small amount of capacity (0.7 C) is lost during this pause. Cycling is then continued for one more day, exhibiting a fade rate of 5.6%/day, at which point cycling is paused again and pumping continued with the CLS electrolyte in a fully reduced SOC. The unbalanced compositionally-symmetric cell lost 11.2 C or 18%/day during this pause in a reduced state – considerably more so than during cycling. This entire process was replicated once more to verify the phenomena observed. The fade rates for the last four cycling segments decrease monotonically and equate to: 2.9%/day, 2.7%/day, 2.4%/day and 2.0%/day, respectively. The capacity loss for the 2nd set of pauses also reflects the same behavior as the first set, in which no measurable capacity fade was detected during a pause with the CLS in the oxidized state and only a small amount of fade during a pause at 50% SOC. Indeed, in both cases the CLS electrolyte loses more capacity when paused in a reduced state than it does during cycling and during pauses in other states. This can be diagnosed most quickly as an offset in the capacity data between periods of cycling. This indicates that something happens to the reduced form of DHAQ that causes it to become redox inactive, leading to capacity fade. This also explains why no sign of decomposition was observed in the previous study, which had focused purely on the oxidized form of DHAQ. To verify that this loss of capacity is neither an artifact of cycling conditions, nor merely a recoverable capacity loss due to SOC asymmetry caused by side reactions, nor a loss of CLS electrolyte volume due to leakage, the concentration of redox active species was measured via cyclic voltammetry. The CLS electrolyte after cycling has a smaller peak current than before cycling as shown in Fig. S3 of the supplementary information. After subtracting the KOH background, this change in peak current corresponds to roughly a 40% difference in concentration, which is slightly less than the total loss in capacity seen in the symmetric cell cycling. Due to the complexity of the flow battery system, this kind of post-mortem test is necessary to confirm whether there is a real loss of redox active material. The mechanism behind this loss of redox activity and the slight discrepancy between capacity measurements and CV measurements are beyond the scope of this work but are the subject of an ongoing study.
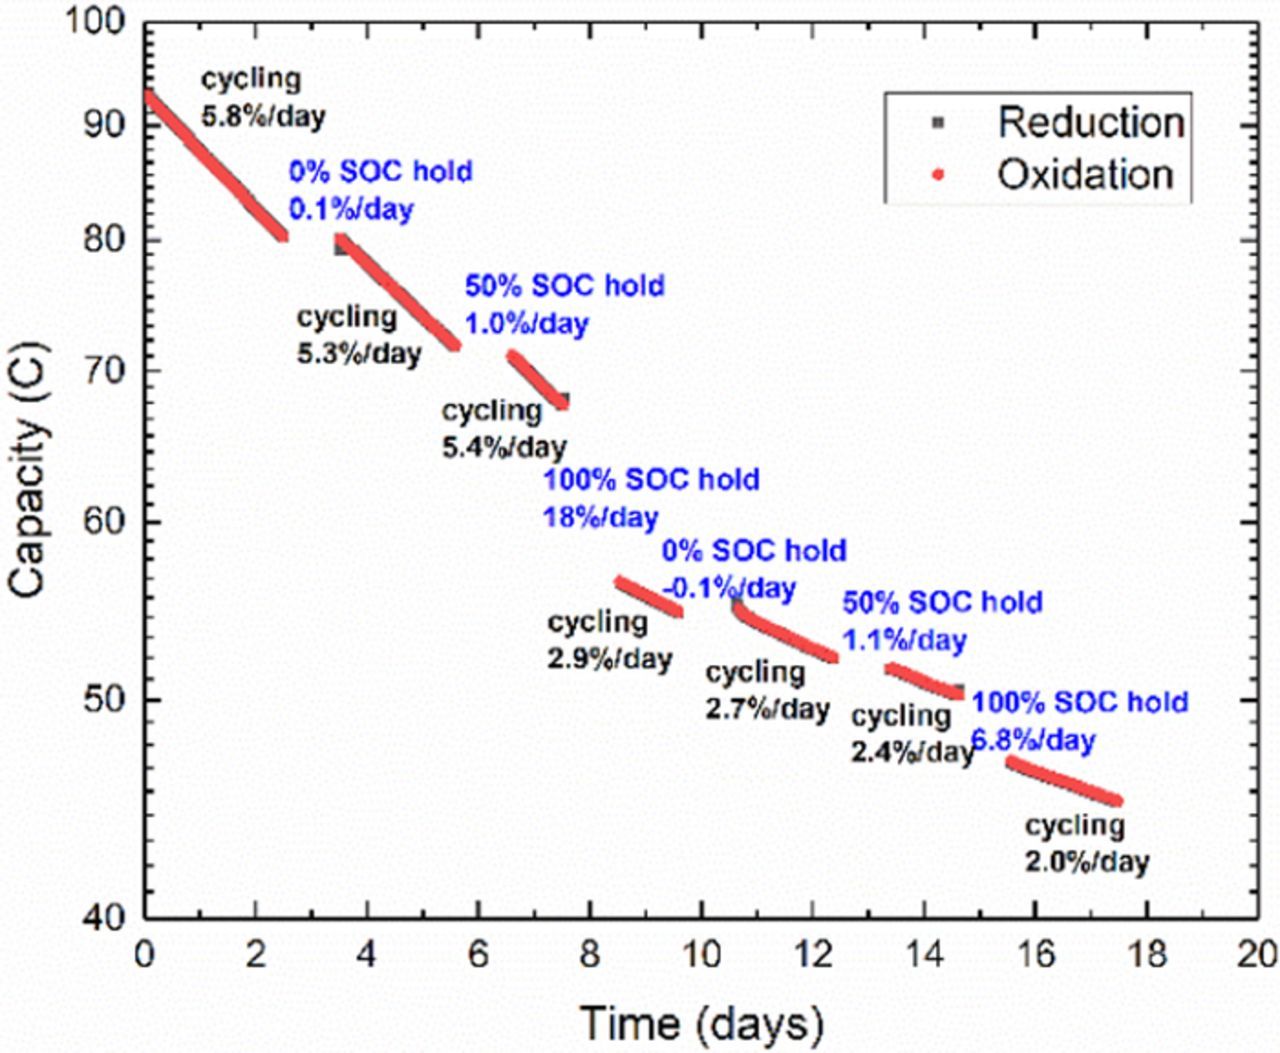
Figure 3. Semi-log plot of symmetric cell cycling of 50% SOC 0.1 M DHAQ in 1 M KOH with cycling pauses in different states of charge. Exponential decay time constants, τ, derived from slopes of each cycling segment denoted in black text. Capacity loss and SOC of CLS during 24 hour pauses denoted in blue text. Due to significant capacity loss, cycling rate increases from roughly 70 cycles/day during first segment, to 133 cycles/day during last segment. Change in slope after significant capacity loss indicates a higher order process that is not unimolecular.
That the instantaneous fade rate during cycling exhibits a gradual decrease as the capacity is lost in Fig. 3 suggests a mechanism more complicated than simple unimolecular decomposition, e.g. the decomposition rate may depend on the concentrations of oxidized and reduced species, and possibly on those of any decomposition products. Indeed, the fade rates during pauses indicate a superlinear relationship between fade rate and the concentration of reduced species. That the fade rate during pauses at 100% SOC is higher than during cycling suggest a purely chemical form of decomposition that is unrelated to the cycling rate but is time-denominated and related only to the SOC. Due to the significant loss in capacity, the cycle period has decreased from the initial 20 minutes to almost 10 minutes during the last cycling segment, which means that each molecule is being cycled twice as frequently at the end; yet the temporal fade rate has decreased compared to the beginning of the experiment. Clearly a cycle-denominated capacity fade rate is not at all representative of the expected lifetime of a flow battery based upon this material. If linear kinetic approximations of fade rates are to be used at all, then a time-denominated capacity fade rate would be more appropriate than a cycle-denominated fade rate.
In addition to using cycling pauses in different states of charge, restricting the accessed SOC range during cycling can also provide similar information. Although the SOC range can be constrained by increasing current cutoffs or restricting the time for which potentials are applied, this can also be done by changing the applied potentials. Typically, potential limits for electrochemical stability are established by cyclic voltammetry during reactant screening. The example shown in Fig. S3 indicates no side reactions within 300 mV of the equilibrium potential. Using the Nernst equation, equivalent overpotentials can be estimated for symmetric cell cycling, to achieve the desired SOC range. Similar to cyclic voltammetry in which stability is determined by expanding the overpotential range to look for side reactions, it is first recommended that stability limits be established by increasing overpotentials to look for variations in fade rate. In the first section of data in Fig. 4, large overpotentials (±300 mV) are applied during cycling, which lead to an instantaneous fade rate during cycling of 6.3%/day before the reduction overpotential is changed to −200 mV. This reduction overpotential is still sufficient to access over 99% of the capacity for this two-electron reaction, leading to a relatively unbroken trend in the capacity and fade rate (6.1%/day). The negligible change in fade rate further suggests that the reduced form of DHAQ is chemically unstable, rather than electrochemically unstable, because electrochemical instability should be very sensitive to applied overpotential. By the end of the second section the capacity has dropped to 87.8 C, at which point the reduction overpotential is changed to −100 mV and the accessed capacity drops to 80.9 C or 92% of the remaining amount. This slight constraint on the accessed SOC (i.e., the concentration of reduced DHAQ) decreases the fade rate during cycling to 4.4%/day. When the reduction overpotential is further changed to only −50 mV, the accessed SOC drops to 75% of the previous level and the fade rate during cycling drops to only 1.6%/day. This further demonstrates that the capacity fade seems to be a superlinear function of the concentration of the reduced state of the molecule. When the reduction potential is returned to −200 mV the capacity climbs to 85.4 C and the fade rate during cycling returns to 6.2%/day, which is quite close to the value of 6.1%/day recorded for the previous segment with an applied overpotential of −200 mV. The total amount of capacity lost during the restricted SOC range cycling amounts to (80.9-79.4) + (64.3-63.6) = 2.2 C, which is in reasonable agreement with the difference between the end of the first −200 mV segment and the beginning of the second −200 mV segment (87.8-85.4 = 2.4 C). This suggests that the capacity lost during the restricted SOC cycling is real, and that, when taken with ex situ evidence such as CV, full SOC range potentiostatic cycling is an effective way of directly quantifying real loss in capacity.
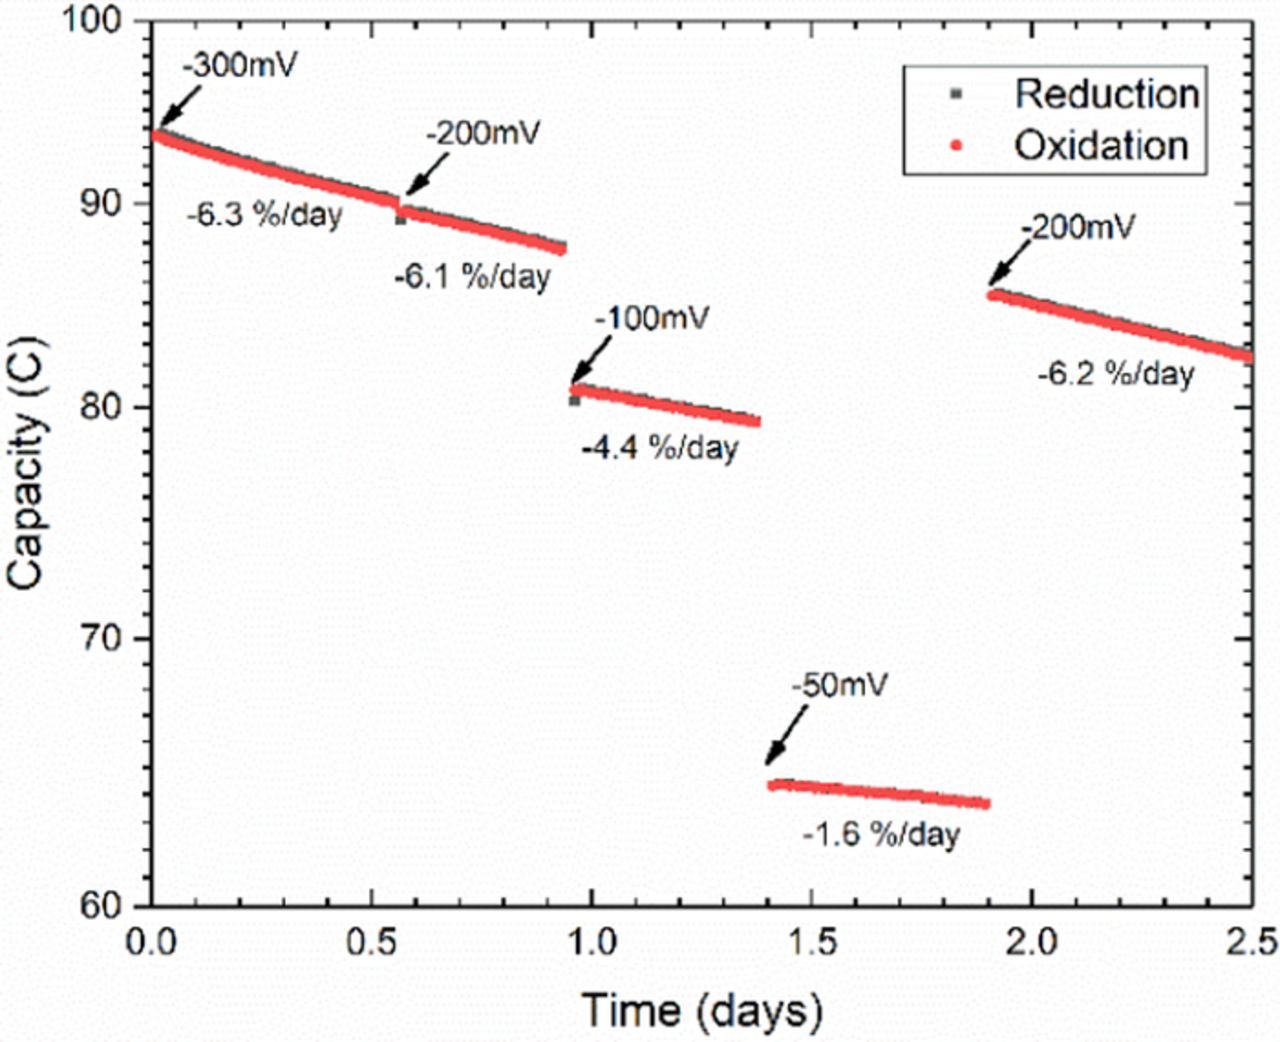
Figure 4. Semi-log plot of unbalanced compositionally symmetric cell cycling of 50% SOC 0.1 M DHAQ in 1 M KOH with changing reduction overpotential. Oxidation overpotential limits set at +300 mV throughout experiment, with changes in reduction overpotential limits indicated in graph. Demonstrates decrease in temporal fade rate due to restricted SOC range.
Transient phenomena and strategies for measuring slow capacity fade
The transient behavior observed in the case of Fe2+/Fe3+ appears to be primarily related to mechanical pulsation and hydraulically-induced noise that can be reduced with proper system design. It is possible, however, for such transient phenomena to be intrinsic to the chemistry under study or the methodology being used, as in the example provided in Fig. 5. Although this test uses the same cycling-pause-cycling methodology as in the previous example, the acidic AQDS electrolyte used here displays very different capacity fade behavior. For 5 ml of a 0.1 M limiting electrolyte the cycling capacity starts off at 105.5 C, which is slightly above the expected value for a two-electron reaction. The capacity fades immediately and regularly throughout the first cycling section. In subsequent sections, the cycling capacity contains reproducible transient behavior related to the SOC during the prior pause. After pauses in the oxidized state, subsequent cycling capacity has a positive curvature in which the fade rate starts high and then approaches a constant, steady state slope. After pauses in the reduced state, subsequent cycling capacity starts low but increases; the resulting positive slope monotonically decreases until reaching the steady state fade rate. Both of these phenomena seem to offset each other when the CLS AQDS electrolyte is in a 50% SOC, as observed from the steady slope upon initial cycling and after the pause in that state. In all cases, these transient occurrences comprise < 1% of the capacity and are therefore difficult to measure with ex situ methods. One possible explanation for such transient behavior could be adsorption or deposition of AQDS on the carbon paper electrodes. If such a process were not entirely reversible, it could potentially affect the total capacity over time scales longer than one cycle. Our working hypothesis for the transient capacity fade is molecular crossover to and from the CLS electrolyte. As explained previously, due to the temporarily enforced concentration gradients during pauses in 0% or 100% states of charge, there exists a strong diffusional driving force between the CLS and NCLS electrolyte. If the reduced form permeates more quickly through the membrane than the oxidized form, then both temporary phenomena can be rationalized. During a pause in the reduced state, if more H2AQDS crosses out of the CLS than is replaced by AQDS crossing in, then a loss of capacity will be observed. Conversely, when paused with the CLS in the oxidized state, less AQDS will cross out of the CLS than H2AQDS crossing in from the NCLS, leading to an increase in capacity. Although crossover of either form is very slow, the high concentration difference and long duration (3–5 days) of the pauses could lead to such an effect. This suggests that symmetric cell capacity measurements could also become a useful tool for characterizing the in-situ crossover of the reduced and oxidized forms of any redox active species. Crossover as the source of transient capacity is also consistent with the observation that no transient phenomenon is observed upon initial cycling and after a pause in 50% SOC, when the electrolyte compositions on the two sides of the cell are balanced. As demonstrated later, potentiostatic cycling capacity is unaffected by cell resistance and therefore thicker membranes or more membrane layers can be used to mitigate the effect of different crossover rates.
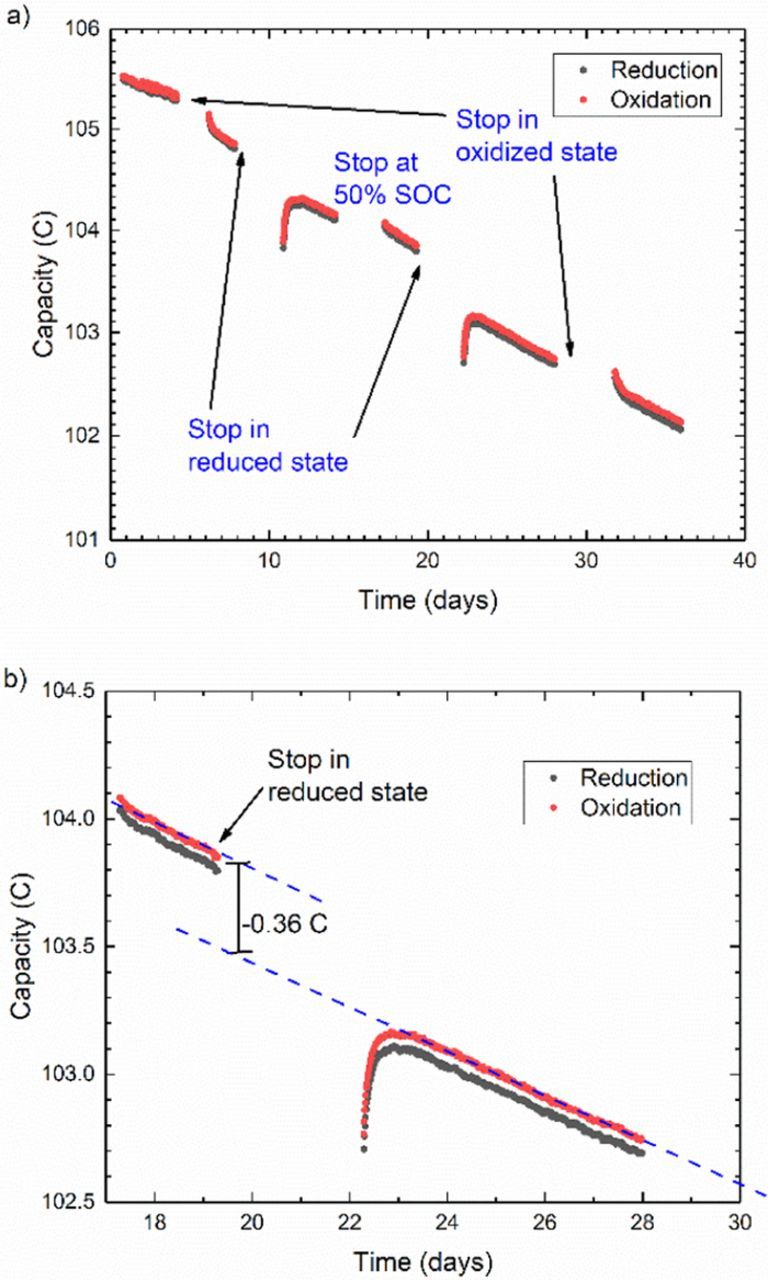
Figure 5. a) Semi-log plot of unbalanced compositionally symmetric cell cycling of 0.1 M H2AQDS/AQDS in 1 M H2SO4 with cycling pauses in various states of charge. b) Linear plot of close-up of data showing how fade is quantified during cycling pauses. Average cycling rate during test is 80 cycles/day.
This example of AQDS capacity fade is provided to illustrate a few critical challenges for characterizing the stability of new redox active molecules. Ignoring the pauses and transient behavior, the overall fade rate calculated from the slopes of all linear sections averages to 0.08 ± 0.02%/day. Accurately determining such a slow rate of capacity fade therefore requires very long cycling time, especially when transient phenomena such as those seen here are present. Cycling pauses were also imposed to determine the source of the capacity fade, as was done for DHAQ. Due to the transient behavior and much slower fade rate of AQDS, these pauses were extended up to 5 days to accentuate any differences among the fade rates. To quantitatively compare the amount of fade during these pauses it was necessary to fit each linear section of data independently and compare the vertical offset between the fitted lines. This vertical distance would then be divided by the duration of the pause and then combined with the average fade rate during cycling to give a fade rate during the pause. Although pauses in a reduced state of charge consistently led to more capacity fade (roughly 0.2%/day), the case is not so clear for other states. More pauses of even longer duration would be needed to obtain sufficient statistics, but this experiment was stopped after 36 days due to hardware malfunctions. Maintaining controlled experimental conditions for such extensive periods is challenging; furthermore, introducing pauses in cycling further complicates the experiment because no data are collected during that time and any unexpected sources of noise would not be revealed. Fortunately, in this case the hydraulically-induced noise appears to have been minimal compared to the 0.08%/day fade rate.
Although significantly lower than that of DHAQ, the fade rate of AQDS would still amount to a substantial loss over the first year of flow battery operation. In both cases, capacity is lost over time during cycling pauses in the reduced form, indicating a chemical instability mechanism. In the case of DHAQ the loss was sufficiently large to be verified via cyclic voltammetry. In the AQDS case however, only about 3% of the capacity was lost over the course of the 36-day experiment, indicating a small concentration change that would be difficult to verify via other experimental methods. Moreover, as more stable molecules are developed, it will become necessary to quantify even slower rates of capacity fade and decomposition. One way to do so would be to adopt accelerated stress testing procedures. If a purely chemical form of decomposition is expected, then elevated temperatures could be used. If electrochemical instability is suspected, then more rapidly cycling cells could be utilized. Both methods were implemented in the case of AQDS.
Instead of using symmetric flow cells with large electrolyte volumes due to unavoidable tubing and reservoirs, small static cells were developed akin to coin cells for rapid cycling of materials. This cell, pictured in Fig. S1, was used for testing the fade rate of AQDS using the same potentiostatic cycling conditions and same capacity limiting symmetric cell methodology as with the flow cell case. The low experimental noise in the capacity data in Fig. S4 attests to the hydraulic stability of the static cell. With only a tiny volume of electrolyte imbibed directly into the electrode the cell achieved roughly 35 cycles per hour. In contrast, the flow cell test reported in Fig. 5 averaged only about 3 cycles per hour. The fact that both cycling tests measure similar temporal fade rates of around 0.1%/day (See SI) gives further support to our conclusion that the capacity fade is time-denominated. This order of magnitude example also underscores the need for standardizing parameters such as volume and concentration when using a cycle-based metric.
Another way of confirming chemical decomposition mechanisms is by looking for signs of decomposition after storage of electrolytes. For slowly decomposing species such as AQDS, this process can also be accelerated and analyzed for Arrhenius behavior by storage at elevated temperature. The example in Fig. S5 provides additional evidence for the chemical instability of the reduced form of AQDS after storage for two weeks at 45°C. The appearance of new peaks and the decrease in integration of the original AQDS aromatic peaks in the NMR spectrum of the sample stored in the reduced form both indicate decomposition.
Material interactions and pH effects: stability of Fe(CN)6
One advantage of flow cells over static cells is the possibility of pumping most of the electrolyte into the reservoirs during cycling pauses and the ability to visually inspect electrolytes and take aliquots for ex situ testing. This permits additional diagnostic methods for understanding sources of capacity fade such as the possibility of material interactions as in the case of Fe(CN)6 described here. In the first incarnation of this experiment, the CLS of the symmetric flow cell is filled with 4 ml of 50% SOC 0.1 M K4[Fe(CN)6] /K3[Fe(CN)6] in 1 M KOH, while the NCLS contains 6 ml of the same electrolyte. It can be seen in Fig. 6a that the capacity starts off as expected for this one-electron reaction, but after roughly 4 hours, the capacity begins to decay exponentially at an instantaneous rate of 67%/day, regardless of whether cycling is paused with the CLS electrolyte in an oxidized or a reduced state. As with the other redox-active compounds presented thus far, this behavior suggests some form of chemical capacity fade mechanism independent of electrochemical cycling that, in this case, may seem to affect both forms of Fe(CN)6. This is not the case however. The initial few hours of stable cycling suggests that the capacity of the CLS reservoir can always be accessed if there is sufficient capacity in the NCLS. As the cell lost most of its capacity, the electrolytes lost their initial clear yellow coloration. A post-mortem UV-vis absorption spectrum of both CLS and NCLS electrolytes showed mostly ferrocyanide with very little ferricyanide present. This indicates a heterogeneous or homogeneous side reaction that reduces the ferricyanide to ferrocyanide. This reaction would produce an asymmetry in the SOC and, at some point, make both reservoirs capacity limiting. This is illustrated in Fig. 6b, where the accessed capacity of each electrolyte is the distance along each axis traversed by the projection of the diagonal arrow. At the start of the experiment, t0, the entire SOC range of the CLS and only a fraction of the NCLS is cycled. As time progresses, excess ferricyanide in the NCLS is spontaneously reduced to ferrocyanide, restricting the SOC range of the NCLS and moving the arrow to the left in the SOC diagram.e Once there is no longer any excess of ferricyanide in the NCLS at time t1, both sides become capacity limiting and the left point of the arrow reaches the left top corner of the SOC diagram. At this point, spontaneous reduction of ferricyanide shifts the arrow further to the left, e.g. t2, restricting the SOC range of both sides and causing precipitous capacity fade. It is important to distinguish two separate capacity fade regimes in this experiment. Although the initial portion of the data is relatively stable compared to the exponential decay observed after both sides become limiting, it does exhibit some capacity fade. This 'apparent capacity loss' may be due to a change in the open circuit potential of the cell, as described by Chen et al.3 As the ferricyanide in the NCLS is reduced, the average SOC and therefore equilibrium potential of the electrolyte changes. This affects the overpotential applied during cycling and, consequently, the capacity accessed. This was termed an 'apparent' capacity fade, as opposed to real capacity fade, because it can be compensated for by changing the applied potential. Once both sides become limiting, however, the capacity fades more quickly, following an exponential decay curve, and no change in cycling conditions can restore this lost capacity. Fortunately, as described later, in this case the capacity fade is reversible by other means.
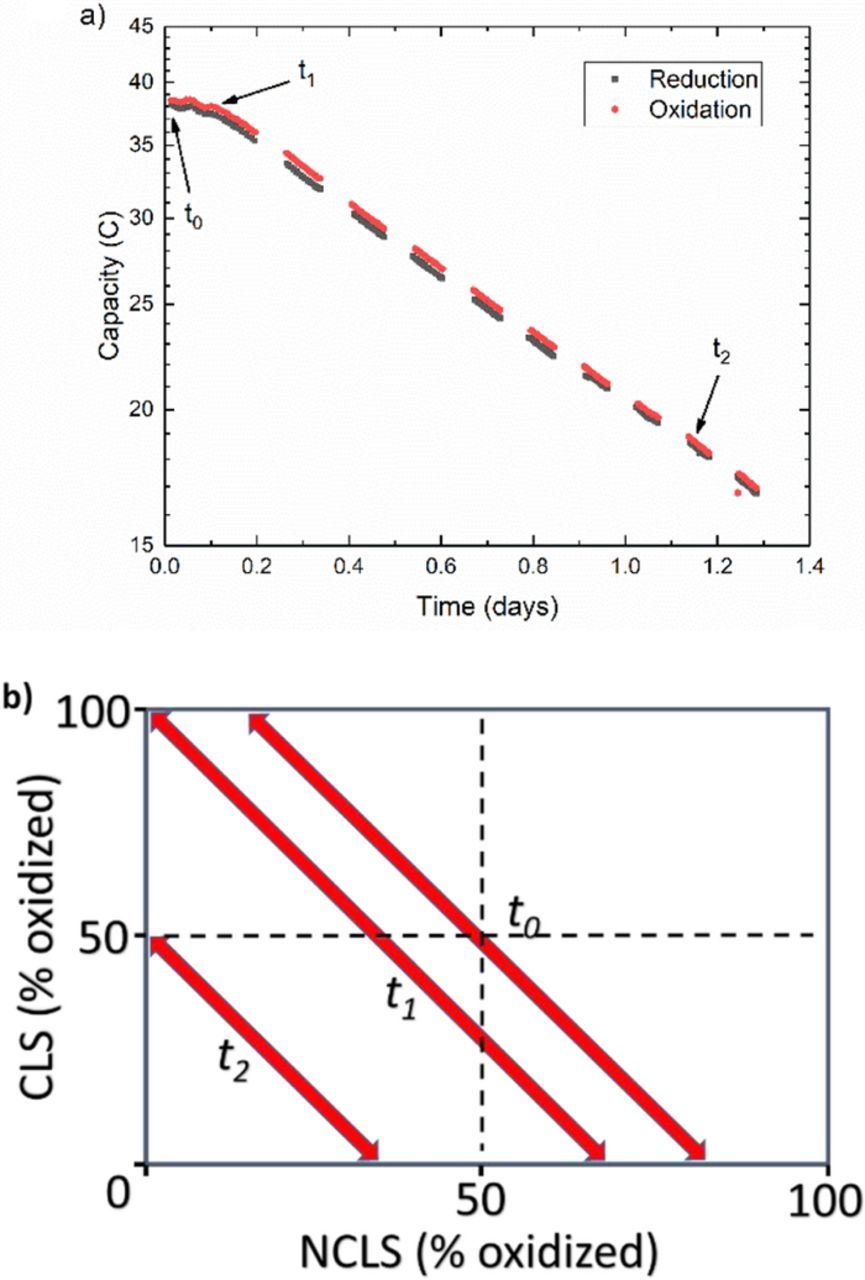
Figure 6. a) Semi-log plot of unbalanced compositionally symmetric cell cycling of 0.1 M K4[Fe(CN)6] /K3[Fe(CN)6] in 1 M KOH showing capacity fade rate that is unchanged during cycling pauses in alternating reduced or oxidized states, starting with a pause in the oxidized state, b) Representation of temporal evolution in accessed SOC in both CLS and NCLS for the same cycling data, where each time point tn denotes a time point from cycling data in part a) and length of arrows signifies real cycle capacity, i.e.: Capacity and arrow length at t2 are half of initial at t0.
In the 2nd incarnation of this experiment, the same composition of initial electrolytes was placed on both sides of the cell, with 5.5 ml on the CLS and 7 ml on the NCLS to verify the same initial stable capacity phase as before, as shown in Fig. 7. After about 5 hours, which we interpret as the point at which both sides become capacity limiting, the capacity fade rate becomes high during cycling periods with an instantaneous rate of roughly 45%/day. In this experiment, however, the electrolytes were occasionally pumped out of the cell and into their respective FEP reservoirs during cycling pauses. The first instances of these empty cell pauses show a slight positive effect on capacity retention, as indicated from the dashed blue linear fit line to the third cycling segment. To accentuate this effect, the empty cell pause was repeated for a much longer duration. During this nearly 16 hour pause, the cell lost only 7% of its capacity, in contrast to the preceding instantaneous cycling fade rate of 43%/day. This decrease in fade rate when the cell is emptied implies an interaction between the electrolyte and the cell materials. Moreover, the 7% of lost capacity corresponds roughly to the amount of electrolyte (∼400 μL) that typically remains imbibed in the electrodes and is not pumped out of the cell – this suggests that the electrodes are the cell materials reducing the ferricyanide.
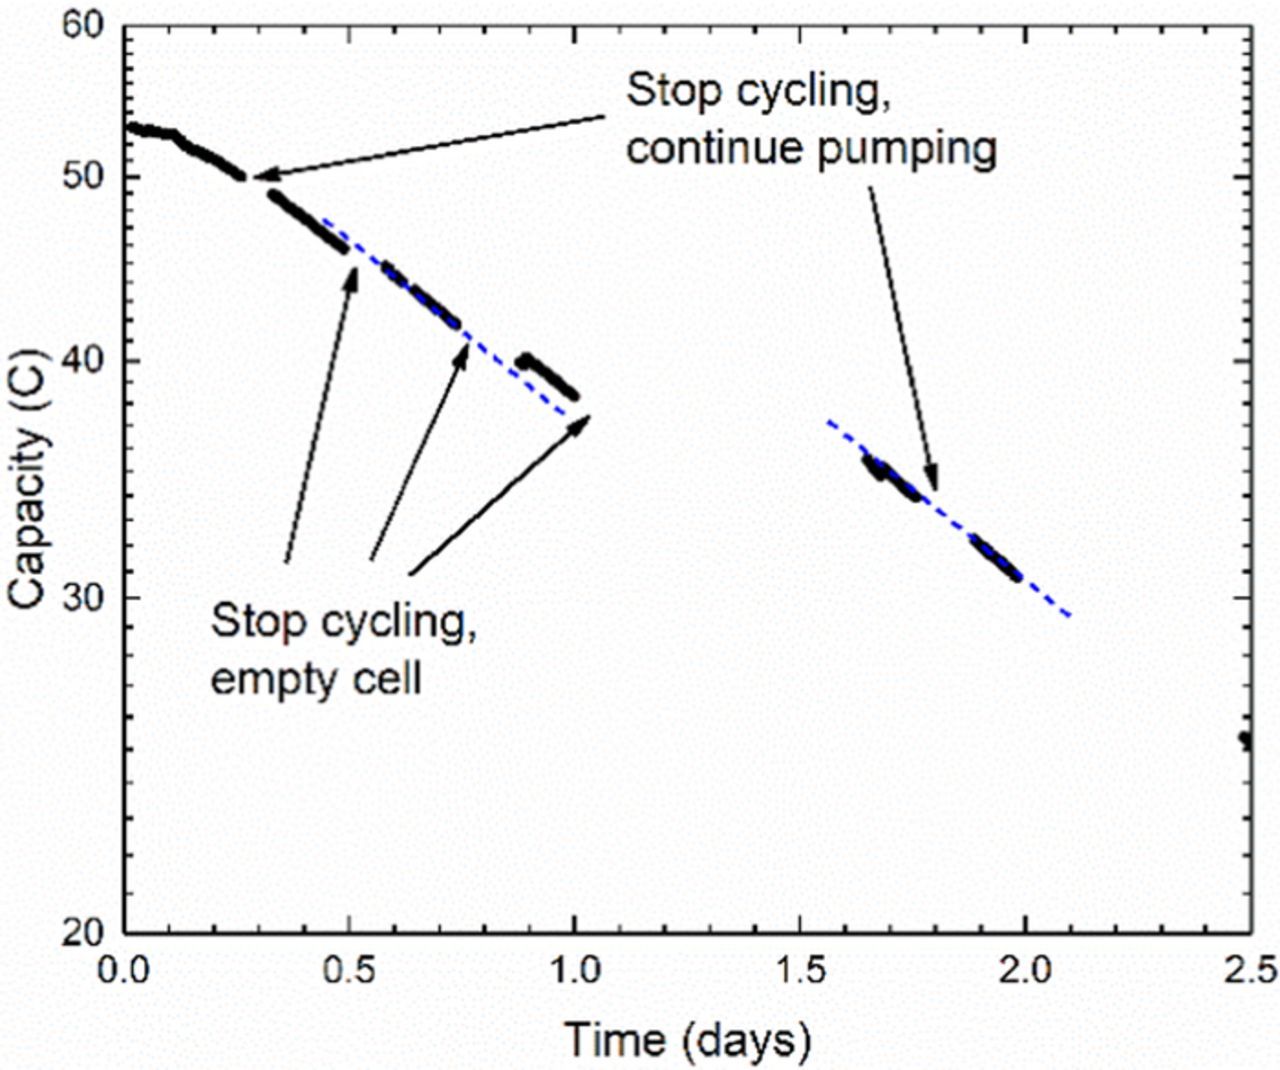
Figure 7. Semi-log plot of unbalanced compositionally symmetric cell cycling of 0.1 M K4[Fe(CN)6] /K3[Fe(CN)6] in 1 M KOH showing capacity fade rate is decreased during pauses when pumping is stopped, cell is emptied, and electrolyte is kept in reservoirs. Blue dashed line is linear fit to clarify offset before and after third sections of cycling, and lack of offset between last two cycling segments.
The reduction of ferricyanide to ferrocyanide aided by carbon paper electrodes was established more systematically in a subsequent experiment. In this case, a symmetric cell was loaded with 6 ml of 50% SOC electrolyte on each side and cycling begun immediately. Meanwhile, 6 ml of the same electrolyte was also stored in two falcon tubes. In one tube, the same amount of electrode material as is used in the cell was immersed into the electrolyte at the same time as electrolytes were pumped through the cell. Some manual shaking of the stored electrolytes was performed to promote a homogeneous concentration. Both visual inspection and UV-vis spectrophotometry were used to compare the electrolytes before and after cycling and storage. Cycling capacity had degraded to nearly nothing after roughly a day (Fig. S7). Both the electrolytes in the cell looked nearly colorless and visually identical after cycling (not shown), as did the electrolyte stored with the carbon paper (Fig. S8). All electrolytes were analyzed spectrophotometrically after roughly 33 hours, and compared with freshly prepared 0% SOC (0.1 M ferrocyanide) and 100% SOC (0.1 M ferricyanide). As displayed in Fig. 8a, spectra from both electrolytes overlay nearly perfectly with that from the pure ferrocyanide and show no signs of ferricyanide remaining. Similarly, the initial 50% SOC electrolyte stored with carbon paper also exhibits the same behavior, as seen in Fig. 8b. As a final verification that the ferricyanide is not destroyed but is simply reduced to ferrocyanide, cyclic voltammograms of final electrolytes were compared to that of a 0.1 M ferrocyanide solution. The voltammograms, overlaid in Fig. 8c, confirm the nearly equivalent redox activity of all electrolytes.
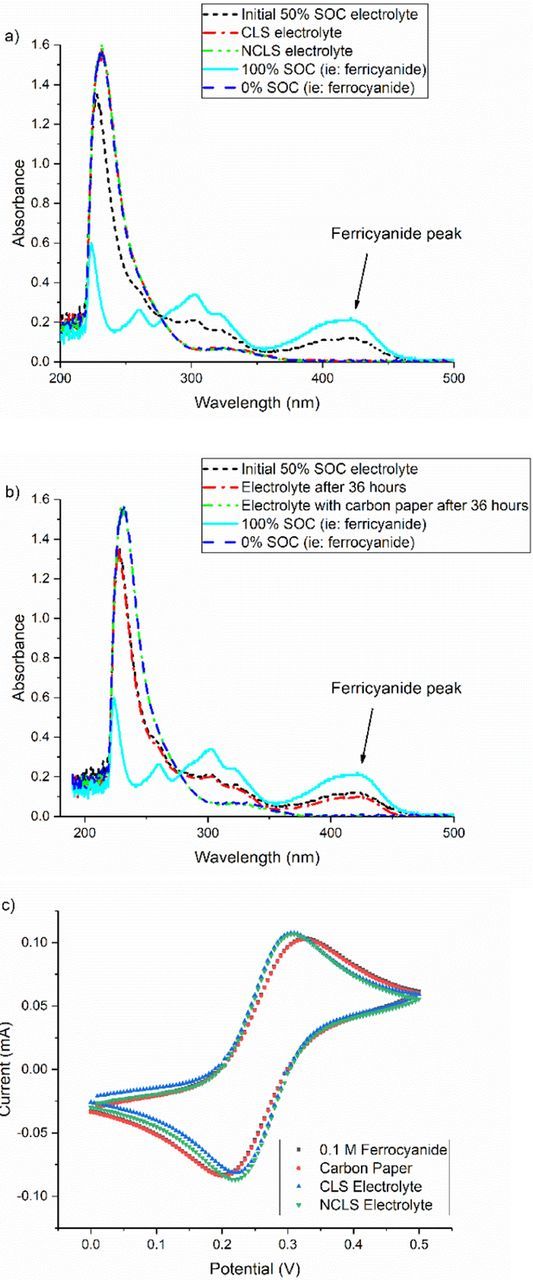
Figure 8. UV-Vis spectra comparing 0% SOC 0.1 M [Fe(CN)6]4−, 100% SOC 0.1 M [Fe(CN)6]3− and initial 50% SOC 0.1 M K4[Fe(CN)6] /K3[Fe(CN)6] electrolyte with a) CLS and NCLS electrolytes after symmetric cell cycling, and b) after immersion of carbon paper. c) CV of ferrocyanide, electrolyte stored with carbon paper and cycled electrolytes.
The exact mechanism by which ferricyanide is rapidly and heterogeneously reduced to ferrocyanide when in contact with carbon paper is currently being investigated. It does, however, relate to the potential vs. pH behavior of the [Fe(CN)6]4−/[Fe(CN)6]3− redox potential vs. the water-splitting window, as suggested by the slower capacity fade at pH 12 depicted in Fig. S9.
This example was chosen because of its importance to several existing flow battery chemistries,21–23 because the spontaneous reduction of ferricyanide can lead to confusing results if this redox couple is paired with other reactants in a full cell. The capacity of such a cell would be expected to fade at similarly drastic rates as seen here once the ferricyanide ceases to be in excess. In addition, regardless of ferricyanide excess, the spontaneous reduction would always add to the charging capacity of such a cell without enhancing the discharging capacity and would therefore lead to lower current efficiency. This effect needs to be considered when attempting to deconvolute other sources of current efficiency loss such as crossover. Fortunately, this spontaneous reduction is not an irreversible decomposition of the redox-active compound and would not necessarily affect overall battery lifetime, as it can be reversed by rebalancing methods such as electrolysis. It should be noted, however, that Fe(CN)6 may also suffer from irreversible decomposition due to loss of CN− groups and eventual formation of iron hydroxide at high pH.24–27 These reactions are expected to occur at much longer timescales than those studied here.
Redox active molecule protection: A viologen-based example
The examples provided thus far may connote doom and gloom for organic-based redox flow batteries; however, none of the molecules described previously were specifically designed for long lifetime. If the mechanism for molecular decomposition is known, then strategies may be developed to protect against the mechanism. The addition of protective functional groups to a redox active molecular core is one such approach. For example, Beh et al. used bis(trimethylammoniopropyl) (BTMAP) functional groups to simultaneously enhance the aqueous solubility and stability of viologen.13 Beh et al. hypothesized that the coulombic repulsion imparted by the charged ammonium end groups would suppress the bimolecular interaction that is known to lead to viologen dimerization and decomposition. BTMAP functionalization leads to extremely high capacity retention as illustrated by the comparison between the one-electron reduction of methyl viologen and BTMAP-viologen in Fig. 9. Whereas the capacity of the methyl viologen symmetric cell faded at a rate of roughly 1.5%/day, no measurable capacity fade was observed for the BTMAP-viologen. Due to the remarkable stability of BTMAP-viologen and the inherent capacity fade measurement limits discussed previously, accelerated stress testing may be necessary for an estimate of the lifetime at room temperature.
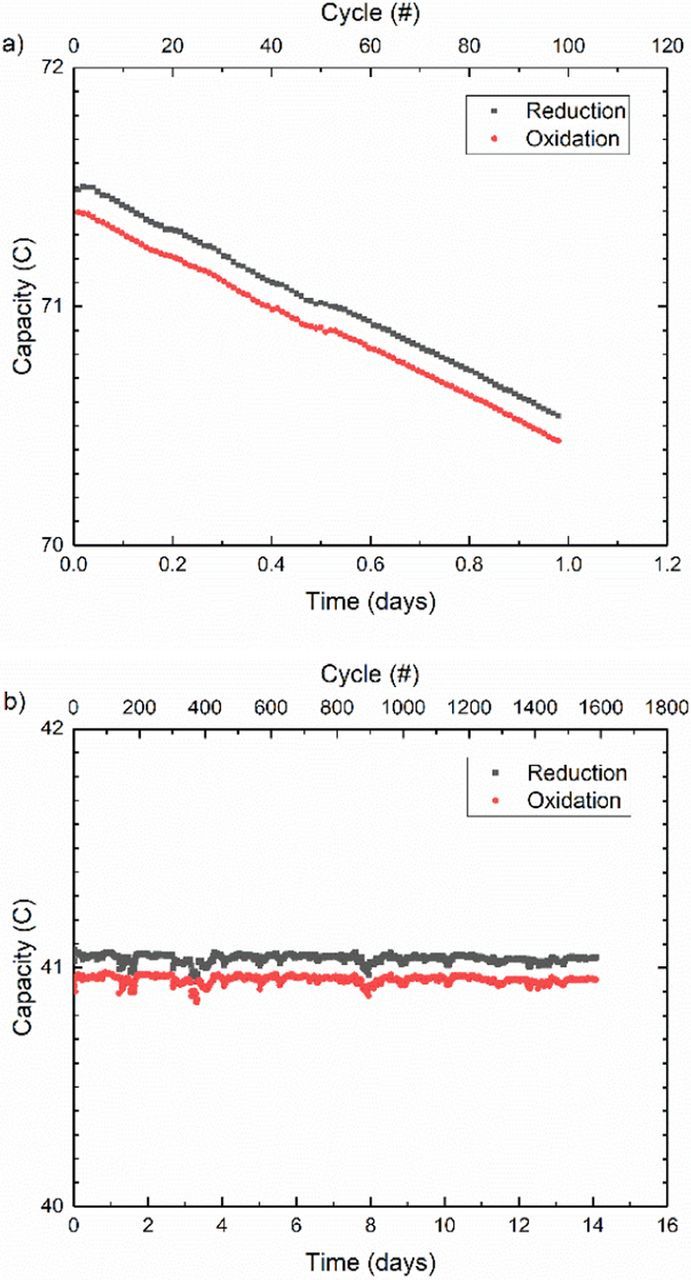
Figure 9. Comparison between unbalanced compositionally symmetric cell cycling of a) 8 ml of 0.1 M Methyl Viologen in 1 M NaCl and b) 5 ml of 0.1 M BTMAP-Viologen in 1 M NaCl.
Another advantage of using symmetric cells is the ability to know the overpotential being applied to the electrolyte under study, as opposed to the unknown overpotential split when using dissimilar electrolytes with different kinetics and mass transport properties. This permits investigation of stability limits much like in cyclic voltammetry with a three-electrode cell. Although BTMAP functionalization can protect the singly reduced form of viologen, the doubly reduced compound is still expected to be highly unstable. Using the same CLS electrolyte that was cycled stably in Fig. 9b, a new test was performed to probe this second reduction step. With a small aliquot removed between tests the cycling begins with roughly the same stable capacity. The potential limits are then increased in steps from ± 150 mV, to ± 200 mV, ± 250 mV and ± 350 mV. These steps only lead to marginal gains in capacity as displayed in Fig. 10. Once the potential is increased to ± 450 mV, however, the capacity increases from near 40 C to roughly 55 C, and then to 65 C once the potential is raised to ± 500 mV. At this point the capacity begins to fade rapidly until the cycling potential is reset to the original ± 150 mV. While insufficient to convert all the BTMAP-viologen molecules into their doubly reduced forms, the potentials applied demonstrate the instability of the doubly reduced form. Moreover, the loss of redox active material is permanent. The capacity lost during large overpotential cycling was roughly 5% of the initial 65 C. When stable cycling is recovered, the capacity has decreased from the initial 39 C to 37 C, a similar loss of roughly 5%. Hence, destroyed molecules remain destroyed, but surviving molecules remain redox active.
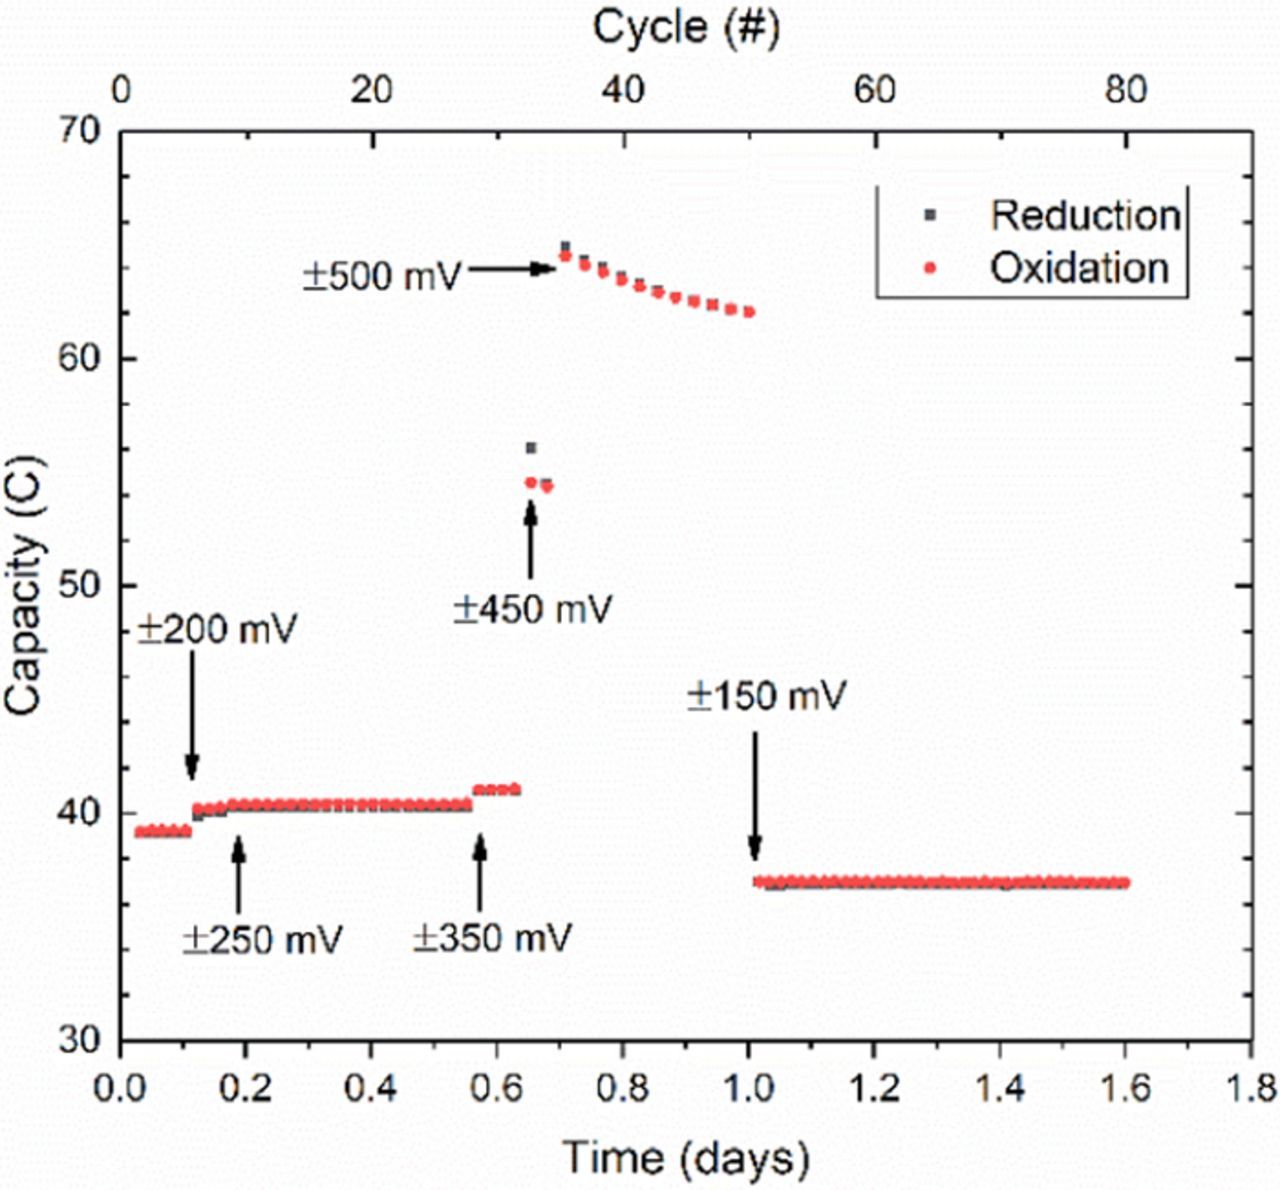
Figure 10. Unbalanced compositionally symmetric cell cycling of 5 ml of 0.1 M BTMAP-Viologen in 1 M NaCl at increasing overpotentials to access 2nd reduction step. Annotations indicate points at which cycling overpotentials were changed.
Recommendations and implications for the field
Both galvanostatic cycling conditions and %/cycle metrics are inherited from the solid-state battery field. In these systems, the rate at which ions are intercalated or deposited to and from electrode structures may impact the lifetime of the battery and hence galvanostatic cycling is used to control these rates. In the case of intercalation batteries, large current spikes could lead to irreversible damage to the electrodes, whereas for deposition-based batteries higher rates may lead to undesirable dendrite structures causing early battery failure. For redox flow batteries with permanently dissolved active species, these kinds of problems are not expected. Capacity fade measured in %/cycle is relevant for solid-state batteries for the same reasons. For flow batteries capacity-limited by crossover of reactants this metric may also be indirectly relevant because crossover mainly occurs during cycling (and therefore pumping) of reactants. Even for these systems, however, cycle-based fade rates cannot be a meaningful basis of comparison unless other parameters that relate to total capacity, such as volume and concentration, are standardized. Claims of high capacity retention such as the 0.0001%/cycle observed for the fast-cycling symmetric AQDS static cell may seem impressive, but this becomes irrelevant for long term applications if the species decomposes irreversibly at a rate of 0.1%/day. Although this rate is significantly slower than the rate of bromine crossover in a full AQDS/Br2 cell,3 it is an important underlying limitation that cannot be offset by flux balancing or electrolyte rebalancing methods.28,29 Ideally, each novel electrolyte being developed should be individually characterized to identify such fundamental limitations to RFB lifetime. To the authors' knowledge, thus far, no data in the RFB literature and none of the results in this study indicate any causal relationship between the number of times a dissolved redox active species is cycled and the capacity retention of a single electrolyte. For this reason, we stress the importance of using temporal or calendar fade rates for characterizing the stability of novel electrolytes. When paired together and used in a full cell, the stability of the shortest-lived active species may be the primary contributor to capacity fade. Unless each electrolyte is known to be independently stable, temporal fade rates should be included in full cell studies.
As in the choice of cycling metrics, cycling conditions should also be selected based on the parameters to be characterized. On one hand, purely galvanostatic cycling or constant-power cycling may be appropriate for holistic simulation of long-term battery performance and apparent capacity retention, which includes cell resistance and other stack related effects. On the other hand, if the purpose of cycling is to characterize the true charge capacity retention of a full cell or the stability of a single electrolyte, then the cycling conditions should be chosen so as not to be affected by parameters unrelated to this capacity. Galvanostatic cycling is not ideal for deconvoluting different sources of real capacity fade due to the confounding effects of cell polarization resistance that change the SOC at which the voltage limits are reached, leading to artifacts in the measured capacity. Apart from using ex situ methods, the most direct way of characterizing the true capacity of the CLS of a cell is with a potentiostatic charge and discharge until a steady state background current is reached. If large initial current spikes like those shown in Fig. 1b need to be avoided due to hardware current constraints, then galvanostatic cycling with potential holds at the end of every half-cycle can also be used. Such cycling can also be useful for tracking the evolution of oxidation and reduction voltage profiles. Beside this, the only difference between this and potentiostatic cycling is the time distribution of the applied potential. Hence, these methods can be used interchangeably as long as the capacity fade is not sensitive to the applied overpotential. This is the case for DHAQ, for which the capacity fade was previously shown to be a function of the state of charge and independent of the applied overpotential. Using the same potentials and background current cutoffs, the two methods yield the same capacities and fade rates during symmetric cell cycling of DHAQ as shown in Fig. 11. To prove that these methods are unaffected by changes in cell resistance, a 0.13 Ω resistor was added in series (or subsequently removed) with the cell at approximately the midpoint of each cycling segment. Whether the resistor is added or removed, both potentiostatic and galvanostatic cycling with potential holds show no change in the capacity fade trend. In contrast, purely galvanostatic cycling segments show a step change in the accessed capacity when the resistor is added or removed, which is exacerbated at higher current densities. The value of the resistor was chosen to represent a 25% increase in cell resistance (see Fig. S10 in SI). Such sudden changes are unlikely during typical flow battery operation; however, a gradual drift of the polarization resistance of this magnitude is entirely plausible due to changes in membrane conductivity, changes in mass transport of electrolytes or changes in electrode surface properties. Whether positive or negative, such a drift in resistance would lead to a drift in capacity during strictly galvanostatic cycling, which would be superimposed onto the real capacity fade curve. To deconvolute this effect, it is possible to craft a compromise between simulating battery usage in deployment and accurate charge capacity by interposing potential holds at the end of one out of every n cycles, as introduced by Beh et al. using n = 10.13 It is also possible to use low current density (e.g., C/20) cycling to access the entire capacity of the cell with minimal effect from polarization.30–33 This method works for solid electrode single electrolyte systems such as lithium ion cells but is not as useful for flow cell characterization. Due to the presence of hydraulically-induced and other sources of noise in flow cells, performing a low current density capacity test over 20 hours is not the most time-efficient way for accurately determining capacity fade trends. Moreover, if crossover of reactants is suspected, as in the case of AQDS previously mentioned, then such a slow measurement would inherently amplify such crossover effects. Because there is no experimental evidence nor any plausible mechanism thus far indicating that dissolved redox reactants are intrinsically sensitive to the cycling rate (or current density), then we see no reason to limit cycling conditions to lower currents. As seen in Fig. 11, potentiostatic cycling conditions lead to a higher sampling rate of the capacity, thereby providing more detailed information for identifying transient effects, quantifying experimental noise and measuring capacity fade more quickly. For the purpose of establishing the stability of novel electrolytes with the symmetric cell method described in this study, we therefore recommend such potentiostatic cycling conditions whenever possible.
While it may be more industrially relevant for cycling of full cells to be conducted galvanostatically, the potentiostatic methodology with holds at different states of charge is better for elucidating the limits of electrolyte stability and the mechanisms behind these limits as quickly as possible. Complete characterization of new electrolytes is considerably simplified with proper control of variables, as is enabled by the unbalanced compositionally-symmetric cell method.
Conclusions
This study contains specific results pertaining to the stability and capacity retention of several flow battery electrolytes in addition to more general results concerning the methodology to measure and characterize such properties. The primary conclusions of the study can be summarized as follows:
1. Electrolyte-specific results:
- (a)Pauses in cycling of a DHAQ unbalanced compositionally-symmetric cell with the CLS at different SOC demonstrate that the capacity fade rate is independent of the number of charge-discharge cycles and depends only on SOC and time. The fade rate is of order 10%/day when the electrolyte is in the reduced state, of order 1%/day when the electrolyte is at 50% SOC, and is imperceptibly low when the electrolyte is in the oxidized state. Consequently the projected lifetime during use in the field depends on the anticipated temporal SOC distribution.
- (b)Cycling of AQDS unbalanced compositionally-symmetric cells leads to a capacity fade rate of 0.08 ± 0.02%/day, independent of cycling. The same rate is found in rapid cycling of a static, non-flow cell. Transient behavior in the flow cell, spanning several hours and tens of cycles after the resumption of cycling, hindered the measurement of the SOC-dependence of the fade rate, but the highest capacity fade rate was in the reduced form, at roughly 0.2%/day. Chemical decomposition was observed of the reduced form but not of the oxidized form of AQDS with NMR spectrometry of samples held for two weeks at 45°C.
- (c)Cycling of K4[Fe(CN)6] /K3[Fe(CN)6]in 1 M KOH is characterized initially by a low capacity fade rate that becomes high when a SOC imbalance between the two sides grows to the extent that both sides become capacity-limiting, as illustrated in Fig. 6b. The imbalance development is caused by reduction of the [Fe(CN)6]3− to [Fe(CN)6]4− by contact with the carbon paper electrodes. The rate is slower by a factor of approximately 5 when the pH is dropped from 14 to 12.
- (d)It is possible to protect molecules from decomposition. Unbalanced compositionally-symmetric cell cycling of methyl viologen exhibited a capacity fade rate of 1.5%/day, whereas cycling of BTMAP-viologen over a period of two weeks led to an imperceptibly small amount of capacity loss.
- (e)The overpotential imposed during oxidation and reduction can affect molecular lifetimes if it is sufficient to create unstable species. When the reduction overpotential of BTMAP-viologen was increased enough to initiate reduction by a second electron per molecule, irreversible capacity fade resulted.
2. General methodological results:
- (a)The unbalanced compositionally-symmetric cell methodology presented here is useful for revealing and quantifying different mechanisms for capacity fade in redox flow batteries based on molecular energy storage. The precision limitations of the method are determined by flow cell and reservoir hardware, as shown by the Fe2+/Fe3+ test case.
- (b)Evaluating small capacity fade rates is better performed with potentiostatic cycling than with galvanostatic cycling because the latter is vulnerable to artifacts caused by drifting cell resistance. Galvanostatic cycling with potential holds at the voltage limits yields indistinguishable results from those of potentiostatic cycling between the same voltage limits when the overpotentials at the voltage limits are low enough not to affect molecular lifetimes.
- (c)Average temporal capacity fade rates during cycling can vary with the SOC range being accessed during cycling, if there is a nonlinear dependence of temporal fade rate on SOC.
- (d)Cases in which capacity decay occurs during pauses in cycling indicate a purely chemical mechanism. Such capacity fade can be recoverable if it is due to a simple change in oxidation state, as in the case of ferricyanide converting to ferrocyanide, or permanent if the molecule decomposes irreversibly as in the case of the reduced form of AQDS. Electrochemical decomposition can also be assessed by increasing the applied overpotentials beyond the level necessary for essentially complete conversion of redox active species during cycling. No change in capacity fade rate beyond this level, as in the case of DHAQ, similarly indicates a purely chemical mechanism for capacity fade.
- (e)In all cases reviewed to date of organic or organometallic redox-active species, capacity fade is independent of the number of charge-discharge cycles imposed, suggesting that dissolved molecular reactants are unaffected by changes in oxidation state and that a cycle-based metric is unsuitable for predicting flow battery lifetime. Instead, capacity fade is reasonably consistent with a time-denominated exponential decay phenomenon in which the time constant can be SOC-dependent. Hence, in all reports of cycling performance of flow cells utilizing redox-active organics or organometallics, the capacity fade rate per unit time should be reported.
Acknowledgments
This research was supported in part by U. S. DOE ARPA-E award DE-AR-0000767, by Innovation Fund Denmark via the Grand Solutions project "ORBATS" file nr. 7046-00018B, by the Massachusetts Clean Energy Technology Center, and by the Harvard School of Engineering and Applied Sciences. We thank Daniel Pollack for assistance with development of chemical storage methods, and Prof. Jeff Dahn at Dalhousie University and Jaroslaw Syzdek at Bio-Logic USA LLC for technical advice concerning coulometric precision. We thank Mike Perry and James Saraidaridis at UTRC for a critical reading of the manuscript. We also thank David Kwabi, Michael Gerhardt, Eugene Beh and Roy G. Gordon for helpful discussions.
ORCID
Marc-Antoni Goulet 0000-0002-9146-6759
Michael J. Aziz 0000-0001-9657-9456
Footnotes
- a
This is only feasible if the species do not interact chemically with each other and if all species are stable at the potentials experienced on both sides of the cell.
- b
Although it may be theoretically possible to filter out and re-dissolve the precipitate, some of it may remain trapped in the porous electrodes leading to poor mass transport and cell failure.
- c
More appropriately, capacity fade per cycle has been heavily utilized for evaluating membranes for imperviousness to reactant crossover: by keeping other parameters constant and studying only one electrolyte combination, capacity fade per cycle can be a meaningful way of comparing membranes for this purpose.
- d
Another way of corroborating this interpretation is by looking at the dependence of the apparent current efficiency on the total capacity or cycling time. The reader will notice such differences in later comparisons between large capacity flow cells and small capacity static cells or between slower galvanostatic cycling and faster potentiostatic cycling in Fig. 11.
- e
Ferricyanide in the CLS is also reduced by the same mechanism, shifting the arrow downward as well. The overall trend is a superposition of these two changes.