
Abstract
Experimental results about the impact of hydrophobic coating inside commercial gas diffusion layers (GDL) of polymer electrolyte fuel cells (PEFC) were obtained with four different combinations of PTFE-loadings on both anode and cathode. The measurements were performed on differential PEFCs which were characterized with high resolution neutron radiography (NR) combined with two electrochemical methods: a pulsed gas analysis (PGA) and limiting current density measurements. Using the combination of the neutron radiographs with these two electrochemical measurements, a new insight on the impact of water on mass transport losses was obtained. Under high humidification conditions, GDLs without hydrophobic coating do not accumulate more water than coated GDLs, but the water distributes differently and accumulates in the region under the channel of the flow field. Cells with high PTFE coating show higher mass transport losses despite the relatively small quantity of water, which can be explained by a different morphology of water accumulation.
Export citation and abstract BibTeX RIS

This is an open access article distributed under the terms of the Creative Commons Attribution 4.0 License (CC BY, http://creativecommons.org/licenses/by/4.0/), which permits unrestricted reuse of the work in any medium, provided the original work is properly cited.
Polymer electrolyte fuel cells (PEFCs) are electrochemical energy converters to provide electric power for stationary, automotive and portable applications. In particular, highest power densities are required for mobile and automotive applications implying cell operation at high current densities (≥1 Acm−2). At these operational conditions, mass transport losses (MTL) become dominant and lead to a significant drop in performance. MTL essentially originate from an excessive water accumulation inside the gas diffusion layer (GDL), as the removal of water and the supply of reactant gases share the same pathways.
Inside a GDL, liquid water propagates under the effect of capillary forces from the catalyst layer (CL) to the flow channel.1 In opposite direction, a sufficient diffusivity of the reactant gases is necessary to sustain the electrochemical reaction with limited mass transport losses (MTL). This concurrent two-phase flow can be adjusted by the material properties of the GDL such as hydrophobicity, porosity or tortuosity. A hydrophobic coating affects the diffusion media in different ways: (i) by increasing the water contact angle and thus the capillary pressure, (ii) by modifying the diffusion structure of the dry material, and (iii) by affecting some characteristics such as the thermal conductivity.
The influence of hydrophobic coatings has been investigated by various researchers with ex-situ and in-situ techniques. Ex-situ studies performed with Scanning Electron Microscopy (SEM) have shown an important impact of the coating on the pore structure of the GDLs.2 Lim et al.1 reported that the coating preferentially accumulates at multiple intersecting graphite fibers during the application process, which may lead to a blockage of the pores under certain conditions. This finding is supported by the coating distributions published by Prasanna et al.,3 who reported that high coating loads (up to 40 wt%) lead to almost complete clogging of the GDL. A more detailed characterization of the change in the pore size distribution has been performed by Park and Popov4 with mercury intrusion measurements. They have shown that the pores affected by the coating are mainly in the range between 3 and 50 μm. Measurements of the surface contact angle give very limited knowledge about the impact of the coating, as the complex heterogeneous surface (carbon fibers and polymer coating) combined to the porous nature of the material strongly affect the measurements. A good example of this limitation is given in the literature overview in Ref. 4, where contact angles between 30–180° are reported with similar materials. More advanced measurements of contact angle for porous GDLs can be obtained by determining the internal contact angle (Washburn method).5 In this method, the contact angle is measured on the basis of the dynamics of water uptake and uptake of other liquids in the porous structure. However, the resulting internal contact angle strongly depends on the model applied to the data. Ex-situ permeation measurements with air3,6–8 or water9 give information about the impact of coating on the material permeability. Prasanna et al.3 measured a highly decreased air permeability of the dry GDL with higher coating load. Water permeation measurements also have shown that a higher coating load results in an increased capillary pressure threshold.9 Ismail et al.10 assumed that a reduction in the average pore size may not only decrease the permeability but may also increase the permeability under certain conditions. LaManna and Kandlikar8 found out that a higher coating load causes a higher tortuosity, resulting in increased three-dimensional diffusion pathways for water vapor. Capillary pressure measurements were performed by Gostick et al.11 with different liquids (e.g mercury, water, octane). Based on these measurements it is assumed that an excessive amount of PTFE leads to a thicker layer of coating but not to an increase of the carbon fraction covered by the coating.12 Based on SEM measurements, Lobato et al.13 concluded that a coating of 10 wt% PTFE already leads to a coating coverage of 97.3% of the graphite fibres. This finding is consistent to measurements of Lim et al.1 More advanced investigations about local compression and changes in the porosity have been performed with X-ray tomography.14 However, only Toray carbon papers were investigated and no such information is available for other state-of-the-art GDL materials.
Various researchers investigated the influence of PTFE coating in operating cells. However, in most of the cases, GDLs without MPL1,4,6,9,15,16 and/or non-state-of-the-art membranes1,4,6,9,15,17 were used. As a consequence, most reported results are based on cells with very low performance hardly reaching 1 Acm−21,4,6,9,15,17,18 under reasonable operating conditions. Most investigations were performed on 25–50 cm2 lab-scale fuel cells,1,4,6,7,9,15,19 while only two studies were conducted with smaller cells (active areas < 10 cm2). Lin et al.20 used a 6 cm2 fuel cell with technical stoichiometries (below 5) with interdigitated flow fields, which induces major changes in the gas and water transport mechanisms. Mukundan et al.21 performed in-plane neutron radiography measurements on a 2.25 cm2 small-scale cell. In order to be able to compare these results to a technical fuel cell with an active area of 50 cm2, a flow field with a single serpentine has been used in their experiments resulting in similar channel lengths and gas velocities. The authors investigated the influence of the water distribution on the performance using commercial GDL materials of SGL series 24 with 5 and 20% PTFE. However, no advanced analysis of the water distribution has been performed comparing these two materials. A more detailed analysis has been carried out on the microporous layer (MPL), where the amount of hydrophobic coating inside the MPL has been identified being critical for an efficient water removal.
For the characterization, several studies rely on I-V curves only,4,6,7,9,15 sometimes complemented by impedance spectroscopy measurements.1,3 A few more studies use more specific methods such as pressure drop analysis,20 limiting current16 measurements, oxygen gain analysis,3 and neutron radiography.21 Various optimal coating levels of 5 wt%,16,22 10 wt%,1 20–23 wt%3,18,21 or even 30 wt%18 are claimed in literature.
Although many publications find similar experimental results, different explanations are given. A good agreement can be found on the fact that uncoated GDLs tend to show a high risk of flooding inside the GDL7,23,24 – although there is no visualization data available showing which amount of water is to be considered as "flooding". Tseng and Lo7 explained this flooding by a quick removal of the water from the CL but accumulation inside the GDL which leads to significant performance drop. Shimpalee et al.23 did a numerical analysis of GDL water flooding. They showed results on state-of-the-art materials with large differences between uncoated and coated GDL. They explained the lower performance of the GDL without coating by a partial flooding of its pores.
In contrast, the explanation about the water transport inside highly PTFE coated GDLs is very different in literature. According to Park et al.,6 highly PTFE coated GDLs have a higher risk of flooding the CL which leads to a deactivation of the cell. These findings can be related to the fact, that no MPL has been used in these specific experiments. Furthermore, they assume that the total amount of water is higher inside highly coated GDLs, as capillary condensation takes place resulting from the smaller pore size. Lim et al.1 explained the poor performance at high coating loads by the fact that their coating process results in a thin film on the surface of the GDL which leads to a substantial diffusion resistance of the reactant gases. Prasanna et al.3 reported about a better water removal at low coating loads of 10 wt% PTFE.
Regarding the resulting ohmic losses, contradictory findings are reported in literature. Several studies3,7,10,25 reported about increasing ohmic losses with higher coating levels due to the additional unconductive coating. In contrast to this, Chang et al.16 reported about constant ohmic losses between coating loads of 5 and 20 wt% PTFE.
Up to now, no study on the impact of GDL coating including an advanced analysis of the mass transport losses including the distinction of bulk (ternary diffusion in GDL) and non-bulk losses (Knudsen and thin film diffusion in the CL) can be found. Moreover, all conducted studies were performed on cells operated with technical stoichiometries (λ < 5). Although the choice of technical stoichiometries may seem straightforward, it implies important inhomogeneities along the flow channels.21 Under these conditions, and in the absence of local electrochemical data, unravelling the impact of water on mass transport losses is impossible. Therefore, we present new experimental insights about the water distribution and performance of PEFCs on the local scale using so called differential cells (cells with reduced channel length operated on high stoichiometries).26–29 By combining the pulsed gas analysis30 and limiting current density measurements with high resolution neutron radiography, we are able to obtain an unprecedented insight of the impact of water on the mass transport losses for materials with different amounts of hydrophobic coating.
Experimental
Cell design
The following experiments were performed on six small scale (active area 1 cm2) differential PEFCs, which were operated in one common housing especially built for neutron radiography.33 The cells have 5 parallel flow channels (0.55 mm depth and 1 mm width), machined into aluminum and coated with gold. A catalyst coated membrane (CCM) (Primea 5710, W.L. Gore & Associates, Inc., USA) was used with Pt-loadings of 0.1 mgPt cm-2 on the anode and 0.4 mgPt cm-2 on the cathode side, respectively. Commercial GDLs were used from the SGL Carbon Group Series 2434 with a MPL containing 23 wt% PTFE.35 Table I depicts the four different configurations of GDLs used. The amount of PTFE was varied on the anode between 0 and 5 wt% and 0, 5, and 20 wt% on the cathode side, respectively. A reproducibility better than 20 mV was achieved at 1 Acm−2 with our assembly procedure36 at a GDL compression rate of 25%. Further details about the experimental setup can be found in Ref. 33.
Table I. Fuel cell configurations analyzed during the experiments.
| Configuration | 1 (basecase) | 2 | 3 | 4 |
|---|---|---|---|---|
| Active area | 1 cm2 | |||
| Flow fields | 5 channels (0.55 × 1 mm2) – gold coated aluminium | |||
| CCM | Primea 5710 – Gore Ltd., USA | |||
| Compression GDL | 25% | |||
| Anode GDL | SGL 24 BC (5 wt% PTFE) | SGL 24 BC (5 wt% PTFE) | SGL 24 AC (0 wt% PTFE) | SGL 24 BC (5 wt% PTFE) |
| Cathode GDL | SGL 24 BC (5 wt% PTFE) | SGL 24 BC (0 wt% PTFE) | SGL 24 AC (5 wt% PTFE) | SGL 24 BC (20 wt% PTFE) |
In a previous study of our group,37 SEM images of the structure of the three different GDLs were published. The base material of the GDL without PTFE shows its pure carbon fibre structure with carbon binder (flake structure).35 With increasing coating load (5 wt% PTFE), the mesopores of the porous binder are partly covered with PTFE, while the macropores (>50 μm)38 are not affected. This finding is in good agreement with results presented by Lim et al.1 At higher coating loads (20 wt% PTFE), some of the macropores are blocked by the PTFE as well. These findings can be confirmed by the pore size distribution published in Ref. 39.
The preferential location of the coating can be understood by considering its application procedure. Although the exact coating procedure applied for the commercial material is not known, the usual method is to apply an emulsion of PTFE particles (range of 200 nm) in water to the carbon paper. The surfactant present in the emulsion helps for a complete wetting of the carbon fibers. Intersections of several fibers are favorable locations for meniscus formations. Consequently, small pores can be completely blocked by the surface treatment, whereas big pores remain unchanged. Besides the changes in the pore morphology, thermal conductivity measurements on GDLs with different coating loads were reported to reduce conductivity of SGL GDLs by a factor of two by applying a coating of 20 wt% PTFE compared to the material with 5 wt% PTFE.40
Pulsed gas analysis (PGA)
In previous publications of our group,30,37,41 the pulsed gas analysis (PGA) method has shown its usefulness for detailed studies of "bulk" and "non-bulk" mass transport losses.30 "Bulk losses" originate from diffusive transport limitations in the GDL while "non-bulk" losses (related to Knudsen diffusion and thin film diffusion42) can be primarily related to diffusive transport limitations in the CL. The basic idea of the PGA is the replacement of the cathode air by helox (21% O2, 79% He) and pure oxygen. As the diffusivity of O2 in helium is higher by a factor of 2 to 3 than in nitrogen,42 the bulk mass transport losses are reduced to nearly zero.30 Consequently, a good estimation of the bulk mass transport losses can be obtained from the voltage difference between operation under air and helox. The non-bulk losses are obtained from the voltage difference between operation under pure oxygen and operation under helox, as the higher partial pressure of oxygen combined with the differential operation reduces the non-bulk diffusion losses to nearly zero. The higher partial pressure requires one to correct for the increase in voltage (about 45 mV42) in the absence of mass transport losses due to changes of the Nernst potential and improved oxygen reduction kinetics. Although the use of helox and oxygen gain is sometimes reported, the particularity of our method is the supply of helox and pure oxygen as short pulses of 1 s in order to avoid artefacts resulting from drying out or changes of the catalyst coverage by oxygenated species. A detailed description of the pulse setup can be found in Ref. 30. The error bars are calculated based on 2.56 times the standard deviation between the voltage of three identical cells of the base case (5 wt% PTFE on both sides), corresponding to a confidence interval of 99%. The high frequency resistance (HFR) was measured at 5 kHz. The indicator of ohmic losses is the product of the high frequency resistance (HFR) and the individual current density of the cell.
Imaging setup
The neutron experiments were performed at the ICON beamline43 of the Swiss Spallation Neutron Source (SINQ) at the Paul Scherrer Institute. The cells were imaged with the membrane parallel to the beam axis (in-plane) with a tilted imaging setup.33,41,44,45 A pixel size of 5 × 66 μm/pixel with an effective resolution (FWHM) of approx. 30 μm across and 198 μm along the membrane was obtained. An anisotropic L/D was set to around 1000 across and 80 along the membrane, the neutron flux was 4.29 × 10⁷ neutrons cm−2 s−1. A good trade-off between spatial and time resolution is obtained with an exposure time of 15 s with this imaging setup.46 The camera was an Andor NEO with 2592 × 2160 pixels.
Image processing
The image processing consists of a 3D-median filter of 3 × 3 × 3 pixels (x, y, t), a flat field correction, a correction of the background due to neutrons scattered by the setup and a correction of beam intensity fluctuations. Consecutively, the images were referenced pixel-wise to their radiograms in the dry state. The thickness of water δ is calculated according to the Lambert-Beer law:
![Equation ([1])](https://content.cld.iop.org/journals/1945-7111/162/10/F1243/revision1/jes_162_10_F1243eqn1.jpg)
where I depicts the intensity of the working image, I0 the intensity of the dry reference and Σ the macroscopic cross section of water. Further details about the image processing can be found in Ref. 46. The error bars of the water saturation curves are based on 2.56 times the standard deviation of the three identical cells with 5 wt% PTFE on both sides, corresponding to a confidence interval of 99%. As the number of samples (n = 3) is rather limited, small deviations in the water saturation translates into substantial error bars, although the accuracy of the measurements are rather high.
An in-situ calibration process using the production of a defined quantity of water was obtained in a so called double dead-end experiment.47,48 As a result of this calibration, the water quantities reported here were corrected by a factor 1.53.
Experimental protocol
The results hereafter are based on four experiments (see Table II): current-voltage curve, constant current operation, RH-map and limiting current measurements. The current-voltage (I-V) curve experiment consisted of 11 steps of current variations, maintained during 20 minutes. The second experiment investigated the stability of the PEFC performance during 2 h of continuous operation at 1 Acm−2 under full humidification. The third experiment consisted of asymmetric variations of the anode and cathode humidification (RH-map49). As the water balance equilibrates already after 3 minutes, every operation point was held only for 15 min. The limiting current density measurements were carried out at two cell voltages of 0.3 V and 0.2 V, respectively, at 70°C under dry and fully humidified conditions. The concentrations were chosen at 0.25, 0.5, 1.0, 2.0% O2 in N2. In order to investigate the differences in diffusivity of oxygen in helium, limiting current density measurements with 0.125, 0.25, 0.5, 1.0% O2 in He were also performed. A first measurement was done using relatively dry gases (Anode: 30%RH/Cathode: 30% RH) to obtain the limiting current density without water in the GDL. Then, the cell was operated at 1 Acm−2 and full humidity for 1 h, before making a second measurement of the limiting current density with fully humidified gases, keeping the water previously accumulated in the GDLs. If not specified elsewhere, all other experiments were performed at a constant current density of 1 Acm−2. The cell temperature was maintained at 70°C at a pressure of 2 barabs on both sides. The gas flows were 0.4 NL/min on the anode and 1 NL/min on the cathode side, translating into stoichiometries of approximately 60 on both sides.
Table II. Operation conditions during the three different experiments.
| Experiment | IV-Curve | Cont. operation | RH-Map |
|---|---|---|---|
| Neutron imaging | - | X | X |
| Temperature/°C | 70 | 70 | 70 |
Current/ | Various | 1000 | 1000 |
| Pressure/barabs | 2 | 2 | 2 |
| Flow (anode/cathode)/mNLmin−1 | 400/1000 | 400/1000 | 400/1000 |
| Stoichiometry/- | ∼60 | ∼60 | ∼60 |
| Humidification/%RH | 100/100 | 100/100 | Various |
| Holding time/min | 20 | 120 | 15 |
Results
IV-Curve
As has been reported in several publications,1,3,4,6,7,9,15,20,21 the PTFE-loading has a crucial influence on the overall cell performance especially at high current densities. Figure 1a depicts the current-voltage curves of the four different cell configurations under full humidification. As expected, the main differences between the four cell configurations can be clearly identified in the high current density region where mass transport losses become important. The cell with the GDL without PTFE on the anode side shows no significant differences compared to the base case with 5 wt% PTFE on both sides. On the contrary, any change of the PTFE concentration on the cathode side leads to significant performance losses at current densities above 0.3 Acm−2. These measurements are significantly different to Ref. 21 where best performances have been obtained with 20 wt% PTFE with similar materials but with a different cell setup (50 cm2).
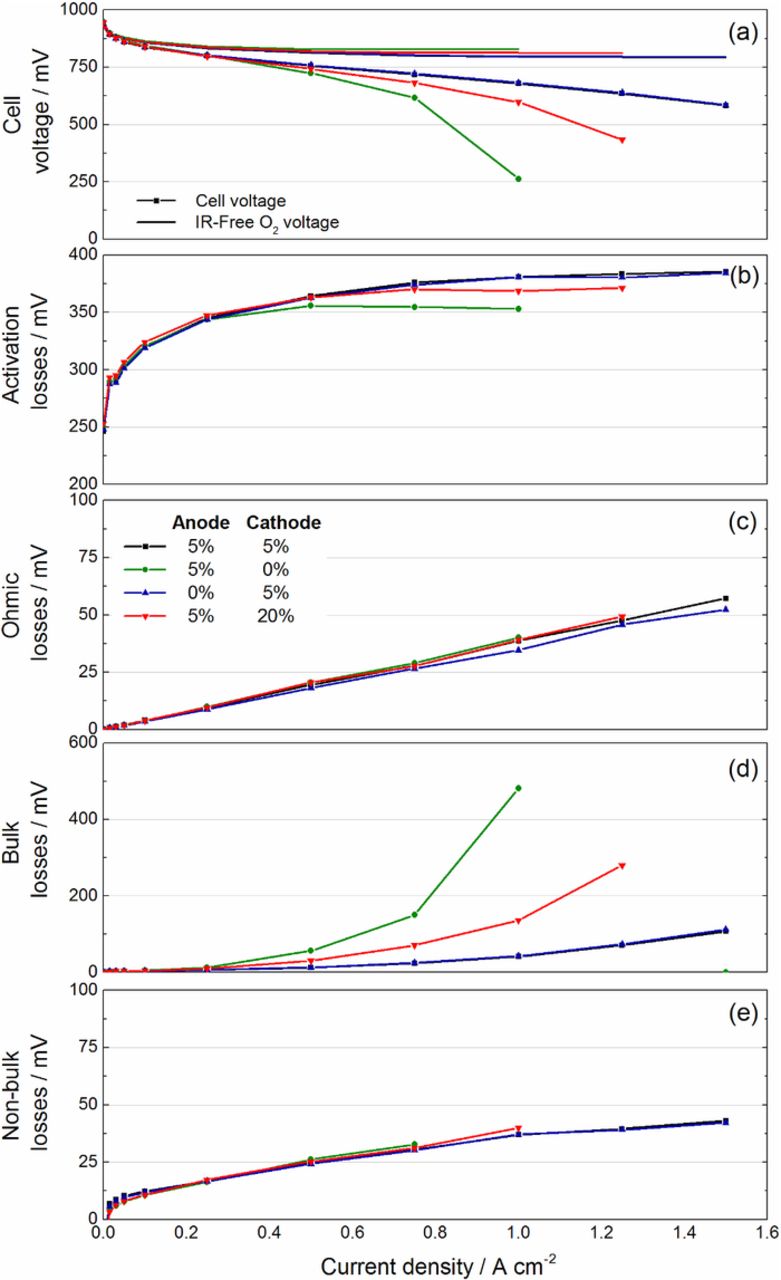
Figure 1. Cell voltage and indicator of performance losses during a current-voltage curve under full humidification, (a) overall cell performance, Indicator of (b) activation loss, (c) ohmic loss, (d) mass transport loss.
The cell potential is determined by three major performance loss mechanisms: activation overpotentials ηHOR and ηORR, ohmic ηIR as well as mass transport overpotentials ηbulk MTL and ηnon − bulk MTL. Consequently, the cell potential can be calculated as follows:
![Equation ([2])](https://content.cld.iop.org/journals/1945-7111/162/10/F1243/revision1/jes_162_10_F1243eqn2.jpg)
where  depicts the Nernst voltage at a certain operation pressure and temperature. In the following the term activation losses (AL) will be used as the sum of the activation losses ηHOR and ηORR. As the anode polarization is negligible under our operation conditions, the AL and mass transport losses are mainly determined by the overpotential of the cathode side.
An indicator of activation losses is calculated based on the difference of the oxygen pulse voltage (corrected for its ohmic loss) with its thermodynamical equilibrium potential. The AL indicate no significant deviations between the four cell configurations, as the same catalyst-coated-membrane (CCM) has been used. Nevertheless, in the region of high current densities, the cells with the poorest performance (0% and 20% PTFE) show the lowest activation losses (Figure 1b). This fact can be explained by the lower overall cell potential, which leads to a lower oxide coverage of the platinum catalyst, resulting in a higher number of active sites of the catalyst.50,51
In between the four configurations, no significant differences of ohmic losses (OL) can be observed. This is in contrast to some of the literature findings, where increased electrical resistances have been measured.22,25,52 However, as the coating is just applied on the surface of the GDL, the electrical bulk conductivity is not expected to decrease. In contrast, the contact resistance between GDL and lands of the flow field might be increased. As the experiments reported in Refs. 22, 25, 52 were performed with GDLs of different manufactures, the comparability with these measurements is limited.
The pulsed gas analysis (PGA) enables the differentiation between bulk and non-bulk mass transport losses (MTL) (see Figures 1d–1e). The figures reveal that the difference of the overall performance between the four cell configurations mainly results from differences in bulk losses. The configurations without and with excessive PTFE on the cathode side show a strong increase of losses at current densities larger than 0.3 Acm−2. This increase might be either a result of water flooding or changes of the morphology of water in the GDL resulting from the supplementary coating and will be analyzed with neutron radiography subsequently. The cell without PTFE on the anode side do not show any dependency induced by the coating process. Consequently, the overall mass transport is only limited by the cathode side. This is not surprising as the transport on the cathode side relies on oxygen diffusion in nitrogen and water vapor, while the transport on the anode side with pure hydrogen relies mostly on convection – it is however worth mentioning here that the situation may be different when using an anode recirculation loop where nitrogen can accumulate over time. Non-bulk losses on the cathode are not varying between the four configurations and their magnitude is in good agreement with our previous results.30 This indicates that different PTFE loadings in the GDL do not impact the flooding of the CL.20
Constant current operation
The overall cell voltage (a) and the indicators of bulk (b), non-bulk (c) and ohmic (d) losses during continuous operation at full humidification are shown in Figure 2.
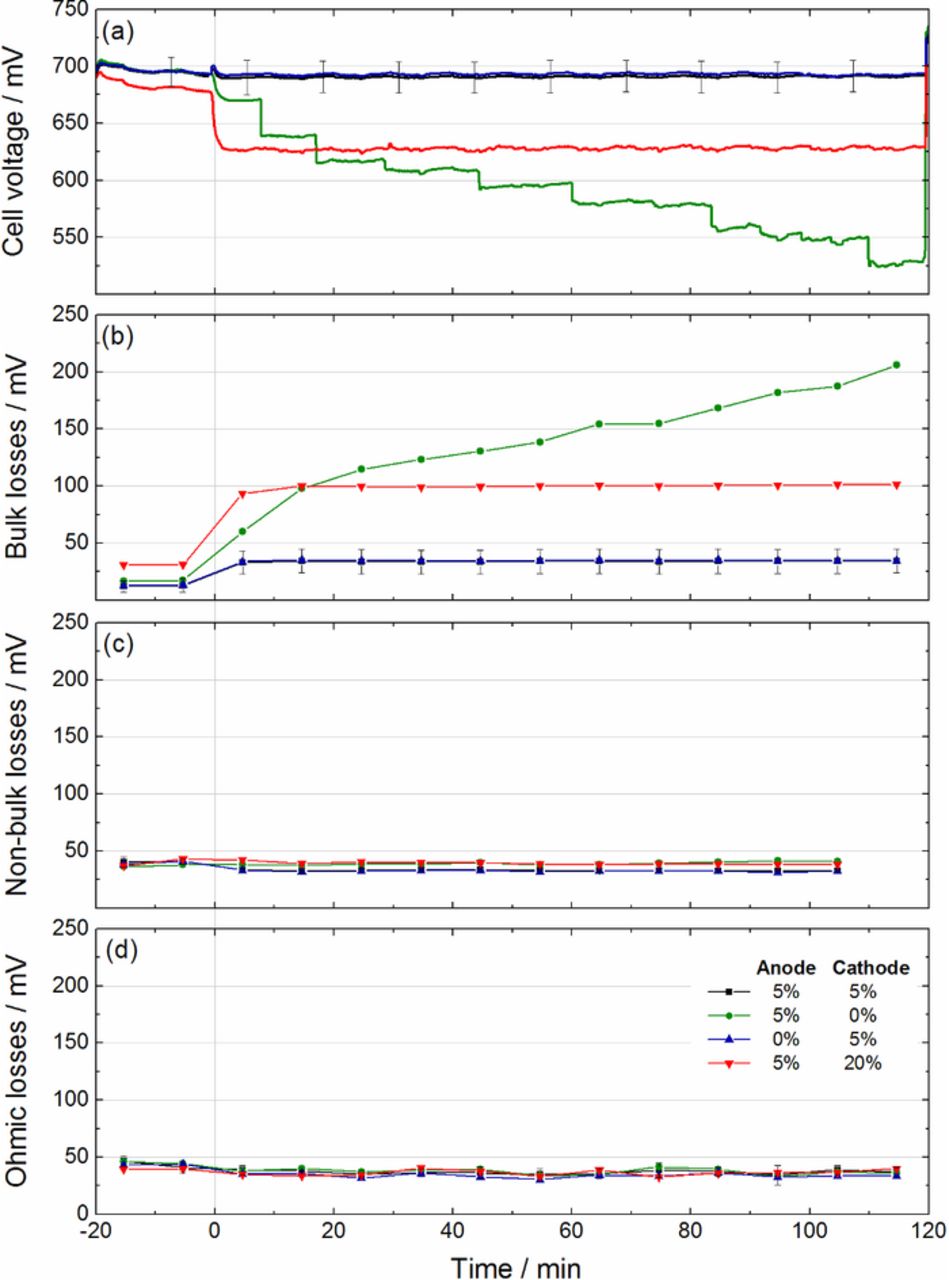
Figure 2. Indicators of performance losses during 2 h of operation under full humidification (a) bulk losses, (b) non-bulk losses, (c) ohmic losses. Cells operated at 1 Acm−2.
At t < 0 min the cells are operated under full humidification on the anode and dry air on the cathode. The cells show a similar voltage (a little less than 700 mV) at 1 A cm−2. However, a slightly lower cell voltage can be found at the cell with 20 wt% PTFE on the cathode which arises from increased bulk losses (Figure 2b). At full humidification on both sides (t > 0 min), the PTFE loading has a much larger impact. All cells with 5 wt% PTFE on the cathode side (regardless of their PTFE loading on the anode side) are only slightly influenced by the increased humidification. The cell with 20 wt% PTFE on the cathode side shows a substantial but stable decrease of voltage of approx. 75 mV. The voltage of the cell without PTFE on the cathode decreases stepwise without stabilizing within the 2 hours of the experiment.
Figure 2b highlights that the main differences between the four cell configurations can be explained by the bulk diffusion losses. Both configurations with 5 wt% PTFE on the cathode side show only minor influence (∼25 mV) of the change in the operating condition. In contrast, the cell with 20 wt% of PTFE undergoes a significant increase of bulk losses, which results in a voltage drop of 75 mV of the overall cell voltage. The configuration without PTFE on the cathode side shows strongly rising bulk losses and does not reach any stable point until the end of the experiment. Unfortunately, the temporal resolution of the PGA is limited (helox pulses and O2 pulses are switched each 5 minutes), and the stepwise decrease of the overall voltage is not apparent in the bulk losses. However, the absolute value of the bulk diffusion losses matches well the decrease of the overall voltage. An explanation will be given subsequently in the discussion part.
Consistent with the previous experiment, the non-bulk and ohmic losses show negligible deviations in between the four configurations and is an indication that the absence of excess of PTFE in the GDL has little influence on CL flooding.
High resolution neutron radiography enables correlating the water distribution with mass transport losses. At the beginning of the experiment (Figure 3a) similar water distributions can be found between the first three configurations. The configuration with 20 wt% PTFE shows slightly less water in the GDL. A strong gradient can be observed between water accumulation under the rib and channel which is consistent with literature.53,54 At the end of the experiment (see Figure 3b), similar water distributions as in the beginning are obtained for most of the cells. However, the cell without PTFE on the cathode side has more water accumulation under the channel at the end of the experiment, resulting in an almost even distribution of water between the region under the ribs and under the channels. A detailed observation also shows that there is a preferential accumulation for water at the channel edges near the GDL. In summary, the large increase of mass transport losses observed for the cell without PTFE on the cathode side does not correspond to a massive flooding of the GDL, but to a redistribution of the water to specific locations which are particularly detrimental for mass transport. Interestingly, the blockage of the second channel of the cell configuration without PTFE on the anode side, does not translate into any decrease of performance of the cell configuration. The findings above explain the trends observed in Refs. 7, 23, 24, 31 where high MTL are measured with cells without coating. In summary, we point out that it is not a flooding of the entire GDL, but a redistribution of water to certain detrimental regions of the GDL, which significantly affect the performance.
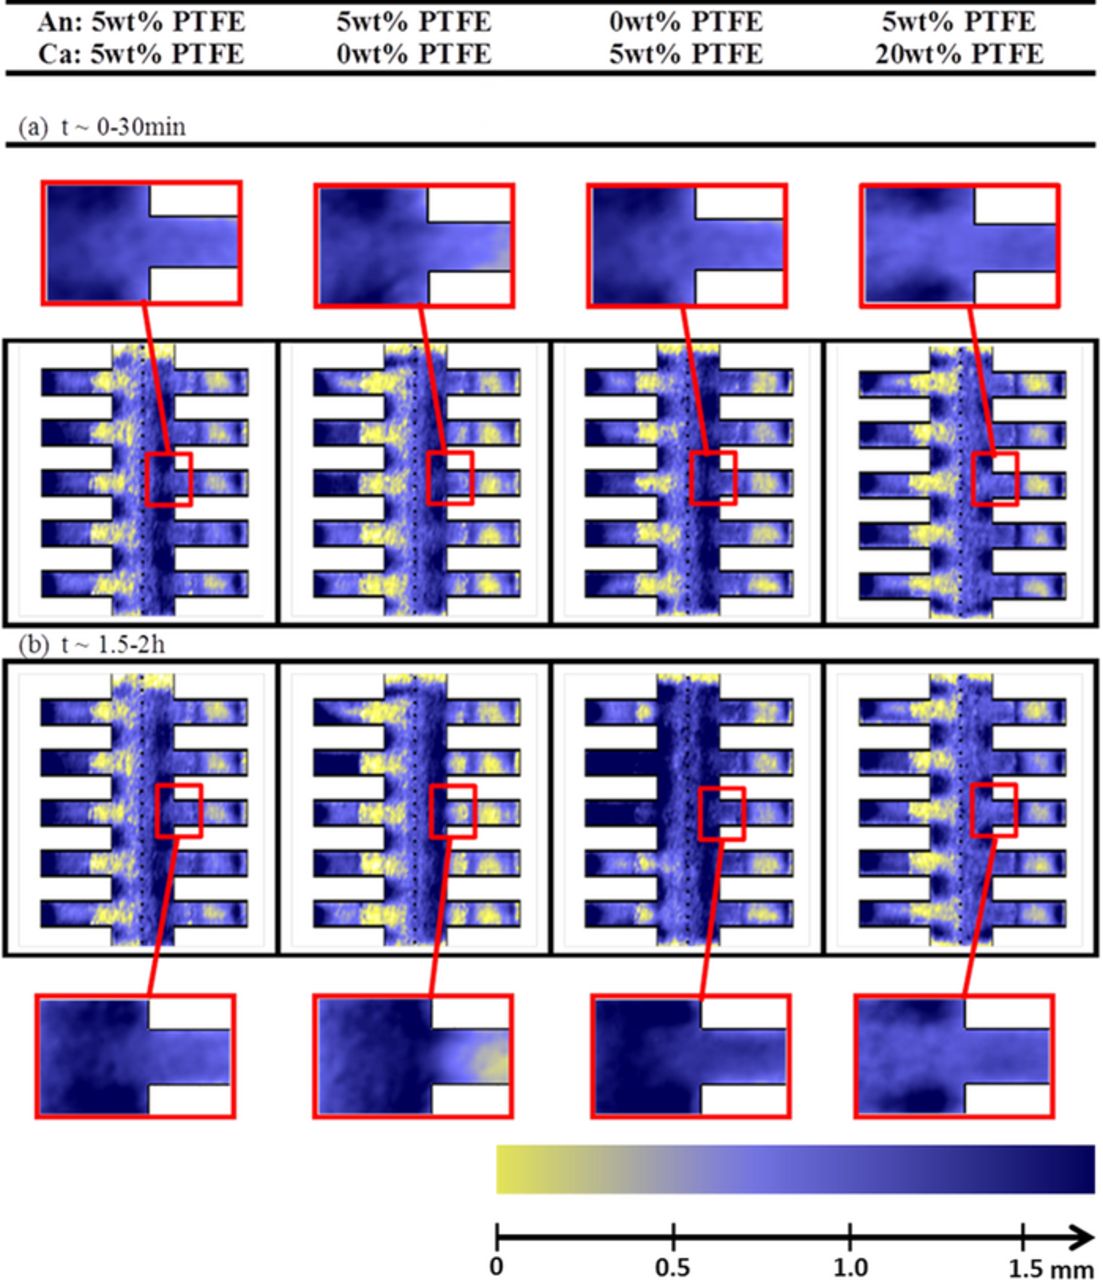
Figure 3. In-plane water distribution averaged during the (a) first and (b) last 30 minutes for the four configurations during continuous operation at full humidification. The dotted line in the middle depicts the membrane, with its anode on the left and cathode on its right. The five fringes depict the gas channels of the flow field. The gas diffusion layer is situated between the dotted line (membrane) and the bottom of the flow fields. The amount of water is represented in false color code (yellow = dry, blue = wet) which corresponds to 0 and 1.7 mm water. As the effective resolution is improved in direction perpendicular to the membrane, the images are magnified by a factor of approx. 6 in x-direction.
RH-Map
The operation of the cells under asymmetric variations of the humidification on anode and cathode (RH-map)49 provide detailed information about the influence of the local humidity on cell performance. The indicators of bulk, non-bulk and ohmic loss are depicted in Figures 4b–4d as a function of the humidification (see Figure 4e). Similarly to previous findings of our group,49 there is an optimal operation point with a fully humidified anode and a dry cathode, where losses are minimized. The same trends are observed concerning the influence of anode and cathode relative humidity, but with different quantitative values. The cell with 20% PTFE on the cathode side shows the strongest dependence of the bulk losses on humidification level, consistently with the previous experiment. A point worth noting is the increase of bulk losses in very dry conditions compared to the optimal case, which will be explained later on.
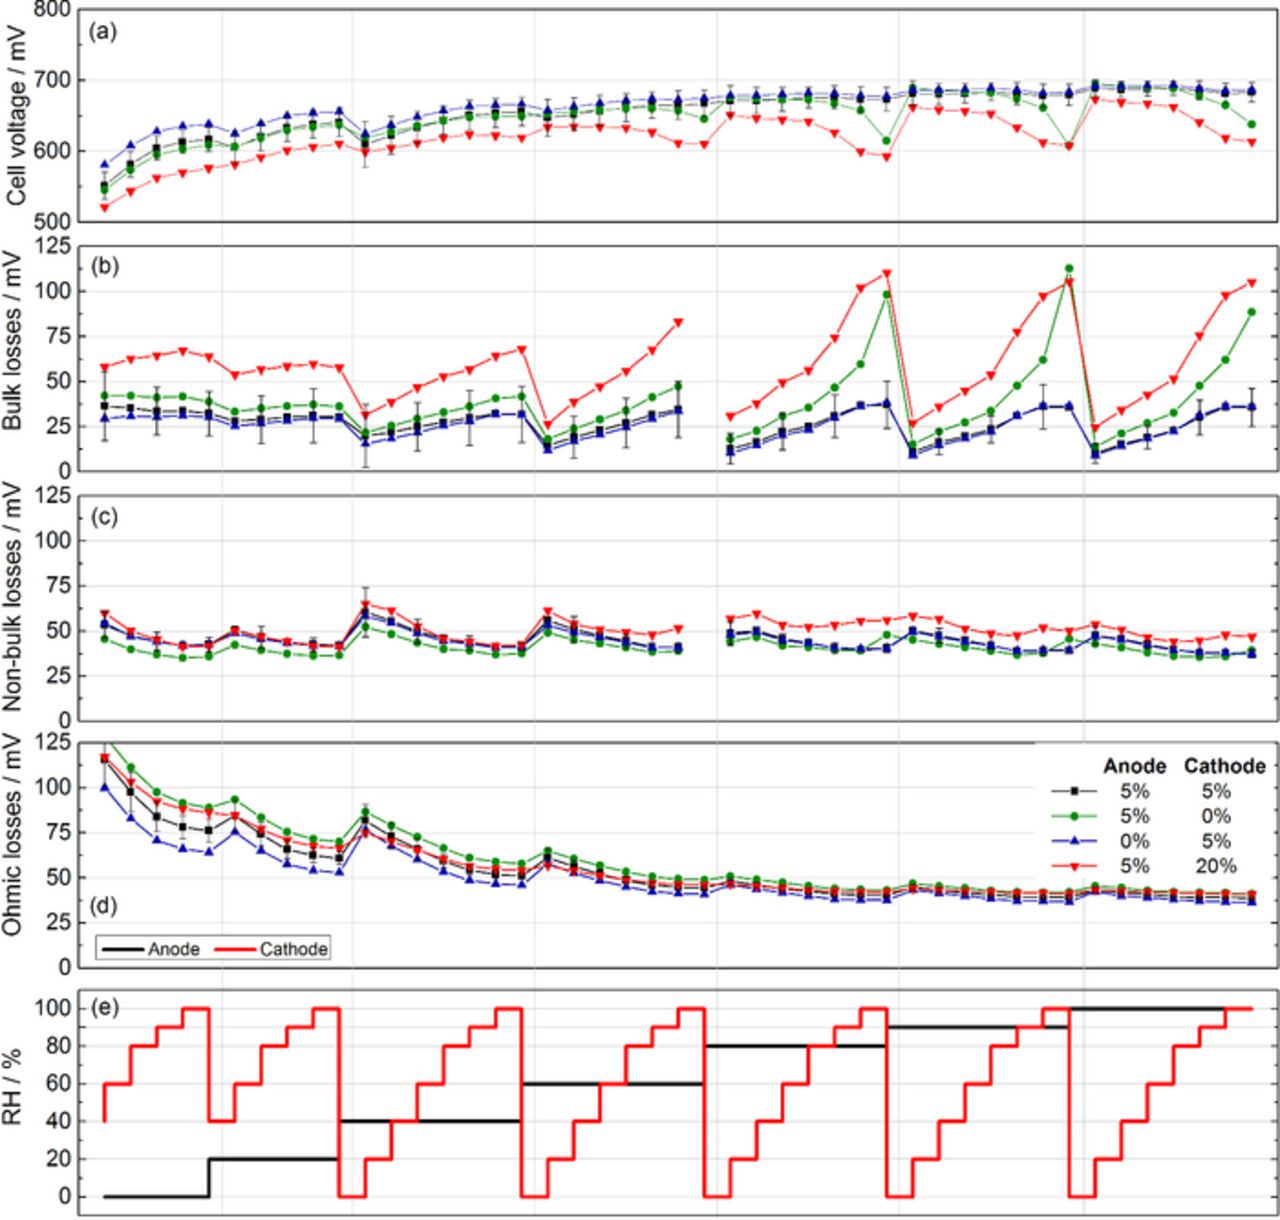
Figure 4. Indicators of performance losses at various humidification conditions.
Although the losses of the cell without PTFE on the cathode are smaller than those of the cell with 20% PTFE, we have to remind that every operation condition has only been maintained during 20 minutes. According to previous experiments, most cells stabilize within this time with the exception of the cell without PTFE on the cathode side. We would thus expect the losses of this cell to raise higher in Figure 4b if the operating conditions would be maintained for a longer time.
The indicator of non-bulk losses shows no major differences between the four configurations. A slight decrease with increasing humidification is observed, which can be explained by a better ionic conductivity of the ionomeric phase inside the CL.41 This is contradictory to some claims in literature55 where increased losses with high coating loads of the GDL are attributed to flooding the CL. However, we are currently not aware of any publication demonstrating this claim.
Figure 4d shows that the ohmic losses are strongly decreasing with increasing humidification. Consistent with previous findings,49 the ohmic losses are mainly determined by the anode humidification. This effect is specific to differential cells, where the quantity of water vapor which can be taken up by the gas flow is not limiting.49 In technical PEFCs, the membrane humidification is mainly affected by the humidity of the cathode gas flow which is much bigger than the anode flow.49 As has already been shown in the two previous experiments, no significant deviations can be found at high humidity between the ohmic losses of the four different cell configurations. All cells tend to dry out with low humidity, but no clear trend can be extracted from these differences.
Figure 5 illustrates the spatial water distribution at selected humidification conditions. At low humidification conditions on both sides (Figure 5a), almost no water can be found inside the GDL and flow fields. The increased mass transport losses, in particular those of the cell with the highest amount of PTFE, can therefore not be explained by the quantity of water accumulated. This apparent discrepancy will be further commented in the Discussion section.
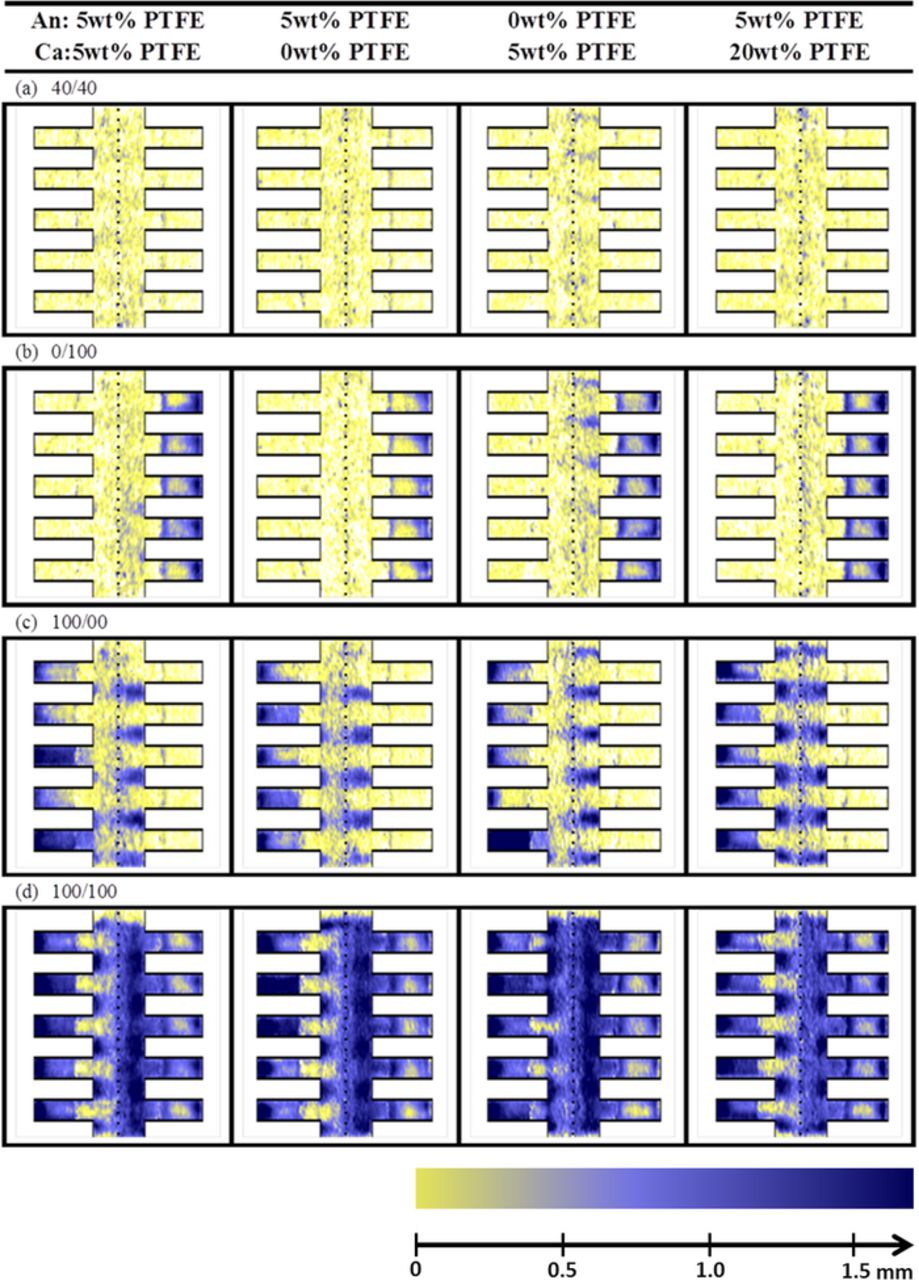
Figure 5. In-plane water distributions at various humidification conditions.
Under full humidification on the cathode and dry gases on the anode (Figure 5b), low saturation levels are observed in the cathode GDLs. Despite this, the bulk losses are still higher than in the optimal case. As the membrane is not yet well humidified under this condition (high ohmic losses), the same explanation as for dry condition holds. As can be clearly seen from the neutron radiographs, water condenses inside the manifolds of the flow channels of the cathode (bottom of flow channels) indicating that the cathode flow is actually slightly over-humidified, but the dry anode flow is sufficient to avoid condensation in the GDL, even on the cathode side.
Figure 5c shows the water distribution under optimal operating conditions (full humidification on the anode and dry cathode). It can be observed that water condenses inside the cathode GDL under the ribs of the flow channels. However, as can be seen from the performance data (Figure 4), water accumulation under the ribs of the flow channels does not affect the bulk mass transport losses significantly: the bulk losses are lower than in the previous condition with no water in the GDL. Similar to previous measurements, water appears in the manifolds of the flow channels, indicating a slight over-humidification. Interestingly, the cell with the highest amount of PTFE shows an increased water accumulation in the anode GDL under the ribs of the anode flow field.
Under full humidification (Figure 5d) water accumulates in all layers of the PEFC including in the GDL under the flow channels. This directly translates into increased bulk mass transport losses.
The average amount of water inside the GDL of the anode and cathode is depicted in Figure 6a. On the anode side, most cells show similar water saturation levels. Merely, the cell with 20% PTFE on the cathode side shows higher water accumulations at anode humidifications above 60%. Furthermore, the cell without PTFE on the anode shows a slightly higher amount of water at full humidification, which may be a result of the interaction with flooded channels (see Figure 5).
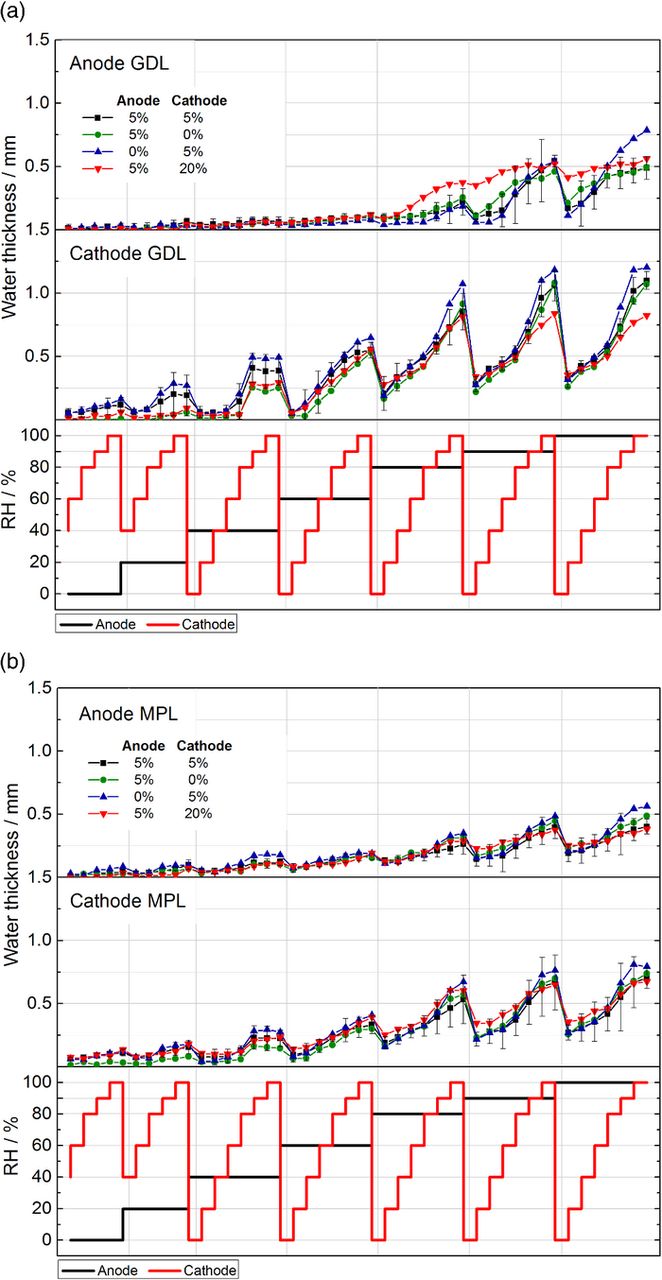
Figure 6. Integral amount of water inside the (a) GDL and (b) MPL in the anode and cathode side at various humidification conditions.
On the cathode side, very similar values for all cells are obtained for anode humidifications below 80%RH. Above this value, the cells with 0% and 5% PTFE have similar saturation levels. However, the cell with 20% PTFE shows significantly less water. As this cell is the one with the largest mass transport losses, this figure clearly shows that diffusion limitations are not only a function of the integral water saturation level of the GDL. More likely, the form of the water accumulation has an even major influence and has to be taken into account.
Analogous to the GDL, the water saturation levels inside the MPL are plotted in Figure 6b. As can be seen, no clear differences can be measured between the cells. This can be explained by the fact that the same MPL material has been used for all cells, but also indicates that the PTFE content of the GDL has a limited effect on water in the MPL.
Limiting current density
Figure 7 depicts the results of the limiting current density measurements of oxygen in (a) nitrogen and (b) helium as a function of its oxygen concentration. Under dry conditions all cells, except the cell with the highest PTFE loading, show similar limiting current densities in nitrogen, with moderate variabilities of the three baselines. These differences between the individual cells may result from cell-to-cell variations of the used materials (e.g. differences of the pore structure of the GDL) which are more pronounced under limiting currents compared to normal operation conditions with pulses, where much smaller variances have been observed on the identical cells.36 However, the cell with 20 wt% of PTFE shows a significantly lower performance in the dry state, which correlates to the increase of bulk mass transport losses observed with the PGA. Under full humidification, the limiting currents are strongly decreased due to the condensation of liquid water inside the PEFC. The cells with 5% PTFE on the cathode show a decrease of approximately 25% of their limiting current compared to the dry state. Consistently with the previous measurements with PGA, the cell without PTFE on the cathode side is strongly influenced by the accumulation of water, with a limiting current approximately 3 times lower than its value for a dry GDL (see Table III). If the limiting current values are linearly extrapolated to an oxygen concentration of 21%, a limiting current density close to 1 Acm−2 is obtained which is similar to the values obtained in the I-V curve in Figure 1. The effect of water accumulation on the cell with 20% PTFE is a reduction of 35% of the limiting current density, which is also a stronger reduction than in the case with 5% PTFE.
Table III. Ratio of the increase of the limiting current under mixtures of helium and nitrogen at two different humidification conditions.
| Cell | 1 (base case) | 2 | 3 | 4 |
|---|---|---|---|---|
| Slope O2-N2 dry/Acm−2 10−2 | 14.46 | 13.21 | 13.88 | 10.18 |
| Slope O2-N2 full hum./Acm−2 10−2 | 10.87 | 4.41 | 9.84 | 6.68 |
| Slope O2-He dry/Acm−2 10−2 | 26.16 | 25.10 | 24.91 | 19.71 |
| Slope He full hum./Acm−2 10−2 | 21.96 | 9.39 | 19.74 | 14.22 |
| IFS dry/- | 1.81 | 1.90 | 1.79 | 1.94 |
| IFS full hum./- | 2.02 | 2.13 | 2.01 | 2.13 |
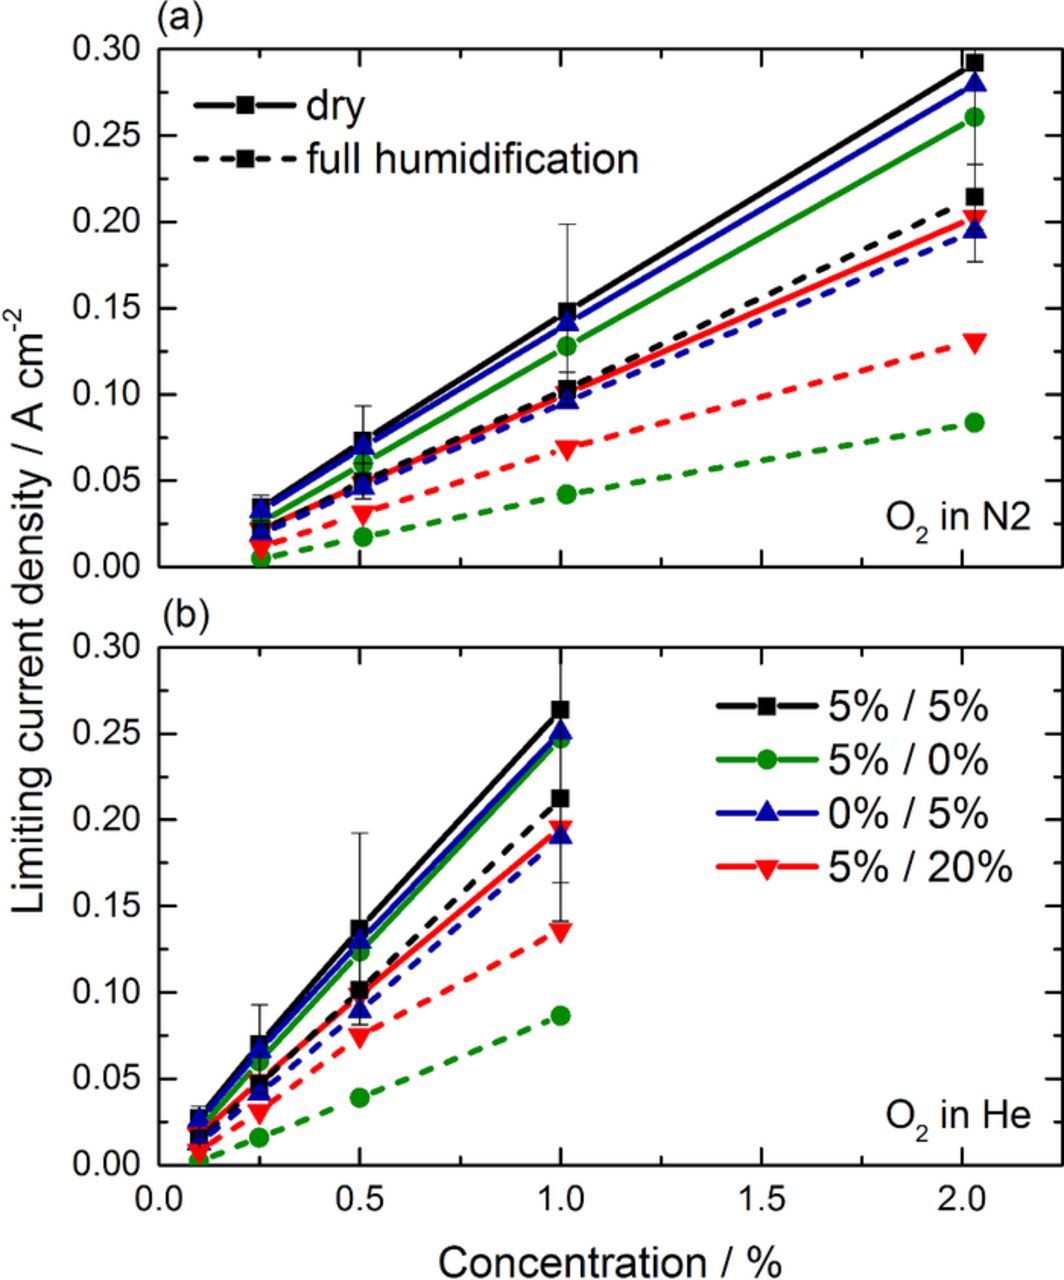
Figure 7. Limiting current density as a function of the concentration of oxygen in (a) nitrogen and (b) helium.
Under mixtures with helium (see Figure 7b), increased limiting currents are reached compared to operations under nitrogen, which result from the increased diffusivity of oxygen in helium. According to Kocha et al.,42 the enhancement of diffusivity is of approximately 2 for a case where the water vapor represents an important molar fraction. In our case (70°C, 2 barabs), the water molar fraction is at most 0.16 and the enhancement of diffusivity should be near to the value of 3.5 corresponding to dry gases. In order to evaluate this improvement, an improvement factor of the slope (IFS) is introduced as the ratio of the slope under air and helox. As shown in Table III, the increase of the IFS value when using helium based mixtures is lower than this and ranges from 1.8 to 2.1. A likely explanation to this apparent discrepancy is the limitation introduced by the non-bulk diffusion terms (e.g. diffusion through the ionomer in the electrode), which are not affected by the introduction of helium. Consistently with this explanation, the effect of using helium is generally higher in cases with lower current densities, attributed to high bulk diffusion losses.
Figure 8 shows the water distribution during (a) the limiting current experiment after water accumulation and (b) the constant current operation. At first glance, significant differences can be observed between the two sets of images. During the measurements of limiting current density, water tends to accumulate under the flow channel inside the cathode GDL. As has been identified during our previous experiments, these regions are critical with respect to bulk mass transport losses. These differences in the water distribution might be related to differences in the local current density distribution between channel and rib, which results from the highly diluted oxygen inside the carrier gas, and also to the lower average current density (<0.3 Acm−2). To this last point, it must be noted that experiments conducted with large current densities and higher concentrations56 also likely result in a modified water distribution due to the important heat production at the voltages used for limiting current measurements. Consequently, the significance of limiting current measurements for real cell operation may be questioned. Nevertheless, these experiments allow to point out important characteristics of the GDL diffusivity. First, the lower diffusivity of the dry structure when using an excess of coating is evidenced. Second, even if the water distribution is not the same than in real operation, our measurements clearly show that water accumulation can have very different impacts depending on the GDL: a similar amount of water causes a limiting current reduction of 25% in the case with 5% PTFE and by a factor 3 in the case without PTFE, while a very small quantity of water causes a reduction of 35% in the case with 20% PTFE. Both trends are consistent with the measurements performed in real operation with the PGA method
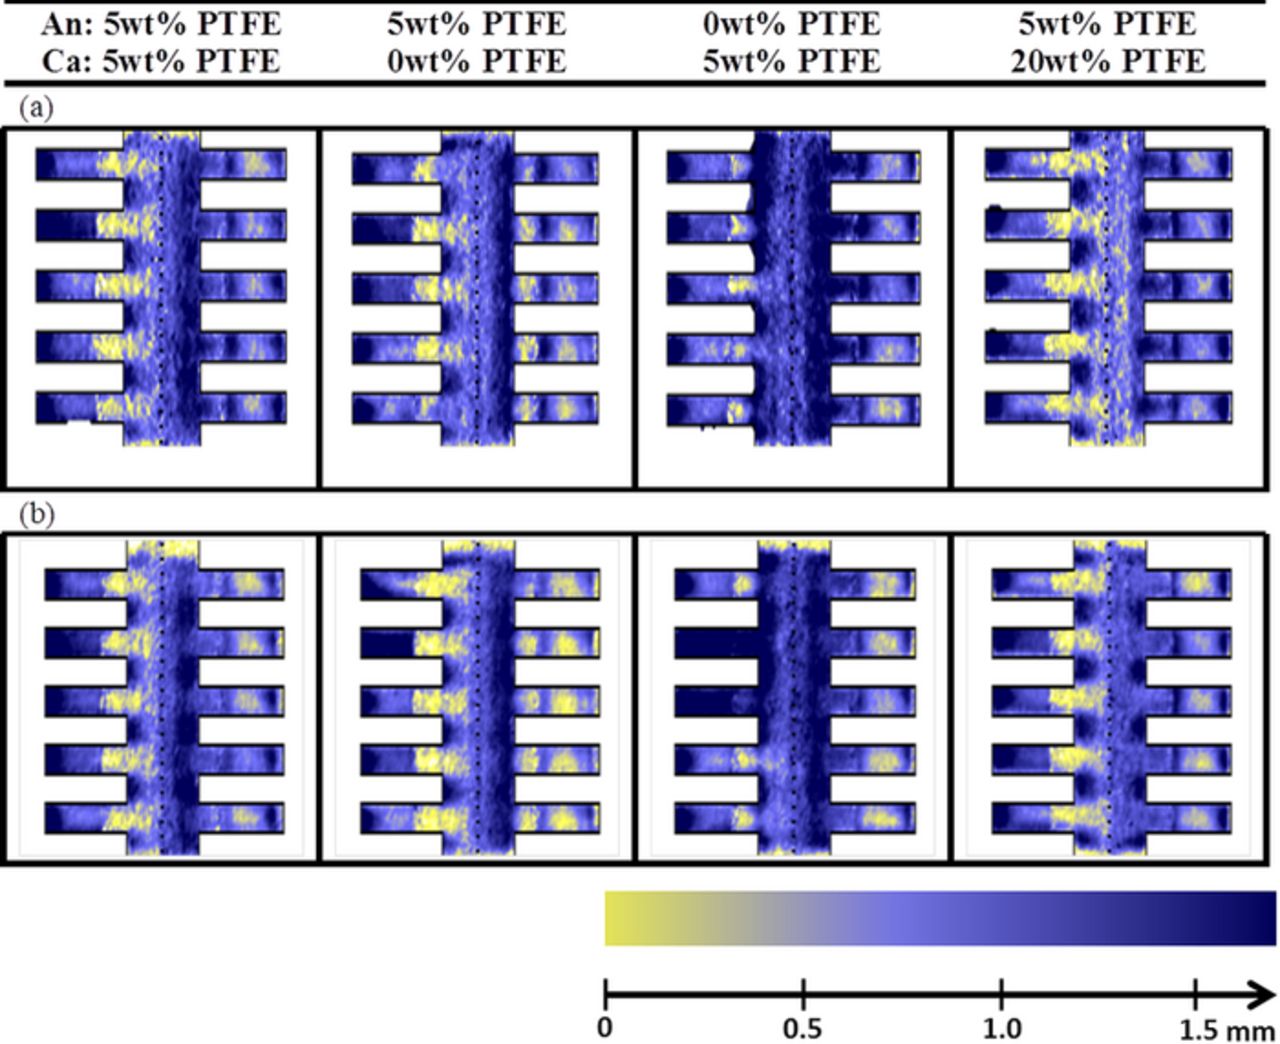
Figure 8. In-plane water distribution of PEFC during (a) limiting current measurements and (b) continuous operation at full humidification.
Discussion
Local water accumulations inside GDL without coating
The cell without PTFE in the cathode suffers from a strong increase of mass transport losses during the 2 hours of operation. Although the average amount of water in the cathode GDL is not increasing over time, a redistribution of water is observed, with preferential accumulations under the channels and at the edges formed by the channel walls and the GDL. This redistribution can be once again explained by the different water accumulation onto the graphite fibers of the GDLs. With a low PTFE coating load, water accumulates in form of a water film onto the fibers whereas water accumulates in form of droplets in more hydrophobic GDLs (see Figure 9). Consequently, the surface of water is highly increased in the case of a hydrophobic GDL, resulting in a better water uptake by evaporation or drag force of the passing gas. As analyzed and explained previously,30 the regions under the channel and at the GDL/rib/channel edge are more critical with regard to mass transport, because they concentrate a higher flux of diffusive oxygen transport, which explains the massive losses observed with this cell.
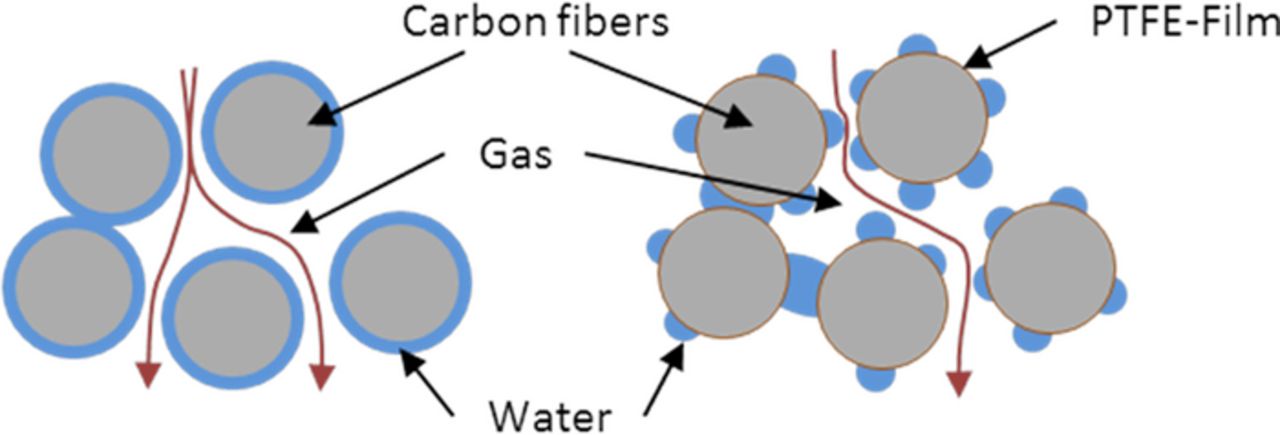
Figure 9. Schematics of the water accumulation inside a hydrophilic pore (left) and hydrophobic pore (right).
In order to understand the stepwise decrease of the voltage (blue) in more detail, Figure 10 depicts the temporal evolution of the cell voltage correlated with its amount of water under the flow channels inside the GDL (orange) and bottom of the flow channel (green and red). The cell voltage can be clearly correlated to recurrent minima of the water thickness inside the flow channel. Although the amount of water inside this region rises up again to approximately 1.5 mm of liquid water, the cell voltage remains reduced. Regarding the water distribution inside the GDL, no correlation can be identified to the stepwise decrease. A possible explanation of the ongoing process might be the following: At the beginning of the experiment, water is accumulating as droplets on top of the GDL (see Figure 10). After reaching a critical cluster size, water is kept at the GDL/channel/rib interface. With our imaging configuration, this would translate in high thickness of water in direction of the beam on a very small pixel area, and in the vicinity of the gold coating of the channels. With the imaging configuration used, it is probable that such accumulations in a very concentrated image region would not be visible, which explains that the hypothesis illustrated in Figure 10 is only visible as droplets disappearing from the GDL/channel interface.
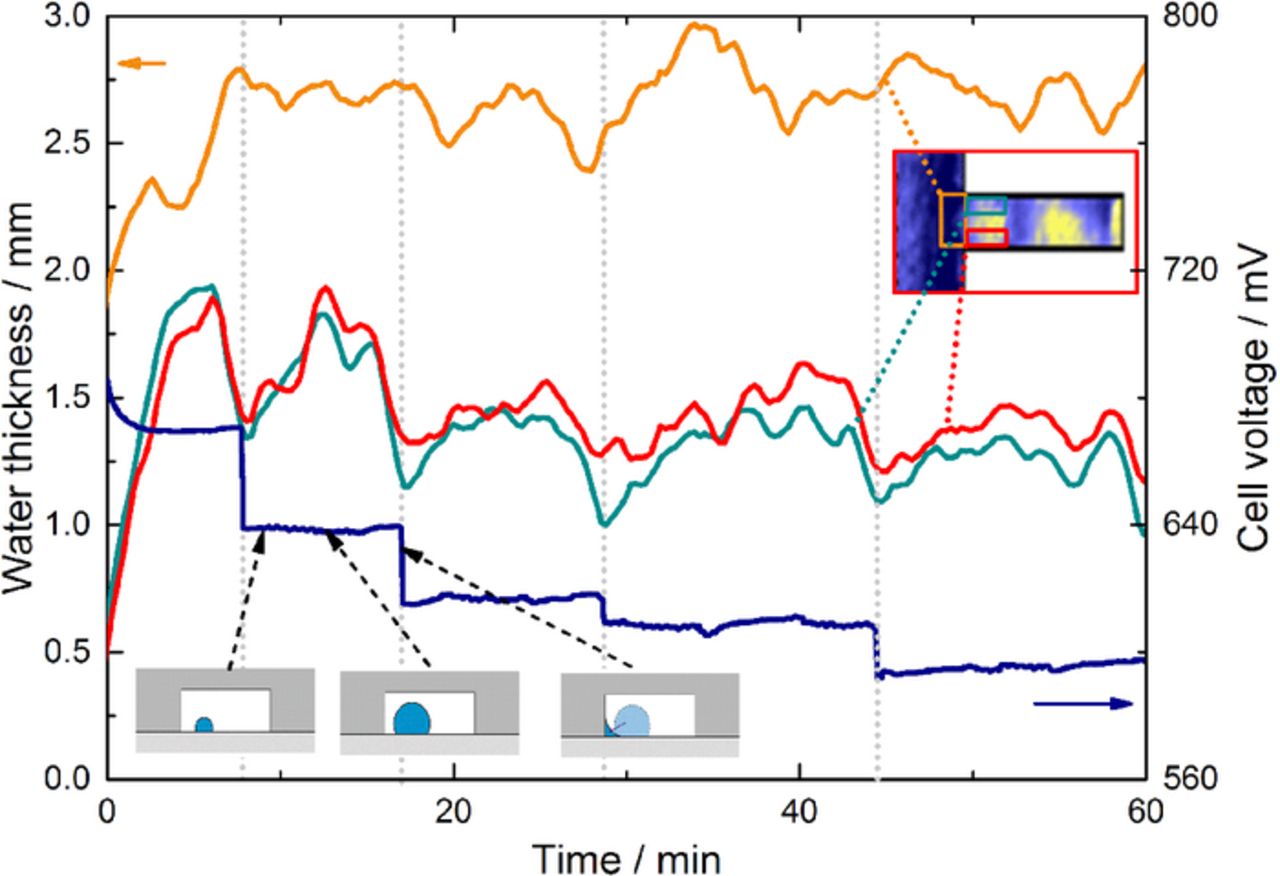
Figure 10. Temporal evolution of the cell voltage and water thickness inside the uncoated GDL.
Influence of high levels of coating on diffusivity
Compared to water, the reactant gases (H2, Air) are transported in the opposite direction through the GDL. On the cathode side, the transport of oxygen mostly relies on diffusion in nitrogen. The effect of GDL structure and water on gas diffusion is described using an effective diffusivity Deff:57
![Equation ([3])](https://content.cld.iop.org/journals/1945-7111/162/10/F1243/revision1/jes_162_10_F1243eqn3.jpg)
where Dbin depicts the binary diffusion coefficient. The tortuosity τ(s) and the porosity ε(s) are functions of the water saturation level inside the GDL.
As has been reported in Ref. 37, the porosity is decreased and the tortuosity is increased by the addition of a hydrophobic coating. According to a simple mass balance, the initial porosity of the GDL without coating decreases by 1.24% in the case of 5 wt% PTFE and 4.97% with 20 wt% PTFE. Although these values seem to be rather small, Hwang and Weber58 reported that even small changes of porosity can result in a strong reduction of effective diffusivity. This influence has been clearly identified within our experiment at low humidifications, where an essential offset has been measured with the cell of 20% PTFE.
Beside the change of the values for unsaturated media, the effect of water on porosity and tortuosity can depend on the coating load of the fibers (cf. illustration in Figure 9). As has been shown by Ziegler et al.,59 water accumulates as a film of water onto hydrophilic carbon fibers, whereas in form of droplets onto hydrophobic fibers (see schematic Figure 9a). Consequently, identical saturation levels (identical effective porosity) may lead to significant differences of the tortuosity. As the effective diffusivity is a function of both parameters (see Eq. 3), a higher sensitivity to water can be expected for highly coated GDLs. This characteristic has been clearly observed in Figure 4, where the configuration with 20 wt% PTFE has shown the highest sensitivity to water according to the PGA analysis. Similar results have been published by Lim et al.1 who identified a higher sensitivity of the cell performance with high coating load on the stoichiometry in undersaturated operation conditions on the cathode side. The results obtained using limiting current density measurements give a complementary insight to the PGA method. The impact of PTFE loading on the diffusivity of the dry GDL is clearly shown by the reduction of limiting current between the cases with 5% and 20% PTFE on the cathode side. If we would assume that the water impacts the diffusivity of both materials in the same way in relative terms (which corresponds to the use of a modified Bruggeman relation56 with the same exponent), the higher sensitivity to water of the cell with 20% PTFE could be explained by the non-linearity of the overpotential as a function of oxygen concentration. Due to this non-linearity, a given relative reduction of the diffusivity has a larger impact in terms of voltage loss if the GDL has a lower initial diffusivity. However, the relation between water accumulation and limiting current density contradicts this explanation: Although the quantity of water is smaller in the cell with 20% PTFE (in particular during the limiting current measurements), the limiting current density is reduced in a larger extent for this cell. In consequence, at least a part of the increased sensitivity to water of the cell with high PTFE loading has to be attributed to a different morphology of water (cf. illustration in Figure 9).
The increase of the bulk losses under dry conditions can hardly be attributed to water accumulation and was explained in a previous publication showing similar results30 by the fact that, with increased membrane resistance, the cells increasingly rely on current production under the ribs. This effect is visible on all cells, but particularly affects the cell with a high PTFE loading, which suggests that the diffusivity of the dry structure is significantly affected in this case.
Effect of coating on CL/MPL flooding
CL flooding is expected to be visible as an increase of the indicator of non-bulk losses, as according to the literature30,42 non-bulk losses originate from diffusive transport inside small pores (Knudsen diffusion) and through the ionomer in the electrode (thin-film diffusion). During the experiments (see Figures 2 and 5), no differences between the four cell configurations were identified, which emphasize that the PTFE loading of the GDL seem to have no considerable influence on CL flooding. This has not been anticipated, as the capillary pressure of water increases with increasing coating, leading to reduced water permeation and increased accumulation at its interface. However, if we calculate the integral amount of water during the RH-Map inside the MPL (see Figure 6b), no differences can be found between the four cell configurations. As the cells have the same MPLs with a high PTFE concentration (23%)60 and much smaller pore sizes (<100 nm) than the GDL, the capillary pressure of liquid water is expected to be much higher than inside the GDL (see Equation 3). Consequently, CL flooding is determined by the composition and the surface properties (e.g. cracks) of the MPL and not by the PTFE concentration of the GDL. This finding is in good agreement with Ref. 20 where a higher risk of CL flooding has been correlated to higher coating levels of GDLs without MPL.
Effects of coating on contact resistance
During the experiments no significant differences of the electric resistance have been identified between the four configurations. This is surprising, as the supplementary unconductive PTFE-coating should increase the contact resistance between flowfield and GDL. However, the bulk resistance of the GDL should not be increased, as the coating has been applied subsequently onto the pure carbon fibers. According to Mathias et al.,22 the contact and bulk resistance of the GDL increases by adding a hydrophobic coating. Within our measurements, the ohmic losses measured include conductivity losses originating from the PFSA membrane as well as electrical bulk and contact resistance of the GDL. As the conductivity of the membrane is significantly lower compared to the values from the GDL, changes of the ohmic losses account for only a small portion and may be hidden behind the dominating variations of the PFSA membrane. Besides this effect, the measurements in literature3,7,22 have been performed with Toray where this effect can be significant. SGL features a highly porous carbon binder which strongly increases the contact surface, leading to significantly lower bulk and contact resistances as compared to materials of Toray.
Conclusions
The impact of different amounts of PTFE coatings inside the GDLs of polymer electrolyte fuel cells in terms of mass transport losses was studied with differential cells. Based on the combination of three complementary characterization techniques (neutron radiography, limiting current density, pulsed gas analysis), a detailed characterization of the local mechanisms was elaborated on state-of-the-art materials. The combination of these three analytic methods allows the correlation of the water distributions obtained with high resolution in-plane neutron radiography to effects of bulk and non-bulk mass transport losses inside the GDL and CL. Based on the study of the polarization curves, constant current operation during 2 h and asymmetric variations of the feed gas stream, the following new key findings have been obtained:
- (1)High mass transport losses do not always correlate with higher amount of water: The cell with the highest amount of PTFE has shown the lowest amount of water, although increased mass transport losses are observed. Within this paper, these losses are explained with a different morphology (film, droplet) of water accumulation.
- (2)Mass transport losses do primarily correlate with the location of water accumulation: The amount of water inside the cathode GDL without hydrophobic coating is not increased. However, water redistributes over time inside the GDL toward the regions under the flow channel, resulting in massive mass transport losses.
- (3)The amount of PTFE in the GDL has a minimal impact on the flooding of the MPL and of the CL.
- (4)Operation under limiting current densities lead to significant changes of the water distribution: The neutron radiographs have identified substantial differences between the water distribution during operation under limiting current and normal operation. Nevertheless, these measurements give a very complementary insight to the pulsed gas analysis method.
Acknowledgments
This work was carried out with the support of the European Community. We appreciate the support of the European Research Infrastructure H2FC (funded under the FP7 specific program Capacities, grant Agreement Number 284522). The Commission for Technology & Innovation and the Swiss Competence Center for Energy Research (SCCER): Efficiency in Mobility and the SCCER: Heat & Electricity Storage are greatly acknowledged for supporting this work.