Abstract
Over-lithiated layered oxide (OLO) materials were coated with a PEDOT:PSS conducting polymer via a simple wet-coating method. The prepared samples were observed by scanning electron microscopy (SEM), transmission electron microscopy (TEM), X-ray diffraction (XRD), and Fourier transform infrared spectroscopy (FTIR). The electrochemical properties of the samples were determined by galvanostatic testing and electrochemical impedance spectroscopy (EIS). PEDOT:PSS coated cathode materials showed better rate capability and cyclability between 2.0 V and 4.6 V. X-ray photoelectron spectroscopy (XPS) data imply that the improved electrochemical performance of coated OLO is due to the suppression of the formation and growth of the solid electrolyte interface.
Export citation and abstract BibTeX RIS

This is an open access article distributed under the terms of the Creative Commons Attribution 4.0 License (CC BY, http://creativecommons.org/licenses/by/4.0/), which permits unrestricted reuse of the work in any medium, provided the original work is properly cited.
Recently, energy storage devices have become more important owing to the use of various mobile digital applications such as cell phones, tablet personal computers (PCs), and laptops. The typical commercial cathode material, LiCoO2, became commercially available in the 1990s.1 However, because of the high cost and un-ecofriendly properties of LiCoO2, alternative candidates such as layered-type LiNiO2, Li[Ni, Mn]O2 Li[Ni, Mn, Co]O2, spinel-type LiMn2O4 and LiNi0.5Mn1.5O4, and olivine-type LiFePO4 have been developed as replacements.1–7 Among the many candidates, over-lithiated layered oxide (OLO), reported by the Thackeray group in 2005, exhibits a higher capacity (>200 mAh/g) and can reduce the use of expensive cobalt. Therefore, OLO is receiving attention as a cathode material for lithium-ion batteries (LIBs).8,9
However, OLO experiences an inevitable oxygen loss and, subsequently, an irreversible capacity during the initial charge and discharge process. Additionally, the layered structure of OLO transforms into the spinel phase on cycling. The Li2MnO3 phase in OLO materials exhibits a relatively low electronic conductivity owing to the insulating characteristics of the Li2MnO3 component.8,9 Referring to the reports by the Thackeray group, OLO material properties such as particle size, morphology control, compositional control by cationic substitution, and surface modification of parent OLO materials have been investigated to improve electrochemical properties.10–16
Among the various researches published, investigations of surface modification mostly aim to decrease the initial irreversible capacity at initial cycles and suppress the side reaction between the cathode and electrolyte. Most materials for surface modification can be categorized into three groups: inorganic oxides, carbon-based materials, and polymer-based materials. The inorganic materials, which include AlF3, AlPO4, CoPO4, TiO2, V2O5, Al2O3, MnO2, ZnO, ZrO, MgO, Sm2O3, Li-Mn-PO4, and Li-Ni-PO4, are known to decrease the irreversible capacity and improve the electrochemical performances of OLO materials owing to the enforcement of stability on the surface in the high-voltage region.17–31 The carbon materials, including graphene-based materials, are employed to improve the electronic conductivity of OLO cathode materials.19,32–34 Also, surface modification by conducting polymers, such as polypyrrole, has been recently reported to provide improved electronic conductivity as well as a thin protective layer on OLO cathode materials.35 Among various conducting polymers, thin film Poly(3,4-ethylenedioxythiophene) Polystyrene sulfonate (PEDOT:PSS) is known to exhibit superior electronic conductivity.36 Also, a uniform layer of PEDOT:PSS can be easily fabricated by employing a simple wet-coating method.37
In this study, surface modification by PEDOT:PSS on OLO materials is performed by a wet-coating method to improve the electrochemical performance of cathodes, and an electrochemical evaluation as well as in-depth analyses are carried out to address the influence and effect of PEDOT:PSS on OLO cathodes for high-capacity LIB applications.
Experimental
Li1.17Mn0.56Co0.095Ni0.175O2 powders as active materials were obtained from Ecopro Co., Ltd. (South Korea). PEDOT:PSS, in a water-based solution, was coated onto the powders using a simple wet process for surface modification. The required amount of PEDOT:PSS solution was added to the oxide powders to achieve a nominal surface coating with 1 or 2.5 wt% of conducting polymer, as compared to that of the parent powders. The mixture was stirred for 30 min until the water solvent was dried. Then, the mixture was dried overnight at 110°C to obtain the final product. The prepared powders were evaluated by analysis techniques such as X-ray diffraction (XRD, Rigaku, Ultima IV), field emission scanning electron microscopy (FE-SEM, Hitachi S4500), and high-resolution transmission electron microscopy (TEM, FEI Company-Tecnai G2). The XRD data was measured using monochromatic Cu Kα radiation at 40 kV and 100 mA to identify the phases in samples. The XRD patterns were recorded with a scan speed of 4° per minute between 10° and 90°. To analyze the content and elements of the samples, elements analysis (EA, Leco, CS600), fourier transform infrared spectroscopy (FTIR, Thermo, IS 10) was performed.
The cathode electrodes consist of a mixture of the active material powder (94 wt%), acetylene black (3 wt%), and polyvinylidenedifluoride (3 wt%, PVDF, solef 6020) on aluminum foil, which acts as the current collector. The anode was prepared by utilizing lithium metal as the counter electrode. The loading level of electrode is approximately 7.5 mg cm−2. The 1.3 M LiPF6 in a mixture of ethylene carbonate (EC) and ethyl methyl carbonate (EMC) (1:1 by volume) was employed as the electrolyte and polypropylene separator from Tonen. CR2032 type coin cells were assembled in a dry room at room temperature. The electrochemical performance of the cathode was evaluated at 25°C by Maccor. The cells were charged and discharged by the galvanostatic test measured in a voltage range between 2.0 and 4.6 V versus Li/Li+. Electrochemical impedance spectroscopy (EIS, Bio Logic, VMP3 Multi potentiostat/Galvanostat with EIS) was evaluated by employing a three-electrode pouch cell. EIS measurements were carried out between 10 mHz and 1 MHz by applying an AC perturbation signal of 5 mV. The X-ray photoelectron spectroscopy (XPS, Ulvac-PHI, 5000VersaProbe) data were obtained under Argon atmosphere and the x-ray source was monochromatic AlKα at 117.4 eV and the x-ray spot diameter was 100 um.
Results and Discussion
Figure 1a shows the FT-IR spectra of the pristine and the PEDOT:PSS coated OLO powders, as well as the PEDOT:PSS material, displaying evidence of coating materials on the parent powders. Although the pristine OLO materials do not exhibit significant peaks or features between 650 and 4000 cm−1, PEDOT:PSS coated powders exhibit distinguishable peaks in the FT-IR spectra. In Fig. 1b, enlarged profiles are provided for the wavenumbers ranging from 650 to 1600 cm−1. As shown in Fig. 1b, both PEDOT:PSS coated powders show similar patterns, while 2.5 wt% PEDOT:PSS coated powders exhibit well-developed peaks compared to the powders with 1 wt% PEDOT:PSS. The peaks assigned at 980, 1310, and 1513 cm−1 correspond to C–S, C–C, and C=C bonds, respectively, which originate from the thiophene ring in PEDOT.38–40 The peak of the vibration at 1083 cm−1 is observed owing to the C–O–C bond stretch from the ethylenedioxy group. Evidence of PSS is also found at 1030 and 1180 cm−1, which corresponds to the bonds of O–S–O and S=O, respectively.38–40
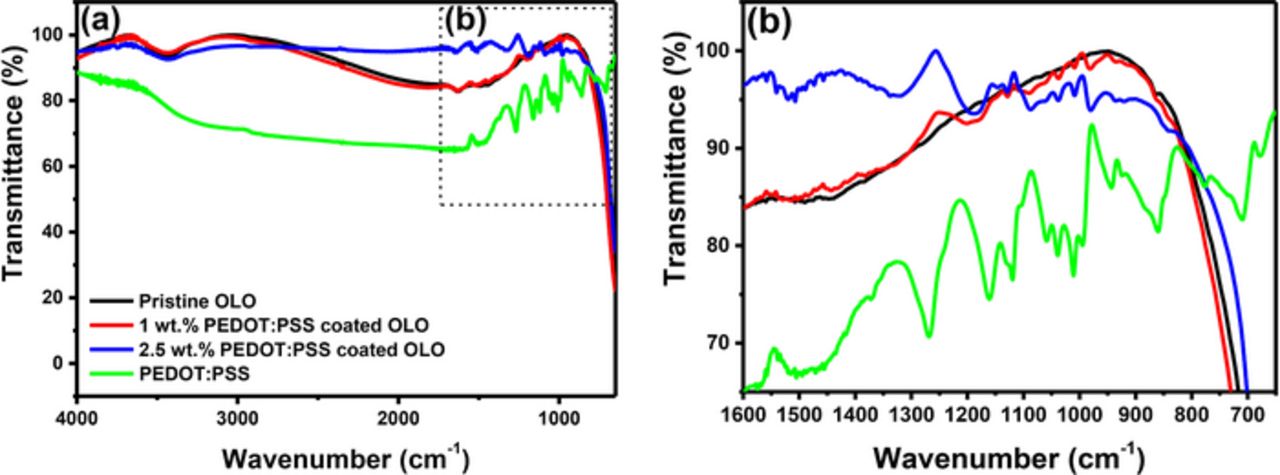
Figure 1. FT-IR spectra for pristine OLO, 1 wt% PEDOT:PSS coated OLO, and 2.5 wt% PEDOT:PSS coated OLO (a) full scale (b) magnified scale.
In order to identify the effectiveness of the coating process and confirm the amount of coating materials, elemental analysis is performed, and the results are summarized in Table I. PEDOT:PSS alone contains 41.6% carbon and a small amount of sulfur, hydrogen, and nitrogen. Because the PEDOT:PSS coating is expected to be 1 and 2.5 wt% of conducting polymer, as compared to that of the parent OLO materials, no trace of H and S is found for the PEDOT:PSS coated OLO powders. However, carbon contents from EA results indicate evidence of PEDOT:PSS on the parent materials. Pristine OLO powders also contain a small amount of carbon, possibly owing to impurities present during the synthesis process. Based on the carbon contents, the amount of PEDOT:PSS material is calculated and shown in Table I. The data reveals that 0.85 and 2.17 wt% of PEDOT:PSS, respectively, are effectively coated for nominal compositions of 1 and 2.5 wt% coated OLO powders.
Table I. EA of pristine OLO, 1 wt% PEDOT:PSS coated OLO, 2.5 wt% PEDOT:PSS coated OLO, and PEDOT:PSS.
| Element (wt%) | |||||
|---|---|---|---|---|---|
| Samples | C | H | N | S | PEDOT:PSS ratio experimental |
| PEDOT:PSS | 41.6 | 5.2 | 0.7 | 14.6 | 100 |
| Pristine OLO | 0.065 | 0 | 0 | 0 | 0 |
| 1 wt% PEDOT:PSS coated OLO | 0.355 | 0 | 0 | 0 | 0.85 |
| 2.5 wt% PEDOT:PSS coated OLO | 0.905 | 0 | 0 | 0 | 2.17 |
※ PEDOT:PSS ratio is calculated based on carbon contents.
Figure 2 compares the XRD patterns of the pristine and PEDOT:PSS coated OLO materials in order to confirm the crystal structure of the OLO cathodes and the effect of the PEDOT:PSS coating process. All powders exhibit the clear peaks of a hexagonal α-NaFeO2 structure with the space group R-3m, which is the so-called layered structure. The small peaks between 20 and 25° are indexed as the (020) peak (space group C2/m), which corresponds to the Li2MnO3 phase with monoclinic structure.8,9 The XRD patterns presented in Fig. 2 indicate that the surface-modification using a simple wet-coating method does not cause a prominent bulk change of the parent OLO powders. However, the XRD peaks of the PEDOT:PSS are not observed since the amount of coating material is too low to exhibit XRD patterns, and the PEDOT:PSS has a chain polymer structure.37
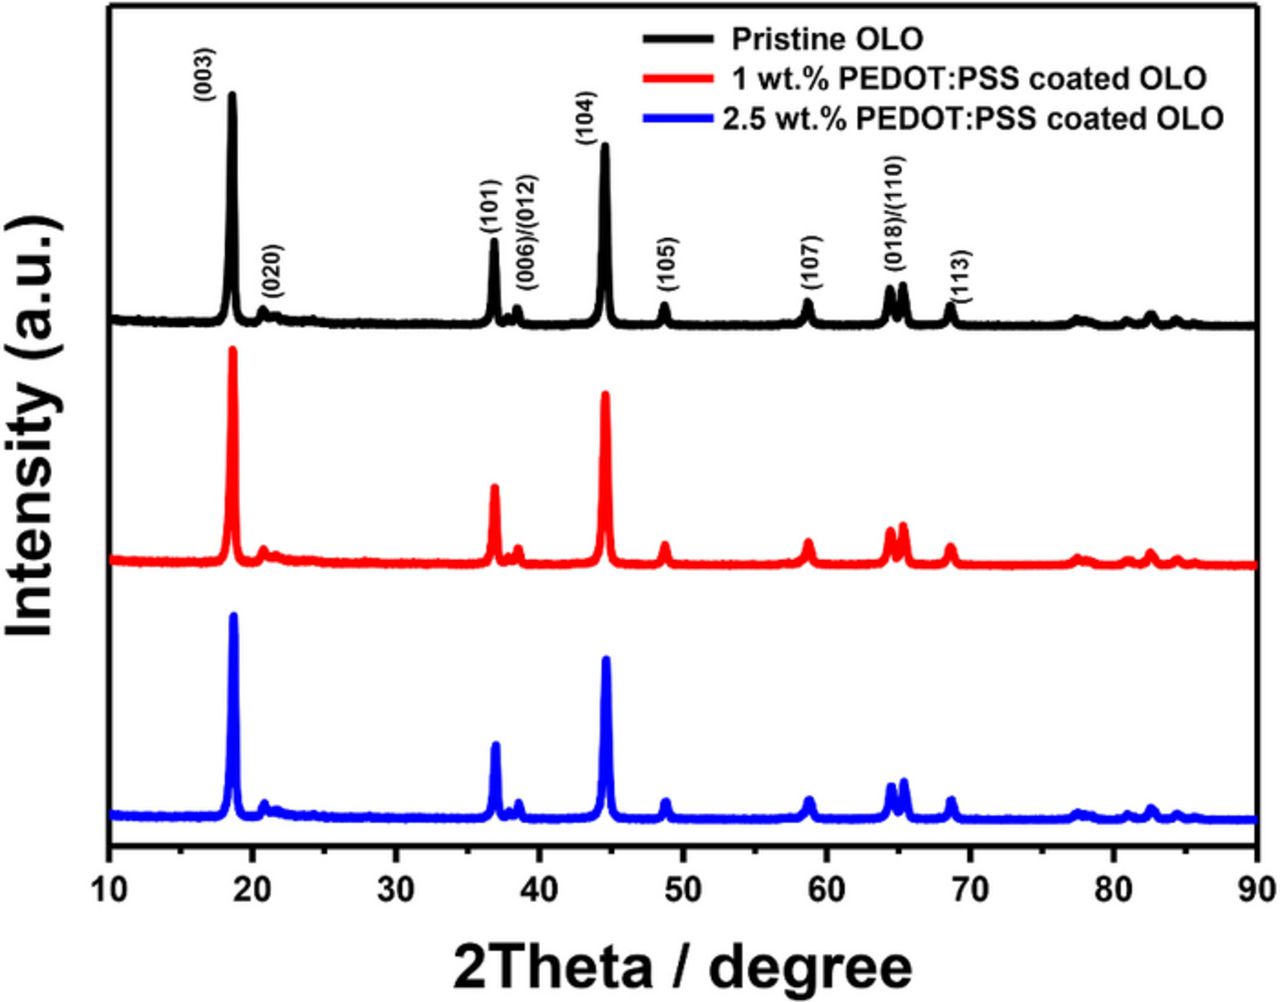
Figure 2. Patterns of x-ray diffraction for pristine OLO, 1 wt% PEDOT:PSS coated OLO, and 2.5 wt% PEDOT:PSS coated OLO.
To identify the surface state of parent materials and the morphology of the PEDOT:PSS polymers, we examined the FE-SEM images shown in Fig. 3. All powders consist of primary particles with sizes ranging from ∼50 to 150 nm and these primary particles aggregate to form sphere-like secondary particles of ∼5 to 10 μm in size. Although a significant difference is not observed among the different OLO powders, PEDOT:PSS coated samples exhibit smaller gaps between the primary particles, implying that the coating layers cover the surface of the particles. Also, the 2.5 wt% PEDOT:PSS coated OLO shows reduced surface roughness that is possibly due to the thicker, homogeneous coating layer on the parent OLO materials. Figure 4 shows the TEM images of pristine and PEDOT:PSS coated OLO particles to confirm the presence of the coating materials. The results indicate that 1 and 2.5 wt% PEDOT:PSS coated samples contain a homogeneous coating layer on the surface of the parent materials. An amorphous coating layer with a thickness of ∼5–8 nm is observed for the surface-modified powders and the 2.5 wt% coated powders exhibit a slightly thicker coating layer compared to the 1 wt% coated powder.
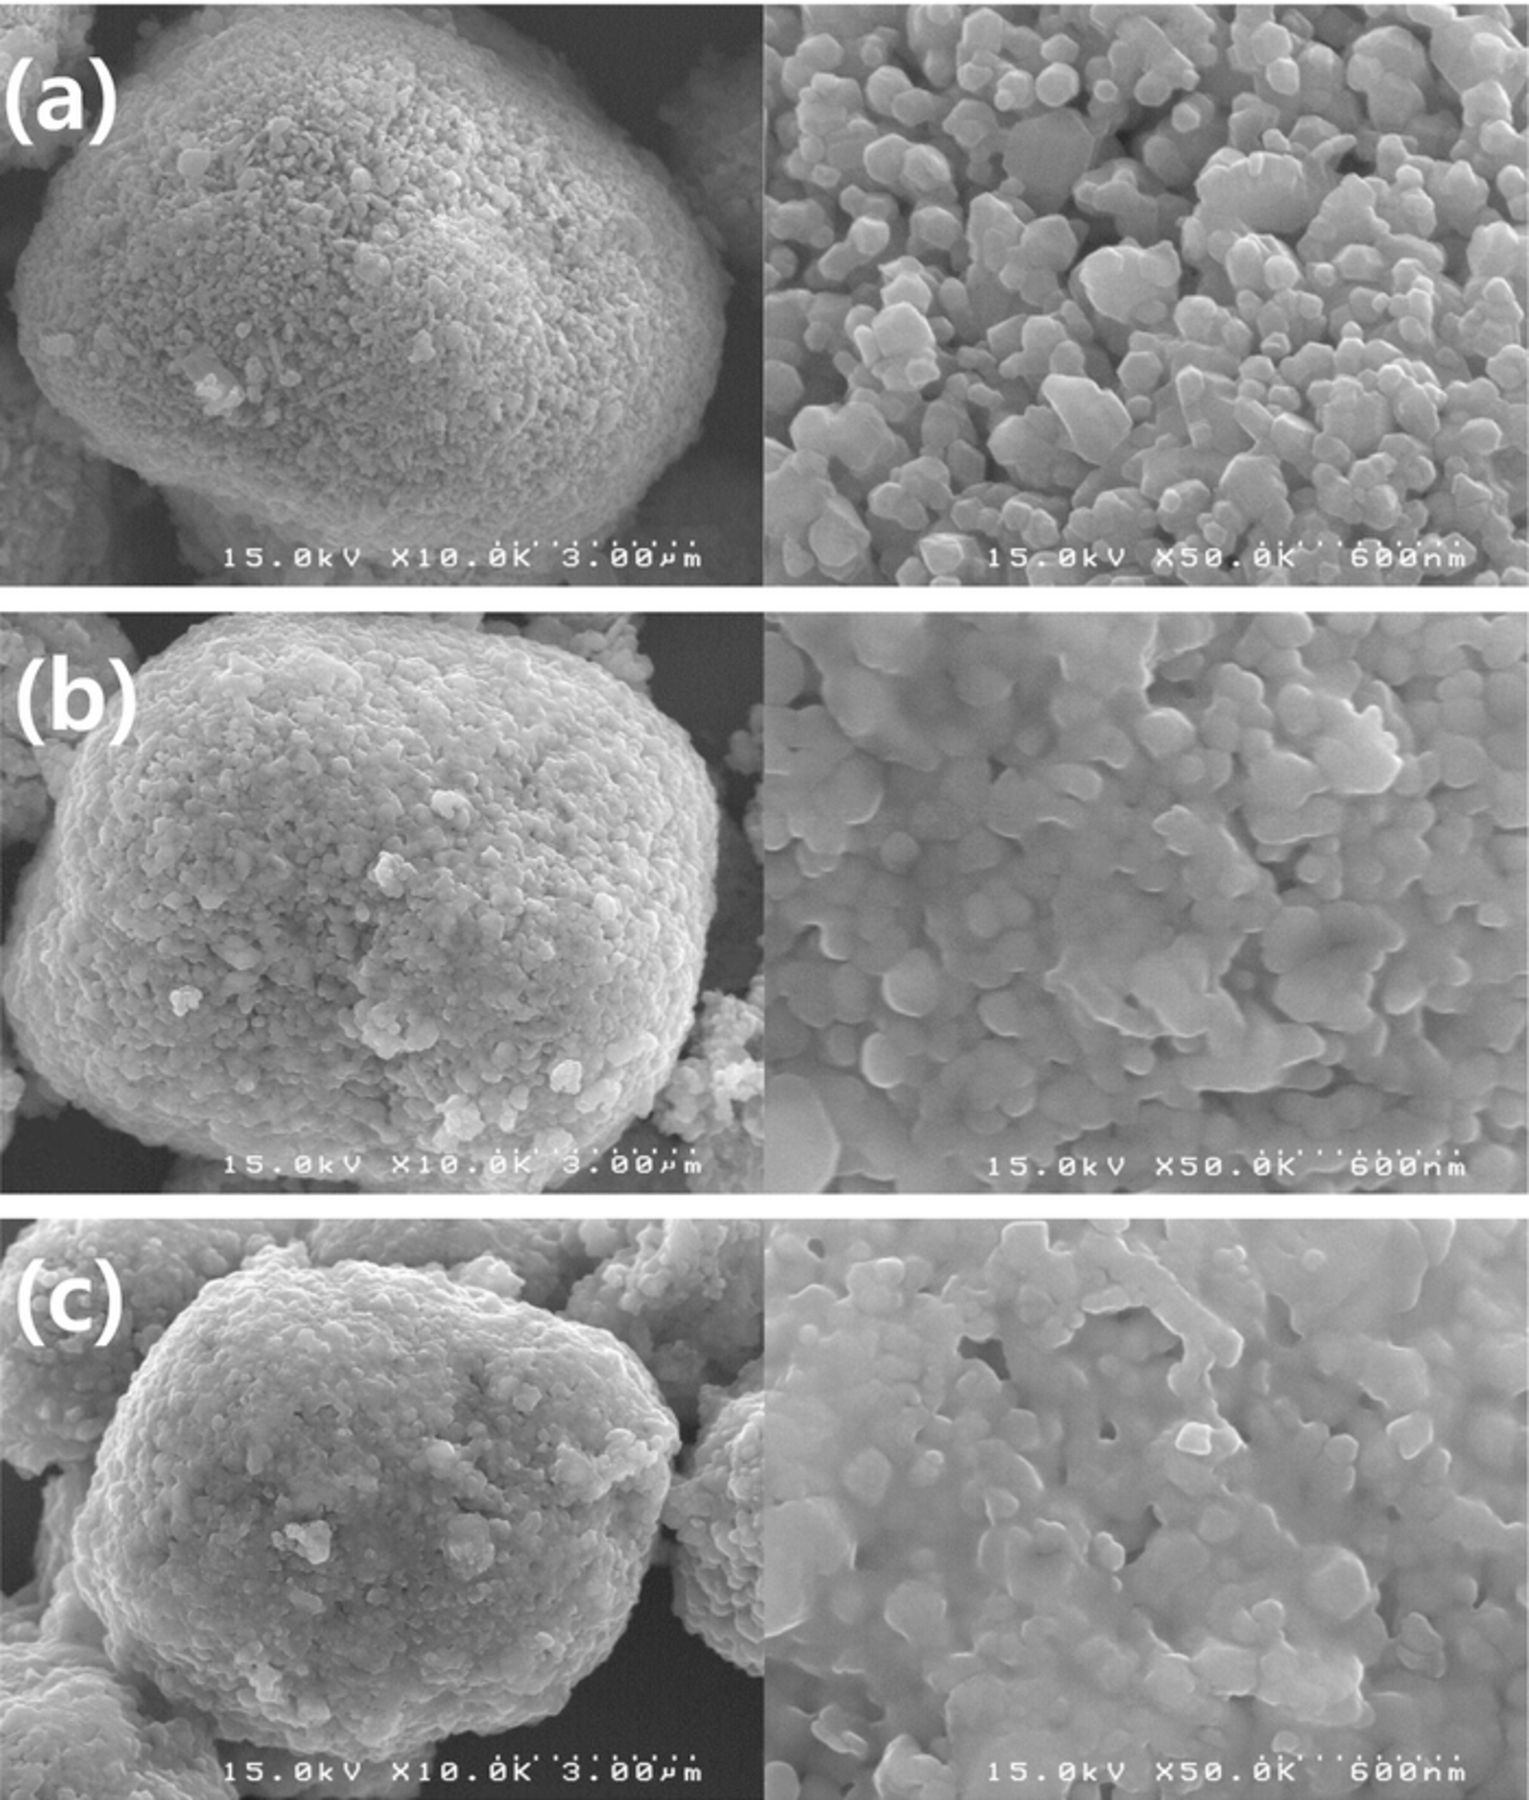
Figure 3. FE-SEM images of (a) Pristine OLO, (b) 1 wt% PEDOT:PSS coated OLO, and (c) 2.5 wt% PEDOT:PSS coated OLO.
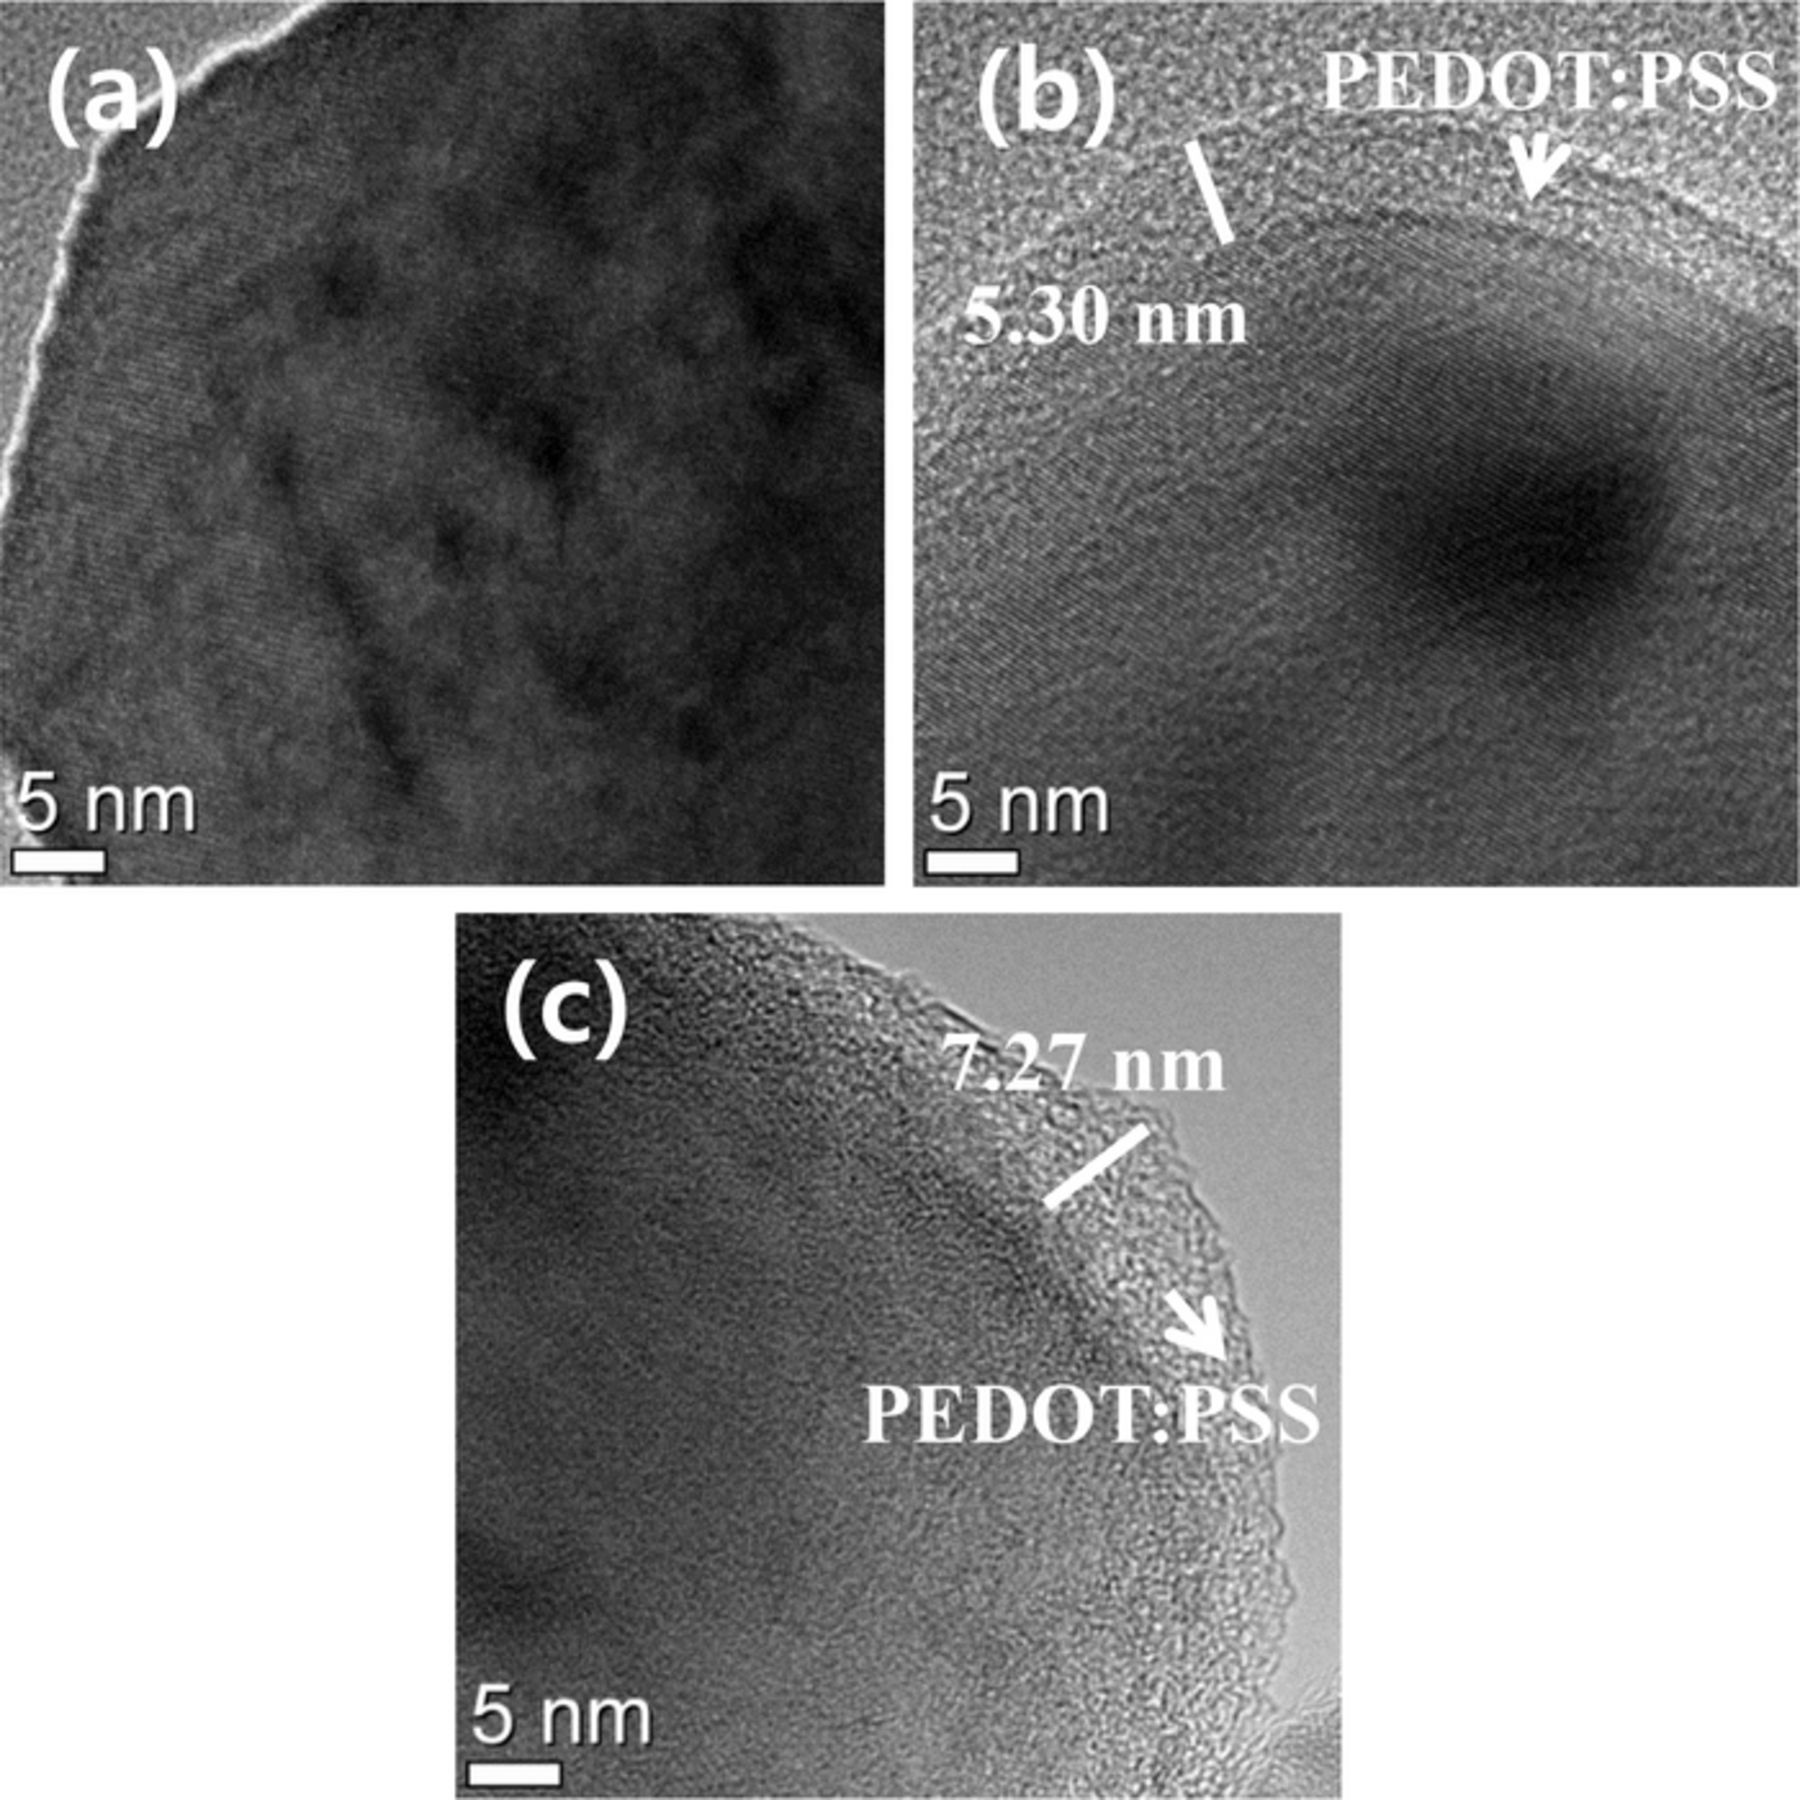
Figure 4. TEM images of (a) pristine OLO, (b) 1 wt% PEDOT:PSS coated OLO, and (c) 2.5 wt% PEDOT:PSS coated OLO.
Figure 5 shows the voltage profiles of OLO-based cathodes for the two initial cycles with 0.05 C charging and discharging in constant current mode. During the charge process of the first cycle, all the cathodes exhibit typical features of OLO materials. For example, the plateau concerning the intercalation/deintercalation of the LiMO2 (M = Ni, Mn, Co) phase is found below 4.4 V. The electrochemical reaction can be explained by Eq. 1 below.41–43
![Equation ([1])](https://content.cld.iop.org/journals/1945-7111/162/4/A743/revision1/jes_162_4_A743eqn1.jpg)
For the second plateau above 4.4 V, the Li2MnO3 phase is related to the extraction of lithium as Li2O, which results in the formation of the MnO2 phase from the Li2MnO3 phase, as indicated in Eq. 2. This electrochemical reaction is found to be irreversible and the corresponding plateau appears only during the first charging.8,9,42,43
![Equation ([2])](https://content.cld.iop.org/journals/1945-7111/162/4/A743/revision1/jes_162_4_A743eqn2.jpg)
All the cathodes exhibit similar electrochemical behaviors during the charge–discharge process while the 2.5 wt% coated sample shows a slight decrease in charge and discharge capacity during the two initial cycles. The pristine and the 1 wt% coated OLO cathodes deliver 295 mAh/g of charge capacity and 265 mAh/g of discharge capacity while the 2.5 wt% coated cathode exhibits 290 and 260 mAh/g during the charge and discharge process, respectively. The decrease in initial capacity is possibly due to the thicker coating layer that hinders the penetration of the lithium ion. However, the 1 wt% coated cathode does not show any decrease in initial capacity as well as in coulombic efficiency, as compared to the pristine electrode.
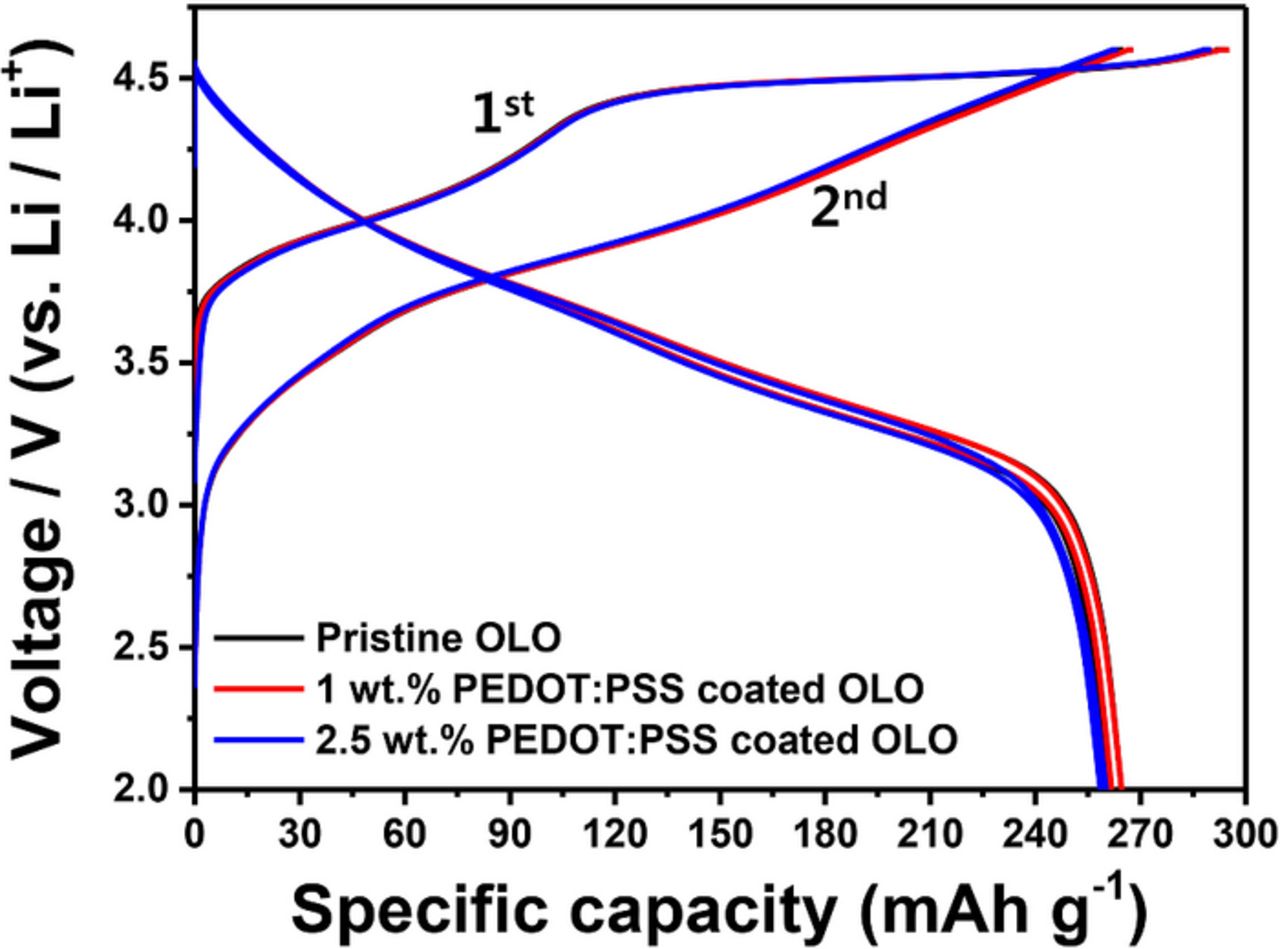
Figure 5. Initial charge–discharge curves for pristine OLO, 1 wt% PEDOT:PSS coated OLO, and 2.5 wt% PEDOT:PSS coated OLO electrodes at 0.05 C-rate.
In Fig. 6, the rate capability was evaluated to examine the effect of coating with conducting polymers at various C-rates ranging from 0.1 to 9 C during the discharge process while the charging current was fixed at a 0.1 C-rate. At the slow discharging of 0.1 and 0.5 C-rate, all cathodes deliver similar capacities. For the 1 C-rate evaluation, 2.5 wt% coated cathodes exhibit slightly better rate capability compared to the pristine and 1 wt% coated cathodes. However, the rate characteristics above the 3 C-rate reveal that the PEDOT:PSS coated electrodes maintain higher capacities compared to the pristine one. For instance, the 1 wt% coated electrode delivers a capacity of 83 mAh/g whereas the pristine cathode gives a discharge capacity of only 20 mAh/g. Although the PEDOT:PSS coated electrodes exhibit similar rate characteristics up to a 6 C-rate, the 2.5 wt% coated electrode shows poor electrochemical behavior at high currents of the 9 C-rate, implying that the thicker coating layer provides a negative effect on the rate characteristics of OLO materials.
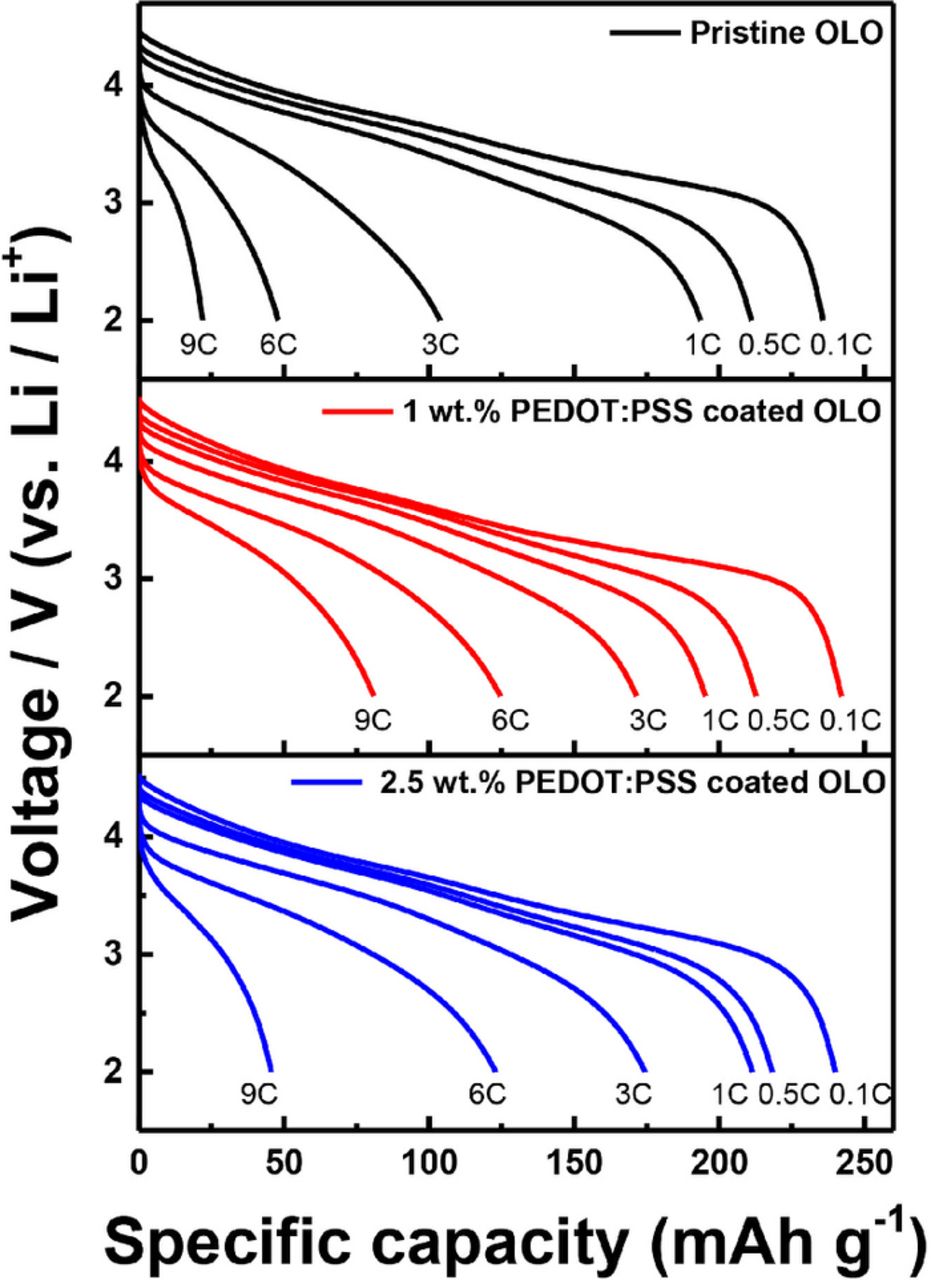
Figure 6. Discharge profiles of the rate capability for the pristine OLO, 1 wt% PEDOT:PSS coated OLO, and 2.5 wt% PEDOT:PSS coated OLO electrode.
Figure 7 compares the cyclability of the pristine and conducting polymer coated electrodes evaluated at 1 C-rate charging and discharging for 50 cycles. Before the 1 C-rate cycling test, all the electrodes were subjected to a few formation cycles to fully activate and utilize the Li2MnO3 phase in the OLO cathodes. The charging process was performed at a constant current mode with 1 C-rate charging up to 4.6 V, followed by a constant voltage mode at 4.6 V until the required current dropped close to the 0.01 C values. All the electrodes deliver initial capacities more than 210 mAh/g, while the 1 wt% PEDOT:PSS coated electrode exhibits the highest initial capacity of 220 mAh/g. This result indicates that the conducting polymer provides an improvement in conductivity and subsequent increase in discharge capacity. Although the 2.5 wt% PEDOT:PSS coated electrode also exhibits a capacity of 215 mAh/g at first cycle, the cyclability after 50 cycles indicates that excessive surface modification with the conducting polymer at around 2.5 wt% does not enhance the electrochemical performance but, instead, possibly hinders the movement of lithium ions during the cycle test. Based on the initial capacity, the 1 wt% PEDOT:PSS coated electrode maintains 67.3% whereas the pristine and the 2.5 wt% PEDOT:PSS coated electrodes retain 48.1 and 49.3%, respectively, of their initial capacity after 50 cycles. Preliminary observation of the plot of differential capacity as a function of voltage, which is not shown in this study, reveals a negligible change of the redox peak and voltage decay on cycling, which suggests that all of the electrodes do not experience a severe phase transition or prominent side reaction with the electrolyte, as previously reported.44–48
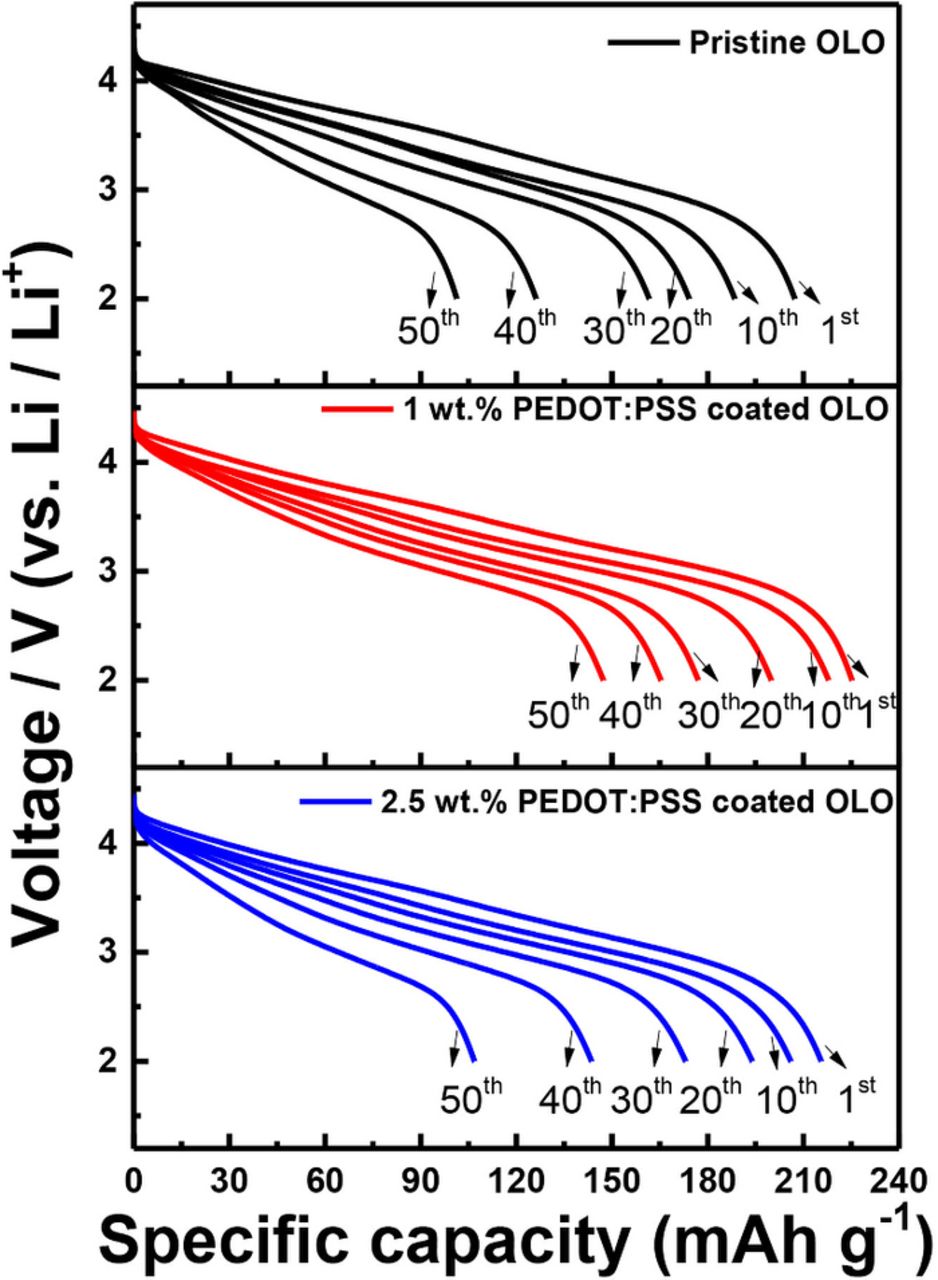
Figure 7. Cycling performance of the pristine OLO, 1 wt% PEDOT:PSS coated OLO, and 2.5 wt% PEDOT:PSS coated OLO electrode for 50 cycles at 1 C-rate.
To confirm the influence of impedance change on cycling performances, EIS was carried out during the cycle test by employing a 3-electrode pouch cell. The Nyquist plots obtained are presented in Fig. 8. Also, the empirical impedance data was fit by employing the equivalent circuit shown in Fig. 8, with the corresponding calculated numerical values presented in Table II. The solid symbols indicate the measured data, while solid lines represent the plot obtained from fitting with software in EIS evaluation. In the equivalent circuit, Relectrolyte is the electrolyte resistance, RSEI (first semicircle at high frequency) corresponds to the diffusion resistance of Li+ through the solid electrolyte interface (SEI) layers, including the SEI and deposited layers, CPESEI refers to the non-ideal capacitance of the surface layer, RCT (second semicircle at medium frequency) is related to the charge transfer resistance, CPECT represents the non-ideal capacitance of the double layer, and Zw (at low frequency) is the solid-state diffusion of Li+ corresponding to Warburg impedance. As seen in Table II, all the electrodes exhibit similar and negligible RSEI values between the first and 50th cycles whereas the RCT values experienced a prominent increase in resistance after 50 cycles. Although the differences obtained after 50 cycles are small among the electrodes, the PEDOT:PSS coated electrodes showed a reduced increase in the RCT values during the cycle test. Interestingly, the 1 wt% PEDOT:PSS coated electrodes exhibit significant suppression of RSEI values after 50 cycles, compared to the 2.5 wt% PEDOT:PSS coated electrode. These results indicate that conducting polymer provides better diffusion of lithium ions and improved electron transfer.35 An excessive coating layer deteriorates the electrochemical performance of the electrodes, as well as the increased retardation of Li ion diffusion on cycling.
Table II. Fit results after 1 cycle and after 50 cycles of EIS for the pristine OLO, 1 wt% PEDOT:PSS coated OLO, and 2.5 wt% PEDOT:PSS coated OLO electrode for 50 cycles at 1 C-rate.
| After 1 cycle | After 50 cycles | |||||
|---|---|---|---|---|---|---|
| Samples | Relectrolyte (Ω) | RSEI (Ω) | RCT (Ω) | Relectrolyte (Ω) | RSEI (Ω) | RCT (Ω) |
| Pristine OLO | 3.2 | 5.115 | 27.58 | 3.816 | 19.32 | 297.6 |
| 1 wt% PEDOT:PSS coated OLO | 3.289 | 5.15 | 37.9 | 2.778 | 8.534 | 290.0 |
| 2.5 wt% PEDOT:PSS coated OLO | 2.479 | 5.156 | 49.14 | 2.394 | 18.37 | 290.8 |
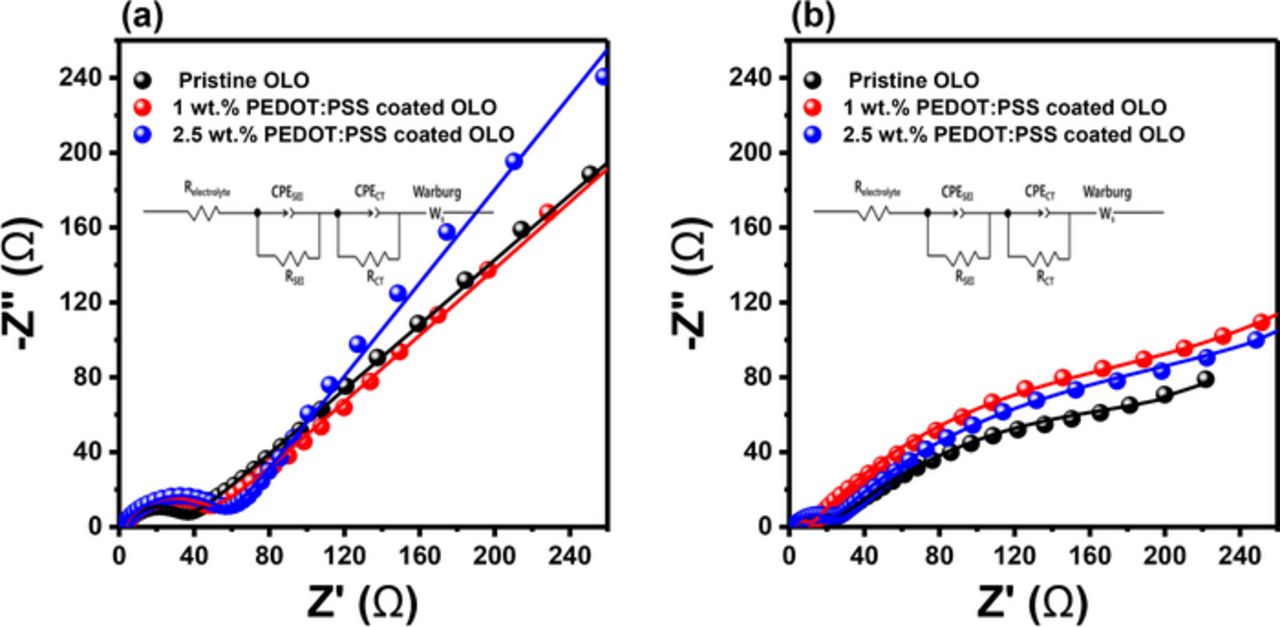
Figure 8. EIS spectra after (a) 1 cycle and (b) 50 cycles of EIS for the pristine OLO, 1 wt% PEDOT:PSS coated OLO, and 2.5 wt% PEDOT:PSS coated OLO electrode for 50 cycles at 1 C-rate.
In order to identify the effect on surface modification after cycle, XPS spectra of the pristine and PEDOT:PSS coated electrodes are compared after the 1st and 50th cycles. In the C1s spectra shown in Fig. 9, the peak assigned at 285.6 eV (C–H), 290.7 eV (C–F) is related to the PVDF binder. The peak corresponding to DB100 (conducting carbon) is observed at 284.6 eV (C–C). The evidence of PEDOT:PSS is not identified because the amount is relatively small compared to those of conducting carbon materials. The peak at 687 eV associated with PVDF(C–F) can be also found in the F1s spectra. In the O1s spectra, the peak at around 530.5 eV is assigned to transition metal oxides such as Ni-O, Mn-O, and Co-O; and the peak at 531.5 eV is related to oxygenated surface species.50,51 All the peaks appearing after the initial cycles in Fig. 9a indicate similar features and show little difference in intensity whereas a reduction in peak intensity can be found after 50 cycles. For example, F1s peaks concerning C-F bond which correspond to the evidence of PVdF polymeric binder component diminishes after 50 cycles. This reduction is mostly due to the formation and growth of the SEI layer on the surface of materials during the charge–discharge process. On the contrary, the peak concerning the SEI layer exhibits distinguished features between the pristine and the PEDOT:PSS coated electrodes. Although the lithium carbonate and alkyl carbonate components, which are detected at 289 and 533.5 eV,9,41,42,45,49,50 show little difference among the electrodes after the formation cycles, the pristine electrode experience a prominent formation of LiF at the peak assigned to 684.8 eV after few cycles. After 50 cycles, the SEI species, such as LiF, is still observed in the pristine electrode and the PEDOT:PSS coated electrode exhibits a similar amount of LiF layer. This result suggests that the coating layer effectively protects from a side reaction with the electrolyte on the cathode materials. Also, the peak corresponding to lithium carbonate and alkyl carbonate in the O1s spectra after 50 cycles reveals that the PEDOT:PSS coating layer suppresses the formation of the SEI layer46,47,49,50 and the pristine electrode exhibits an increased peak intensity at 289 and 533.5 eV, as demonstrated in Fig. 9b.
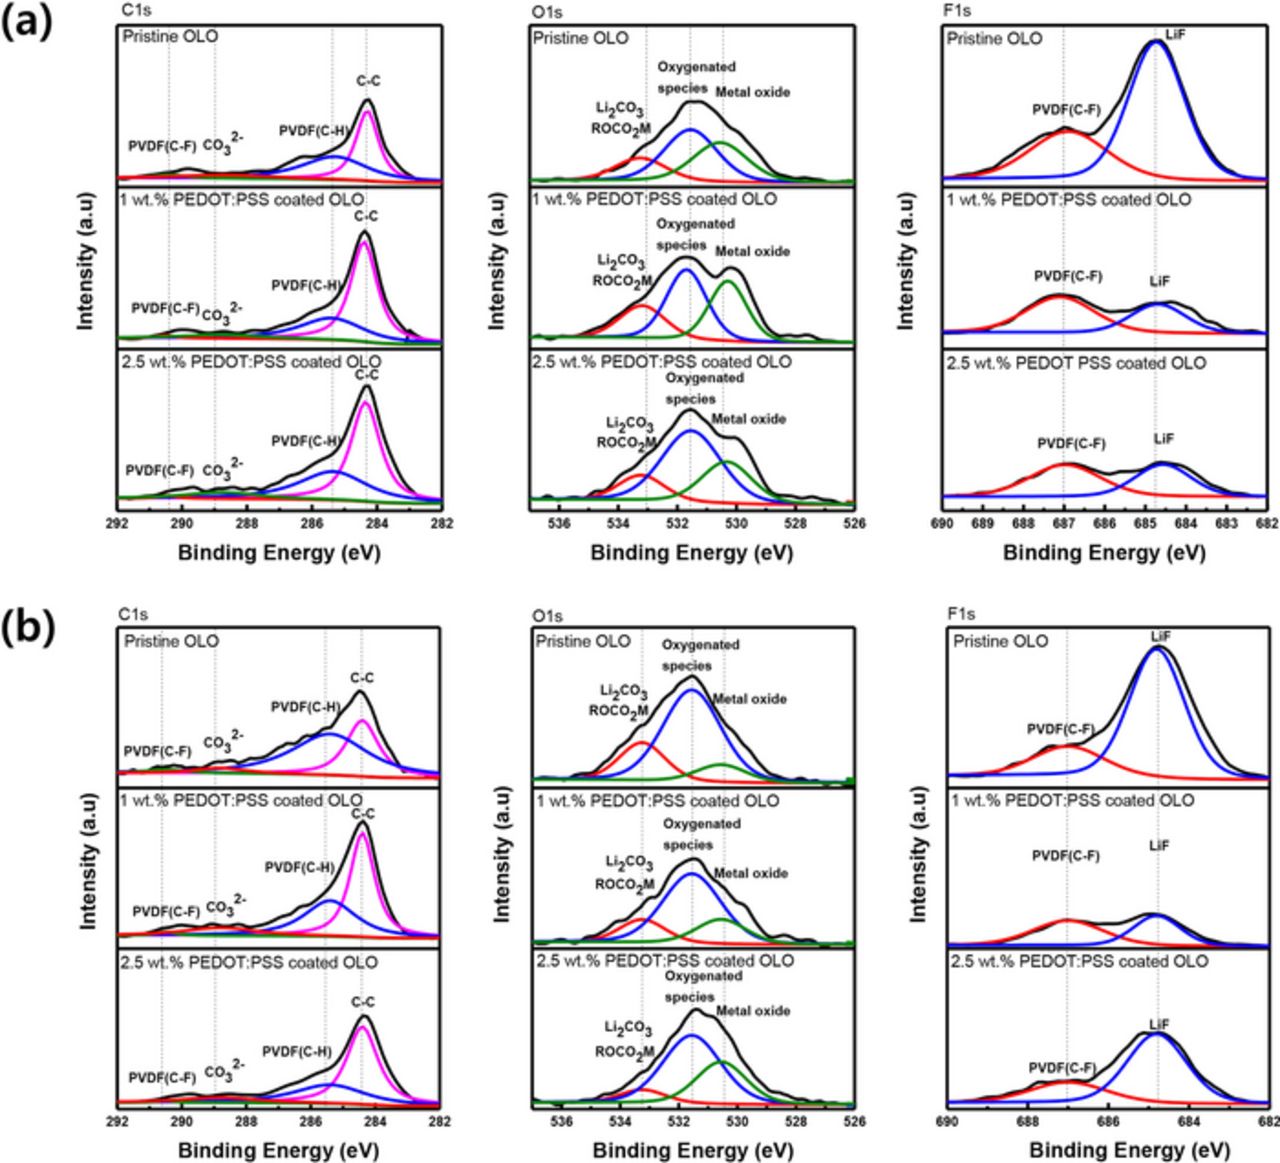
Figure 9. XPS spectra of C1s, O1s, and F1s of after (a) 1 cycle and (b) 50 cycles of XPS for the pristine OLO, 1 wt% PEDOT:PSS coated OLO, and 2.5 wt% PEDOT:PSS coated OLO electrode at 1 C-rate.
Conclusions
In this paper, we prepared PEDOT:PSS coated OLO using a simple wet-coating method. The results demonstrate that the PEDOT:PSS coated OLO shows improved rate properties because of the higher conductivity of the conducting polymer. The 1 wt% PEDOT:PSS coated electrode exhibits a superior rate capability and a better cyclability compared to the pristine electrode, and the 2.5 wt% PEDOT:PSS coated cathode shows less of an improvement in electrochemical performance. The EIS study reveals that the PEDOT:PSS coating layer suppresses the increase in SEI resistance during the cycle test. This result is also supported by the XPS analyses, which show suppression of the SEI layer on cycling due to the conducting-polymer-based coating layer on the cathode materials.
Acknowledgments
This work was supported by the National Research Foundation of Korea Grant funded by the Korean Government (MEST) (NRF-2010-C1AAA001-2010-0028958), and the KIST Institutional Program (Project No. 2E25630).