
Abstract
The microporous layer (MPL) and the gas diffusion layer (GDL) in a polymer electrolyte membrane (PEM) fuel cell assembly are often treated as separate layers in the literature. However, there exists a considerable third region where the two different materials merge in the coating process. This region has properties that differ from either of the materials that it consists of. Through-plane thermal conductivity and thickness variation under different compaction pressures were measured for such a composite region of two different commercial GDLs, Freudenberg H1410 and Toray Paper TGP-H-030, each treated with a custom-made MPL ink. Thermal conductivity at 15 bar compaction pressure for untreated Freudenberg H1410 GDL is 0.124 ± 0.009 W K-1 m−1 and for the custom-MPL-coated Freudenberg H1410 materials it was increased by the treatment to 0.141 ± 0.004 W K−1 m−1 and 0.145 ± 0.004 W K-1 m−1 for 9.9 wt% and 11.9 wt% ink, respectively. For Toray paper TGP-H-030 the thermal conductivity at 15 bar compaction pressure for GDL only is 0.449 ± 0.009 W K−1 m−1 and for the custom-MPL-coated Toray TGP-H-030 materials it was decreased by the treatment to 0.39 ± 0.05 W K−1 m−1 and 0.39 ± 0.00 W K−1 m−1 for 9.9 wt% and 11.9 wt% ink, respectively.
Export citation and abstract BibTeX RIS
Hydrogen can be processed from almost any energy source and is the fuel with the highest available gravimetric energy density.1 A high-performance, efficient and dynamic technology to convert the free energy of the hydrogen-oxygen chemical reactions is the proton exchange membrane fuel cell (PEMFC). When considering automotive applications for instance, thermal management, degradation, and cost reductions are important factors for commercial deployment. The needed increase in effectiveness of PEMFCs for their commercial success is coupled with an increase in heat production that needs to be handled by thermal transport through the PEMFC.2–5
A PEMFC consists of several components, i.e. the membrane electrode assembly (MEA) which consists of a membrane (PEM) coated with catalyst layers (CL) on each side that is sandwiched between a thin MPL and a somewhat thicker GDL on each side. The MEA is again sandwiched between to bipolar plates that provide the reactant gasses to the MEA and collect the current that is produced during operation. A GDL consists of carbon fibers that stretch into two main directions, creating much larger width and length than thickness. The in-plane direction is the direction that follows the fibers. The thickness of the diffusion layer is very low compared to width and length, therefore the so-called through-plane characteristics are of interest, they are perpendicular to the main fiber direction.
For PEMFCs electrical conductivity is important as electrical current is the ultimate product and has to be transferred out of the cell with as little loss as possible. Since mass transport is needed for the operation of the PEMFC, it is equally important and a trade-off between the two when choosing compaction pressure has to be found. High compaction pressure, for example, increases electrical conductivity but inhibits mass transport. Thermal conductivity is important as it has an influence on the heat transport in the cell. With increasing power densities in PEMFCs, thermal transport parameters need more attention to ensure preventing a heat buildup that will destroy the materials. Thermal conductivity tends to increase with compaction pressure as well.
The aforementioned regions have different properties and in some regions, like in the GDL, a great variety of materials with very different properties is available.6–8 Over the last decade, several efforts have led to more knowledge about the thermal conductivity of these materials. An outline of the development follows.
- (1)Vie and Kjelstrup were among the first to report thermal conductivities for PEMFC components.9
- (2)Khandelwal and Mench reported thermal conductivity for Toray carbon paper TGP-H-060 and TGP-H-090 as well as dry Nafion in one paper.10
- (3)Ramousse et al. reported thermal conductivity for GDLs (Quintech and SGL) in combination with the contact to the apparatus.8
- (4)Burheim and co-workers later found a way to separate the contact resistance between the measurement apparatus. They were able to study and differentiate between apparatus sample and sample-sample thermal resistance. They also showed how water changes the thermal conductivity of several materials, e.g. Toray, Sigracet-SGL, Freudenberg, Solvicore, ETEK-ELAT, and Nafion.6,11
- (5)The next important knowledge development was in-plane thermal conductivity by Zadeghi, Teertstra and Zamel.12–14 Depending on compaction pressure, the difference between in-plane and through-plane thermal conductivity was readily proposed and interpreted in thermal models by Pharoah and Burheim because it is similar for the electrical conductivity.15
- (6)
- (7)
Generally, these studies together suggested and agreed that at room temperature for dry materials, the through-plane thermal conductivity of an ELAT GDL is around 0.2 W K-1 m-1, a Sigracet GDL 0.3-0.4 W K−1 m−1 and Toray GDL is 0.3-0.8 W K−1 m−1. Changes in temperature lead to changes in thermal conductivity for GDLs. These were measured both for in- and through-plane thermal conductivity by Zamel et al.14 It is the knowledge from points 1. and 2. that were available to Bapat and Thynell23 and Kandlikar and Li3 for their reviews of heat conduction effects in PEM fuel cells in 2007 and thermal management in PEM fuel cell stacks in 2009, respectively.
PTFE is found to decrease the through-plane thermal conductivity of every type of GDL.5 The common understanding in the literature appears to be that under the absence of PTFE and when a GDL is compressed, more fiber-to-fiber contacts are produced leading to an increase of the effective thermal conductivity. In the presence of PTFE the uncompressed thermal conductivity of a GDL is increased by PTFE conducting some heat between the carbon fibers.24 As soon as the GDL is compressed, the PTFE only inhibits more fiber to fiber contacts and then the effective through-plane thermal conductivity of the GDL is lowered in the presence of PTFE. This is observed even as the smallest portion of PTFE is added to the GDL.5
PTFE is also used in the manufacture of MPLs. The resulting strong hydrophobic properties are crucial to transporting the water droplets away from where they are produced near the membrane. As for GDLs, PTFE is found to decrease the thermal conductivity of MPLs. In addition, adding PTFE also increases the electrical resistance of the MPL.25 There exists an optimal thickness for the MPL that has been discussed widely with varying results, as literature does not agree what characterizes it. Very thin MPLs have smaller pores resulting in inhibited mass transfer properties as compared to thicker MPLs who have larger pores.26 Kitahara et al. showed that the mean pore diameter has significant influence on the PEMFCs performance. They suggest that the pore diameter should be adequately small to prevent back transport of water from the substrate to the electrode but not too small such that gas permeability and therefore water vapor transport from the catalyst layer are significantly reduced.27 Consequently there are many parameters to keep in check when designing the MPL and thermal conductivity has gotten little attention so far in literature.
The thermal conductivity of different MPL made for PEMFC were, to our knowledge, for the first time investigated independently of any other fuel cell components by Burheim et al.16 The value was found to vary between 0.06 and 0.10 W K−1 m−1 at compaction pressures from 5 to 16 bar. Despite being among the thinnest layers of a PEMFC, the MPL has a thermal conductivity so low that it still has a significant effect on the overall temperature distribution in a PEMFC. A recent study by Thomas et al. showed that the temperature gradient across this layer contributes to water transport and that this increase in temperature helps keeping the water in the MPL in gaseous state.18
When investigating the thermal properties of GDL, MPL and CL, both experiments and modelling are required. For instance, it is experimentally demonstrated that there is a strong correlation between local degradation and local temperature peaks, as the temperature distribution in neither the in-plane nor the through-plane direction is uniform and degradation will be accelerated at hot spots.28 Despite that, PEMFCs are shown to last for 26 000 hours, equivalent to three years continuous operation.29 In order to investigate this and similar effects further, detailed knowledge about local heat production, local thermal conductivity and thermo-mechanical stress is required. Kandlikar and Li summarize this very well in 20093 by discussing literature available at the time and presenting a thermal model. Bapat and Thynell gave a separate review on thermal PEMFC modelling already in 2007.23 Since then, several developments of the available knowledge of PEMFC thermal conductivity have emerged. Zamel and Li gave an overview on PEMFC mechanical properties in 2013,30 also including thermal conductivity, but even over the last three years the knowledge and understanding of PEMFC materials' thermal conductivity have progressed further, especially with respect to understanding the catalyst layers and the MPL-GDL-composite interface region and their properties.
Recently, Burheim published a study on the internal temperature profiles in PEMFCs.5 The focus in his work was on the importance of abandoning the isothermal temperature profile assumption that is often made. The model presented calculates temperature profiles based on the most recent values for thermal conductivity available in the literature.
The temperature difference across the PEMFC can reach more than 3°C despite being less than a millimeter thick between gas flow plates.16 Temperature differences arise mainly across the GDL, as heat is generated where the chemical reaction takes place, in the catalyst layers close to the membrane, especially on the cathode side, as demonstrated by Pharoah et al.15 Several research efforts have led to a good understanding of the thermal conductivity of the GDL and how it changes with compaction pressure, temperature, PTFE content, different weaves, and humidity.6,11
In a recent review article Burheim and Pharoah suggest the need for more characterization of heat transport in PEMFC.4 They argue that the increase in effectiveness of PEMFC leads to a challenge in transporting away the increased heat production that comes along with increased power output.
In a comprehensive review on heat production, transport and management in PEMFC, Burheim points at the different in-plane and through-plane thermal conductivities.5 Because the in-plane electrical conductivity is several times larger than the through-plane electrical conductivity, it was first postulated31,32 and later verified experimentally12,14 that the in-plane thermal conductivities are five to ten times larger than the through-plane ones (mainly depending on the GDL compaction).
MPL and GDL are often treated as separate layers in the literature. Physical properties for both have been measured and reported widely, while trying to determine the optimum balance between electrical conductivity, mass transport properties and recently thermal conductivity. There exists, however, an interfacial region where the two layers merge into one another and thus form a third layer. The fine material of the MPL can intrude considerably into the fiber structure of the GDL material. This forms a composite region that has physical properties that are unlike those of both of the original layer materials.20,33 The majority of thermal PEMFC simulations in literature do not take the MPL into account as a separate layer, even though it has considerable influence on the overall temperature distribution. Instead, a mean value for the entire diffusion media is often used. Local temperature peaks due to the low heat transport through the MPL may go unnoticed. Including the composite region in simulations will give an even more differentiated picture of the heat distribution inside an MEA, as demonstrated by Burheim et al. in 2013,16 leading to more precise predictions of the thermal process inside a PEMFC.
Burheim et al. suggested the existence of a composite GDL-MPL layer in a study from 2015 and estimated the thermal conductivity to be much higher than either of the components.20 Other researchers have also focused on the integration of MPL into the GDL, Wong and Bazylak have just presented work on how the non-uniform MPL intrusion may affect the gas diffusion through the GDL.34
As advertised previously,33 we introduce a way of producing samples that consist purely of merged MPL-GDL material to be able to put numbers to the expected increase in thermal conductivity of the mixed layer. The samples are examined to determine the success of our manufacturing procedure. Scanning Electron Microscope (SEM) pictures of cut-planes are provided for optical confirmation of MPL inside the GDL and X-ray computed tomography (CT) measurements are performed to ascertain the level of intrusion of the MPL ink into the GDL substrate. We then measure the through-plane thermal conductivity and compressibility of approved samples as compared to an untreated sample of the same GDL. The obtained values are compared to available literature.
Experimental
Production of MPL-GDL-composite material
The reproduction of an actual MPL-GDL region was attempted by using very thin GDL substrates. The entire MPL intrusion zone is not a discrete zone, it is a gradient that is difficult to reproduce. It would otherwise be difficult to measure the properties of an actual composite region, as it is difficult to separate the three layers at their respective junctions, i.e. when trying to segment an MPL-coated GDL. For simplicity and to show clear differences GDLs without PTFE were chosen. The presented approximation to an actual composite region was chosen to start the process toward its characterization. Two different commercially available GDL substrates were selected for their difference in structure, their low thickness to achieve a high probability of complete intrusion of the MPL ink throughout the complete thickness of the GDL, and their difference in thermal conductivity. Freudenberg H1410 is a highly flexible non-woven felt-like fiber fleece mat with an intended uncompressed thickness of 150 μm. The fibers are bound together mechanically by a hydroentangling process.35 This GDL does not have any MPL applied from the manufacturer and has not been treated hydrophobically. Freudenberg H1410 was chosen for its relatively low thermal conductivity. Toray TGP-H-030 is a rather brittle carbon paper with very low flexibility and an intended uncompressed thickness of 110 μm. Its fibers are bound together chemically by carbonaceous binder.35 It does not have any MPL applied from the manufacturer, has not been treated hydrophobically and was chosen for its high thermal conductivity, especially at high compaction pressures.6
A doctor blade setup (ERICHSEN Coatmaster 510) was selected to coat and saturate the two GDLs with a custom-made MPL ink slurry. Two similar ink slurries were produced containing 9.9 wt% (of total batch weight) and 11.9 wt% solid materials (carbon and PTFE) respectively, a recipe formerly used and chosen here for Reference 20. The 9.9 wt% ink contained more water which made intrusion into the GDL easier with the drawback of introducing less solid material per space occupied than the 11.9 wt% ink. Because of that, it was expected that the MPL created by the 11.9 wt% ink has a bigger effect on the thermal conductivity of the treated GDL, if it managed to intrude the substrate equally as far as the MPL from the 9.9 wt% ink.
For the ink slurries, Vulcan EC-XC72R-50 was weighed and transferred into a ball mill. Subsequently, a known amount of surfactant (Triton X114), was mixed with a known amount of water before mixing with the carbon powder. The bowl was then placed into the bead mixing device and rotated at 400 rpm for 30 minutes. Then, the ink was separated from the beads and weighed because some of the ink will remain with the beads. The correct amount of 60% PTFE solution to achieve 20 wt% PTFE relative to the remaining carbon mass was calculated, weighed and added to the ink slurry. It was carefully mixed again with a grinder. The ingredients and their amounts can be reviewed in Table I.
Table I. Ink slurry recipe (11.9 and 9.9 solids wt%, 20 wt% PTFE relative to carbon weight).25 Actual masses used in producing the applied ink slurry shown, except mass of PTFE solution, which is scaled to original ink slurry weight (before some mass was lost in bead mixing).
| Mass (g) | Mass (g) | ||
|---|---|---|---|
| Component | 11.9wt% | 9.9wt% | Comments |
| Carbon, Vulcan EC-XC72R-50 | 2.008 | 2.002 | powder |
| Triton X-114 | 3.994 | 3.999 | surfactant |
| Water, deionized | 13.560 | 17.557 | 18 MΩ at 25°C |
| PTFE solution (60wt% PTFE) | 0.637 | 0.684 | 0.382 g/ 0.410 g PTFE |
| Total | 20.199 | 24.242 | total batch weight |
The GDL substrates were placed on the glass plate of a doctor blade setup and fixed in position. The doctor blade (Modell 360) was filled with ink and adjusted to make a single coating of 25 μm thickness at a horizontal speed of 2.5 mm s−1. To remove the resulting 25 μm thick MPL on top, a second doctor blade was placed right behind the first when coating, so that it would scrape off the MPL on top, leaving only MPL soaked GDL material, see Fig. 1.
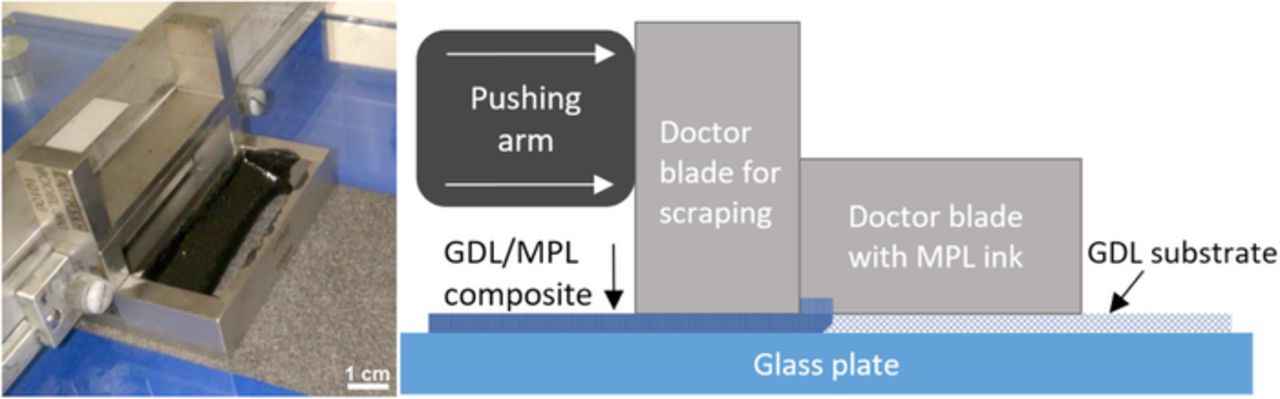
Figure 1. Photograph and sketch of the doctor blade setup during coating and wet scraping.
These samples are referred to as "wet scraped" later on. The doctor blade that has direct contact with the coated material exerts a pressure of 0.08 bar onto it, which is not enough to cause any considerable compression. The GDL was then dried at 100°C for 5 minutes and then the coating procedure was repeated for the remaining uncoated side. This was done in order to assure complete saturation of the GDL material with MPL material. Afterwards, the coated GDL was dried at 100°C for one hour before it was baked in an oven at 350°C for one hour.
To ascertain the influence of this coating procedure on the structural integrity of both GDL materials, several control experiments were conducted. Untreated samples of both GDL types were baked in an oven for one hour at 350°C. This revealed if the binding of the carbon fibers was influenced by the high temperature. These samples are referred to as "baked". In another round the samples were first treated with Triton X114 and water, mixed in the same composition as they appear in the 11.9 wt% ink, then dried for one hour at 100°C and then baked for one hour at 350°C. This control experiment showed the possible washing effect Triton X114 could have on binder material in the GDLs on top of the baking effect. These samples are referred to as "washed&baked".
SEM imaging
SEM images of a cross section of the composite material were taken with a FEI NOVA NANOSEM 230 to confirm visually that the GDL material is infused with the MPL material throughout its thickness. The samples were submerged in liquid nitrogen for one minute and then cut across with a scalpel that was also cooled in liquid nitrogen. The SEM images were taken at 20 keV with a back-scattered electron detector and have a magnification factor of 1000.
X-ray computed tomography
The X-ray CT experiments were conducted at beamline 2-BM-A at the Advanced Photon Source (APS) at Argonne National Laboratory (ANL), Lemont, IL, USA. The source energy was 25 keV and the optics system sCMOS pco.edge camera, resulting in a resolution of 1.33 μm. For each scan 100 ms exposure time was used with a number of 1025 acquired back projections over a 180o angle. The field of view (FOV) for image processing was cropped to 2.2 × 2.2 mm. Image reconstructions were done using TomoPy with Gridrec algorithm36 and image processing and analysis was done using Fiji/ImageJ and Avizo Fire 8.1. During segmentation three phases were identified: GDL, MPL and void space. The separation of phases was determined using both Otsu algorithm and manual segmentation.37–39
Thermal conductivity and compression measurements
A custom-made measuring rig was designed and constructed to simultaneously measure the variables that appear in the discrete form of Fourier's law, the heat flux q, the temperature drop over the sample ΔT45 and the sample thickness δ45 while applying a compaction pressure with a pneumatic actuator, see Fig. 2. Thus, values for thermal conductivity κ and for the compression of the materials under different compaction pressures were obtained. The pneumatic actuator has an accuracy of ± 0.05 bar which translates into an accuracy for the applied pressure to the sample of ± 0.115 bar due to the surface area of the actuator being 2.3 times larger than that of the sample region.
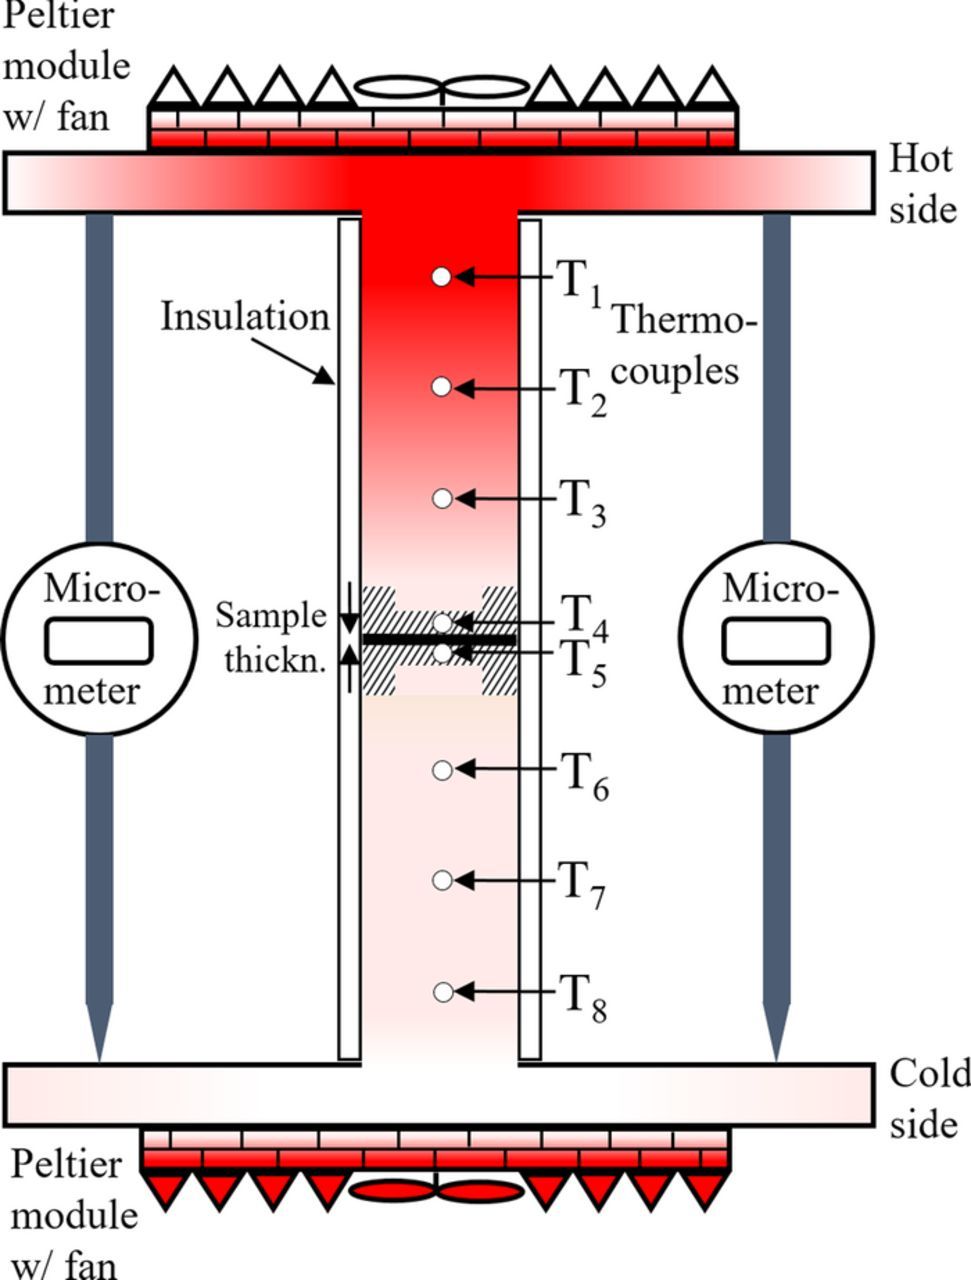
Figure 2. 2D sketch of the apparatus used to measure thermal conductivity and compaction.
The sample is made up of circular samples with a diameter of 21 mm that were punched out of a sheet of the pure GDL material and the composite material each. A steady heat flux was maintained by heating the top and cooling the bottom with the help of Peltier modules such that the sample temperature is very close to room temperature at 25°C.
The samples were given 15 minutes to reach steady state in terms of heat flux through them as well as compaction. The heat flux was then recorded continuously for 5 minutes and averaged. To investigate the thermal conductivity the heat flux qsample was measured for one sample first, then for two samples on top of each other, then for three samples on top of each other and finally for four samples on top of each other. The sample-sample thermal contact resistance is negligible, as was demonstrated in a previous work by Burheim et al.17 The samples were subsequently measured at a compaction pressure of 3, 5, 10, 15, 20 and 23 bar. The thickness of the sample stack was recorded and a thermal resistance Rtotal was obtained for every sample stack, see Eq. 1.
![Equation ([1])](https://content.cld.iop.org/journals/1945-7111/165/7/F514/revision1/d0001.gif)
![Equation ([2])](https://content.cld.iop.org/journals/1945-7111/165/7/F514/revision1/d0002.gif)
![Equation ([3])](https://content.cld.iop.org/journals/1945-7111/165/7/F514/revision1/d0003.gif)
![Equation ([4])](https://content.cld.iop.org/journals/1945-7111/165/7/F514/revision1/d0004.gif)
The heat flux through the sample qsample is obtained by averaging the heat fluxes of the upper and lower steel cylinder, qupper and qlower, Eq. 2. These heat fluxes are obtained by measuring temperature differences over known distances δxx between thermocouples and multiplying with the thermal conductivity of the steel κsteel, Eqs. 3 and 4. An approximately uniform temperature distribution over the whole sample surface was ensured by using aluminum for all pieces that are in contact with the sample. T4 and T5 are measured inside these aluminum caps and thus give a temperature reading right at the surface sample. Their difference is then the true temperature difference across the sample.
Error Analysis
There are random errors and systematic errors. The system error is given by the precision of thermal conductivity calibration which is 5%. The thermal conductivity apparatus was calibrated using materials with known thermal conductivity. By measuring the thermal conductivity of these materials with our rig, the thermal conductivity of the steel used for building the rig, κsteel, was obtained.11 As κsteel is used to calculate heat flux through the rig and the calibration values are known with 5% accuracy, that is also the accuracy limitation of the reported values. The random error (repeatability) is much less. We have generally used the random error in reporting double standard deviations, to demonstrate the repeatability. The thermal conductivities in the results section report deviations from the linear regression using a least square of residual approach. Due to the scarcity of samples, each of the regressions in this paper are based on only four points which means that a good linear fit is represented by a small error while a poor regression will have a considerably larger error. All numbers are reported with 95% confidence intervals. Because of high repeatability low standard deviation can be reported and used for comparing different samples. These low standard deviations are less than 5%. This means they show precision between each material beyond the precision of the apparatus. We quantify changes more accurately than the absolute value.
Results and Discussion
Production of MPL-GDL-composite material
A micrometer caliper with an accuracy of ±1 μm was used to measure the thickness for untreated and MPL-treated materials. These measurements were repeated at three different positions for each disc and then averaged. They were cut into the disc shape needed for the test rig, with a diameter of 21 mm. The results in Table II show that the level of integration for the MPL into the GDL is high as the added MPL barely shows up on the thickness measurements. For some samples some residual MPL-on-top seems to remain, but when taking the systematic error into account, no significant increase can be reported.
Table II. Average thickness of sample discs, diameter = 21 mm, and calculated porosities for both GDL types and each ink recipe.
| GDL | untreated | Porosity | Ink | Porosity | MPL-treated | MPL on top |
|---|---|---|---|---|---|---|
| Freudenberg H1410 | 125 ± 4 μm | 73% | 9.9 | 70% | 127 ± 3 μm | 2 ± 5 μm |
| 11.9 | 69% | 129 ± 1 μm | 4 ± 4 μm | |||
| Toray TGP-H-030 | 109 ± 1 μm | 79% | 9.9 | 75% | 112 ± 2 μm | 3 ± 2 μm |
| 11.9 | 76% | 109 ± 1 μm | 0 ± 1 μm |
These data are averaged over all samples, they do not describe each and every sample. To ascertain the level of integration even further, all samples were weighed before testing with a precision balance with an accuracy of ±1 mg. Weighing results are summarized in Table III.
Table III. Average weight of sample discs, diameter = 21 mm, for both GDLs and each ink recipe.
| GDL | untreated | Ink | MPL-treated | MPL weight | wt% MPL of total |
|---|---|---|---|---|---|
| Freudenberg H1410 | 25 ± 1 mg | 9.9 | 27 ± 1 mg | 2 ± 1 mg | 7% |
| 11.9 | 28 ± 1 mg | 3 ± 1 mg | 11% | ||
| Toray TGP-H-030 | 16 ± 1 mg | 9.9 | 20 ± 1 mg | 4 ± 1 mg | 20% |
| 11.9 | 19 ± 1 mg | 3 ± 1 mg | 16% |
For an uncompressed average thickness of 125 μm weighing yields an average density of 570 mg/cm3 and a calculated porosity of 73% for untreated Freudenberg H1410. For untreated Toray TGP-H-030 with an uncompressed average thickness of 109 μm the average density is much lower at 434 mg/cm3. It has a calculated porosity of 79%. The weighing shows a notable increase in weight after coating with custom-made MPL for all materials and inks. For Freudenberg H1410 the increase in weight correlates with the ink density, the heavier ink gives more weight gain. The weight gain by the integrated MPL is 1 mg higher for the ink recipe with 11.9 wt% solids than for 9.9 wt% solids, resulting in 7% and 11% of the total weight of the disc comprised of MPL, respectively. Porosity calculations show a decrease in porosity by 3% for the 9 wt% ink and 4% for the 11.9 wt% ink. For Toray TGP-H-030 the disc weight increases with ink-treatment as well, but the uptake of MPL into the GDL seems to be larger for the 9.9 wt% ink than for 11.9 wt% ink. Here the porosity decreases by 4% for the 9 wt% ink and 3% for the 11.9 wt% ink.
In comparison, the rigid structure of Toray paper accommodated a similar mass of MPL ink than the softer Freudenberg fibers. The Freudenberg GDL is thicker and has a higher volume. This results in a higher uptake of MPL mass per volume into the Toray GDL, as indicated by the wt% MPL of overall weight in Table III. The porosities of both materials are only decreased slightly by the added MPL, which suggests that mass transport characteristics are also only mildly affected.
SEM imaging
Fig. 3a shows a cross section of an untreated piece of Freudenberg H1410 GDL material. This material has not been treated with PTFE by the manufacturer. All that is visible are the somewhat random fibers. Fig. 3b shows a cross section of the same GDL material after the custom-made MPL ink was applied, wet scraped, dried and the sample was sintered. It suggests that the MPL ink slurry has fully penetrated the GDL material. There is no MPL layer to be seen on top of the GDL, as it has successfully been removed during wet scraping.
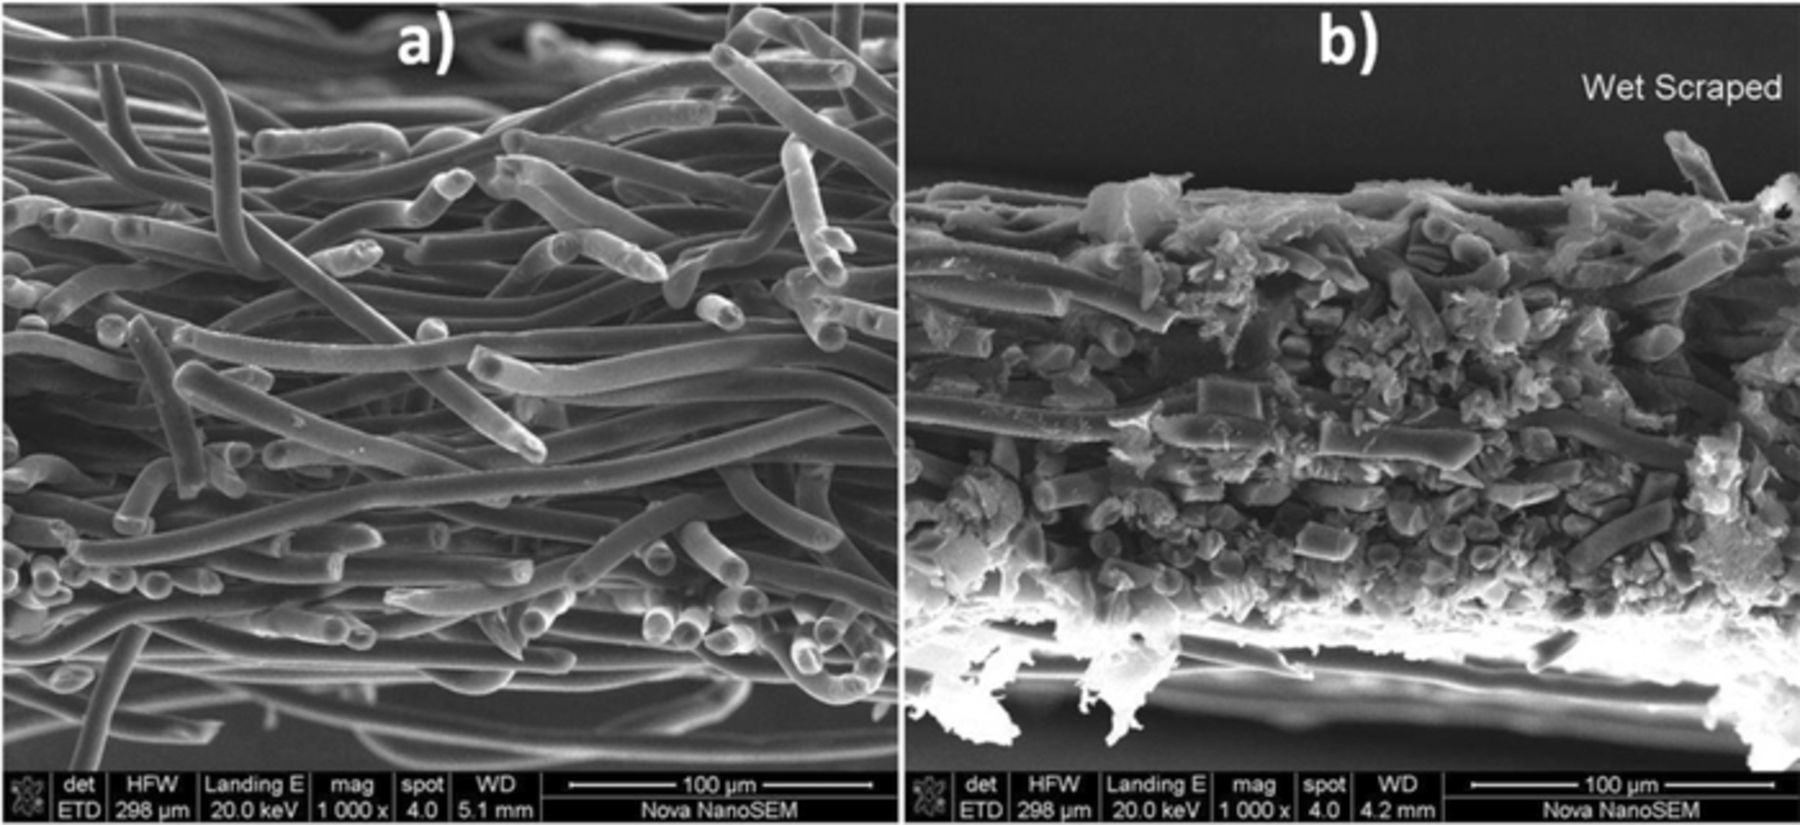
Figure 3. a) Cross-section SEM image of pure Freudenberg H1410 GDL material before application of the MPL ink. b) Cross-section SEM image of GDL/MPL composite material after manual application of the MPL ink and scraping off excess MPL from the surface.
Fig. 4a shows a cross section of untreated Toray TGP-H-030 GDL. The rigid, ordered structure of this carbon paper GDL is easily visible. After treatment with the custom-made MPL ink slurry plenty of MPL material remains inside the GDL as seen in Fig. 4b. There is some MPL material left on the surface of the GDL material on this particular sample. This might increase the overall thickness of the sample, see preceding section. These images suggest that the creation of a pure composite material was successful for both GDL types.
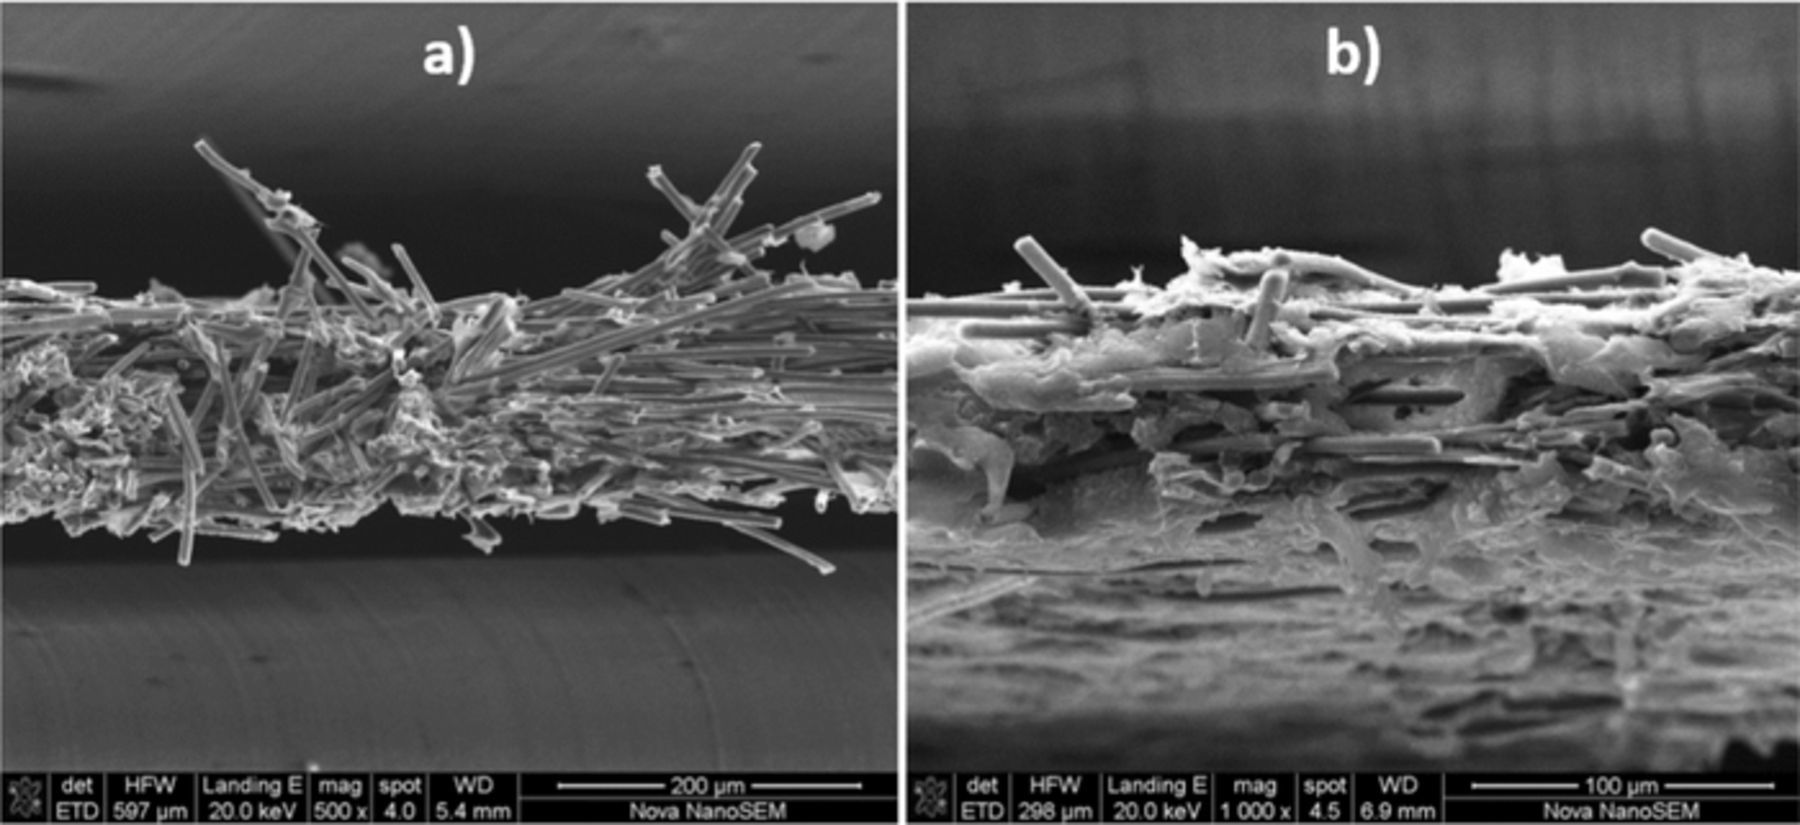
Figure 4. a) Cross-section SEM image of untreated Toray TGP-H-030 GDL material before application of the MPL ink. b) Cross-section SEM image of GDL/MPL composite material after manual application of the MPL ink and scraping off excess MPL from the surface.
X-ray computed tomography
Fig. 5 compares grey-scale and thresholded cross-section images of MPL-infiltrated GDLs. Achieving sufficient grey-scale contrast was done in two steps. First, reconstruction parameters were tuned in TomoPy for each material (Freudenberg H1410 and Toray TGP-H-030). Then, ImageJ was used to apply histogram stretching to each image based on its respective stack's histogram. The cross-section images show that MPL uniformly infiltrated both GDLs by settling in the voids between the fibers. These images were computed for the 11.9 wt% ink only.
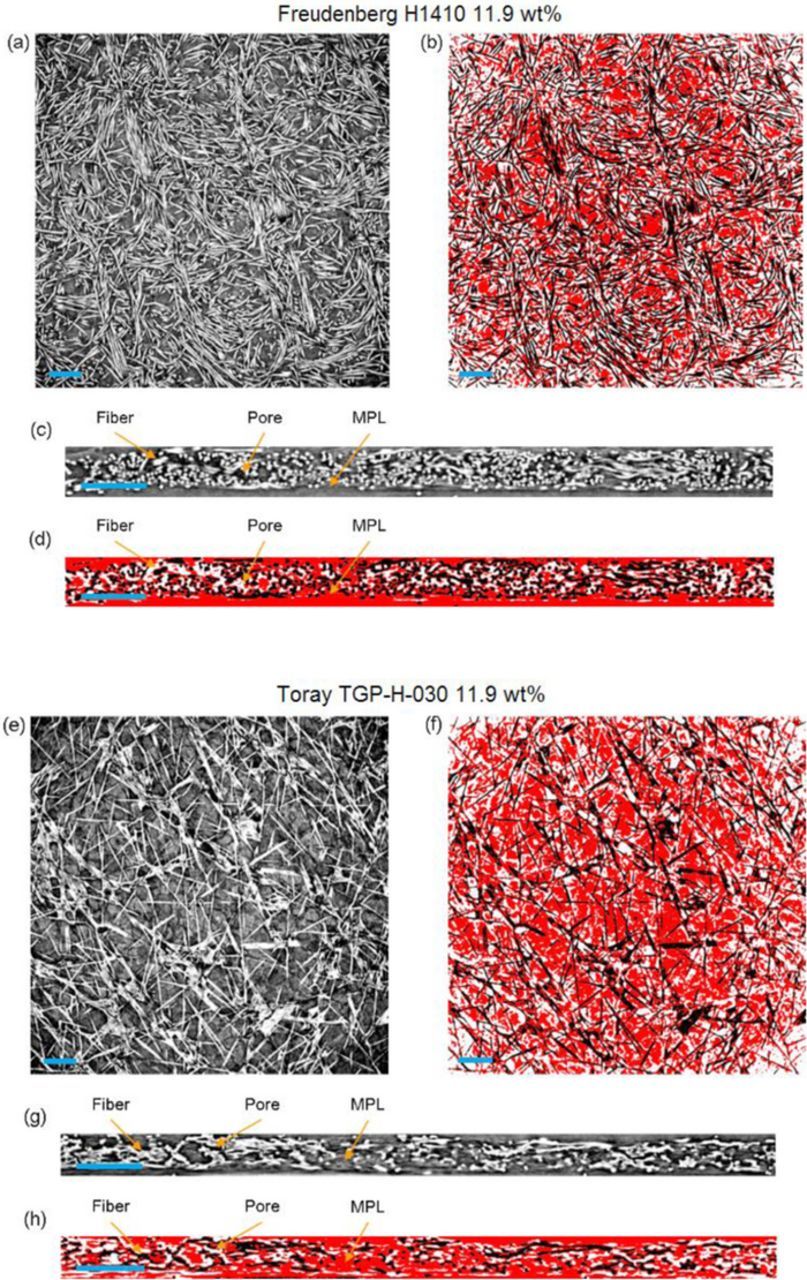
Figure 5. In-plane (a, b, e, f) and through-plane (c, d, g, h) cross-section tomographs of MPL-treated Freudenberg H1410 (a-d) and Toray TGP-H-030 (e-h), 11.9 wt% ink only. Images are provided in both grey-scale and thresholded forms. Thresholded images present MPL in red, fibers in black, and pores in white. Scale bars are 200 μm.
Fig. 6 shows data for the baseline GDL samples (untreated with MPL). The volume-rendered images visually provide a comparison between the structures of the two materials as well as a sense of in-plane two-dimensional fiber distribution. Lower porosity is observed in the middle of both GDL's samples. The binder in the Toray sample was treated as solid domain.
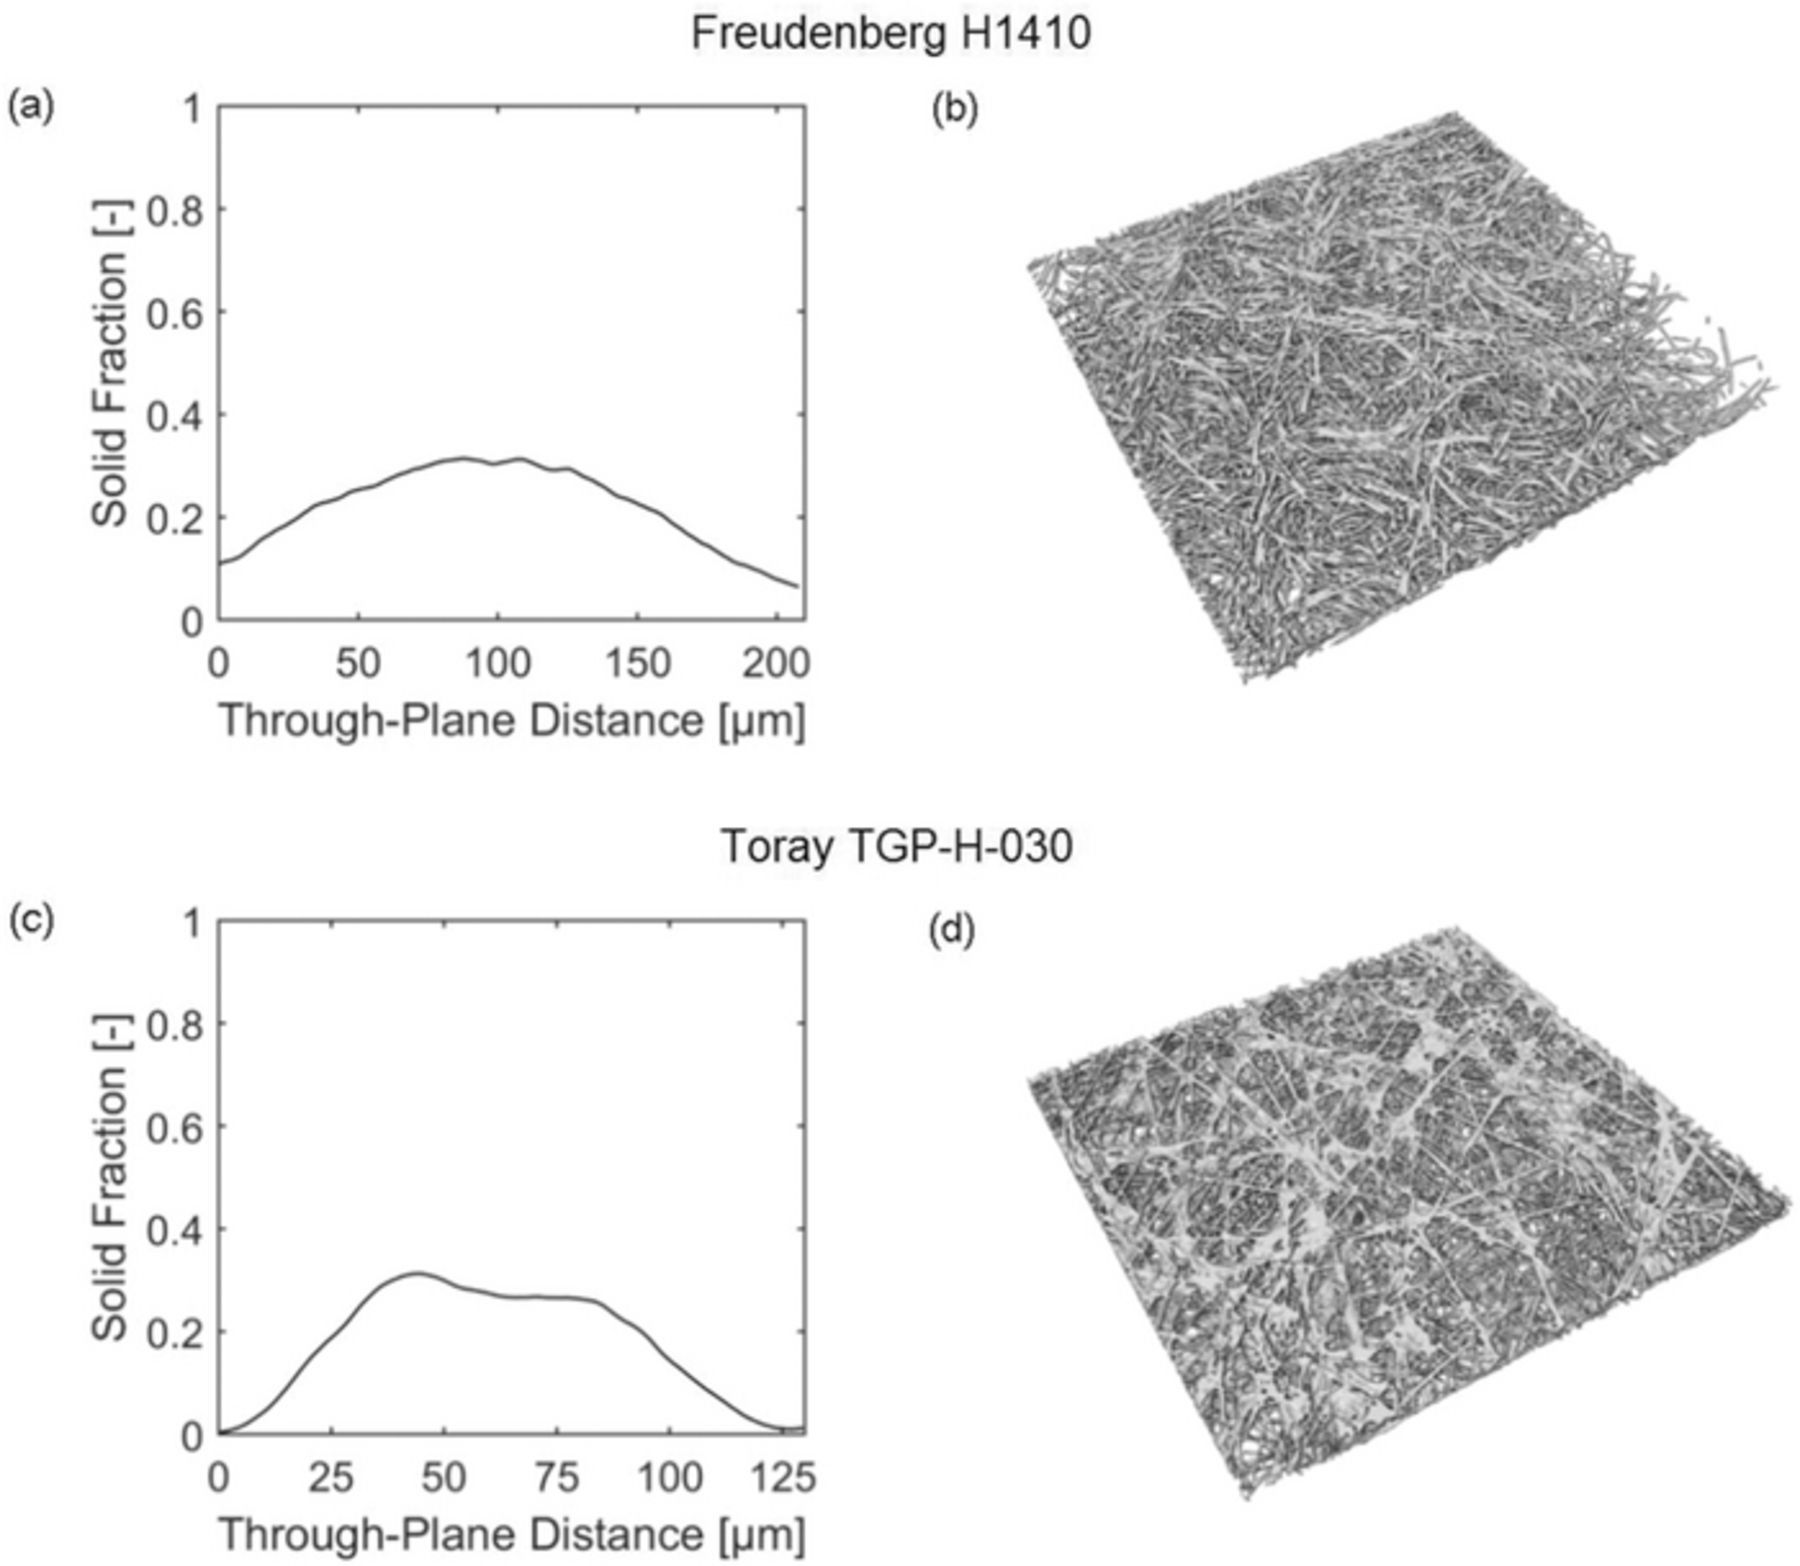
Figure 6. Plots of solid fraction as a function of through-plane distance, and volume-rendered images for baseline Freudenberg H1410 (a, b) and Toray TGP-H-030 (c, d). Volume-rendered images are approximately 91 μm thick (not complete sample thickness). Through-plane direction is positive from the bottom to the top of the images.
Fig. 7 presents information similar to Fig. 6 but for the MPL-treated GDL samples. As these images were obtained with micro X-ray CT, the pores inside the MPL are not visible due to their small sizes. Thus, a homogeneous MPL will show up as completely solid in these images. The plots indicate relatively constant solid fractions for both MPL and fibers away from the outer surfaces of the GDLs. Comparing MPL solid fractions in the center region shows that the 11.9 wt% loadings produce a discernable increase in solid fraction compared to the 9.9 wt% loadings for Freudenberg H1410 but not for Toray TGP-H-030. For all treated samples the solid fraction plots from Fig. 6 for the original materials were inverted. The regions near the surface that had a low solid fraction before treatment now show the highest solid fraction in all treated samples. The solid fraction was about doubled for all samples through the MPL treatment. The three volume-rendered images to the right of each plot help visualize the solid structure. For each set, the top image depicts fibers and the middle image depicts MPL, whereas the bottom image superimposes the first two. While depicting the overall solid structure of the MPL-treated GDL samples, the superimposed images also demonstrate that MPL is present throughout the GDL.
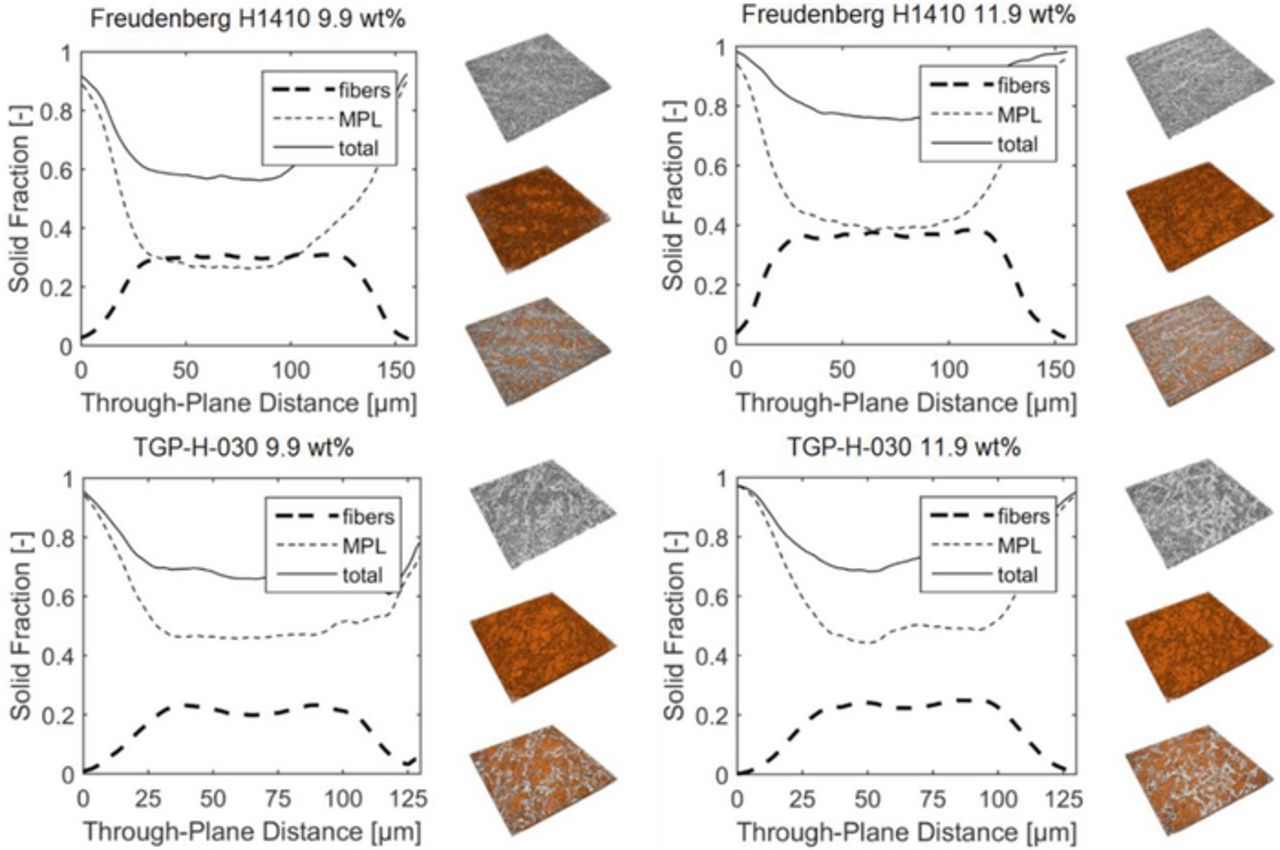
Figure 7. Plots of solid fraction as a function of through-plane distance, and volume-rendered images for MPL-treated Freudenberg H1410 and Toray TGP-H-030. From top to bottom, associated images are of fibers, MPL, and combined fibers-MPL respectively. Volume-rendered images are approximately 91 μm thick (not complete sample thickness). Through-plane direction is positive from the bottom to the top of the images.
From the X-ray CT three-dimensional investigation it was observed that the solid fraction constituted 60 - 80% of the overall volume fraction at the center of the sample and higher values at the edges of the sample. Although this distribution does not represent 100% solid fraction as the ideal limit, which would be indicative of a completely homogeneous GDL-MPL composite, we believe it is still a good approximation of a homogeneous layer and at the least representative for the GDL-MPL thermal conductivity changes relative to GDL and MPL pure materials. The MPL material is not distributed uniformly inside the GDL and is as such not entirely representative of a pure composite material. Nonetheless, the results give a strong indication of how thermal conductivity might change in the parts of the GDL where the MPL intrudes. The way the MPL is applied onto GDL materials, suggests a non-uniform solid fraction of MPL in the GDL that decreases with intrusion distance. In this light, the reported results represent an actual MPL-GDL composite material quite well.
Thermal conductivity
The total thermal resistance rtot of the sample and its contact to the apparatus were plotted as a function of the measured thickness in order to decompose the thermal sample resistance rsample and the thermal contact resistance rcontact, as shown in Fig. 8.
![Equation ([5])](https://content.cld.iop.org/journals/1945-7111/165/7/F514/revision1/d0005.gif)
The inverse of the gradient of thermal resistance with thickness is the thermal conductivity, see Eq. 5 and Fig. 8.17 Thus, the slope of a linear regression of the obtained thermal resistance vs. sample thickness gives the average thermal conductivity of all sample stacks.
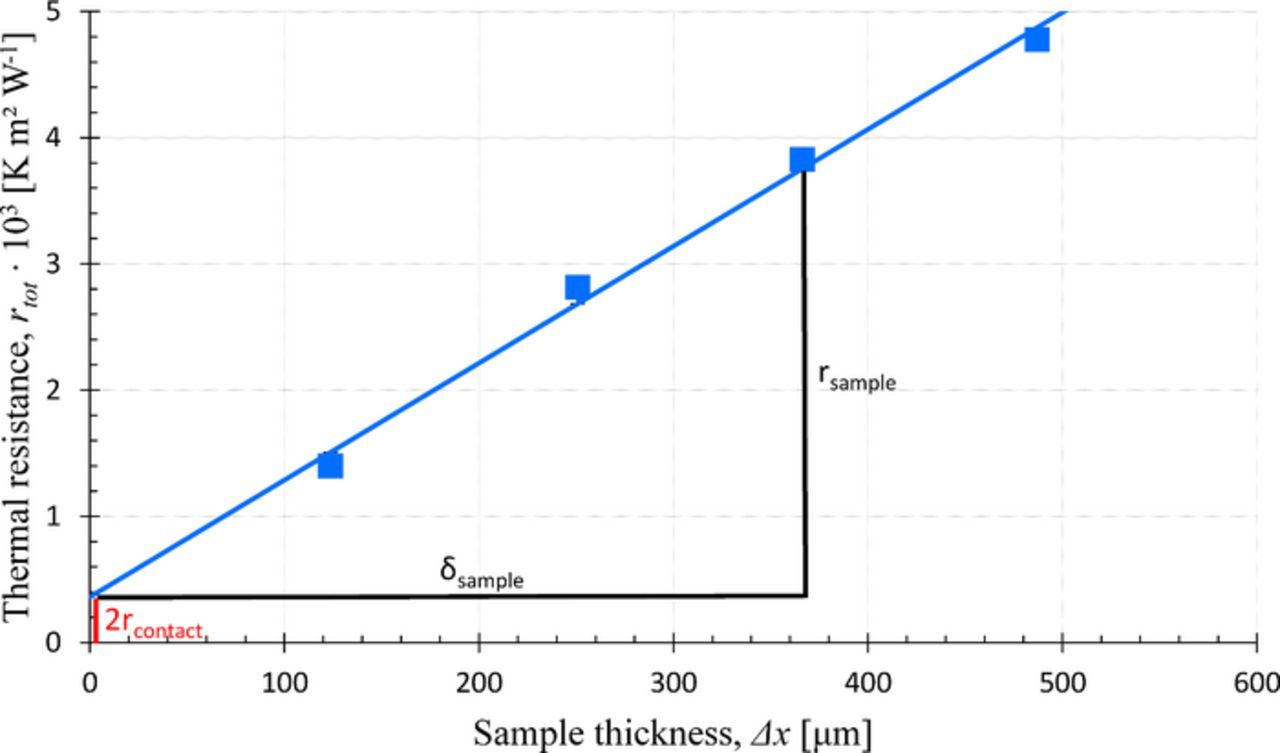
Figure 8. Plot of thermal resistance (rth) against sample thickness with slope and thermal contact resistance (2rcontact).
At a compaction pressure of 15 bar through-plane thermal conductivity of untreated Freudenberg H1410 (125 μm) was found to be 0.124 ± 0.009 W K−1 m−1, for the custom-MPL-coated Freudenberg H1410 materials it was 0.141 ± 0.004 W K−1 m−1 and 0.145 ± 0.004 W K-1 m-1 for 9.9 wt% and 11.9 wt% ink, respectively. Ref. 16 found it to be 0.087 ± 0.018 W K-1 m-1 for a pure MPL with 20% PTFE content at a compaction pressure of 9.2 bar which is about 0.089 W K−1 m−1 at 10 bar compaction with a linear interpolation, see Table IV. Columns 3 and 4 show the results of the two control experiments. Thermal conductivity was barely affected by any of the two. Thus, the 16% - 20% increase in thermal conductivity can be attributed to the addition of MPL material into the GDL.
Table IV. Thermal conductivity κ of pure materials versus composite material.
| Compaction | Freudenberg | Freudenberg | Freudenberg | Freudenberg | Freudenberg | Pure MPL |
|---|---|---|---|---|---|---|
| pressure | H1410 | H1410 | H1410 | H1410 | H1410 | material16 |
| untreated | baked | washed | 9.9 wt% | 11.9 wt% | ||
| & baked | composite | composite | ||||
| [bar] | κ [W K−1 m−1] | κ [W K−1 m−1] | κ [W K−1 m−1] | κ [W K−1 m−1] | κ [W K−1 m−1] | κ [W K−1 m−1] |
| 3 | 0.109 ± 0.007 | 0.108 ± 0.013 | 0.107 ± 0.010 | 0.108 ± 0.007 | 0.116 ± 0.008 | - |
| 5 | 0.112 ± 0.008 | 0.111 ± 0.012 | 0.110 ± 0.010 | 0.116 ± 0.006 | 0.121 ± 0.008 | ∼ 0.078 |
| 10 | 0.119 ± 0.008 | 0.119 ± 0.011 | 0.115 ± 0.010 | 0.131 ± 0.004 | 0.135 ± 0.005 | ∼ 0.089 |
| 15 | 0.124 ± 0.009 | 0.124 ± 0.012 | 0.119 ± 0.011 | 0.141 ± 0.004 | 0.145 ± 0.004 | ∼ 0.101 |
| 20 | 0.128 ± 0.008 | 0.128 ± 0.013 | 0.123 ± 0.011 | 0.148 ± 0.003 | 0.152 ± 0.003 | - |
| 23 | 0.128 ± 0.008 | 0.131 ± 0.013 | 0.124 ± 0.013 | 0.151 ± 0.003 | 0.155 ± 0.002 | - |
Thermal conductivity for the composite materials is found to be higher than that of the pure GDL material for the Freudenberg GDL. Fig. 9 illustrates that the thermal conductivity is increased by both ink recipes. At lower compaction pressures the three materials are closer together. This changes toward higher compaction pressures of 10 bar and more. The fact that two materials with low thermal conductivity (GDL-only and MPL-only) comprise a material with a higher thermal conductivity (the composite) might appear contradictory, but must be seen in the light of similar materials as pointed out in a previous work.20 In that work, graphitized carbon fibers are mentioned that make up polymer composite heat exchangers. The fiber's thermal conductivity is low individually but was reported to be several times larger than that individual value when bundled into a composite.40
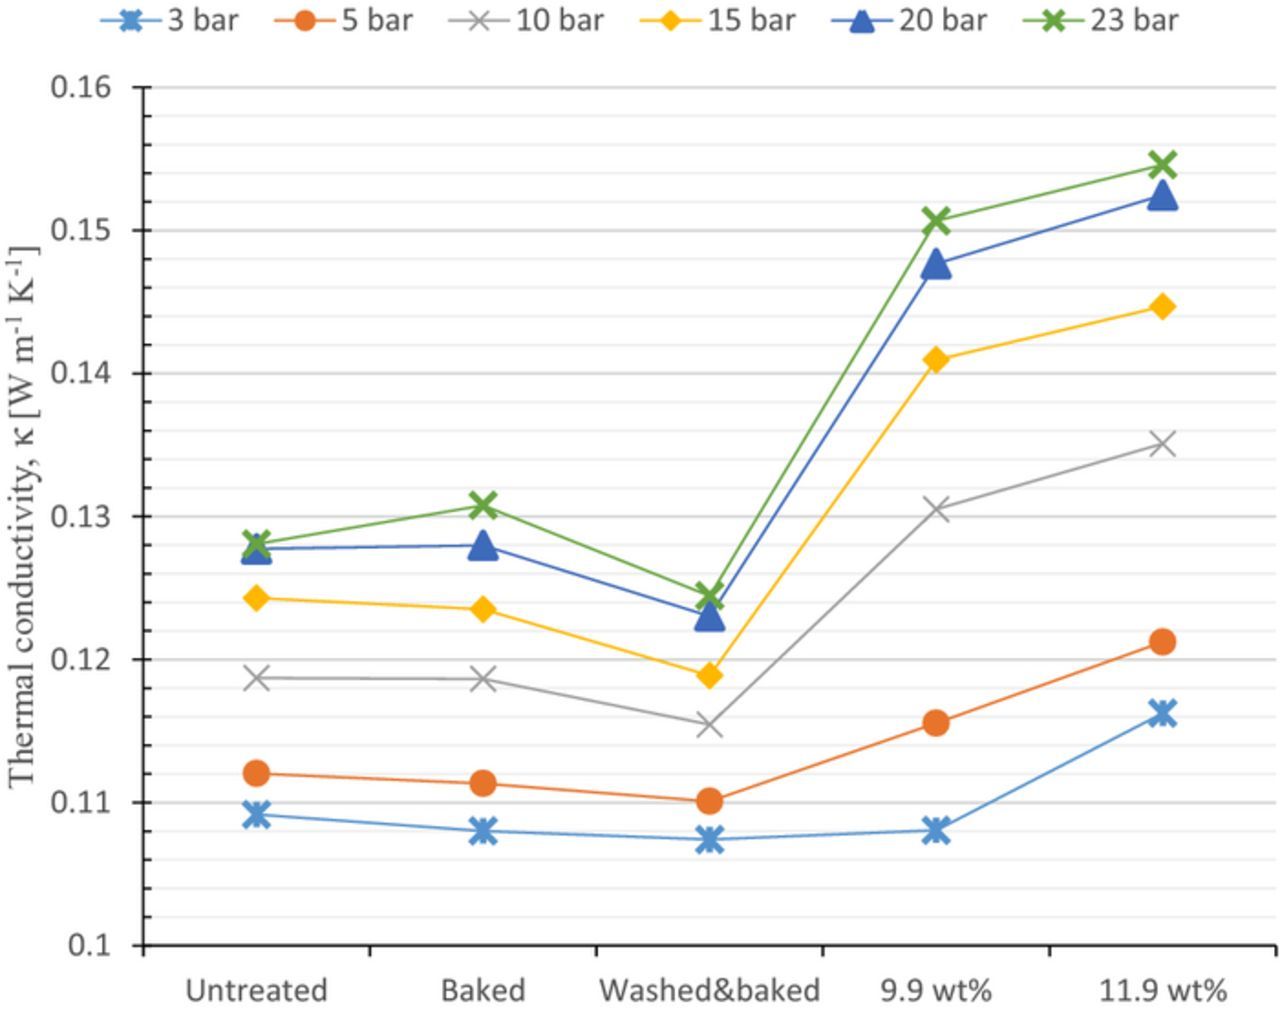
Figure 9. Plot of thermal conductivity κ for untreated, baked and washed&baked Freudenberg H1410 and the custom-made composite materials based on Freudenberg H1410.
In the case of our Freudenberg H1410 composite we have a region that consists of two materials with low thermal conductivity each, but that become a material with higher thermal conductivity when joined. The MPL material with a lower thermal conductivity compared to the GDL fibers manages to enhance the heat transfer from fiber to fiber by increasing the contact surface between two fibers.
A different result presents itself for the MPL-treated Toray TGP-H-030. This GDL material has a thermal conductivity about four times as high as that of pure MPL material. At a compaction pressure of 15 bar the thermal conductivity of untreated Toray TGP-H-030 (109 μm) was found to be 0.449 ± 0.009 W K−1 m−1, for the custom-MPL-coated Toray TGP-H-030 materials it was 0.419 ± 0.004 W K−1 m−1 and 0.389 ± 0.004 W K-1 m−1 for 9.9 wt% and 11.9 wt% ink, respectively, see Table V. Columns 3 and 4 show the results of the two control experiments. Thermal conductivity was slightly lowered by both procedures for pressures of 3 bar and 5 bar. It remained unchanged for 10 bar compaction pressure and was increased by both procedure for pressures of 15 bar and more to the addition of MPL material into the GDL.
Table V. Thermal conductivity κ of pure materials versus composite material.
| Compaction | Toray | Toray | Toray | Toray | Toray | Pure MPL |
|---|---|---|---|---|---|---|
| pressure | TGP-H-030 | TGP-H-030 | TGP-H-030 | TGP-H-030 | TGP-H-030 | material16 |
| untreated | baked | washed | 9.9 wt% | 11.9 wt% | ||
| & baked | composite | composite | ||||
| [bar] | κ [W K−1 m−1] | κ [W K−1 m−1] | κ [W K−1 m−1] | κ [W K−1 m−1] | κ [W K−1 m−1] | κ [W K−1 m−1] |
| 3 | 0.252 ± 0.015 | 0.22 ± 0.02 | 0.224 ± 0.018 | 0.20 ± 0.02 | 0.191 ± 0.007 | - |
| 5 | 0.297 ± 0.005 | 0.27 ± 0.04 | 0.27 ± 0.03 | 0.22 ± 0.04 | 0.233 ± 0.009 | ∼ 0.078 |
| 10 | 0.379 ± 0.015 | 0.39 ± 0.04 | 0.39 ± 0.06 | 0.32 ± 0.05 | 0.324 ± 0.006 | ∼ 0.089 |
| 15 | 0.449 ± 0.009 | 0.49 ± 0.04 | 0.45 ± 0.07 | 0.39 ± 0.05 | 0.389 ± 0.009 | ∼ 0.101 |
| 20 | 0.510 ± 0.011 | 0.61 ± 0.08 | 0.54 ± 0.11 | 0.456 ± 0.017 | 0.438 ± 0.012 | - |
| 23 | 0.54 ± 0.03 | 0.66 ± 0.25 | 0.60 ± 0.14 | 0.55 ± 0.11 | 0.50 ± 0.06 | - |
The overall trend in Table V is that thermal conductivity is reduced when MPL material is introduced into the GDL. The denser 11.9 wt% ink has a larger effect than the 9.9 wt% ink for pressures of 20 bar and 23 bar. The 11.9 wt% ink introduces more carbon and PTFE into the GDL. The rigid structure of this GDL type seems to be enhanced by the addition of MPL at fiber intersections. Thermal transport seems to be hindered rather than enhanced as is the case for the Freudenberg GDL. When plotting the thermal conductivity a similar result presents itself. Fig. 10 illustrates this with the data points for the MPL ink with the highest density (11.9 wt% solids) yielding the lowest thermal conductivity over the whole pressure range. The lighter ink (9.9 wt% solids) shows a lower thermal conductivity than the untreated samples for all compaction pressures except 23 bar. Compared to the control experiments all values are well below both baked and washed&baked samples. The composite clearly shows a lower thermal conductivity. This marked difference suggests a structural change inside the composite. The binder material between the rigid carbon fibers that enhances thermal transport in the untreated material was supplemented with MPL material. This material might withstand compaction pressures better which leads to the change in properties.
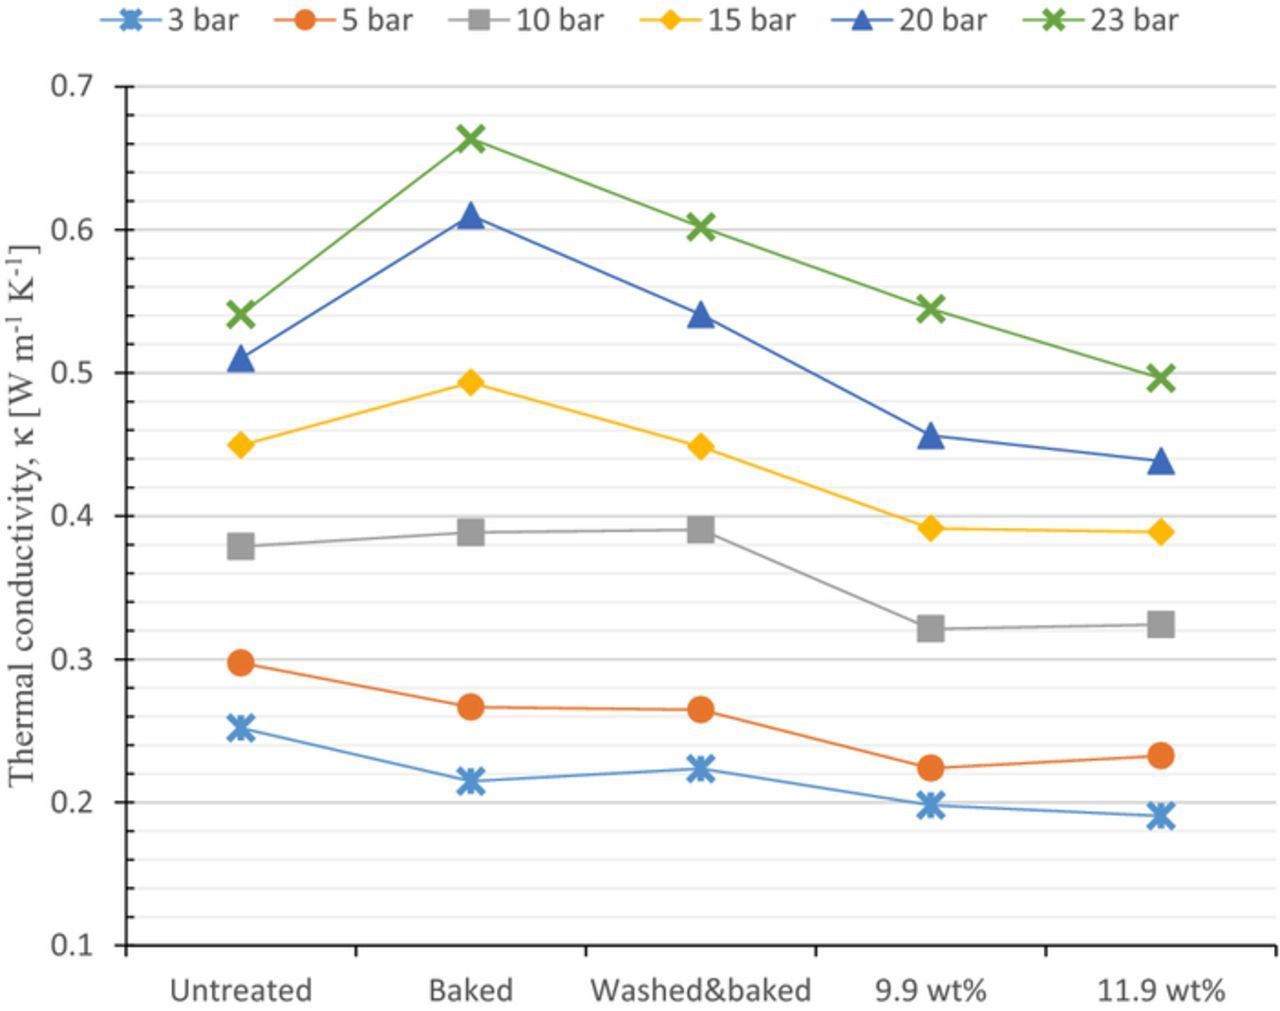
Figure 10. Plot of thermal conductivity κ for untreated, baked and washed&baked Toray TGP-H-030 and the custom-made composite materials based on Toray TGP-H-030.
Compression
The untreated Freudenberg H1410 material was compressed to 110 μm, which is 88% of its original thickness at 15 bar compaction pressure. The MPL-treated H1410 materials were compressed to 87% and 86% of their original thickness at 15 bar compaction pressure, see Table VI for results at different compaction pressures, also for the two control experiments. The Freudenberg material shows a slightly higher structural strength after baking and washing&baking.
Table VI. Compression in % of original thickness of pure materials versus composite materials for Freudenberg H1410.
| Compaction | Freudenberg | Freudenberg | Freudenberg | Freudenberg | Freudenberg | Freudenberg | Pure MPL |
|---|---|---|---|---|---|---|---|
| pressure | H1410 | H1410 | H1410 | H1410 | H1410 | H1410 | material16 |
| untreated | untreated | baked | washed | 9.9 wt% | 11.9 wt% | ||
| Thickness | & baked | composite | composite | ||||
| [bar] | [μm] | compaction | compaction | compaction | compaction | compaction | compaction |
| 3 | 118 | 94% ± 1% | 98% ± 1% | 97% ± 1% | 93% ± 1% | 90% ± 1% | 76% |
| 5 | 116 | 93% ± 1% | 95% ± 1% | 94% ± 1% | 91% ± 1% | 89% ± 1% | 68% |
| 10 | 112 | 90% ± 1% | 92% ± 1% | 90% ± 1% | 88% ± 1% | 87% ± 1% | 55% |
| 15 | 110 | 88% ± 1% | 89% ± 1% | 88% ± 1% | 87% ± 1% | 86% ± 1% | 53% |
| 20 | 108 | 86% ± 1% | 88% ± 1% | 86% ± 1% | 85% ± 1% | 84% ± 1% | - |
| 23 | 107 | 85% ± 1% | 87% ± 1% | 85% ± 1% | 84% ± 1% | 82% ± 1% | - |
The MPL-treated Freudenberg materials seem to lose some of their structural strength compared with the untreated material. Over the whole pressure spectrum the MPL-treated composites are compressed slightly more. This effect shows up stronger for the heavier 11.9 wt% ink. This behavior is somewhat unexpected, as one would presume the additional MPL material to fill up remaining pores of the GDL, thus giving more structural strength to the material. When comparing compression results for a pure MPL material from,16 we observe that pure MPL material is more compressible than pure Freudenberg H1410. The GDL material should then govern the compressibility. Because the GDL structure is slightly weakened the thermal conductivity is enhanced for the Freudenberg material.
When comparing the thermal conductivity results to the compaction results in Fig. 11, a trend can be observed. All samples start out at similar thermal conductivity values for low compaction. For a compaction beyond 90% the steeper slope for the linear trend for the MPL treated samples leads to an increase in thermal conductivity beyond the values for the untreated samples. Thermal conductivity is also increased for the treated samples when comparing same levels of compaction. This suggests a structural change for the MPL treated samples that allows for better thermal conductivity due to the increased solid fraction. The increase in compressibility for Freudenberg H1410 suggests that the mechanical binding is affected by the coating procedure. Under stress the higher compressibility leads to more contact points forming because the fibers can move more freely. In addition, the contact points have a larger area as MPL material was introduced around them. At higher compaction pressures the introduced MPL material gets into even better contact with the carbon fibers allowing for better thermal transport.
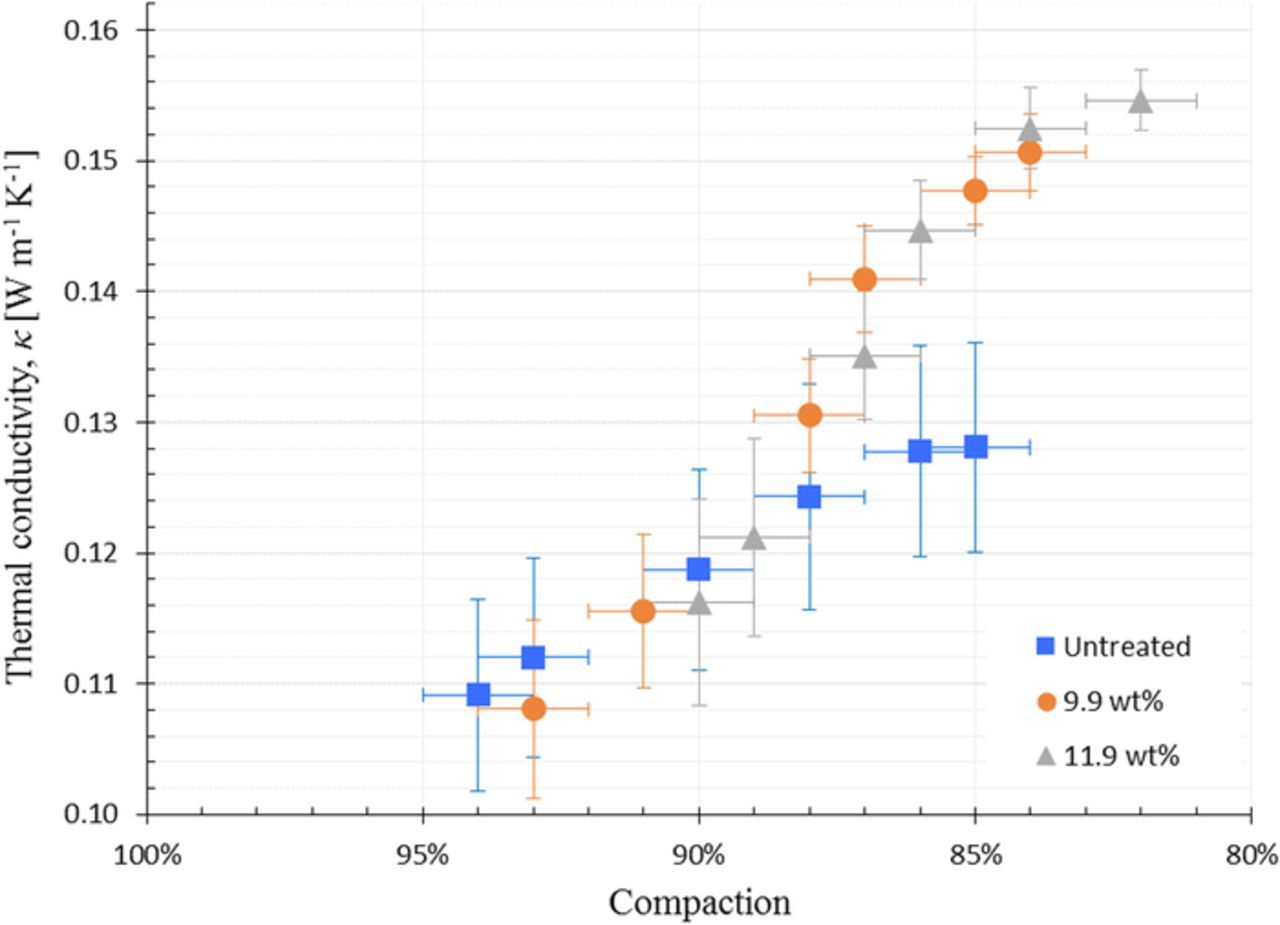
Figure 11. Plot of thermal conductivity κ vs. compaction for untreated Freudenberg H1410 and the custom-made composite materials based on Freudenberg H1410. Compaction values reversed for better readability.
The untreated Toray TGP-H-030 material was compressed to 83 μm, which is 77% of its original thickness at 15 bar compaction pressure. The MPL-treated Toray materials were compressed to 78% and 82% of their original thickness at 15 bar compaction pressure, see Table VII for results at different compaction pressures, also for the two control experiments. The MPL-treated Toray materials show a more expected behavior. The addition of MPL material into the GDL strengthens its structure slightly. This effect is stronger for the heavier 11.9 wt% ink, where more carbon and PTFE is introduced. Even though the added MPL material is much more compressible than the untreated GDL it enhances the structural strength. The carbonaceous binder seems to withstand the coating treatment, with the introduced MPL situated around it, effectively reinforcing the binder's function. Hence the compressibility goes down. With less compressibility less additional contact points can form under stress, hence the thermal conductivity does increase with compaction pressure, but not as much as for the untreated sample. For the Toray material the structural strength is slightly higher for lower pressures after baking and washing&baking, the material is more resistant to the initial compression when pressure first is applied. For higher pressures Toray shows good agreement before and after baking and washing&baking.
Table VII. Compression in % of original thickness of pure materials versus composite materials for Toray TGP-H-030.
| Compaction | Toray | Toray | Toray | Toray | Toray | Toray | Pure MPL |
|---|---|---|---|---|---|---|---|
| pressure | TGP-H-030 | TGP-H-030 | TGP-H-030 | TGP-H-030 | TGP-H-030 | TGP-H-030 | material16 |
| untreated | untreated | baked | washed | 9.9 wt% | 11.9 wt% | ||
| Thickness | & baked | composite | composite | ||||
| [bar] | [μm] | compaction | compaction | compaction | compaction | compaction | compaction |
| 3 | 95 | 87% ± 1% | 92% ± 1% | 92% ± 1% | 91% ± 1% | 95% ± 1% | 76% |
| 5 | 92 | 85% ± 1% | 88% ± 1% | 88% ± 1% | 89% ± 1% | 92% ± 1% | 68% |
| 10 | 87 | 80% ± 1% | 81% ± 1% | 82% ± 1% | 83% ± 1% | 86% ± 1% | 55% |
| 15 | 83 | 77% ± 1% | 76% ± 1% | 77% ± 1% | 79% ± 1% | 82% ± 1% | 53% |
| 20 | 80 | 73% ± 1% | 72% ± 1% | 74% ± 1% | 77% ± 1% | 79% ± 1% | - |
| 23 | 77 | 71% ± 1% | 70% ± 1% | 72% ± 1% | 75% ± 1% | 77% ± 1% | - |
The comparison of thermal conductivity to compaction for Toray TGP-H-030 in Fig. 12 suggests different mechanisms in the rigid structure of this GDL. The linear trend for higher thermal conductivity at higher compaction pressures has similar slopes for both the untreated and the MPL treated samples. Overall the MPL treated samples have slightly greater structural strength at the cost of lower thermal conductivity, an effect that is to be expected. This effect shows up stronger for the heavier 11.9 wt% ink recipe. When comparing similar levels of compaction especially the samples treated 11.9 wt% ink show an increase in thermal conductivity. These similar levels of compaction might have been obtained at different compaction pressures though.
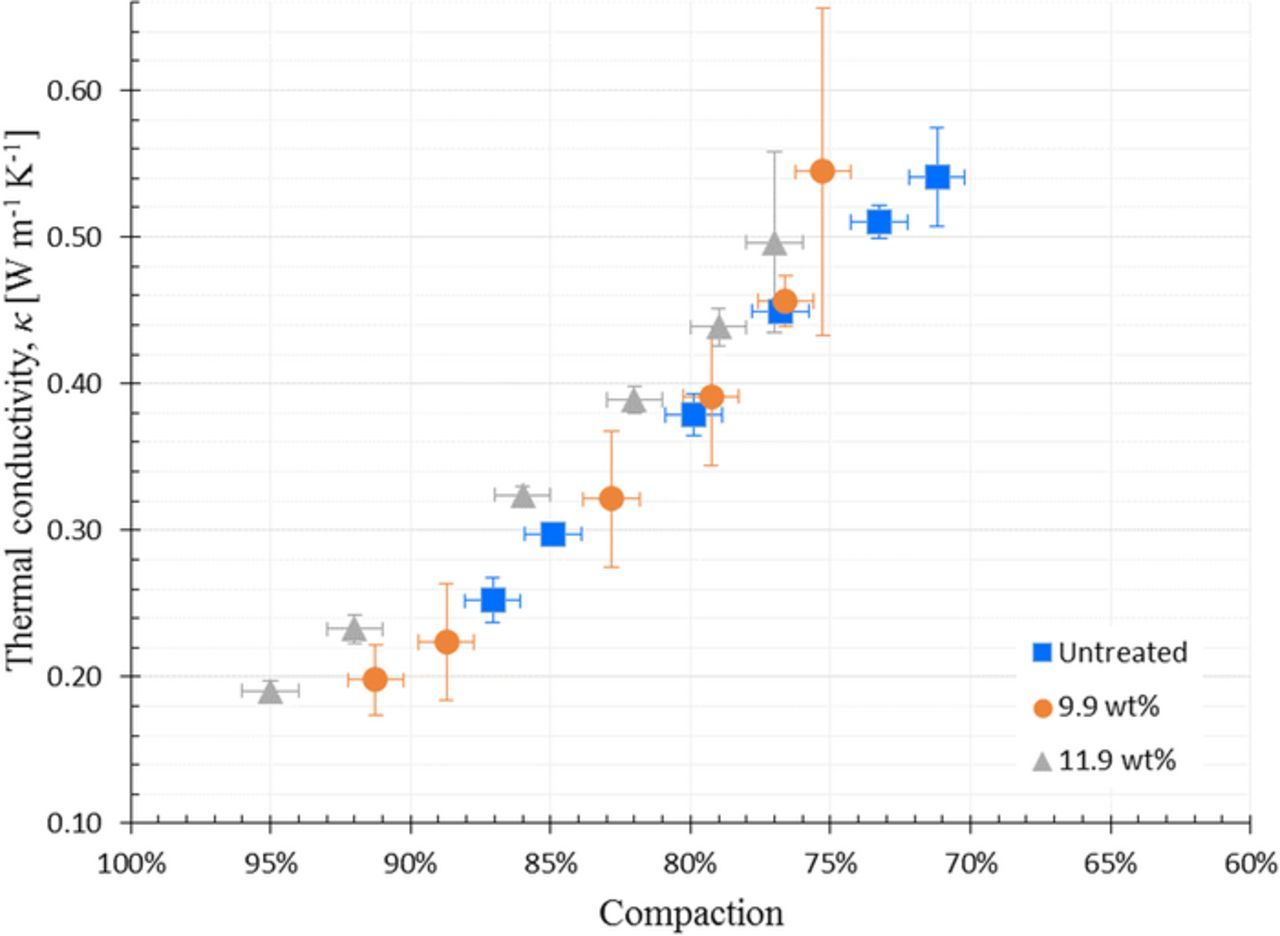
Figure 12. Plot of thermal conductivity κ vs. compaction for untreated Toray TGP-H-030 and the custom-made composite materials based on Toray TGP-H-030. Compaction values reversed for better readability.
When comparing the control experiment results with compaction results after MPL treatment, they do resemble each other. It seems then that the baking procedure is responsible for the changes in structural strength in both GDL types. The additional washing procedure seems to have little effect. For Freudenberg changes in thermal conductivity were not observed in these control experiments. Changes in thermal conductivity in the control experiments for Toray are contradictory to the changes obtained by the MPL treatment. All changes in thermal conductivity after MPL treatment for both GDL materials can thus be attributed to the MPL treatment.
In Fig. 13 a direct comparison of the dissimilar compaction results for both Freudenberg and Toray GDL and their respective composites is visualized.
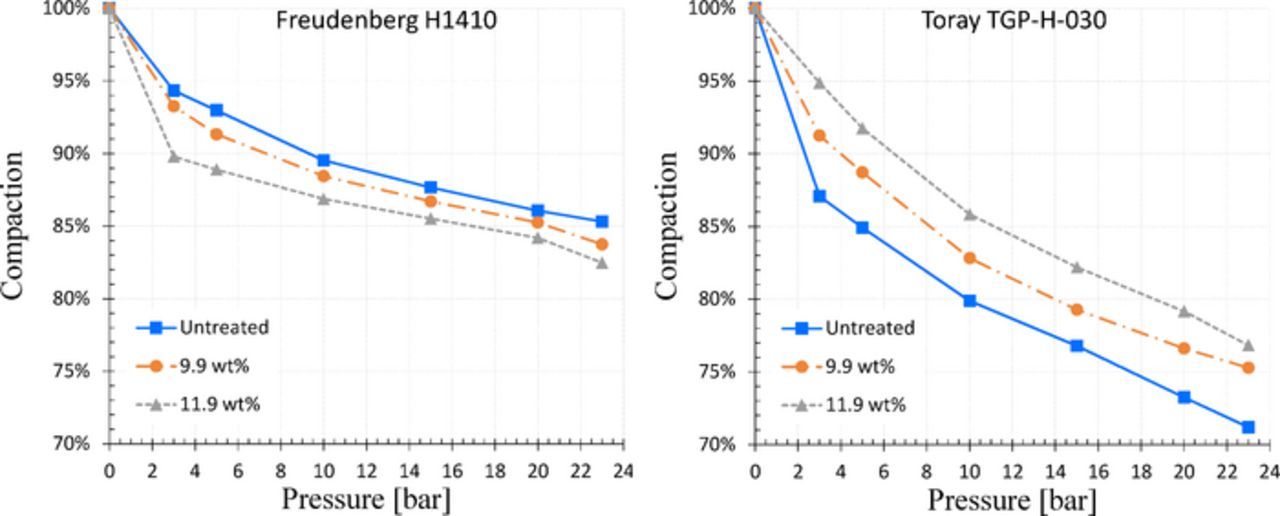
Figure 13. Plot of compaction results for Freudenberg and Toray GDL for comparison.
The coating and saturation of the GDL with MPL ink slurry and the subsequent sintering have slightly weakened the mechanical strength of the Freudenberg GDL material. Due to higher compaction, more fiber-to-fiber contacts occur and thermal conductivity increases.
In addition, the contact surface area between fibers is enlarged by the MPL treatment, thus increasing thermal transport further even though the MPL material has low thermal conductivity itself.
The Toray GDL carbon paper became less compressible by the MPL treatment. The binder that is applied to the rigid GDL fibers by the manufacturer seems to be supplemented by MPL material. This has increased the resistance to compression and at the same time lowered the thermal conductivity, as there are less fiber-to-fiber contacts due to lower compaction. The contradicting results for the two carbon papers require further research to be confirmed. A relative MPL filling degree might visualize the presented effects even better.
It seems clear that all MPL-coated GDLs have and have had this composite region all along. That means for thermal conductivity measurements of coated GDLs nothing changes, as this will yield a value for the entire sample, however it might be composed. When designing a new fuel cell, the MPL and the composite layer should be accounted for in the heat transport simulations. This will help to prevent local temperature peaks close to the membrane, that cannot be observed if a bulk thermal conductivity is used for the whole diffusion media layer. In the future, knowing the influence of the composite layer, its composition and thickness could be altered to achieve certain goals. The MPL-on-top layer might be omitted in favor of just a composite region that can provide the advantages a pure MPL has while maintaining much higher thermal conductivity, which could avoid local temperature peaks at the catalyst layer and membrane and at the same time provide drastically decreased contact resistance.41
Conclusions
Through-plane thermal conductivity and thickness variation under different compaction pressures were measured for a composite region of custom-made MPL and two different commercial gas diffusion layers (GDL), Freudenberg H1410 and Toray Paper TGP-H-030. X-ray Computed Tomography images of the materials confirmed that the MPL material has penetrated into the GDL and that a true composite material was achieved. Thermal conductivity at 15 bar compaction pressure for untreated Freudenberg H1410 GDL was measured to 0.124 ± 0.009 W K-1 m−1 and for the custom-MPL-coated Freudenberg H1410 materials 0.141 ± 0.004 W K−1 m−1 and 0.145 ± 0.004 W K-1 m−1 for 9.9 wt% and 11.9 wt% ink, respectively. For Toray paper TGP-H-030 the thermal conductivity at 15 bar compaction pressure for GDL only was measured to 0.449 ± 0.009 W K−1 m−1 and for the custom-MPL-coated Toray TGP-H-030 materials 0.39 ± 0.05 W K−1 m−1 and 0.389 ± 0.004 W K−1 m−1 for 9.9 wt% and 11.9 wt% ink, respectively. By depositing MPL material into the GDL, thermal contact between GDL fibers is enhanced for the soft and flexible Freudenberg carbon paper, hence the overall thermal conductivity of the material increases. This could be a way to improve thermal conductivity of GDL materials with low thermal conductivity to achieve improved temperature management in PEM fuel cells. An increase in PTFE content will lower the thermal conductivity of Toray carbon paper. This was also shown in this study. The addition of carbon and PTFE into the Toray GDL enhanced its structural strength, which led to decreased thermal conductivity. In general, Freudenberg GDLs have a far lower thermal conductivity than other commercially available GDLs. They are less feasible for minimizing the temperature gradient inside an operating PEMFC, but might be improved by applying MPL directly into their structure.
Acknowledgments
Financial support from the Norwegian University of Science and Technology through the Strategic Research Program ENERSENSE is greatly acknowledged. I.V. Zenyuk and A.D. Shum acknowledge support from the National Science Foundation under CBET Award 1605159. This research used resources of the Advanced Photon Source, a U.S. Department of Energy (DOE) Office of Science User Facility operated for the DOE Office of Science by Argonne National Laboratory under Contract No. DE-AC02-06CH11357. T. Khoza and N. Hussain from the University of Cape Town are acknowledged for their help with the preparation of the composite samples in their laboratories.
ORCID
I. V. Zenyuk 0000-0002-1612-0475