Abstract
Electrochemical stabilities under cycling and overcharge of Li4Ti5O12 (LTO) // LiNi1/3Mn1/3Co1/3O2 (NMC) batteries with two ionic liquid-based electrolytes and a commercial electrolyte were investigated at 25 and 60°C. The electrolytes were constituted of ethylene carbonate / dimethyl carbonate mixtures with LiPF6, and of imidazolium and pyrrolidinium-based ionic liquids containing the bis(trifluoromethanesulfonyl)imide anion (NTf2) associated to LiNTf2 salt. The experiments were performed in coin and pouch cells in order to follow the evolution of the stability of both solid, liquid and gas phases. The decomposition products and stability of the electrolytes was assessed by gas chromatography coupled with infrared spectroscopy. The characterization of the electrode surfaces by SEM, XRD and XPS techniques was reported, after cycling and overcharge. The XPS analysis of both electrodes indicated that their surfaces were covered by an IL film in the case of NMC, and by several NTf2 anion decomposition products in the case of LTO. This work highlights the difference between thermal and electrochemical stability, especially for imidazolium-based electrolytes.
Export citation and abstract BibTeX RIS

This is an open access article distributed under the terms of the Creative Commons Attribution Non-Commercial No Derivatives 4.0 License (CC BY-NC-ND, http://creativecommons.org/licenses/by-nc-nd/4.0/), which permits non-commercial reuse, distribution, and reproduction in any medium, provided the original work is not changed in any way and is properly cited. For permission for commercial reuse, please email: oa@electrochem.org.
Commercial lithium-ion batteries could lead to safety issues related to the use of flammable carbonates as electrolyte solvents.1 To provide safer cells, ionic liquids (IL) are widely studied as they possess negligible vapor pressure and reduced flammability.2 However, though information concerning the thermal stability of IL during combustion is beginning to emerge,3,4 few data exist concerning their stability in case of short-circuit, overcharge or overdischarge. The aim of this work is to compare cycling and overcharge behavior at 25 and 60°C of two IL-based electrolytes and a commercial electrolyte, in a system using Li4Ti5O12 (LTO) and LiNi1/3Mn1/3Co1/3O2 (NMC) electrodes. The IL studied were based on the bis(trifluoromethanesulfonyl)imide anion [NTf2] associated to 1-butyl-3-methylimidazolium [C1C4Im] or 1-butyl-1-methylpyrrolidinium [PYR14] cations. The corresponding electrolytes were their mixtures with 1 mol.L−1 of LiNTf2 salt, respectively referred to as [C1C4Im][Li][NTf2] and [PYR14][Li][NTf2]. The commercial electrolyte was constituted of an equi-volumic mixture of ethylene carbonate (EC) and diethylcarbonate (DEC) containing 1 mol.L−1 of LiPF6 salt, referred to as [EC:DEC][LiPF6], Figure 1. For each electrolyte, cycling and overcharge experiments were run in LTO // NMC coin or pouch cells. The evolved gases and the battery components (electrolyte and electrodes) were analyzed after cycling and overcharge at 60°C.
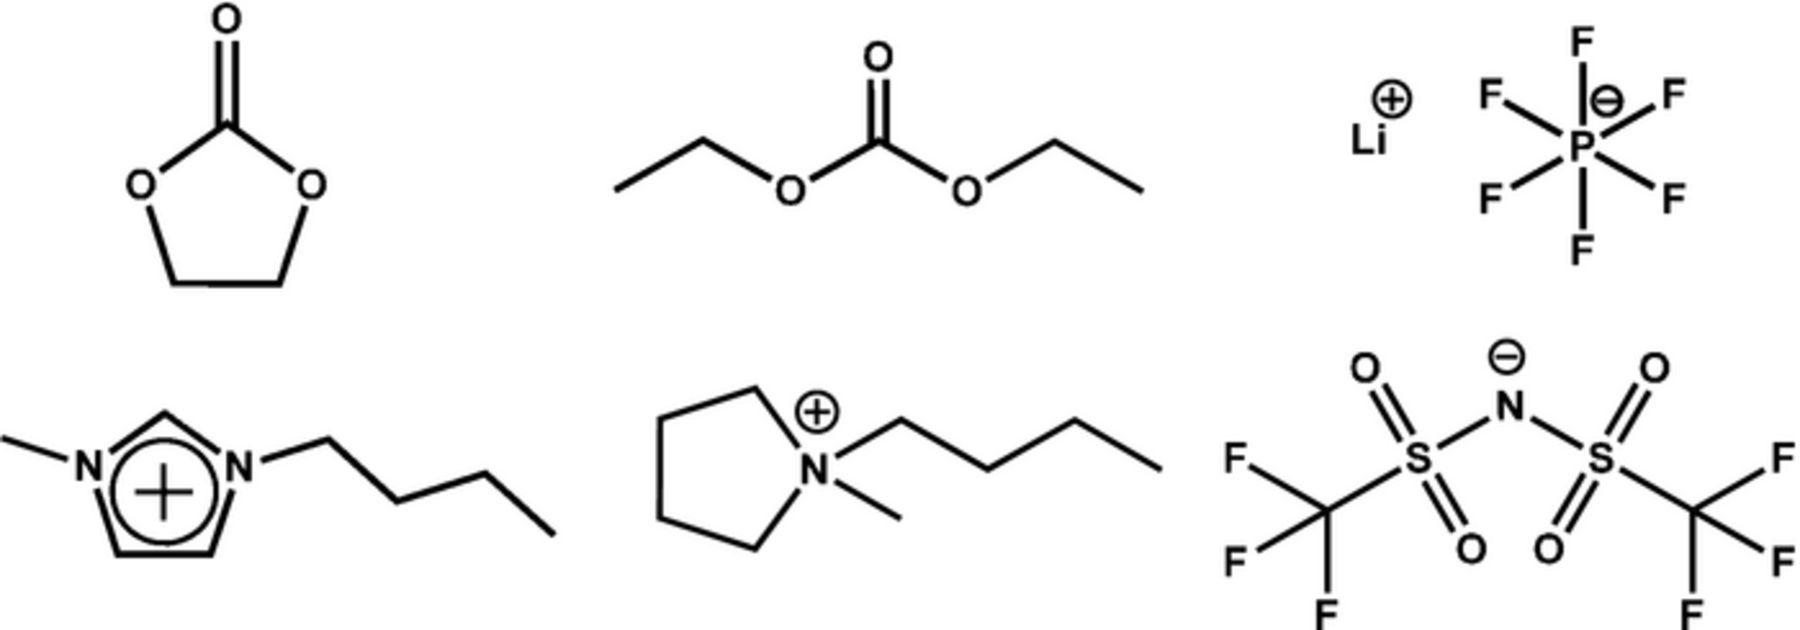
Figure 1. Top: Ethylene carbonate, diethyl carbonate and lithium hexafluorophosphate. Bottom: imidazolium [C1C4Im] and pyrrolidinium [PYR14] cations, bis(trifluoromethanesulfonyl) imide anion [NTf2].
Results and Discussion
In a first set of experiments, the cycling performances of LTO // NMC coin cells (∼ 2 mAh) and pouch cells (∼ 10 mAh) with the three electrolytes were investigated at 25°C and 60°C. In the case of pouch cells, the battery evolutions were monitored by measuring the volume increase, and analyzing evolved gases. In a second set of experiments, the batteries were submitted to a charge at C/10-rate up to 4.5 V (NMC potential reached 6 V vs Li+/Li) followed by a floating of 20 h at this voltage at 60°C. Meanwhile the currents required to maintain the cell voltage and the cell volumes were measured. The emitted gases were identified by gas chromatography coupled with infrared spectroscopy (GC-IR). The post mortem analyses of the electrode surfaces were carried out by scanning electron microscopy (SEM), X-ray diffraction (XRD) and X-ray photoelectron spectroscopy (XPS) techniques.
Cycling tests
The batteries were galvanostatically cycled for 100 cycles. The program consisted of 5 cycles at C/20-rate (1 for pouch cells) followed by cycles at C/10-rate (charged and discharged in 10 h). The cycling performances of LTO // NMC coin cells were investigated with the three electrolytes [EC:DEC][LiPF6], [C1C4Im][Li][NTf2] and [PYR14][Li][NTf2] in coin cells (∼2 mAh) (Figure 2 and 3) and pouch cells (∼10 mAh) (Figure 4). Pouch cell volumes were measured after 30 and 50 cycles, which could explain some discontinuities in the capacity values.
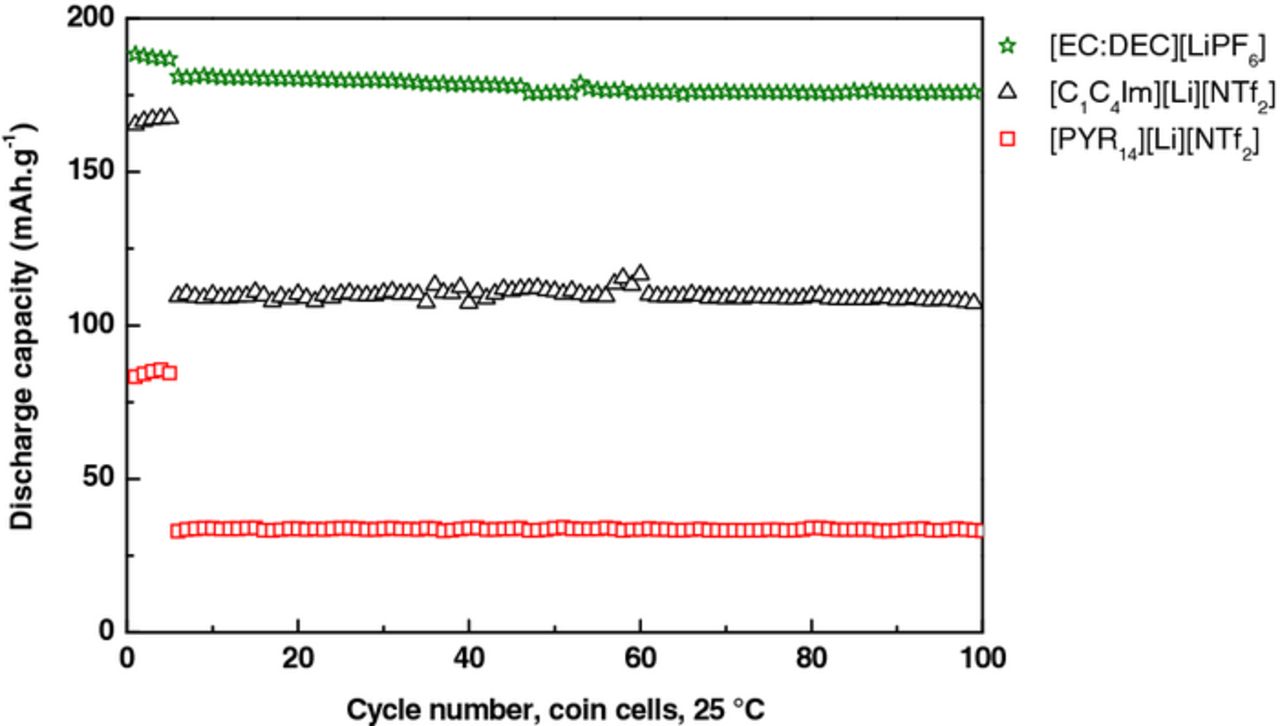
Figure 2. Cycling performances of the three electrolytes in coin cells at 25°C according to this sequence: 5 cycles at C/20-rate followed by 95 cycles at C/10-rate.
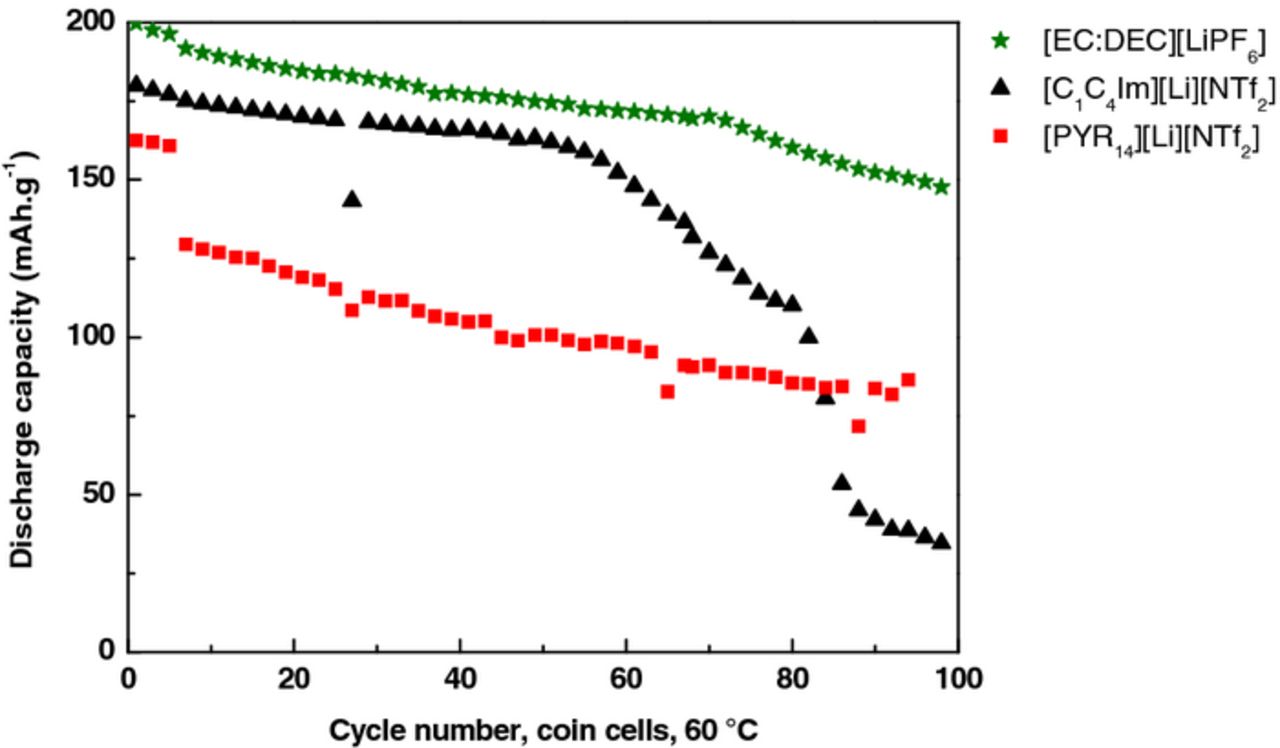
Figure 3. Cycling performances of the three electrolytes in coin cells at 60°C according to this sequence: 5 cycles at C/20-rate followed by 95 cycles at C/10-rate.
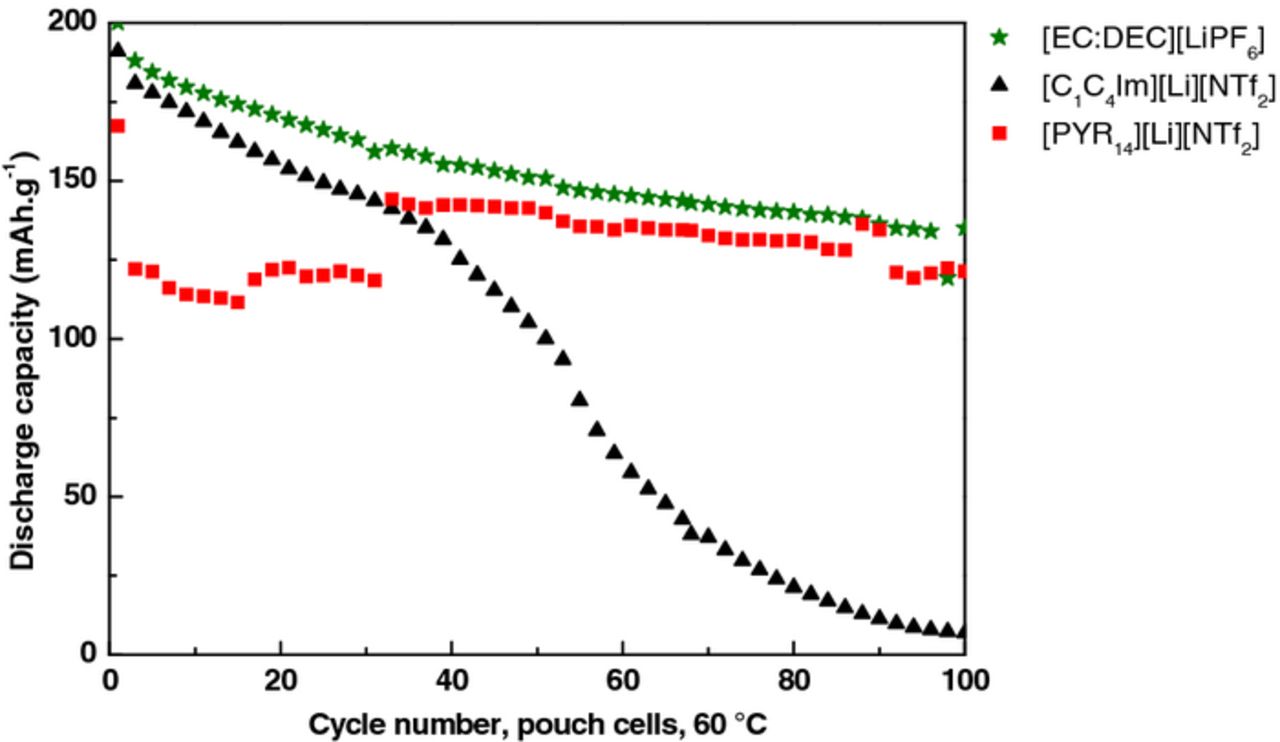
Figure 4. Cycling performances of the three electrolytes in pouch cells at 60°C according to this sequence: 1 cycle at C/20-rate followed by 99 cycles at C/10-rate.
At 25°C the three systems showed very high stability and didn't show any decomposition, Figure 2. [EC:DEC][LiPF6] electrolyte demonstrated the highest initial discharge capacity (188 mAh.g−1) as compared to [C1C4Im][Li][NTf2] (165 mAh.g−1), and [PYR14][Li] [NTf2] (83 mAh.g-1).
At 60°C, for each electrolyte the performances in both configurations of batteries (coin and pouch cells) were similar. [EC:DEC][LiPF6] electrolyte demonstrated almost the same initial discharge capacity than [C1C4Im][Li][NTf2] (200 vs 191 mAh.g−1), and higher than for [PYR14][Li][NTf2] (167 mAh.g–1). For all the electrolytes the capacity continuously faded. During the first 30 cycles the capacity loss was 0.9 mAh.g−1 per cycle in the case of [EC:DEC][LiPF6], 1.4 mAh.g−1 per cycle for [C1C4Im][Li][NTf2] and 0.1 mAh.g−1 per cycle for [PYR14][Li][NTf2]. Unexpectedly, the capacity of cells containing [C1C4Im][Li][NTf2] showed a sharp capacity drop, inducing a decrease of 2.4 mAh.g–1 per cycle after ∼ 50 cycles at C/10.
The volumes of these gaseous emissions were measured by weighing the pouch cells in air and in ethanol and using Archimedes' principle, after assembling (initial volume), after the first cycle, and after 100 cycles, Table I. For all the electrolytes, no significant volume evolution was observed after the first cycle. After 100 cycles, the cell volumes containing [C1C4Im][Li][NTf2] and [EC:DEC][LiPF6] simultaneously changed. A volume increase of approximately 1 mL was measured for the batteries containing [C1C4Im][Li][NTf2] and [EC:DEC][LiPF6] electrolytes, and of 0.1 mL for the battery containing [PYR14][Li][NTf2] electrolyte.
Table I. Pouch cell volumes after at different stages of cycling at 60°C.
| Volumes (mL) | [EC:DEC][LiPF6] | [C1C4Im][Li][NTf2] | [PYR14][Li][NTf2] |
|---|---|---|---|
| Initial | 2.0 | 2.1 | 2.1 |
| After 1st cycle | 2.1 | 2.2 | 2.1 |
| After 100 cycles | 2.8 | 3.2 | 2.2 |
| Δ Volume | 0.8 | 1.1 | 0.1 |
Emitted gases, analyzed by GC-IR, Figure 5, were mainly carbon dioxide CO2, diethylether O(C2H5)2 and difluoroethane for the [EC:DEC][LiPF6] electrolyte, in line with the literature.5,6 From [C1C4Im][Li][NTf2] electrolyte, carbon monoxide, alkanes (methane, propane and butane) and fluorinated products derived from NTf2 anion decomposition including CF3H were identified. Note that during the thermal decomposition of the [C1C4Im][Li][NTf2] electrolyte, the evolved gas phase was mainly constituted of butene isomers, resulting from the cleavage of the butyl-N bond of the imidazolium ring.4
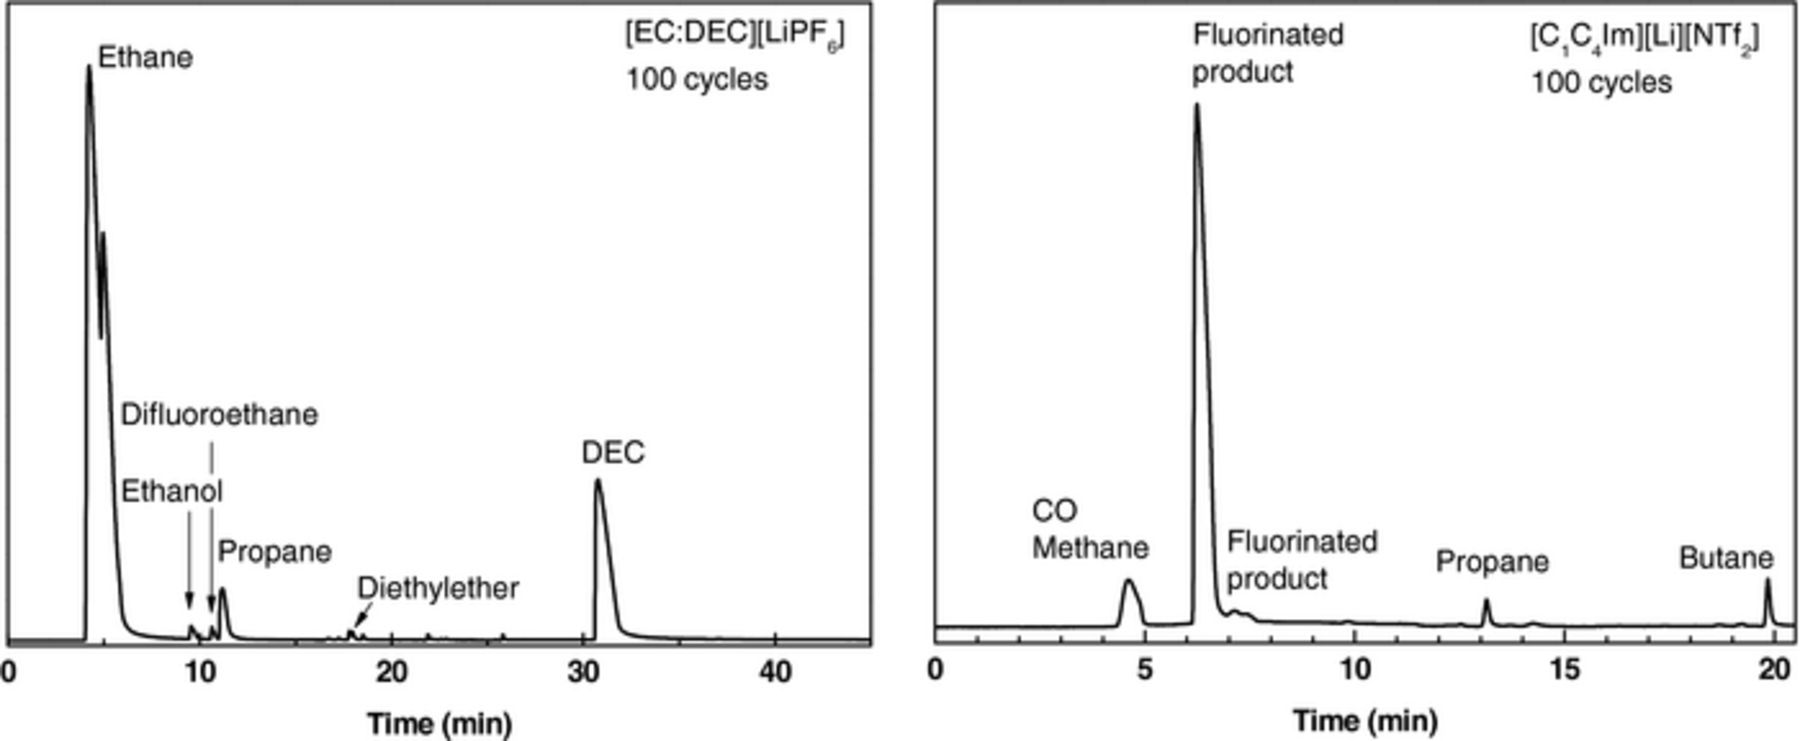
Figure 5. Gas chromatograms of the evolved gas phase of pouch cells based on [EC:DEC][LiPF6] (left) and [C1C4Im][Li][NTf2] (right) electrolytes after 100 cycles at C/10-rate and at 60°C.
Overcharge behavior
The LTO // NMC pouch cells with [EC:DEC][LiPF6], [C1C4Im][Li][NTf2] and [PYR14][Li][NTf2] electrolytes were overcharged up to 4.5 V (6 V vs Li+/Li) at C/10-rate, and a float voltage was set for 20 h at 60°C. The current used to maintain the cell voltage at 4.5 V during this step was 0.4 mA in the case of [C1C4Im][Li][NTf2], three times higher than for the two other electrolytes, Figure 6 and Table II. In parallel, after overcharge the cell volumes increased by 2.81 mL for the [C1C4Im][Li][NTf2] electrolyte, by 0.30 mL for [EC:DEC][LiPF6], and by 0.12 mL for [PYR14][Li][NTf2], Table II. Similarly to cycling experiments, the gases generated during overcharge were identified by GC-IR as carbon monoxide CO, dihydrogen H2, fluorinated species, and alkanes such as methane, propane and butane, Figure 7.4 At 60°C, in both cycling and overcharge experiments, the [C1C4Im][Li][NTf2] electrolyte exhibited the lowest stability. Its observed instability in this LTO // NMC system was unexpected since imidazolium-based electrolytes exhibited a higher cycling stability with others electrode systems such as Li4Ti5O12 // LiFePO4 or Li // LiCoO2.7,8 This observation could be explained by the nature of the positive electrode which can be affected by metal dissolution at high voltages.9 This can induce a modification of the extreme surface of the positive electrode,10,11 modifying its potential, and generating new surface reactions with the electrolyte. To highlight this electrode impact, the XPS analyses of the electrode surfaces before and after overcharge were realized.
Table II. Current intensities and pouch cell volumes after 20 h of overcharge at 60°C.
| Current (mA) | Volume increase (mL) | |
|---|---|---|
| [EC:DEC][LiPF6] | 0.13 | 0.30 |
| [C1C4Im][Li][NTf2] | 0.40 | 2.81 |
| [PYR14][Li][NTf2] | 0.05 | 0.12 |
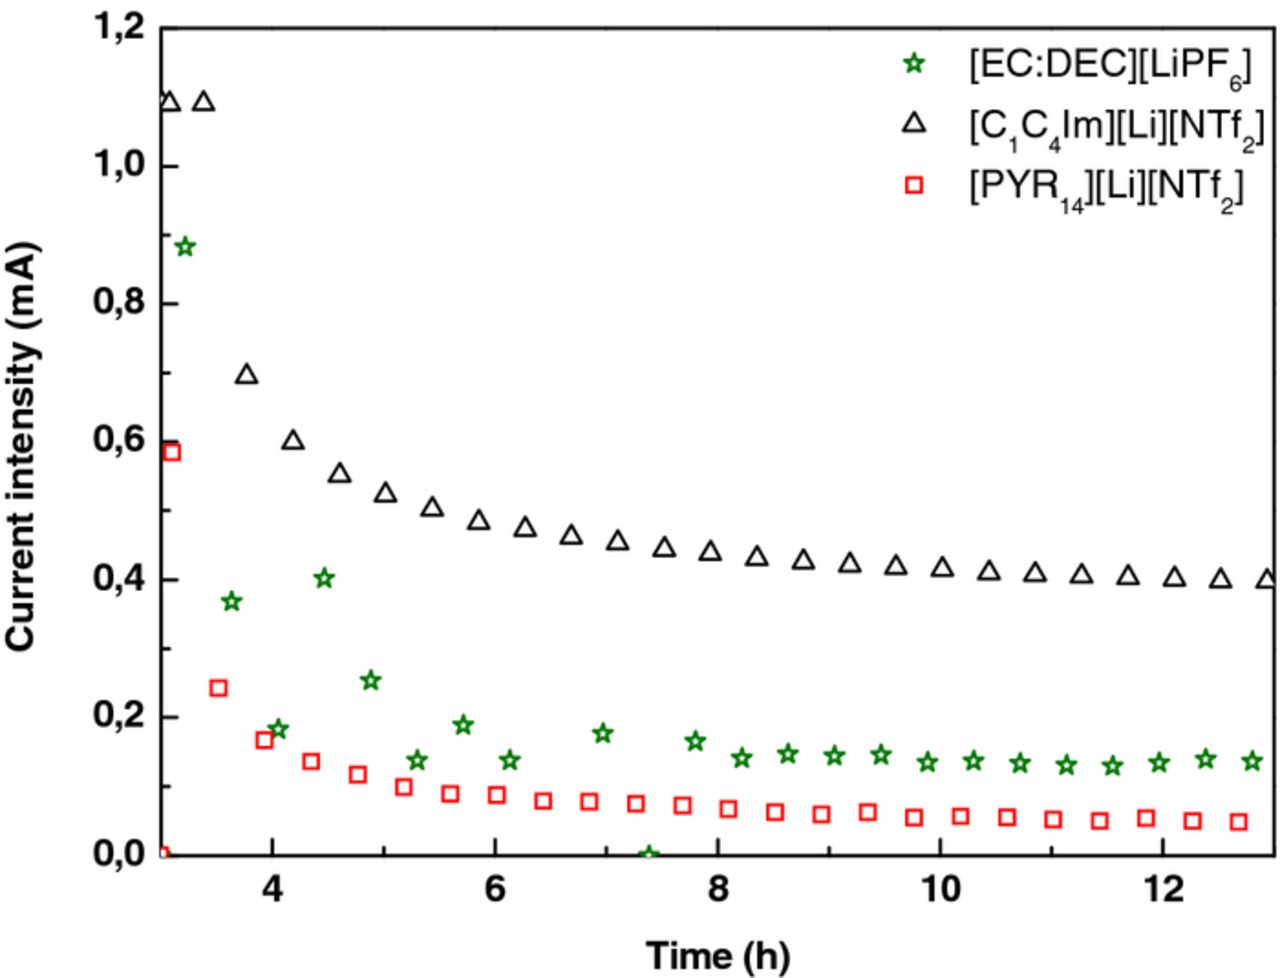
Figure 6. Measured current intensities for the last ten hours of float voltage at 4.5 V of LTO // NMC pouch cells containing [EC:DEC][LiPF6], [C1C4Im][Li][NTf2] and [PYR14][Li][NTf2] at 60°C.
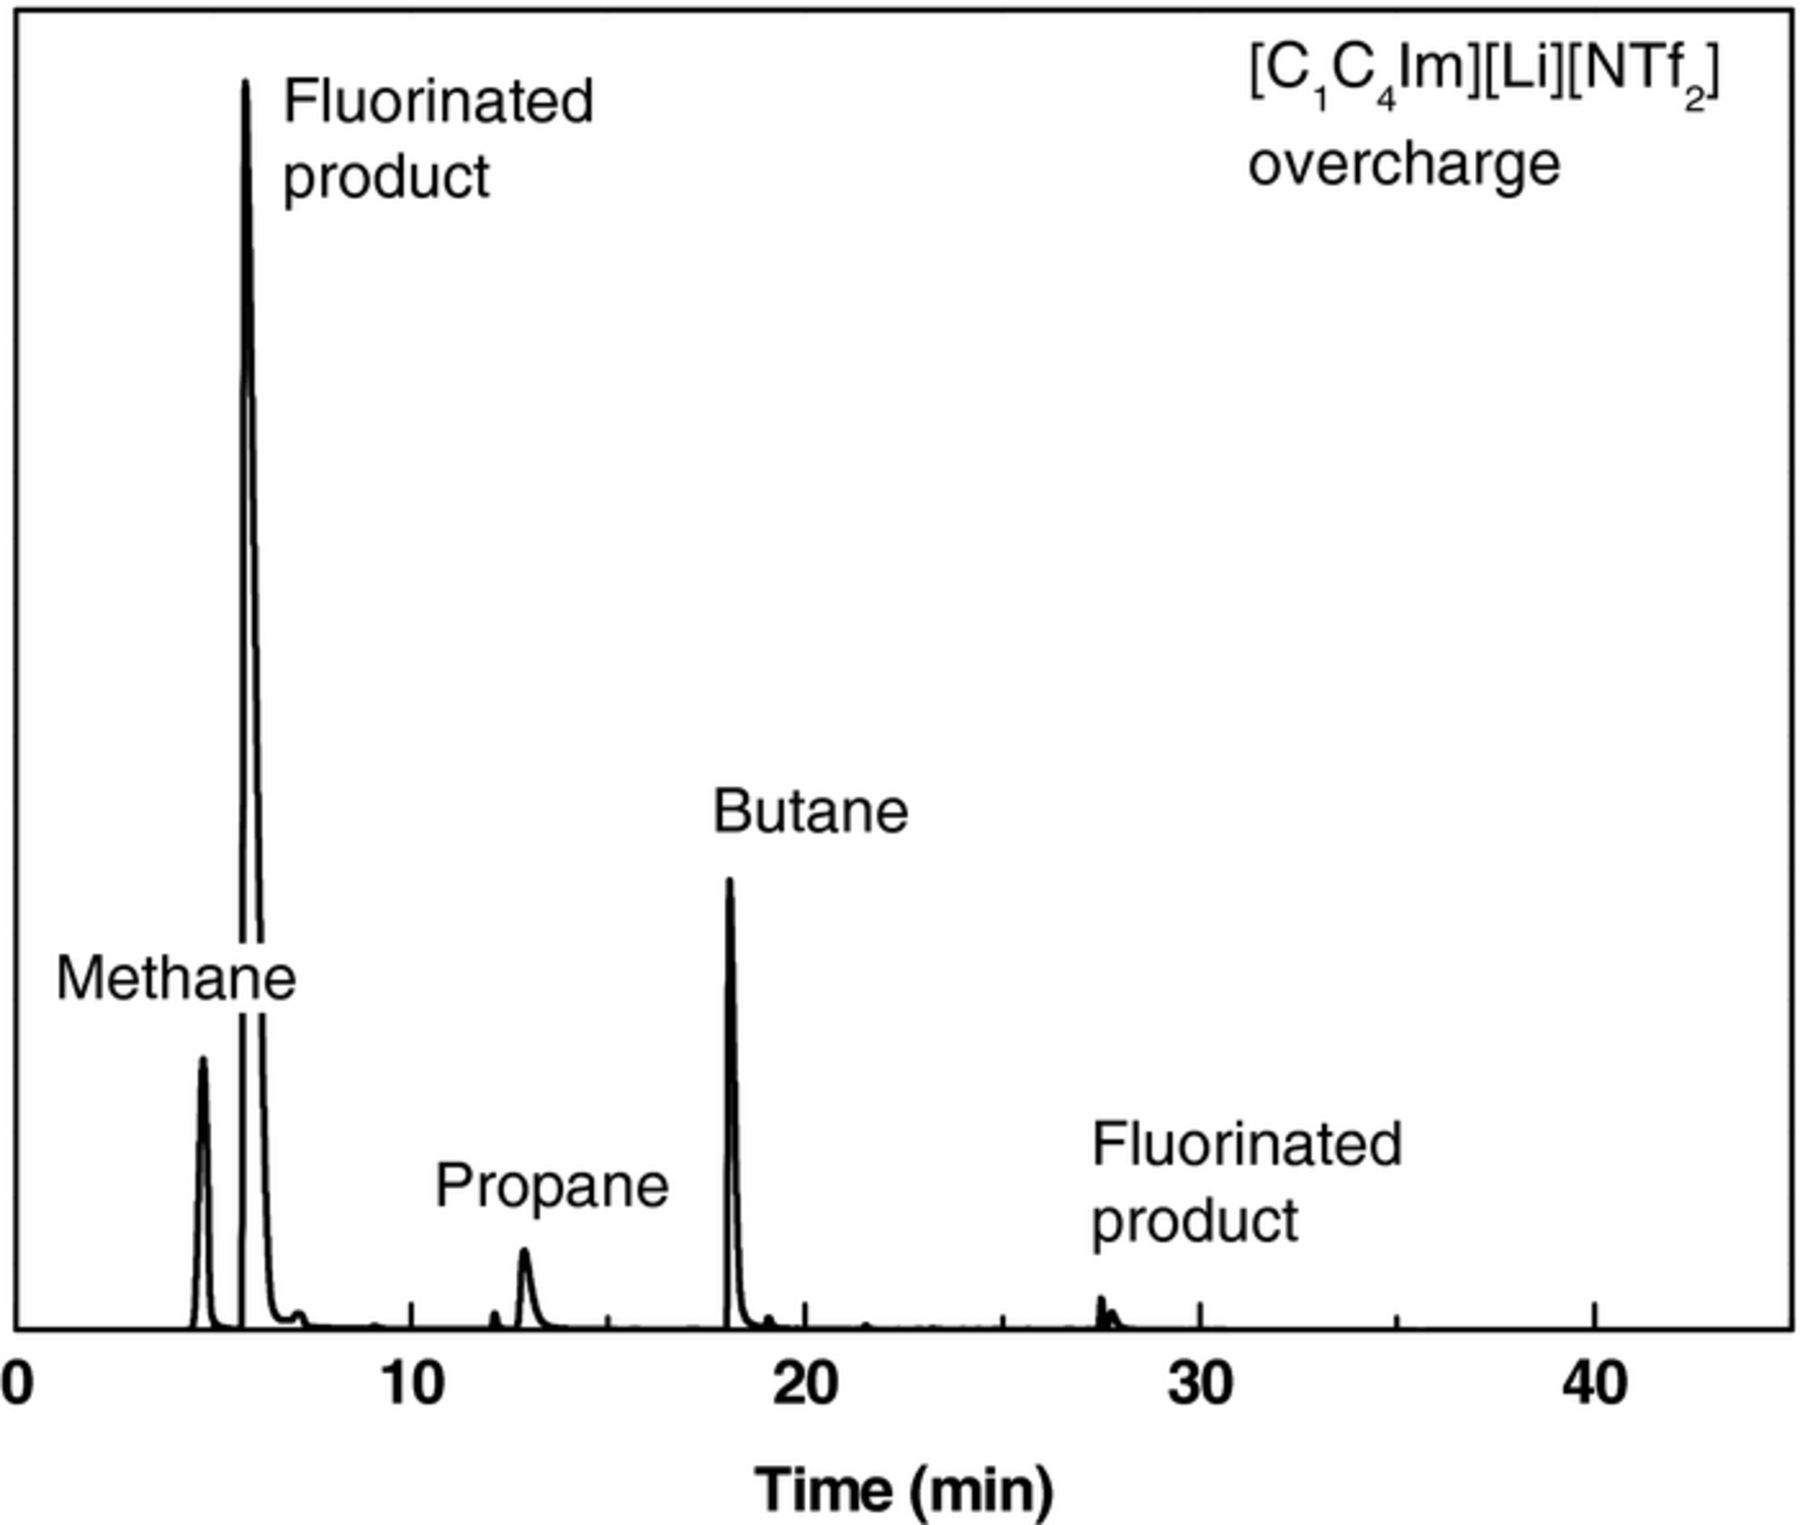
Figure 7. Chromatogram of the gases accumulated in [C1C4Im][Li][NTf2]-based pouch cell after overcharge at 60°C.
As the battery overcharge induces overheating of its different elements, we firstly studied the thermal stability of each element of the battery. IL-based electrolytes were found stable up to 350°C, and imidazolium-based IL were found more stable than pyrrolidinium-based ones.4 The LTO and NMC electrodes heated up to 350°C for 2 h remained unchanged as proved by Scanning Electron Microscopy (SEM) and X-Ray Diffraction (XRD) analyses.
After overcharge at 60°C, post mortem analyses of the electrode surfaces with [C1C4Im][Li][NTf2] as electrolyte were carried out by SEM, XRD and XPS. XRD diffractograms revealed no change for the LTO structure, a spinel of cell parameter 8.352 Å. Contrarily, the cell parameters a and c of NMC structure (rhombohedric α-NaFeO2, Figure 8)9,12–16 varied from 2.860 and 14.225 Å to 2.831 and 14.322 Å, respectively. The modification of these parameters was related to the delithiation of NMC during overcharge. Note that SEM analyses of LTO and NMC electrodes did not show cracks or any other surface damage.
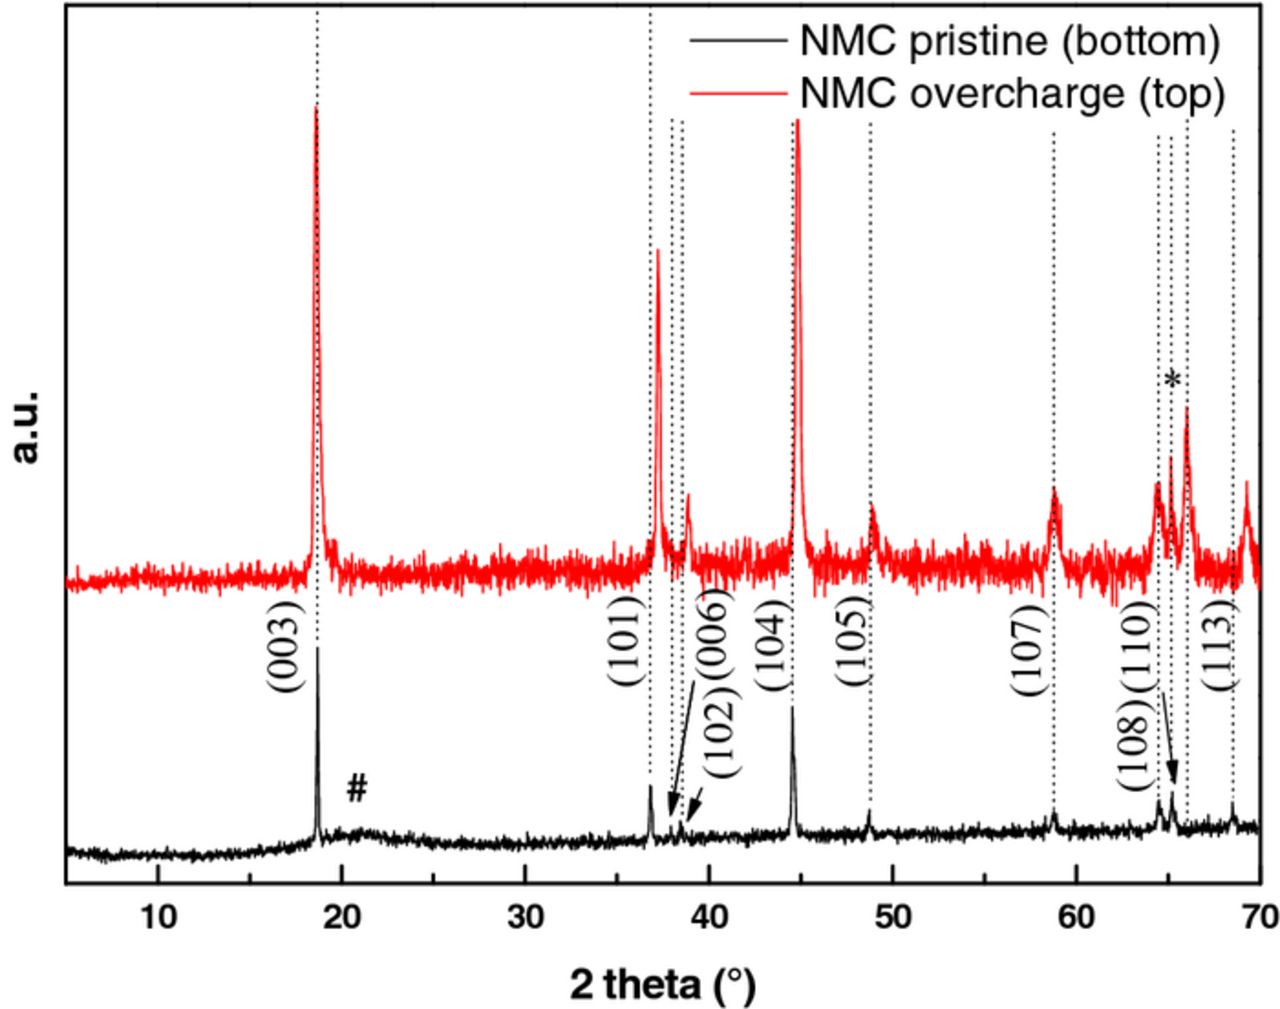
Figure 8. Evolution of the indexed XRD diagram of NMC electrodes, pristine (bottom) and after overcharge (top); # is from the polymer dome to keep the sample under inert atmosphere and * is from the aluminum current collector.
The X-ray Photoelectron Spectroscopy (XPS) survey spectra of pristine LTO and NMC electrodes showed the presence of different elements on the surface, Figure 9, as reported in the literature.17 A comparative analysis of the high resolution XPS spectra for each atomic component C 1s, N 1s, O 1s, F 1s, and S 2p obtained for both post mortem electrodes and pure [C1C4ImNTf2]18,19 is reported in Figure 10 and Table III.
Table III. Binding energies (eV) and identification of each atomic component contributions of the electrodes after overcharge.
| Chemical nature | Neat [C1C4ImNTf2]18 | LTO After overcharge | NMC After overcharge | |
|---|---|---|---|---|
| C 1s | CF3 | 293.0 | - | 292.6 |
| C-N | 287.4 | 285.7 | 285.7 | |
| Caliphatic | 285.3 | 284.6 | 284.6 | |
| anion decomposition | - | 288.5 | 290.2 | |
| cation decomposition | - | 288.5, 286.9 | ||
| N 1s | cation | 402.1 | 400.9 | 401.4 |
| anion | 399.5 | 399.0 | 399.3 | |
| decomposition product | 403.4 | |||
| O 1s | anion | 532.7 | 531.8 | 532.4 |
| bulk electrode | - | - | 529.5 | |
| anion decomposition | - | 533.2, 534.0, 530.0 | ||
| F 1s | anion | 688.8 | 690.0 | 687.9 |
| LiF | - | 684.3 | ||
| anion decomposition | 686.1 | |||
| S 2p | anion | 169.1 | 169.3 | 168.7 |
| anion decomposition | 161.4, 167.3 | 164.5 |
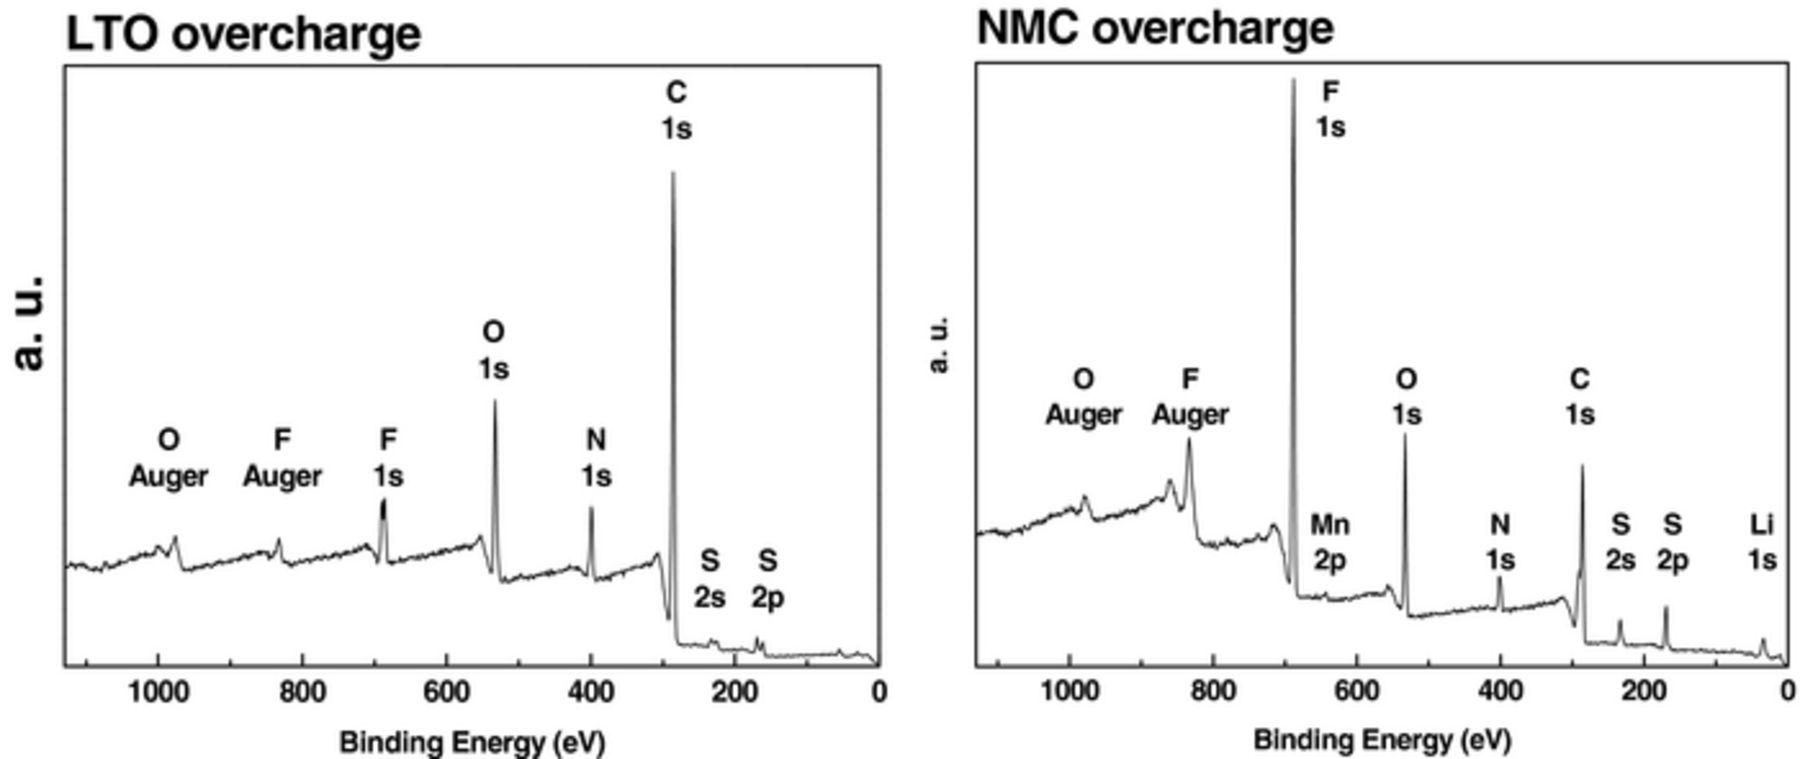
Figure 9. XPS survey spectra of LTO (left) and NMC (right) electrodes from overcharged cells.
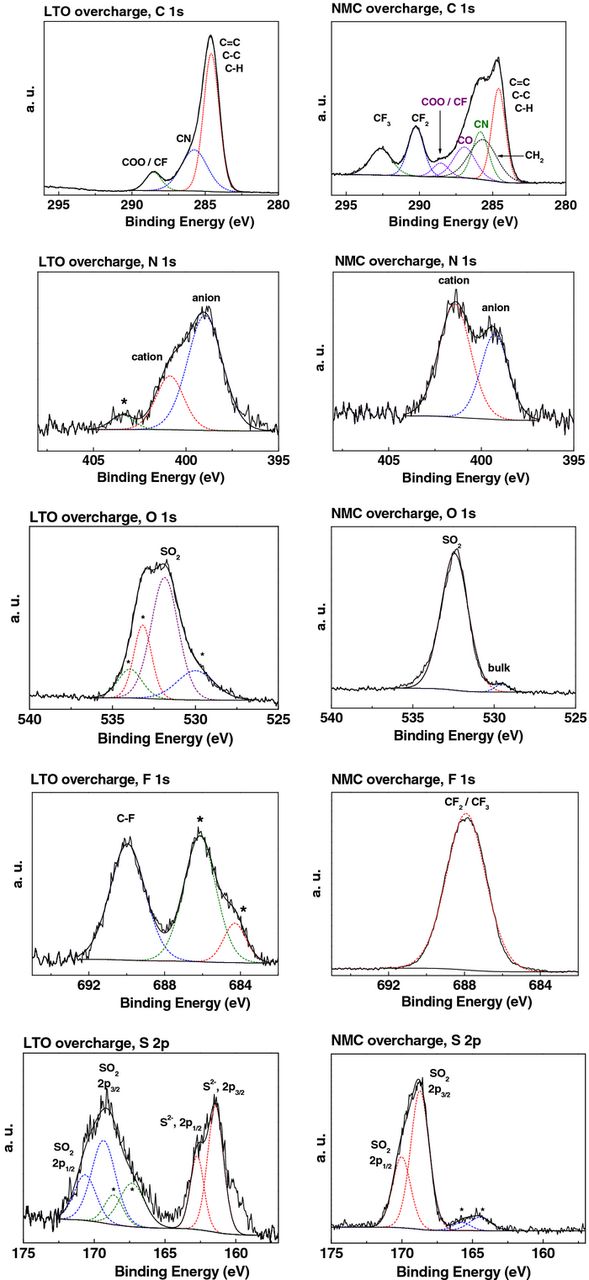
Figure 10. High resolution XPS spectra of C 1s, N 1s, O 1s, F 1s, and S 2p from LTO (left) and NMC (right) electrodes after overcharge; * represents electrolyte or salt decomposition products.
On washed post mortem NMC electrode, bulk oxygen and manganese were still visible, meaning that the IL film on the electrode was thinner than 10 nm (XPS depth of analysis).20 The surface layer was mainly constituted of physisorbed IL as confirmed by the presence of C 1s, N 1s, O 1s, F 1s, and S 2p peaks, assigned to [C1C4ImNTf2].19–21
In contrast, in the XPS spectrum of washed post mortem LTO electrode most of the initial elements were hidden, revealing that the surface was covered by a residual electrolyte film thicker than 10 nm. Note that the comparison of N 1s peak intensities (between 400.9 eV peak for Ncation and 399.0 eV peak for Nanion) in the spectra of the pure IL and of the LTO surface showed a strong decrease of the cation contribution. Besides the S 2p3/2 and F 1s peaks corresponding to the anion, new peaks were observed, Figure 9. The new F 1s peaks at 684.3 and 686.1 eV could be assigned to LiF and Li2NSO2CF3, the last one associated with the new N 1s peak at 403.4 eV. The additional S 2p3/2 peaks at 161.4 and 167.3 eV could be related to the presence of Li2S and Li2S2O4 species. The new O 1s peaks at 533.2 and 534.0 eV may be due to the presence of lithium carbonates, alkyl lithium carbonates or the remainder of dimethylcarbonate used to wash the electrodes. Most of the new peaks observed in the XPS spectra of LTO surface result from the decomposition and reduction of the NTf2 anion. Both the formation of a larger gas volume in the case of [C1C4Im][Li][NTf2] compared to [PYR14][Li][NTf2] electrolyte and the easy decomposition of NTf2 anion proved by XPS results could be corelated to the easy deprotonation of imidazolium cycle, Figure 11.22 This could lead to the formation of free HNTf2 and carbene derivatives that could be washed out from the surface.
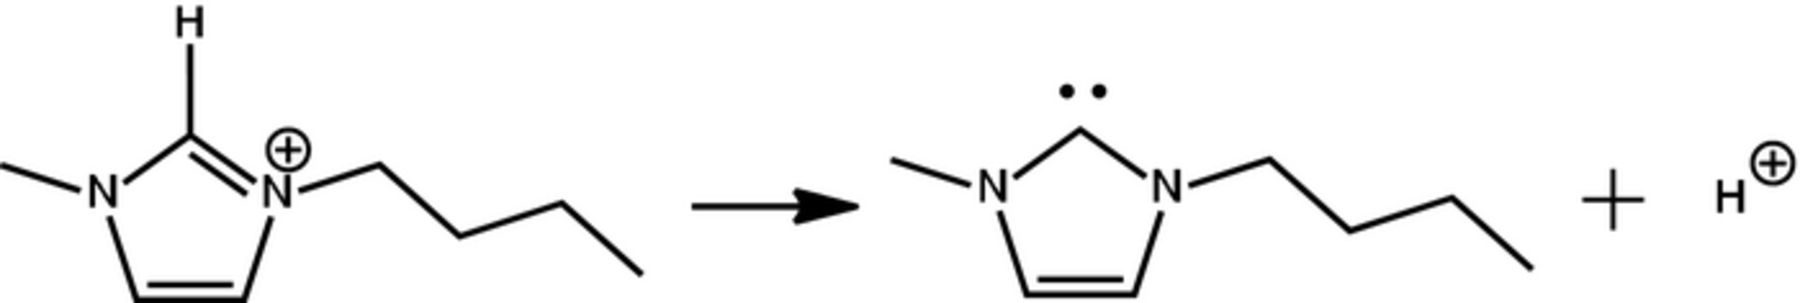
Figure 11. Electrochemical deprotonation of imidazolium C2-H.22
Experimental
Electrolytes preparation
IL and their electrolytes were synthesized and purified as reported in the literature.4 These electrolytes were prepared under inert conditions by adding 1 mol.L-1 of LiNTf2. [EC:DEC][LiPF6] (BASF) was stored in a glove box and used as received. The water content was lower than 60 ppm for all electrolytes.
Electrodes preparation
Li4Ti5O12 composite electrodes (LTO) were prepared by coating an aqueous-based slurry on aluminum current collector foil (20 μm thickness). The composition of the slurry was 90 % LTO, 5 % SuperC65, 1 % carboxymethylcellulose and 4 % latex, affording an active mass loading of 1.3 mAh.cm−2. LiNi1/3Mn1/3Co1/3O2 composite electrodes (NMC) were prepared by coating a N-methylpyrrolidone-based slurry on aluminum current collector foil. The composition of the slurry was 92 % NMC, 2 % SuperC65, 4 % polyvinylidene fluoride and 2 % vapor grown carbon fibers, affording an active mass loading of 1.1 mAh.cm−2. After roll pressing both positive and negative electrode thicknesses were 60 μm, and their porosity was 35 %. The electrodes were stamped out in 16 mm diameter discs, dried at 80°C under vacuum for 48 hours and stored in an argon-filled glove box.
Battery assembly
LTO // NMC lithium-ion coin cells (∼ 2 mAh) were assembled by encapsulating negative electrode, glass fiber separator (Whatman GF/A), 150 μL of electrolyte, positive electrode and inox plate into 2032-type coin cells in an argon-filled glove box. LTO // NMC lithium-ion pouch cells of 9 cm² (∼ 10 mAh) were assembled as follow. The negative electrode (35 mm side), glass fiber separator (Whatman GF/A, 4 cm side) and positive electrode (32 mm side) were encapsulated into three layer PE/Al/PE film in a dry room. The system was dried overnight under vacuum at 55°C, and 0.5 mL of electrolyte were added in an argon-filled glove box. To ensure the complete wetting of the electrodes and separator by the electrolyte, each cell was kept at 60°C for 12 h before the electrochemical experiments.
Cycling programs
The cells were galvanostatically cycled at 60°C with an Arbin multi-channel potentiostat / galvanostat, between the cut off voltages of [1–3.5 V]. The capacities were reported in mAh.g−1, based on the limiting active material mass of NMC. Overcharge of LTO // NMC battery consisted in a charge up to 4.5 V (6 V vs Li) at C/10-rate followed by a float voltage for 20 hours at 60°C.
Post mortem analyses of the gases
Volumes were determined by weighing the pouch cells in air and in ethanol, and the difference between these two masses was divided by ethanol density, 0.789 g.cm−3. The volume increase was reported after subtraction of initial volume (before any cycling). Gases were taken up from the pouch cell with a gas syringe, through a septum and in an argon-filled glove box. They were transferred into the injector of GC-IR apparatus (Trace GC Ultra and Nicolet 6700 from Thermo Scientific), maintained at 150°C. Gases were brought by helium carrier gas into a QBond column (l = 30 m, d = 0.32 mm) where organic gases were retained and sent first to an infrared spectrometer and then to a FID detector. Permanent gases were separated by a carboxene column (l = 15 m, d = 0.32 mm) and then sent to a TCD detector.
Post mortem analyses of the electrodes
Solid state analyses of the electrodes were performed at RT after opening the cells and washing the electrodes in dimethylcarbonate in an argon-filled glove box. The crystalline phase of the material was investigated by XRD analyses, performed on Bruker D8 Advance diffractometer at 33 kV and 45 mA with Cu-kα radiation (λ = 0.15418 nm). A Bragg-Brentano geometry was used with PSD Vantec-1 detector where Kβ radiation was filtered by nickel foil. The diffraction data were recorded at room temperature for 2θ angles between 5° and 70°. The XPS experiments were carried out in a KRATOS AXIS Ultra DLD spectrometer equipped with a hemispherical analyzer and a delay line detector. The base pressure in the analysis chamber was 5.10−9 mbar. All the data were acquired using monochromated Al Kα X-rays 1486.6 eV, 150 W, at a normal angle with respect to the plane of the surface. The survey scans were obtained at 160 eV pass energy, while high-resolution core-level spectra were measured at 20 eV pass energy. The fit of N-bonded C 1s peak is wide as it includes both C-C-N and N-C-N from the imidazolium cation.
Conclusions
Electrochemical stabilities of Li4Ti5O12 (LTO) // LiNi1/3Mn1/3Co1/3O2 (NMC) cells with two IL-based electrolytes ([C1C4Im][Li][NTf2] and [PYR14][Li][NTf2]) and a commercial electrolyte ([EC:DEC][LiPF6]) were investigated at 25 and 60°C. Both lithium salt concentrations were 1 mol.L-1.
During the cycling at C/10-rate and at 60°C, a strong capacity decrease was observed with [C1C4Im][Li][NTf2] after about 50 cycles, in coin and pouch cells. Moreover, this IL exhibited a very low stability under cycling and overcharge, compared to [PYR14][Li][NTf2] as well as to carbonates.
LTO and NMC electrodes were thermally stable after a thermal treatment of 2 hours at 350°C as assessed by XRD and SEM analyses.
After overcharge at 60°C, XRD analysis indicated a delithiation of the NMC electrode, and no change of the LTO electrode. The XPS analyses after overcharge indicated that both electrode surfaces were covered by an IL film. Moreover, several NTf2 anion decomposition products were present on LTO surface. This works highlights that imidazolium-based electrolytes are the most thermally stable, but the least stable under overcharge conditions. Further experiments are necessary to find a balance between thermal (in case of fire) and electrochemical (in case of overcharge) stabilities of the electrolytes.
Acknowledgments
The authors thank R. Vera (ISA) and Dr. J.-F. Colin (CEA) for the help with XRD measurements, and Dr. J.-L. Rousset and L. Massin (IRCELYON) for XPS experiments.