Abstract
This report describes the first detailed electrochemical examination of a series of copper birnessite samples under lithium-based battery conditions, allowing a structure/function analysis of the electrochemistry and related material properties. To obtain the series of copper birnessite samples, a novel synthetic approach for the preparation of copper birnessite, CuxMnOy·nH2O is reported. The copper content (x) in CuxMnOy·nH2O, 0.28 ≥ x ≥ 0.20, was inversely proportional to crystallite size, which ranged from 12 to 19 nm. The electrochemistry under lithium-based battery conditions showed that the higher copper content (x = 0.28) and small crystallite size (∼12 nm) sample delivered ∼194 mAh/g, about 20% higher capacity than the low copper content (x = 0.22) and larger crystallite size (∼19 nm) material. In addition, CuxMnOy·nH2O displays quasi-reversible electrochemistry in magnesium based electrolytes, indicating that copper birnessite could be a candidate for future application in magnesium-ion batteries.
Export citation and abstract BibTeX RIS

This is an open access article distributed under the terms of the Creative Commons Attribution Non-Commercial No Derivatives 4.0 License (CC BY-NC-ND, http://creativecommons.org/licenses/by-nc-nd/4.0/), which permits non-commercial reuse, distribution, and reproduction in any medium, provided the original work is not changed in any way and is properly cited. For permission for commercial reuse, please email: oa@electrochem.org.
Battery applications range from portable power to the need for electrochemical energy storage coupled with renewable forms of energy generation; these types of applications drive battery research.1–3 For large scale battery use, the use of environmentally benign and low cost energy storage materials is desired. Manganese-based materials are environmentally friendly and inexpensive when compared to materials based on cobalt or nickel, and thus have received much attention in the battery research literature. For example, several types of manganese oxide materials including hollandite (2 × 2 tunnel, OMS-2),4–7 and todorokite (3 × 3 tunnel, OMS-3)8 have been investigated for battery applications, where quasi-reversible lithium-ion electrochemistry in reported.
Birnessite, a layered manganese oxide, exists as a monoclinic crystal with a space group designation of C 2/m.9,10 The birnessite structure consists of layers of manganese-oxygen octahedra (MnO6) with water molecules positioned between the MnO6 layers. Although birnessite can be formed without any interlayer cations,11,12 +1 and +2 cations, such as H+, Na+, K+, Cs+, Mg2+, Cu2+, and organoammonium ions, can be positioned between the layers in the birnessite structure.13,14 Two birnessite structures are shown in Figure 1 where the interlayer distance is approximately 7.0 Å for structures containing either monovalent or divalent cations.10,14,15
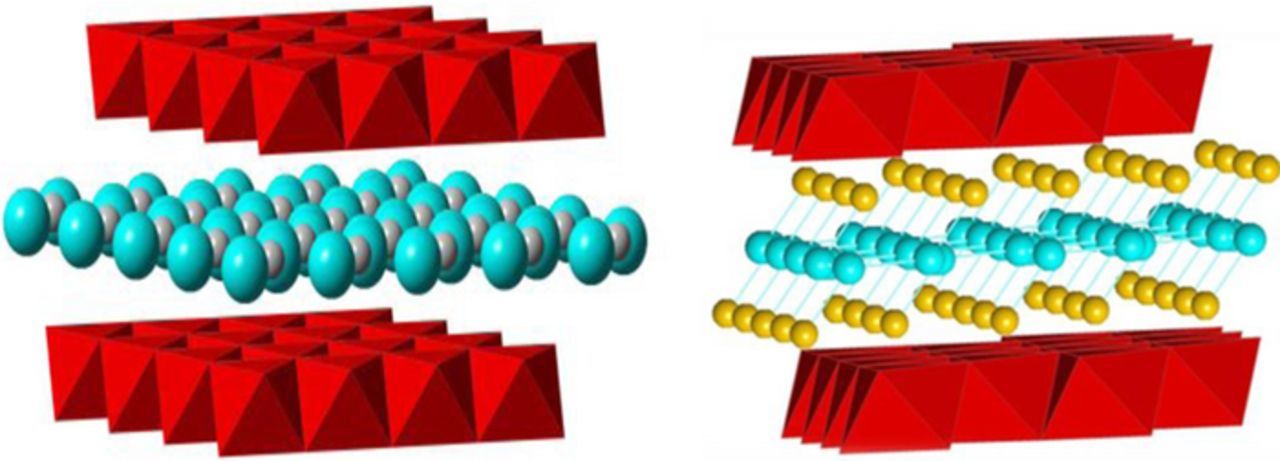
Figure 1. Structure of birnessite, left, large (gray) cations (Na+, K+ or Cs+) and right, small (yellow) cations (Mg2+, Zn2+or Cu2+) incorporated with water (blue) intercalated between two MnO6 (red) layers.
Battery-related electrochemical studies of birnessite have been reported for more than two decades. For example, in 1991, Bach et al. reported a thermally synthesized lamellar birnessite with a formula of MnO1.8·nH2O and a measured 180 mAh/g capacity.11 However, the high synthesis temperature (∼800°C) restricted the ability to control the crystallite size of birnessite particles. In 1997, Chen and Whittingham reported a lower temperature hydrothermal method to synthesize birnessite containing monovalent cations – potassium, sodium and lithium.16 A current density of 0.1 mA/cm2 with a voltage window between 2.0 to 4.1 V (for Na and K-birnessite) and between 2.4 to 4.1 V (for Li-birnessite) was applied for the battery-related electrochemical measurements. The results showed that ∼0.6 Li+ equivalents were inserted into potassium birnessite in the first discharge, ∼0.5 Li+ equivalents for sodium birnessite, and ∼0.6 Li+ equivalents for lithium birnessite. However, the lithium birnessite cell showed significant capacity fade after the second cycle. The potassium birnessite cell had the highest initial capacity, and capacity retention was 9% higher than the sodium birnessite cell, and 45% higher than the lithium birnessite cell after 5 cycles, suggesting that the larger radius potassium cation best stabilized the birnessite structure during electrochemical cycling. In 2008, Nakayama et al. reported the electrochemical properties for both of monovalent (Na+, Li+) and divalent (Mg2+) birnessite.9 A current density of 10 μA/cm2 was applied for all types of birnessite cells between 2.0 to 4.2 V. The results showed that both Na and Mg birnessite exhibit higher initial discharge capacity (∼140 mAh/g for both) than Li birnessite (∼77 mAh/g). However, the capacities of Na and Li birnessite decreased significantly after the 2nd cycle, while Mg birnessite exhibited better capacity retention after 8 cycles, ∼55% higher than Li birnessite and ∼32% higher Na birnessite.
The above Mg birnessite electrochemistry suggests that other divalent cations might significantly affect the electrochemistry of birnessites. Further, a divalent cation such as Cu2+ might be electrochemically active under the appropriate battery-related conditions, in addition to contributing to the structural stability of birnessite. For example, copper vanadium oxide materials show quasi-reversible electrochemistry associated with the copper center.17–19 Thus, we identified copper birnessite as an appropriate synthetic target for battery related electrochemistry studies.
Birnessite has been synthesized by several methods such as solid state reaction, calcination,20 hydrothermal,4,2122 sol-gel,23,24 and redox precipitation. Redox precipitation is one of the methods widely applied for mono-dispersed synthesis. Specific prior synthetic approaches included the oxidation of Mn2+ compounds,25–27 the reduction of MnO4− (Mn7+) salt,28 and the redox reaction between Mn2+ and MnO4− (Mn7+) salt.29,30 While each of these methods resulted in formation of pure copper birnessite, control of crystallite size was not reported.
In this study, we introduce a redox precipitation method to control the crystallite size of CuxMnOy·nH2O under room temperature conditions. Our redox method was designed to use temperate conditions in order to avoid the formation of β-MnO2.31,32 Our previous studies have shown that crystallite size can impact the electrochemistry of other battery materials significantly.5,33,34 Thus, we developed a synthetic approach to control crystallite size of the copper birnessite and investigate the impact of crystal size on its electrochemistry. To our knowledge, this is the first study of crystallite size effects of copper birnessite on lithium-based battery electrochemistry studies.
Experimental
Synthesis of Cu-birnessite
A modified redox co-precipitation and ion exchange method was used to prepare the copper birnessite (CuxMnOy·nH2O).27 Briefly, manganese (II) nitrate tetrahydrate [Mn(NO3)2·4H2O)], sodium hydroxide (NaOH) and sodium persulfate (Na2S2O8) were used as starting materials. The isolated solid from the initial reaction, sodium birnessite (NaxMnOy·nH2O) was then added to an aqueous solution of cupric nitrate hemi (pentahydrate), (Cu(NO3)2·2.5H2O), yielding a final product of CuxMnOy·nH2O.
Materials characterization
Material samples were characterized by X-ray powder diffraction (XRD) using a Rigaku SmartLab X-ray powder diffractometer. Cu Kα radiation was used with Bragg-Brentano focusing geometry. Crystallite sizes were calculated by using the Scherrer equation,35 and the full width at half maximum (FWHM) of the (001) peak utilizing Peak Fit software after correcting for instrumental broadening using a lanthanum hexaboride (LaB6) standard.
Thermogravimetric analysis/differential scanning calorimetry (TGA/DSC) with a TA Instruments Q600 model was used to determine the H2O content in the CuxMnOy·nH2O. Thermal Scientific iCAP series inductively coupled plasma optical emission spectroscopy (ICP-OES) was used for the quantitative Cu and Mn determination of CuxMnOy·nH2O. A Quantachrome NOVA BET surface area analyzer was used to measure the surface area of the materials by nitrogen adsorption. Scanning electron microscopy (SEM) images with 15 KV magnification and Energy-dispersive X-ray spectroscopy (EDS) element composition data were collected with a JEOL JSM-6010PLUS model.
Electrochemical testing
Cyclic voltammetry (CV) data was collected using three electrode configuration cells where the reference and counter electrodes were lithium metal. Electrolyte was ethylene carbonate and dimethyl carbonate (50/50, v/v) containing 1.0 M lithium hexafluorophosphate (LiPF6). A scan rate of 0.1 mV/s was used with voltage range of 3.8 to 2.3 V. Two electrode cells were assembled using a lithium anode and the same electrolyte as noted above. Cycling tests were conducted under galvanostatic control using 3.55 × 10⁻² mA/cm2 at a fixed temperature of 30°C with voltage limits of 3.8 and 2.0 V. Electrochemical impedance spectroscopy (EIS) was collected over a frequency range of 100 kHz to 10 mHz. All of the electrochemical data for lithium based systems was collected in the presence of lithium metal. It is anticipated that any water in the electrolyte resulting from the Cu-birnessite would react with the lithium. In the magnesium electrolyte test, the Cu-birnessite sample was used as working electrode, where the counter electrode was carbon, and silver/silver nitrate was used as the reference electrode. Magnesium(II) bis-(trifluoromethane sulfonyl) imide (Mg(TFSI)2), water, and dipropylene glycol dimethyl ether were added to acetonitrile solvent to form an electrolyte containing 0.5 M Mg2+, 0.5 M dipropylene glycol dimethyl ether and 3.0 M H2O. A scan rate of 0.1 mV/s was applied to the cells with a voltage window −0.8 to 1.2 V.
Results and Discussion
Synthesis and characterization
Although prior synthesis of copper birnessite has been reported, an XRD reference pattern for copper birnessite was not available. Therefore, a structurally similar Na birnessite material was used as a reference. The Na birnessite precursor (NaxMnOy.nH2O) was consistent with prior reports of sodium birnessite materials (JCPDS card #01-073-9669). The XRD pattern for the CuxMnOy·nH2O product was similar to that of the Na birnessite precursor (NaxMnOy.nH2O) with pronounced (001) and (002) peaks, Figure 2.10 The strongest intensity (001) peak at ∼12.4° 2-theta indicates the distance between two MnO6 octahedral layers in the c direction. Interestingly, there was a slight shift in the (001) peak position with copper content where the samples with 0.2, 0.23, 0.24, 0.25, 0.27, 0.28 copper content showed the d-spacing values of 7.186, 7.174, 7.163, 7.157, 7.151, and 7.145 Å, respectively. The values are consistent with prior literature reports of ion exchanged Cu-birnessite.36

Figure 2. Powder XRD of (a) CuxMnOy·nH2O and (b) NaxMnOy·nH2O and Na-birnessite reference (JCPDS # 01-73-9669).
A series of six CuxMnOy·H2O samples was prepared by varying the concentration of the Mn2+ precursor in the synthesis. The six CuxMnOy·nH2O samples showed an evolution in the appearance of the XRD pattern with increasing line broadening with increasing copper (x) content, Figure 3A. The crystallite size of the CuxMnOy·nH2O product was determined from the FWHM of peak at (001) degrees 2-theta, Figure 3B.
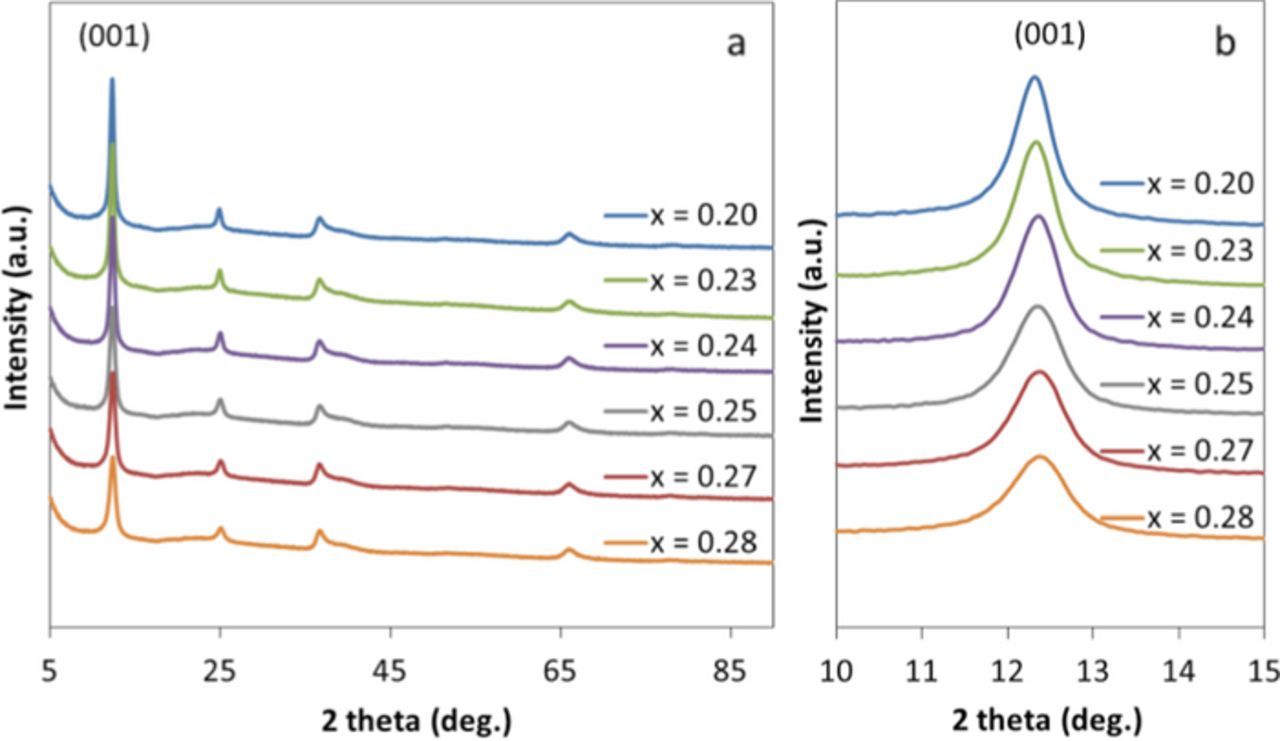
Figure 3. (a) Powder XRD of CuxMnOy·nH2O (from top to bottom) with varying copper (x) content and (b) (001) peak for each individual sample.
The copper to manganese ratio was determined for each individual sample by using ICP-OES and energy dispersive X-ray spectroscopy (EDS). It was found that the copper content (x) in CuxMnOy·nH2O ranged from 0.20 to 0.28, Table I, where the crystallite size was inversely proportional to the copper content, Figure 4A. The crystallite size data shown are averages based on a minimum of five samples prepared at each concentration. When compared to previous reports on divalent cations like copper birnessite (max. = 0.26)37 and magnesium birnessite (max. = 0.17)9 our metal/manganese ratio data (max. = 0.28) were higher. The hydration levels of each CuxMnOy·nH2O sample were calculated using the data obtained from the TGA measurements. The H2O content (n) in the samples varied from 1.0 to 1.1 H2O per formula unit and did not relate to the crystallite size of the material. A prior report discusses the transformation of Na-Birnessite to H-birnessite where H3O+ replaced some of the Na+ ions in the layered structure.38 The preparation of the H-Birnessite required acidic conditions in order for the transformation to occur. Based on the reaction conditions used, it is expected that the water present is H2O rather than H3O+. The oxidation state of copper has been recently affirmed at Cu2+ using EXAFS for samples of δ-MnO2 that were exposed to dissolved copper salts.37 Thus, for the analysis here, a copper oxidation state of Cu2+ was utilized. Based on the ICP-OES and TGA results, the empirical formulas of the copper birnessite samples were assigned, Table I.
Table I. Composition of CuxMnOy·nH2O from varying [Mn2+] concentration synthesis.
| CuxMnOy·nH2O | |||||
|---|---|---|---|---|---|
| xICP | xEDS | Mn | y | n | Crystallite size (nm) |
| 0.20 | 0.22 | 1.0 | 2.0 | 1.11 | 12.0 |
| 0.23 | 0.23 | 1.0 | 2.0 | 1.12 | 12.5 |
| 0.24 | 0.26 | 1.0 | 2.0 | 1.15 | 13.4 |
| 0.25 | 0.27 | 1.0 | 2.0 | 1.11 | 15.6 |
| 0.27 | 0.27 | 1.0 | 2.0 | 1.07 | 17.5 |
| 0.28 | 0.29 | 1.0 | 2.0 | 1.03 | 19.0 |
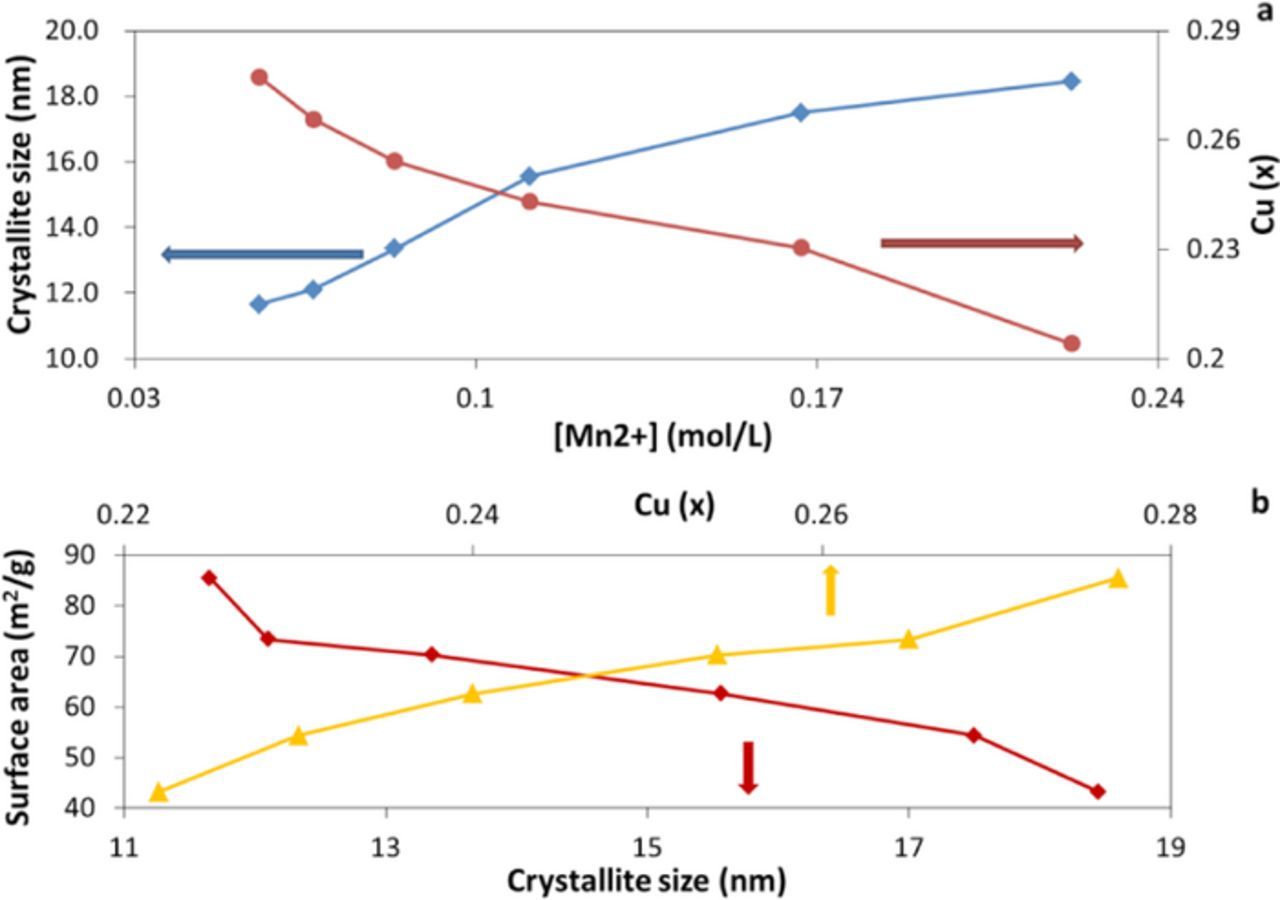
Figure 4. (a) Crystallite size and copper of CuxMnOy·nH2O as a function of manganese concentration in precursor. (b) Surface areas of CuxMnOy.nH2O as a function of crystallite size and copper content.
Physical properties of the samples were also examined. The surface areas of the CuxMnOy·nH2O samples were measured by BET, Figure 4B and showed that the surface area increased with decreasing crystallite size and with increasing copper content of CuxMnOy·nH2O. SEM results showed that the nanocrystalline copper birnessite particles aggregated into 7∼10 μm in diameter. However, there was no significant change in morphology or particle size as a function of copper content. Images of samples of Cu0.22MnO2.13·1.1H2O (∼19 nm crystallite size) and Cu0.28MnO2.17·1.0H2O (∼12 nm crystallite size) are shown as representative examples, Figure 5.
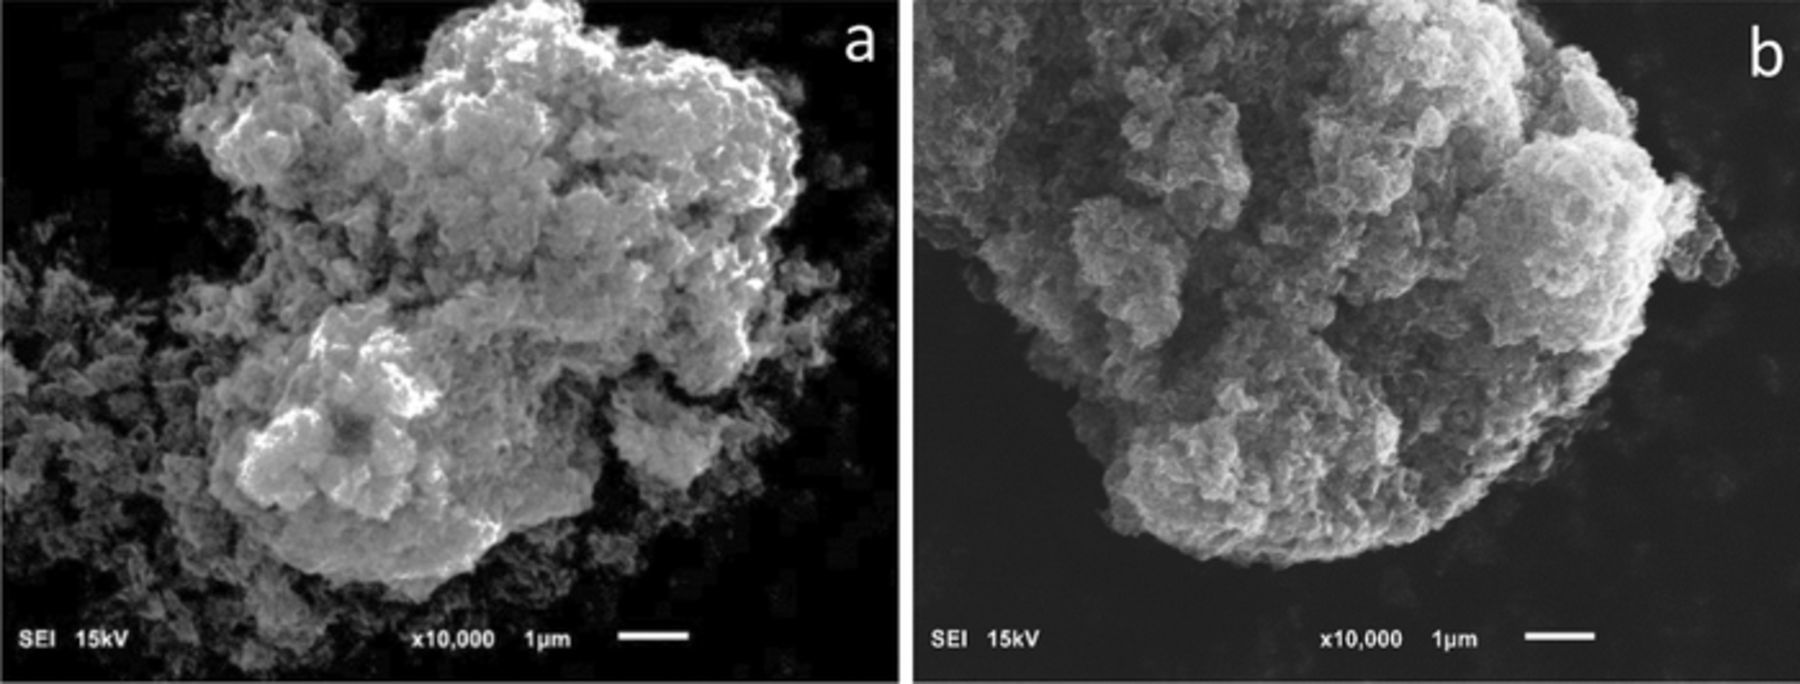
Figure 5. SEM images of (a) Cu0.22MnO2.13·1.1H2O (∼19 nm crystallite size) and (b) Cu0.28MnO2.17·1.0H2O (∼12 nm crystallite size).
Electrochemical Testing
Lithium based electrochemical evaluation
Cyclic voltammetry was evaluated using a three electrode configuration. A representative voltammogram for Cu0.27MnO2.2·1.1H2O, with 13 nm crystallite size shows quasi reversible behavior with a cathodic peak located at ∼2.80 V and an irreversible broad cathodic peak at ∼3.28 V, an anodic peak at ∼3.04 V with ΔEp of 0.24 V in the first cycle, Figure 6A. The peak currents of the cathodic and anodic peaks for the second and the third cycle were similar to each other, but showed lower peak current and did not show the broad peak at 3.28 V. The voltammetric behavior is reminiscent of previous reports for Na-birnessite and Mg-birnessite.9,16
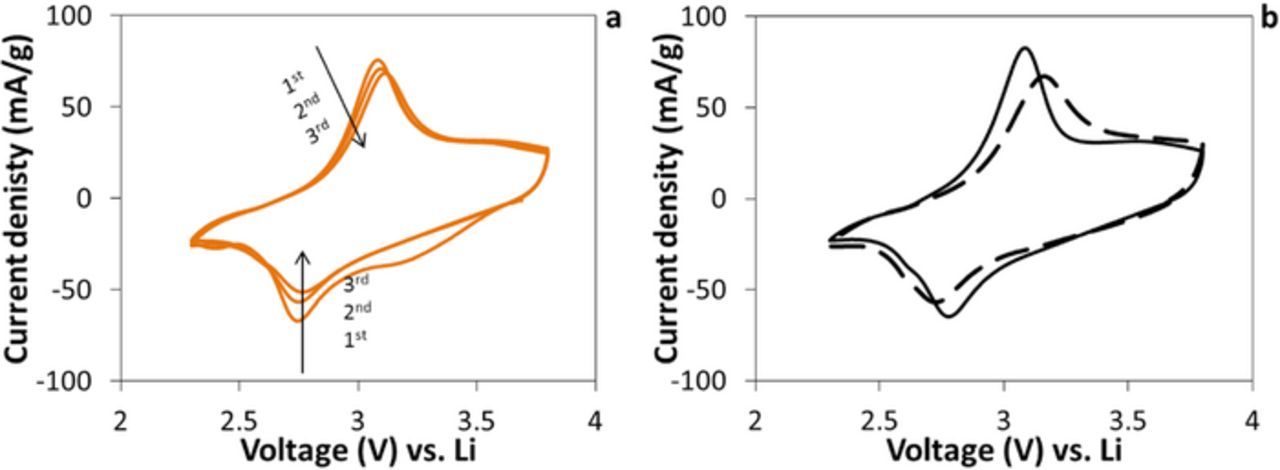
Figure 6. (a) Cyclic voltammetry of Cu0.27MnO2.2·1.1H2O versus lithium with 13.1 nm crystallite size. Working: Cu0.27MnO2.2·1.1H2O, reference: lithium foil, and auxiliary: lithium foil; (b) Two different crystallite size, Cu0.27MnO2.2·1.1H2O with 13.1 nm crystallite size (solid line), and Cu0.20MnO2.1·1.1H2O with 19 nm crystallite size (dashed line).
The voltammograms of copper birnessite samples with crystallite sizes of 12 and 19 nm are shown in Figure 6B. The sample with the 12 nm crystallite size showed more closely spaced cathodic and anodic peak voltages with ΔEp = 0.27 V compared to the sample with the 19 nm crystallite size where the ΔEp value was 0.43 V indicating improved electrochemical reversibility. Moreover, the peak current adjusted for mass was higher for the 12 nm crystallite size material, −66 mA/g for the cathodic and 75 mA/g for the anodic peak, compared to the 19 nm crystallite size material with peak currents of −60 mA/g and 64 mA/g for the cathodic and the anodic peaks, respectively.
Two electrode coin type cells were used for galvanostatic discharge-charge testing for a total of 30 discharge/charge cycles, under a C/10 rate. The discharge profiles for the cells show a sloping discharge profile, Figure 7A, where the samples with 19, 15 and 12 nm crystallite size, show discharge capacities of ∼160, ∼170 and ∼194 mAh/g, respectively. The capacity for the discharge process is equivalent to ∼0.7, ∼0.8 and ∼0.85 electron equivalents per manganese center. The specific energy for discharge shows ∼465, ∼488, and ∼559 mWh/g. The capacity retention percentage was slightly improved for the small (12 nm) crystallite size sample compared to the larger (19 nm) crystallite size sample, as well as the specific energy retention percentage, Figure 7B. The degradation of capacity as a result of cycling has been previously rationalized for birnessite-type LixMnO2 and is attributed to manganese migration from the MnO2 layers to the interlayer region.39 Thus, the CuxMnOy·nH2O samples reported here provided improved capacity retention as well as higher first cycle discharge capacity (∼194 mAh/g) compared to previously reported birnessite materials.
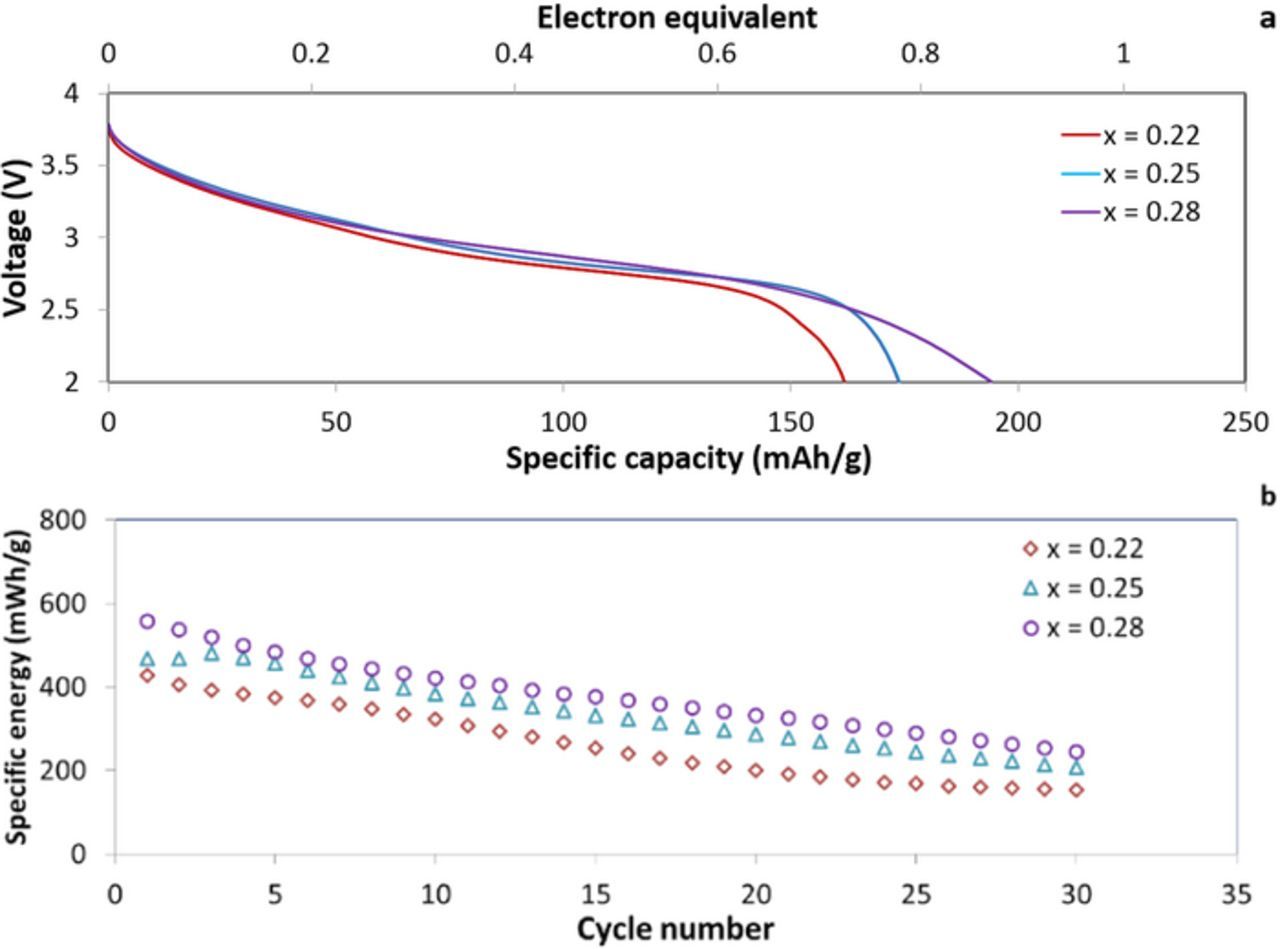
Figure 7. Galvanostatic discharge test for (a) voltage profile of Li/ CuxMnOy.nH2O and (b) first 30 cycles specific energy of coin cells with x = 0.22, 0.25 and 0.28, and with crystallite size of 19, 15 and 12 nm, respectively.
The CuxMnOy·nH2O materials with 12 nm and 19 nm crystallite size and Cu content x = 0.28 and x = 0.22, respectively, were used as cathodes in coin type cells. The electrochemical impedance spectroscopy (EIS) was recorded for the cells at open circuit voltage and when fully discharged, Figure 8. The EIS results for both cell types were comprised of a semicircle in the high frequency range and a line with a slope in the low frequency range. The cells with the 12 nm crystallite size Cu0.28MnO2.16·1.0H2O material show similar impedance to the cells with the 19 nm crystallite size Cu0.22MnO2.12·1.1H2O material before discharge, Figure 8. However, after the cells are discharged to 2.0 V, the impedance of the 12 nm smaller crystallite size cell is significantly less than that of the larger 19 nm crystallite size Cu0.22MnO2.12·1.1H2O containing cell. These results are consistent with the higher delivered capacity observed during the galvanostatic cycling testing for the smaller crystallite size material.
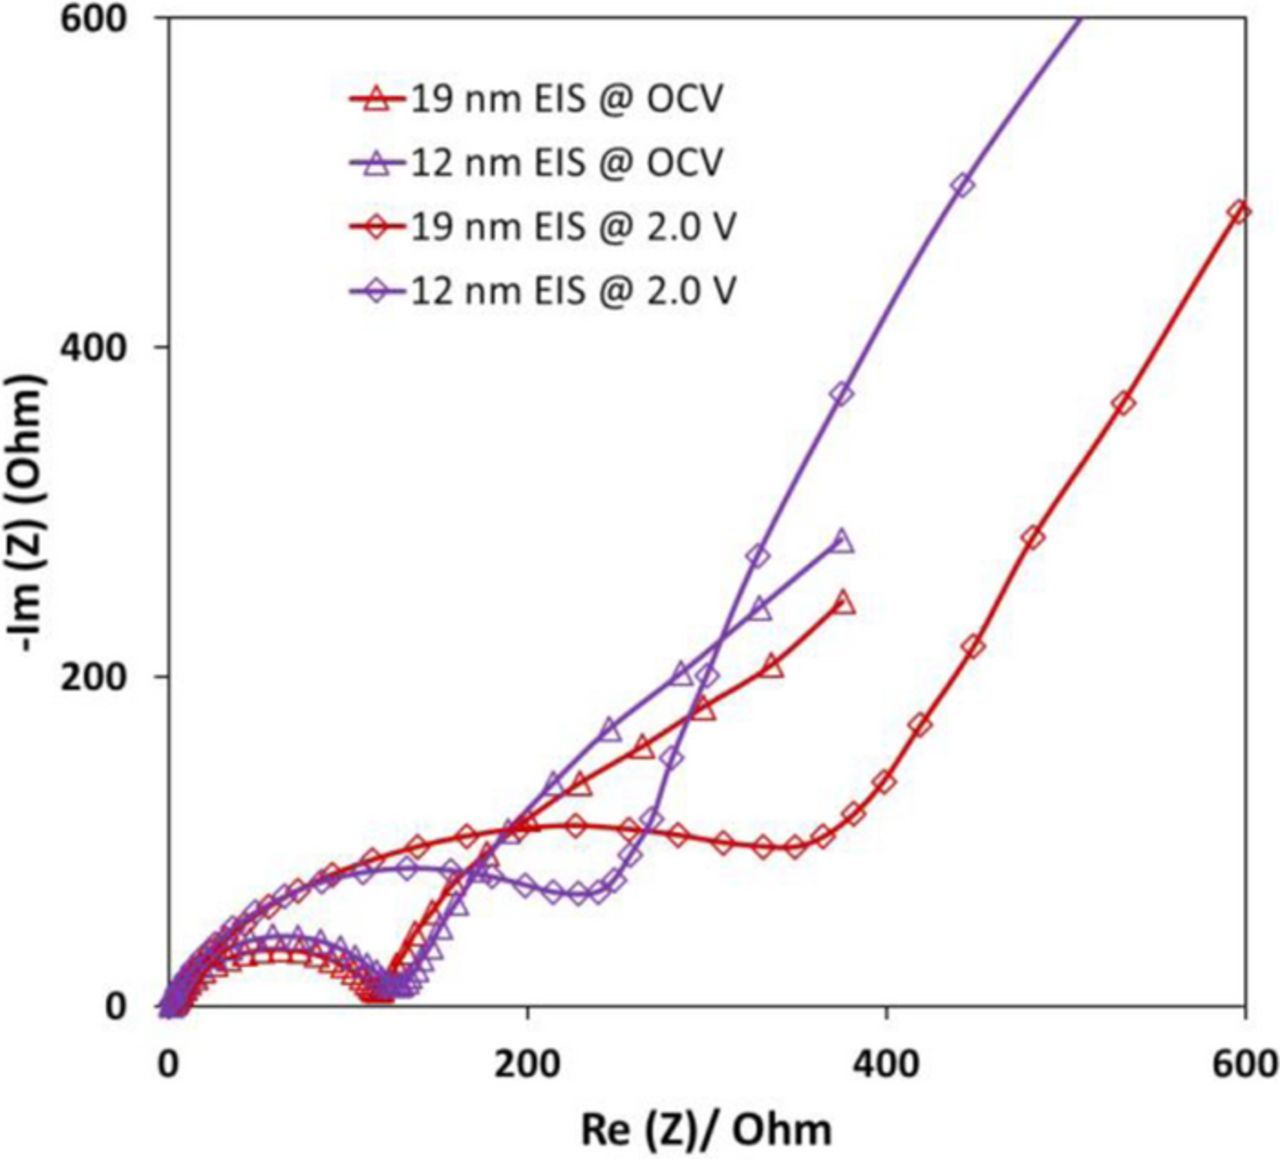
Figure 8. Electrochemical impedance spectroscopy of CuxMnOy·nH2O with copper content x = 0.28, and x = 0.22 with 12 nm and 19 nm crystallite sizes, respectively.
Magnesium based electrochemical evaluation
Due to large earth abundance of magnesium, relative safety, and the high volumetric capacity (3833 mAh/cm3 for Mg vs. 2046 mAh/cm3 for Li), magnesium ion batteries have been considered to be a promising source to replace with lithium ion batteries.40,41 Limited studies on 2-D layered birnessites also have been reported for the Mg ion battery, motivated by the facile ion-exchange properties of birnessites42 and the opportunity for the interlayer water to effectively facilitate the electrostatic interactions between Mg2+ and the host anions.43
A cyclic voltammetry test was used to investigate the magnesium based electrochemical performance. Briefly, Cu0.28MnO2.16·1.0H2O sample was used as cathode in Mg(TFSI)2 (Mg2+) electrolyte with a Ag/Ag+ reference electrode. Figure 9 shows the first and second CV cycles of Cu0.28MnO2.16·1.0H2O with 0.1 mV/s scan rate. In the first cycle, a cathodic and anodic peak was observed at −0.12 V and 0.53 V, respectively. The second cycle showed similar peak potentials, but with reduced peak current. These results suggest that Cu birnessite material is electrochemically active in a magnesium based electrolyte, indicating Cu birnessite may be a worthy candidate for additional investigation in future Mg ion battery applications.
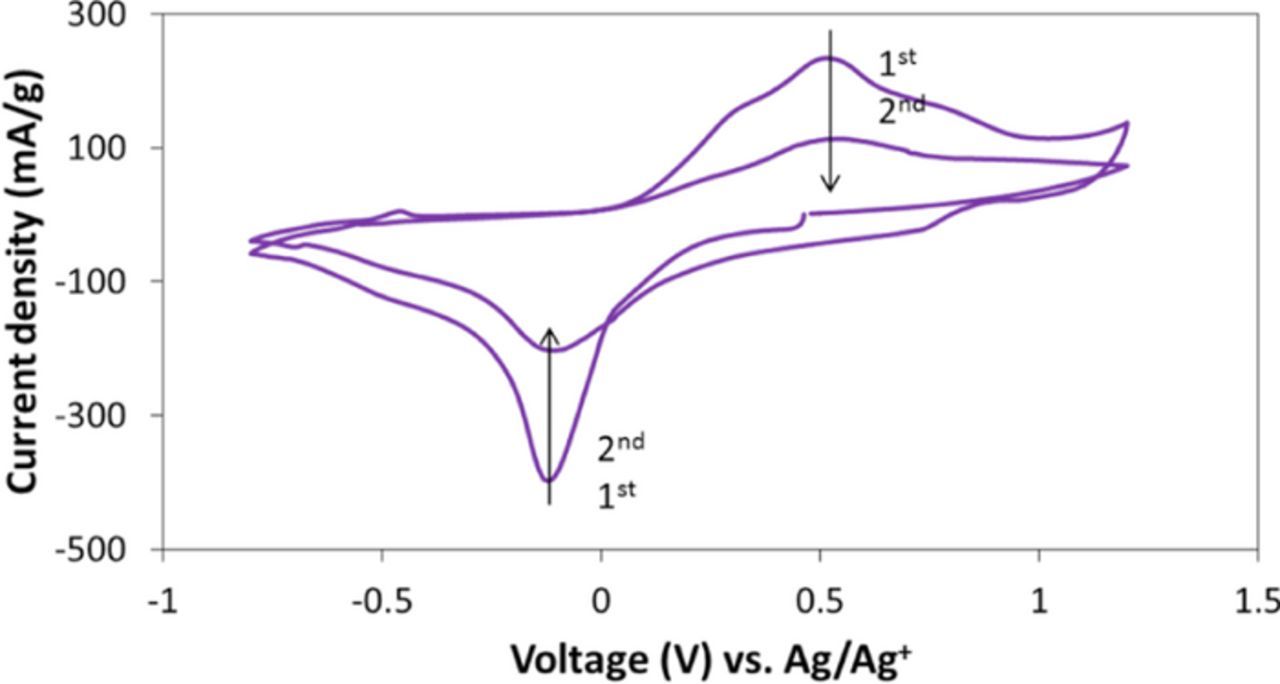
Figure 9. Cyclic voltammetry test of Cu0.28MnO2.16·1.0H2O sample in 0.5 M Mg(TFSI)2 with 0.1 mV/s scan rate.
Conclusions
In this study, we have presented a synthetic method to prepare a series of CuxMnOy·nH2O copper manganese oxides via variation of the concentration of the manganese(II) precursor. The method is a facile water based reaction condition without any high temperature treatment. The results showed that crystallite size, surface area and copper (x) content of CuxMnOy·nH2O could be deliberately varied. The copper content (x) in CuxMnOy·nH2O, 0.28 ≥ x ≥ 0.20, was inversely proportional to crystallite size which ranged from 12 to 19 nm. Electrochemical evaluation in lithium based electrolyte showed that the higher copper content (x = 0.28) and small crystallite size (12 nm) sample delivered ∼194 mAh/g, about 20% higher capacity than the low copper content (x = 0.22) and larger crystallite size (19 nm). These capacities compare favorably with previous reports for birnessite based cathode materials. Preliminary evaluation in magnesium based electrolyte showed the Cu birnessite material to be active with quasi-reversible electrochemistry, indicating Cu birnessite may be a worthy potential candidate for additional investigation in future Mg-ion battery application. In summary, this report has provided the first electrochemical evaluation of copper birnessite as a cathode material, while demonstrating the appropriate design of synthetic parameters to enable the preparation of CuxMnOy·nH2O with tunable material properties resulting in a ∼20% increase in delivered electrochemical capacity.
Acknowledgment
The authors acknowledge support for the materials synthesis, characterization, and lithium based electrochemical evaluation by the Department of Energy, Office of Basic Energy Sciences, under grant DE-SC0008512. Support for the magnesium based electrochemical evaluation was provided by supported by the Department of Energy, Office of Electricity, administered through Sandia National Laboratories, Purchase Order #1275961. The authors also acknowledge Brookhaven National Laboratory for the SmartLab X-ray Diffractometer.