
Abstract
The oxygen diffusion coefficient (D) and surface exchange coefficient (k) of a typical SOFC cathode material, La0.6Sr0.4Co0.2Fe0.8O3-δ (LSCF) were characterized by both electrical conductivity relaxation (ECR) and oxygen isotope exchange (IE) methods. Conductivity relaxation experiments were conducted at 800°C for small step changes in partial pressure of oxygen ( ), both decreasing and increasing, from 0.02 atm to 0.20 atm. The results revealed
  dependent hysteresis with the reduction process requiring more equilibration time than oxidation. Analysis of the experimental data indicated that the surface exchange coefficient is a function of the final oxygen partial pressure in an isothermal system. In addition, both forward and backward oxygen reduction reaction constants, which are vital for the fundamental understanding of SOFC cathode reaction mechanisms, are investigated based on the relationship between surface exchange coefficient and
  . The direct comparisons between the results from both ECR and IE were presented and the possible experimental errors in both methods were discussed.
Export citation and abstract BibTeX RIS
A solid oxide fuel cell (SOFC) converts chemical energy to electrical energy by leveraging an oxygen chemical potential gradient that is developed across a dense oxygen conducting membrane. The oxygen reduction process is considered as the main rate limiting factor to the performance of the SOFC system,1 and numerous models describing SOFC cathode reactions can be found in the literature.2–7 Determination of oxygen transport kinetic parameters such as surface exchange coefficient (k) and oxygen diffusivity (D) is critical for proper modeling of SOFC cathode reaction and transport processes. Isotope exchange8–12 (IE) and electrical conductivity relaxation (ECR) are two popular experimental methods for oxygen reduction kinetic parameter measurement, each possessing intrinsic advantages and disadvantages. ECR is considered convenient and economical compared to the isotope exchange method owing to simplified experiments and reduced operating costs.13 However, the accuracy of predictions generated from ECR data is not unambiguous. Alternatively, the mass spectrometry offers superior accuracy but it is expensive, and the obtained parameters need to be transformed to chemical diffusion and surface exchange coefficient with thermodynamic factors to apply in cathode modeling. It should be pointed out that there are wide discrepancies on the data reported in the literature, even for the same materials. Some of the discrepancies are from the difference on preparing the samples by different groups, thus resulting different materials, although the nominal composition may be the same. Another important source of discrepancies is the experimental errors from both ECR and IE. Most of the researchers choose either ECR or IE in their investigations, and it is rarely to find the direct comparison on the results from both ECR and IE for the same batch of samples.14
During ECR test, the conductivity of a material sample relaxes following a perturbation that alters its oxygen stoichiometry. Such instantaneous perturbations are most effectively rendered by changing the oxygen partial pressure of the gas surrounding the sample. The transport of oxygen associated with this perturbation can be measured by monitoring the electrical conductivity as a function of time. The total oxygen transport is described by the global transport parameters of oxygen chemical surface exchange coefficient (k) and chemical diffusion coefficient (D), which can be obtained by fitting the solution of Fick's second law. The ratio of D to k has been defined as characteristic thickness (lc) and qualitatively describes the relative control of transport, either by bulk diffusion or surface exchange. When normalized by membrane thickness d, the non-dimensional result indicates the primary source of transport resistance.
![Equation ([1])](https://content.cld.iop.org/journals/1945-7111/160/4/F343/revision1/jes_160_4_F343eqn1.jpg)
Generally, if 0.1 < L < 10, the oxygen transport process should be considered as a mixed control process.15 Attention has already been drawn to the importance of the characteristic thickness in early works.16,17 However, since lc is a ratio of kinetic parameters, primary values of D and k also should be considered.
Although the ECR technique has been widely utilized and investigated,18–21 there is a lack of knowledge on several critical issues.
(1) ECR data fitting process:
Most reports simply mention that a non-linear least square method was applied to obtain the fitted results. The most detailed report for determining initial values in the data fitting process was generated by Song15 et al. In that report, D and k values were separately determined by assuming the relaxation process was totally controlled by oxygen bulk diffusion or oxygen surface exchange. However, based on our previous study,22 a global minimum of the error may not be obtained, depending on the initial guesses of D and k used in the fitting process.
(2) The correspondence between fitted kinetic parameters and absolute  conditions:
As an important testing condition, the magnitude of oxygen partial pressure changes was ignored. However, for real SOFC operation condition, oxygen partial pressure at cathode/electrolyte interface can vary in a wide range according to cathode over-potential. We assume that the cathode over-potential satisfies Nernst equation:23
![Equation ([2])](https://content.cld.iop.org/journals/1945-7111/160/4/F343/revision1/jes_160_4_F343eqn2.jpg)
where η is the cathode over-potential, PsO2 and PIO2 are the oxygen partial pressure for cathode surface and cathode/electrolyte interface. When using air at the cathode side, PIO2 is 2.64 × 10⁻³ atm when the over-potential is 0.1 V. While under open circuit condition PIO2 will be close to 0.21 atm. Therefore, study on the effects of oxygen partial pressure changes on ECR measurement to obtain accurate kinetic parameter under certain  is valuable for understanding reaction mechanisms of SOFC cathode.
(3) Application of ECR testing results on cathode model's simulation
ECR results are generally utilized for comparing oxygen transport properties among different SOFC cathode materials. There are very few examples of ECR testing results being applied to SOFC cathode models. Furthermore, the typically reported k value derived from ECR experiments is the overall surface exchange coefficient, while modeling typically requires the specific rate constants of both forward and backward reactions.
In order to address the aforementioned criticisms, the major objectives of this research are: (1) to measure k and D of LSCF cathode by both ECR and isotope exchange methods and directly compare results from both measurements for the same batch of materials; (2) to utilize the improved ECR method22 to characterize the effect of oxygen partial pressure on kinetic parameters of LSCF cathode; and (3) to provide the results to SOFC cathode models of the oxygen reduction reaction (ORR).24
Experimental
Sample preparation
The experimental samples were made with commercial La0.6Sr0.4Co0.2Fe0.8O3-δ powder (NexTech Materials, Ltd.). Using a 19 mm(diameter) die, the powders were axially pressed at 80MPa and sintered at 1350°C in air for 2h, resulting in a plane disk of diameter of 15.4 mm. LSCF pellets were then polished on both sides using silicon carbide polishing papers and polycrystalline diamond suspension up to 1 μm (PACE Technologies, Tucson, Arizona, USA). Polished LSCF samples thicknesses are 1.5 mm and 2.7 mm. All sintered samples were confirmed as in excess of 97% theoretical density using Archimedes method (AD-1653 specific gravity measuring kit, A&D Company). Surface morphology and composition of the sample were detected by scanning electron microscope (JSM-840A, JEOL Ltd.) and X-ray diffraction (X'Pert PRO, PANalytical).
Conductivity Relaxation
Figure 1 depicts the process schematic. Electrical conductivity relaxation experiments were performed on LSCF samples over the oxygen partial pressure range 0.02 atm to 0.20 atm at 800°C. Step changes were introduced by a low volume four-way valve that permitted rapid switching of pre-mixed gas streams. The total gas flow rate was maintained at a rate of 400sccm and volume of the tube inside the furnace is 84cm3. Assuming continuously ideally stirred tank reactor behavior in the actual reactor volume, the initial conductivity relaxation time (t0) was fixed as four times of the flush time when over 98vol.% of the original reactor gas has been replaced.20 The oxygen partial pressure was monitored with an electrochemical oxygen Analyzer (Model 810 Oxygen Analyzer, Illinois Instrument Inc., response time <10s). Control of gas flow rates and centralized data acquisition were accomplished using National Instruments hardware and LabVIEW software.
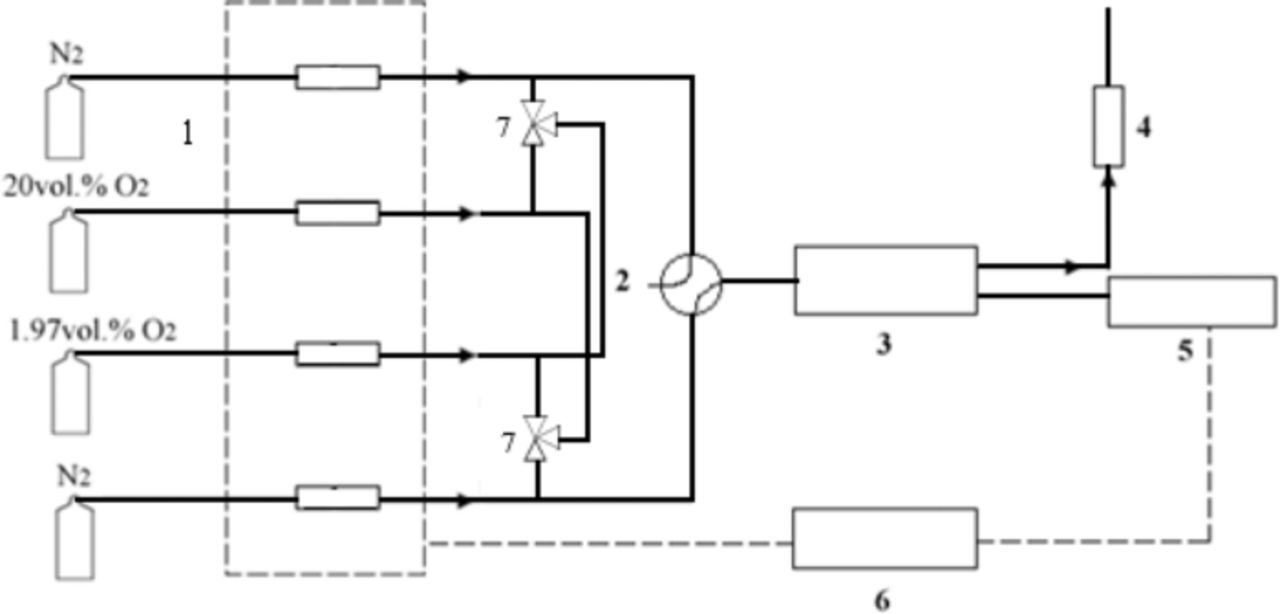
Figure 1. Schematic representation of the conductivity relaxation set-up 1. Mass flow controller 2. Four-way valve 3. Furnace 4. Oxygen analyzer 5. Nano-voltemeter and current source meter 6. Computer 7. Three way valve.
The van der Pauw method was utilized for measuring the conductivity of the LSCF sample. The four electrodes are connected to the edges of the sample as shown in Figure 2. When forcing current along one edge of the sample (I12 or I23), the sample resistance can be calculated by measuring the potential difference across the opposite edge (V34 or V41). The actual sheet resistance is related to these resistances by the van der Pauw formula:
![Equation ([3])](https://content.cld.iop.org/journals/1945-7111/160/4/F343/revision1/jes_160_4_F343eqn3.jpg)
Considering that the sample in this study is a homogeneous and symmetrical plane sheet, R12,34 = R23,41 = R. Therefore, the sheet resistance is given by:
![Equation ([4])](https://content.cld.iop.org/journals/1945-7111/160/4/F343/revision1/jes_160_4_F343eqn4.jpg)
Moreover, the conductivity of the sample σ (S/cm) can be deduced from Rs as below:
![Equation ([5])](https://content.cld.iop.org/journals/1945-7111/160/4/F343/revision1/jes_160_4_F343eqn5.jpg)
where ρ is the resistivity of the sample and d is the thickness.
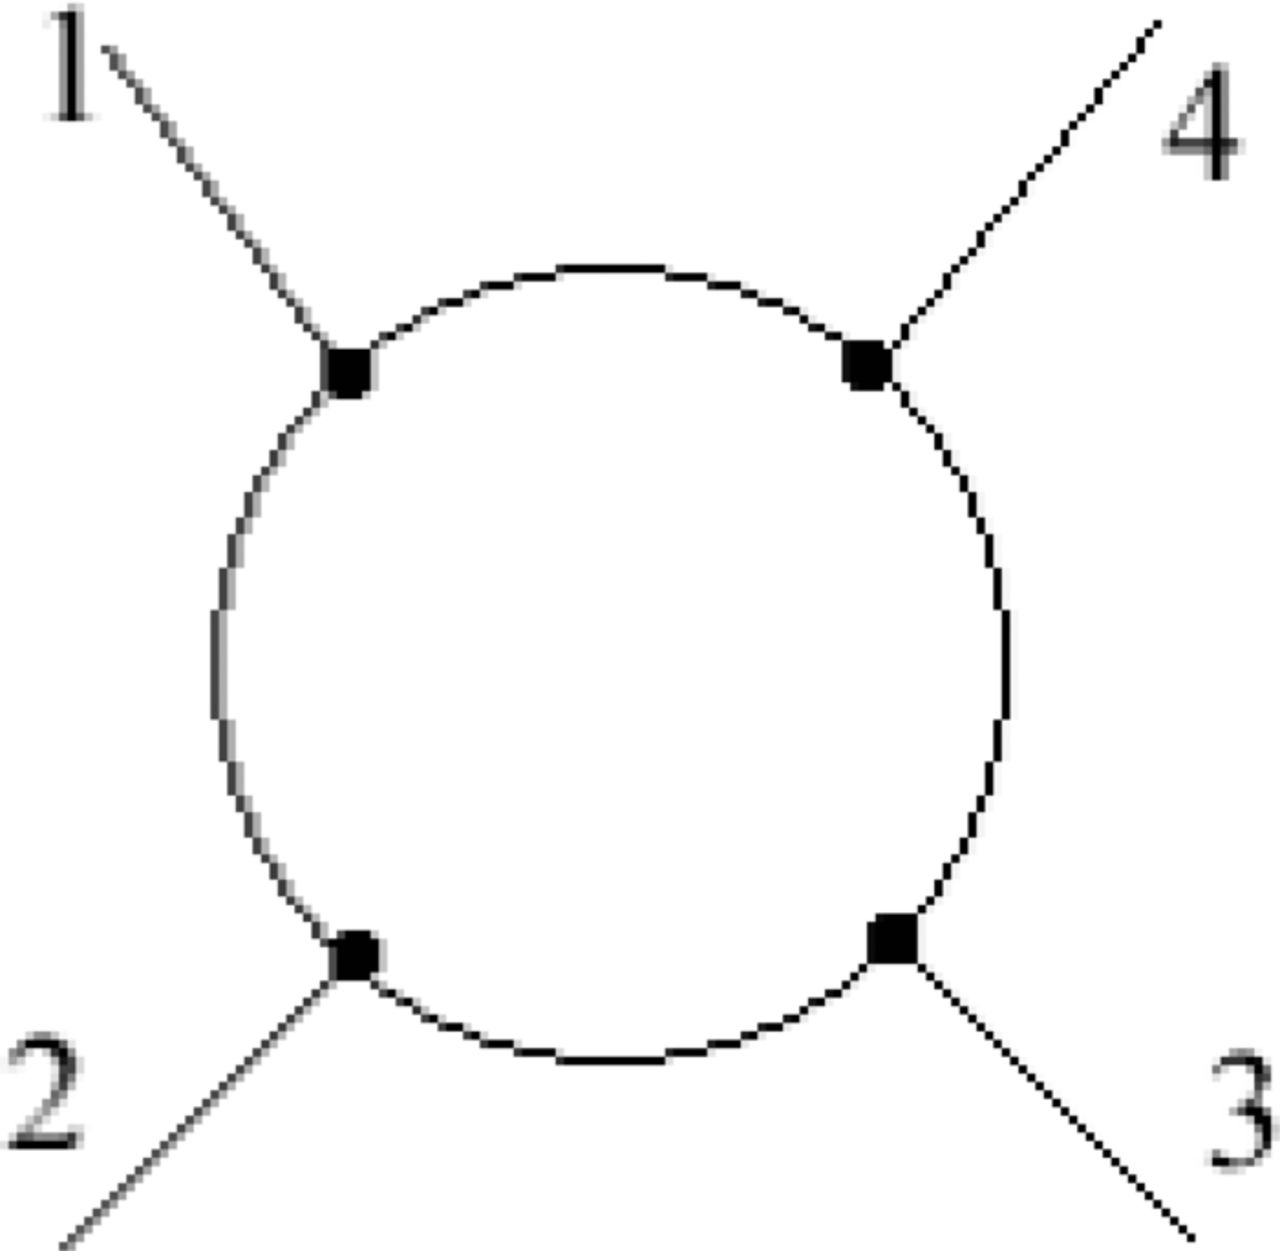
Figure 2. Sample contact placement.
Analysis of relaxation profile
The theoretical basis of the electrical conductivity relaxation measurement for mixed ionic and electronic conductors is the correlation between the conductivity (σ) [S/cm] and the corresponding nonstoichiometry (δ).
![Equation ([6])](https://content.cld.iop.org/journals/1945-7111/160/4/F343/revision1/jes_160_4_F343eqn6.jpg)
δ(0), δ(∞) and δ(t) represent nonstoichiometry for initial, final and temporally dependent states, respectively. σ(0), σ(∞) and σ(t) are the conductivities corresponding to δ(0), δ(∞) and δ(t), respectively.
Since the degree of oxygen nonstoichiometry is reflective of the bulk oxygen concentration, proportional relationships between oxygen concentration and conductivity can be established:
![Equation ([7])](https://content.cld.iop.org/journals/1945-7111/160/4/F343/revision1/jes_160_4_F343eqn7.jpg)
where C(0), C(∞) and C(t) are bulk oxygen concentrations [mol/cm3] corresponding to σ(0), σ(∞) and σ(t), respectively. Solid phase oxygen concentration equilibrium will be restored when the surface exchange is equal to the diffusion flux as represented by Equation 8:
![Equation ([8])](https://content.cld.iop.org/journals/1945-7111/160/4/F343/revision1/jes_160_4_F343eqn8.jpg)
Based on this boundary condition and Fick's second law, the solution for one-dimensional diffusion is:25
![Equation ([9])](https://content.cld.iop.org/journals/1945-7111/160/4/F343/revision1/jes_160_4_F343eqn9.jpg)
Here, a [cm] is the half thickness of the tested pellet sample. L [-] is a unit less parameter derived from the characteristic thickness lc [cm]. bn (n = 1 ∼ 30 in this work) is a parameter generated from the solution of Fick's second law. Their relation can be expressed as Equation 10.
![Equation ([10])](https://content.cld.iop.org/journals/1945-7111/160/4/F343/revision1/jes_160_4_F343eqn10.jpg)
A nonlinear-least-squares fitting method is used to determine the values of chemical diffusion coefficient D and surface exchange rate k. For each oxygen partial pressure change condition, two relaxation data sets are collected by testing different thickness LSCF samples. A weight average error function was applied to adjust the parameters of the diffusion function to best fit the data sets. The detailed data analysis process was reported in our previous work.22
Isotope exchange characterization
To compare the results obtained from ECR testing, the isotope exchange method was also utilized to characterize the oxygen transport parameters of LSCF. By utilizing SIMS (secondary ion mass spectroscopy), we can obtain oxygen self diffusivity (D*) and exchange coefficient (k*), which are convertible to oxygen chemical diffusion and surface exchange coefficients using the corresponding thermodynamic factor.
A polished LSCF sample was exposed to 16O2 ( = 0.1 bar) for more than 1 h, and then the atmosphere was suddenly switched to 18O2. The duration time for 18O2 exposure was 600s at 973 K at
  = 0.1 bar. After 16O/18O exchange, the sample was quenched to room temperature in 30s. SIMS analysis was conducted with a sector-type instrument (CAMECA ims-5f). A primary Cs+ beam sputtered the sample surface and the negative secondary ion intensities were recorded as a function of the depth. The acceleration voltage was 10 kV and the primary beam current was 10-50 nA.26 Data analysis process for isotope exchange method was presented in Reference 27.
Results
LSCF sample characterization
Figure 3 shows the typical SEM image and surface chemical composition of LSCF sample prepared for electrical conductivity relaxation testing. Fine grain can be clearly seen from the morphology yet the grain size distribution is not even. Average grain size is around 3 μm. Considering the testing accuracy, surface chemical composition results obtained from EDS indicate that the element stoichiometry compares favorably with the theoretical stoichiometry of La0.6Sr0.4Co0.2Fe0.8O3-δ. The XRD pattern of the sintered LSCF pellet is confirmed to match the as-received commercial powder, indicating phase stability during sintering.
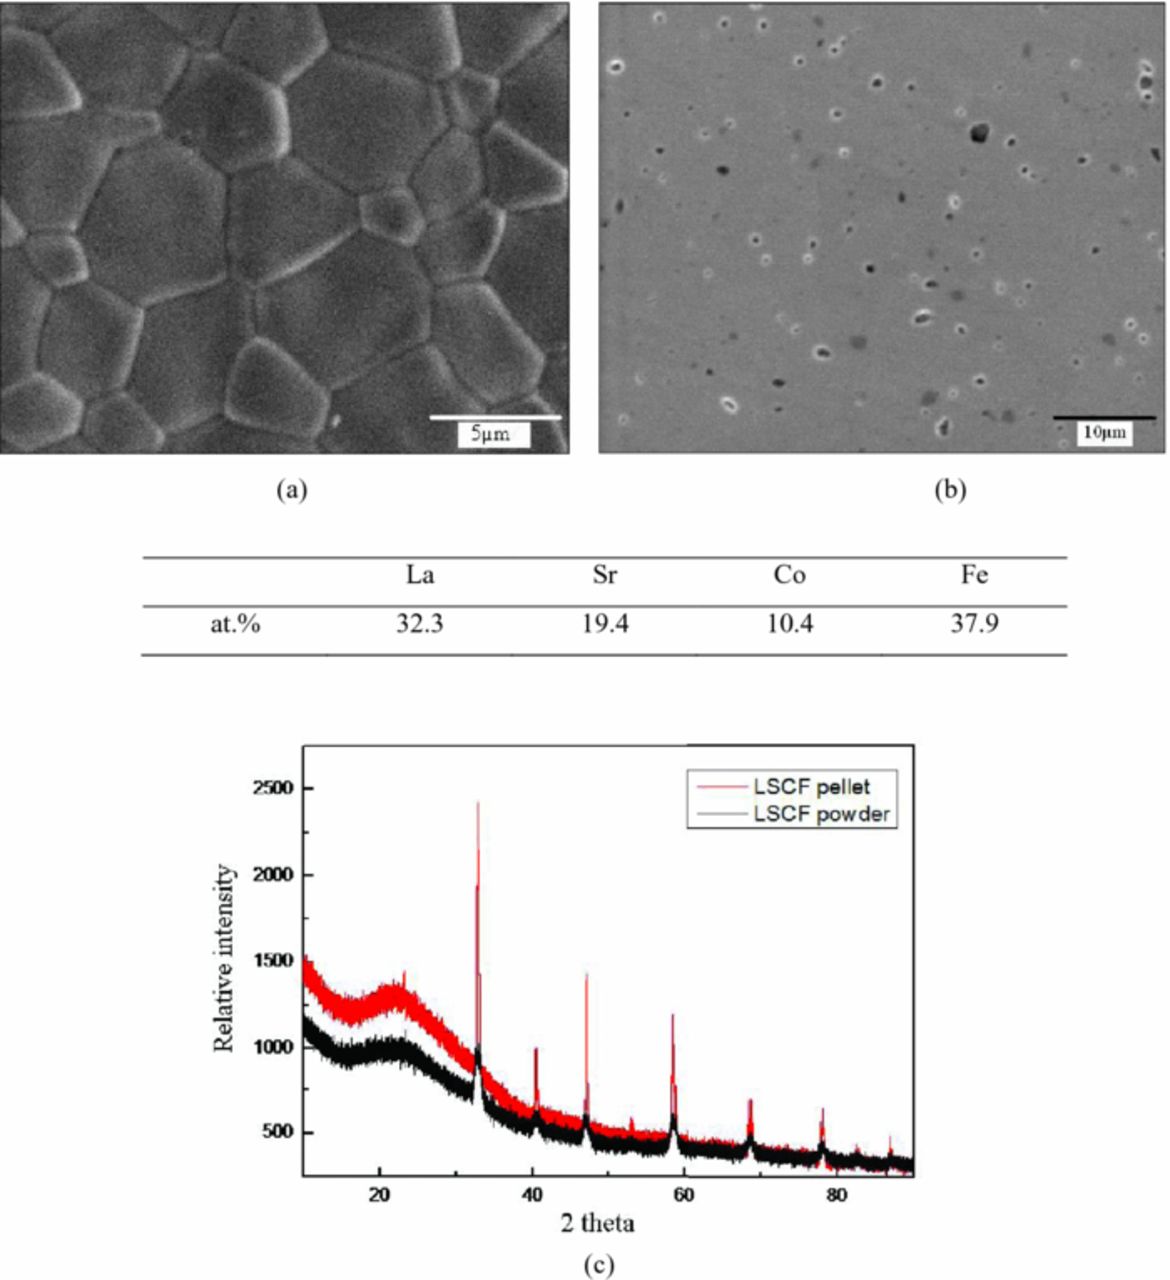
Figure 3. Surface morphology and surface chemical composition of sintered LSCF sample: (a) Before polishing (b) After polishing; (c) XRD pattern for LSCF pellet and powder.
Electrical conductivity relaxation
To examine relaxation behavior through a range of absolute oxygen partial pressures, ECR measurements were performed at discrete oxygen partial pressure levels of 0.20, 0.15, 0.10, 0.05 and 0.02 atm. Oxygen partial pressure was switched between the high and low values at every level and the logarithm of the applied step change in  (Δlog
(Δlog ) is less than 0.1 for all conditions..
Figure 4 depicts typical relaxation curves. By comparing the two profiles, it is clear that longer equilibration times are required when oxygen partial pressure was changed from a high value to a low value. The same phenomenon has been reported for LSCF before.28 It indicated that the initial and final atmosphere conditions affect oxygen transport process directly regardless of the oxygen partial pressure step change. Further analysis will be offered in the following discussion section.
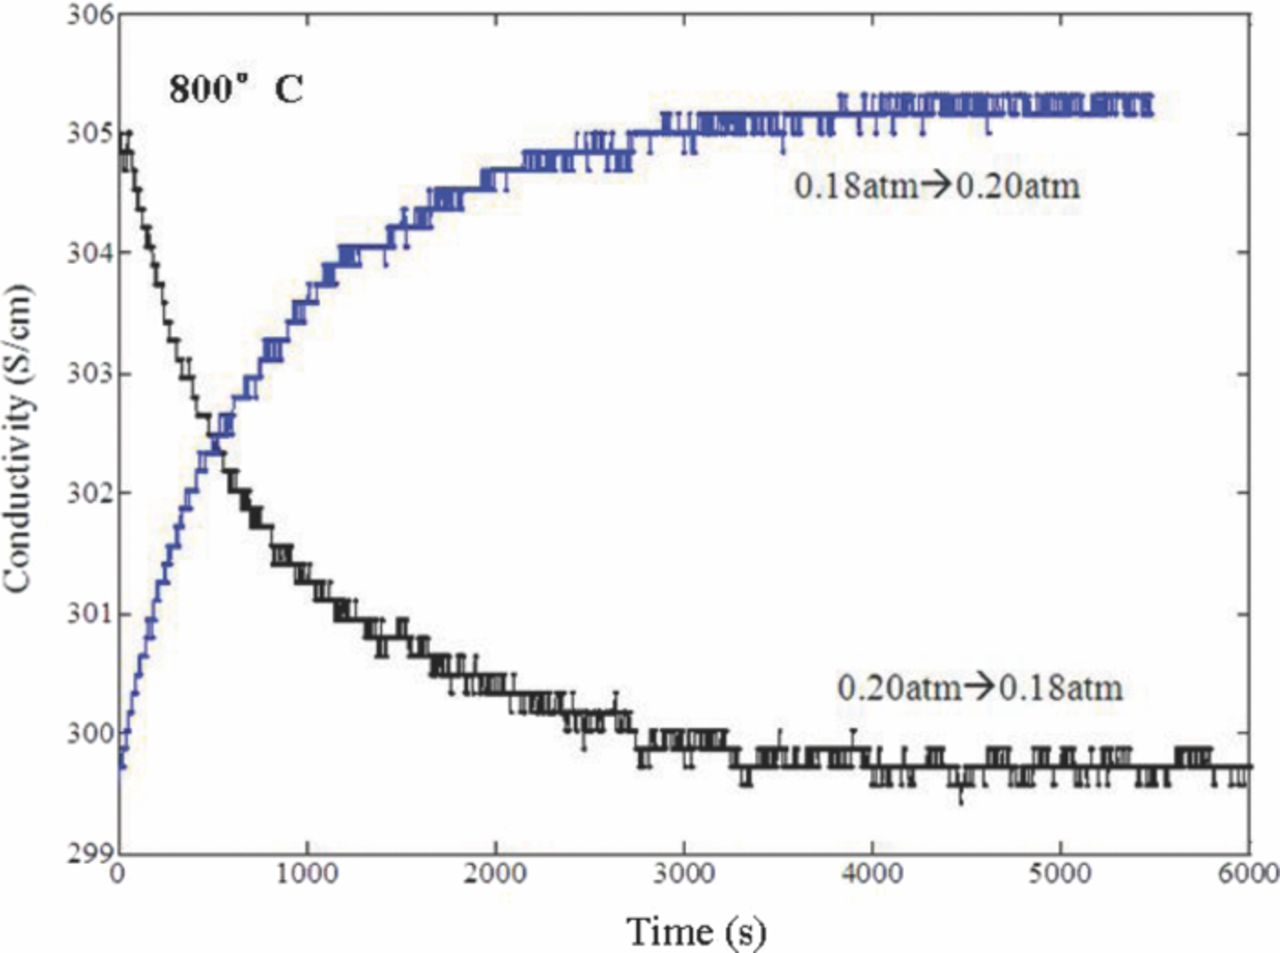
Figure 4. Relaxation curve of LSCF at  = 0.20 atm, 800°C.
Figure 5 presents the results for simultaneously fitting two relaxation profiles at the chosen (D, k) plane. Weighted average error function is applied to optimize the fitting parameters. As shown in Equation 11, F1 and F2 are the fitting error vectors which stand for the discrepancy between the experimental data and fitted values. T1 and T2 represent the data length.  is the weight average error function. And f is the quantified value by using norm command.
![Equation ([11])](https://content.cld.iop.org/journals/1945-7111/160/4/F343/revision1/jes_160_4_F343eqn11.jpg)
Utilizing the weighted average error function, data length effects on the fitted results are weakened. If only considering the sum of the squared residuals, the best fit will depend more on the longer length data set than the shorter one. Besides, since the diffusion model was specifically used to describe the relaxation process, applying proper data length can avoid system fitting error. In our study, oxygen concentration is assumed reaching the new equilibrium status when the normalized conductivity gets to 0.99. And the total data length was fixed as 105% to 110% of the time needs to get new equilibrium. Detailed data processing method and noisy signal effects study can be found in our previous paper.22
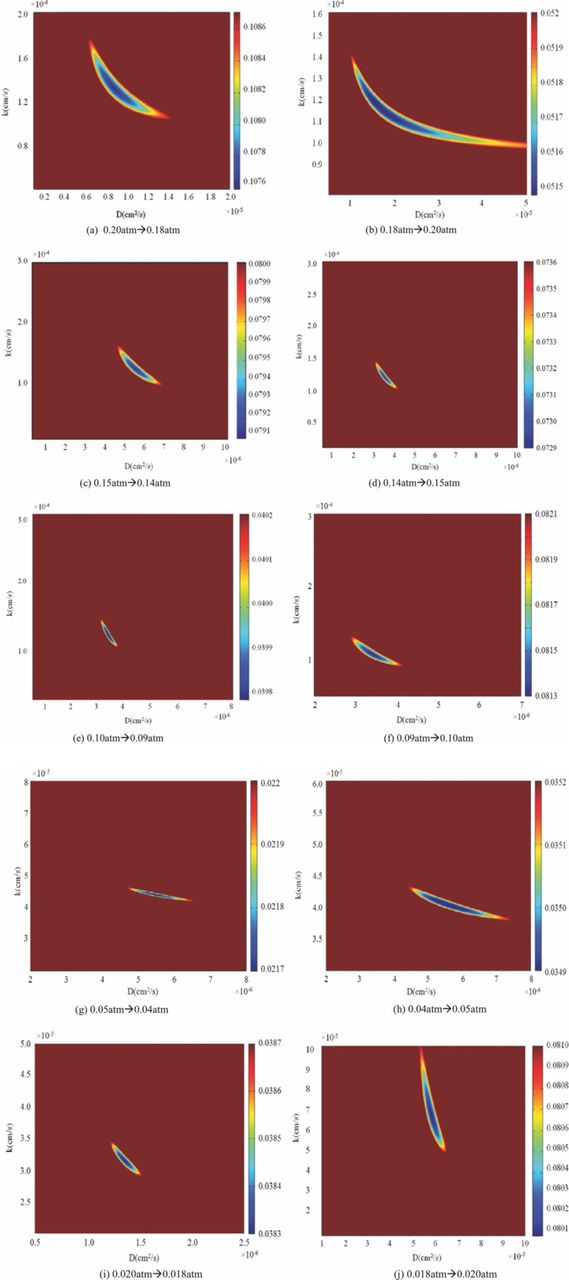
Figure 5. Fitting error color maps for LSCF under different oxygen partial pressure.
In Figure 5, to compare fitted parameters within standard fitting criteria, f values are revealed by the color bars within 101% of its minimum value. According to the fitting results, the relaxation processes are in the mixed control region. Both of the oxygen surface exchange and bulk diffusion coefficients will decrease with the oxygen partial pressure decreasing. The fitted results are found at same magnitude as literature results.13
Isotope exchange measurement results
Oxygen self-surface exchange (k*) and bulk diffusion coefficients (D*) fitted from isotope depth profile were shown in Figure 6. The results showed that both of the measured parameter values increase with temperature. Two measurements were carried out at 800°C and one was conducted at 600°C. Due to the difference showed between the results, isotope exchange method was considered accurate at the magnitude level.
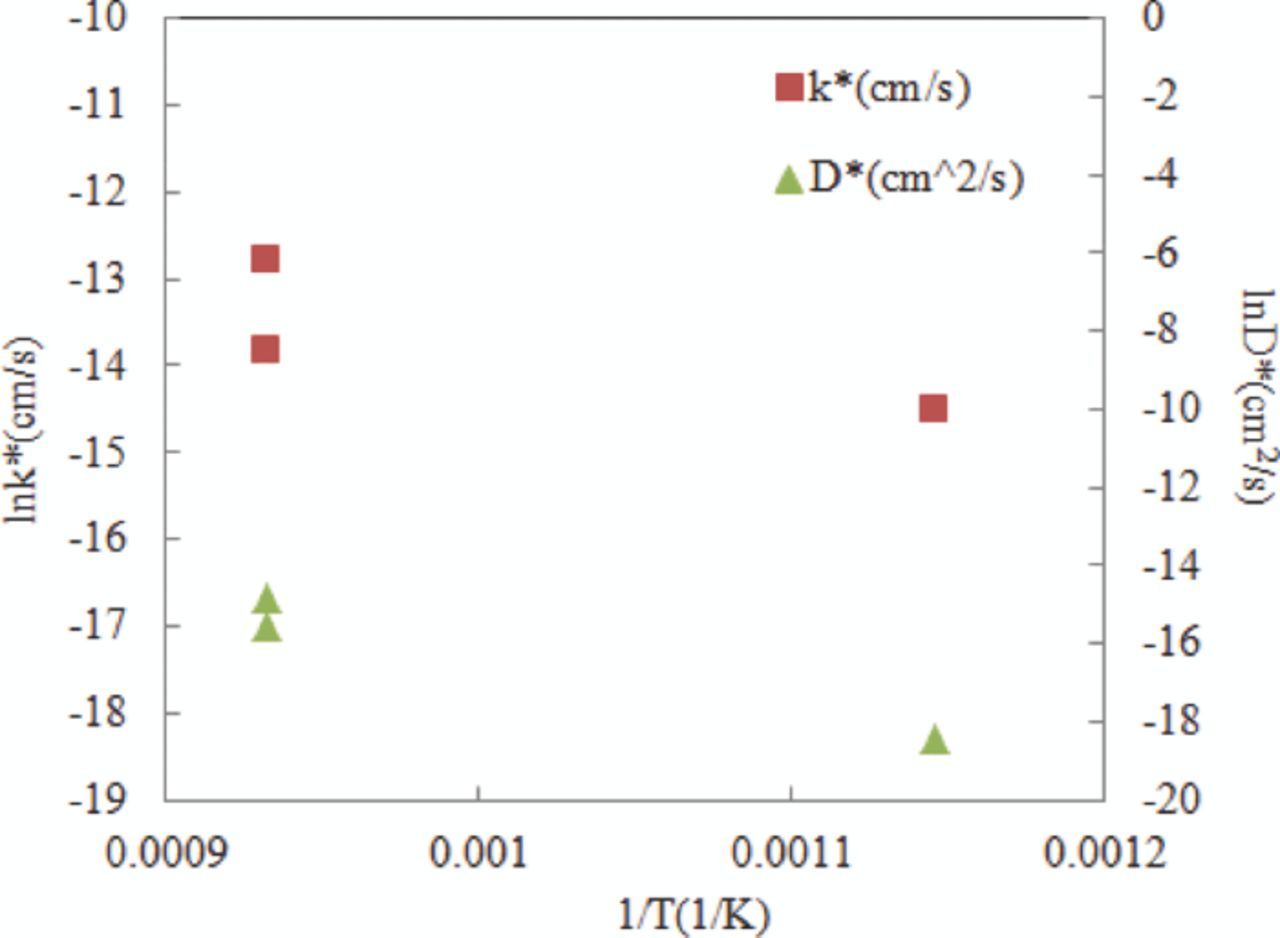
Figure 6. Self surface exchange and bulk diffusion coefficient of La0.6Sr0.4Co0.2Fe0.8O3-δ under different temperature  = 0.1 bar.
Discussion
Surface exchange coefficient (k)
To further study the relationship between k and  , the following analysis was performed.
The overall oxygen reduction can be represented as in Equation 12:
![Equation ([12])](https://content.cld.iop.org/journals/1945-7111/160/4/F343/revision1/jes_160_4_F343eqn12.jpg)
k1 and k2 are forward and reverse reaction rate constants. [V..o] and C(∞) stand for oxygen vacancy and lattice oxygen ion concentration, respectively. Plausible mechanisms for oxygen reduction process and possible intermediates had been reported.3–6,24 Due to LSCF's high intrinsic ionic conductivity, charged intermediates are not considered and the adsorption process is assumed to obtain equilibrium immediately. Therefore, if the charge transfer step is considered as the rate limited step, Equation 12 could be used to analyze the oxygen reduction dynamics. On the other hand, under ECR testing condition, oxygen reduction can be treated as a pure chemical process since oxygen partial pressure change is the only driving force for the transport process. As we illustrated before, within a small oxygen partial pressure change, the oxygen vacancy concentration can be treated as a constant.31 Hence, the surface exchange process should be responding to dependent upon the final oxygen partial pressure only. And this conclusion is also verified by the following deduction analysis.
When equilibrium has been achieved, the forward reaction rate should equal the reverse rate:
![Equation ([13])](https://content.cld.iop.org/journals/1945-7111/160/4/F343/revision1/jes_160_4_F343eqn13.jpg)
where  is the equilibrium state oxygen partial pressure and n is the electronic concentration. Additionally, for non-equilibrium conditions, the net surface exchange rate should equal to the difference between the forward and reverse reaction rate, given by:
![Equation ([14])](https://content.cld.iop.org/journals/1945-7111/160/4/F343/revision1/jes_160_4_F343eqn14.jpg)
[V..o]' and Cs represent oxygen vacancy and oxygen ion concentration at non-equilibrium conditions. From Equation 14, it seems that the surface exchange coefficient k depends on the equilibrium  , oxygen vacancy and oxygen ion concentration. However, due to electro-neutrality and site conservation, Equation 15 can be derived:
![Equation ([15])](https://content.cld.iop.org/journals/1945-7111/160/4/F343/revision1/jes_160_4_F343eqn15.jpg)
The mathematical expression of k can be transformed as given below in Equation 16 utilizing the relationship shown in Equation 15:
![Equation ([16])](https://content.cld.iop.org/journals/1945-7111/160/4/F343/revision1/jes_160_4_F343eqn16.jpg)
Because k1 and k2 are apparent rate constants at a given temperature and the electronic concentration not vary much in the experimental condition (LSCF is a p-type conductor under experimental condition used in this study29), it can be deduced that the oxygen surface exchange coefficient mainly depends on final  . Furthermore, it indicates that k is a function of
  . Oxygen partial pressure effects on surface exchange coefficient of LSCF had been studied experimentally before13,14,30 and the exponents reported are close to 0.5.
The fitted surface exchange coefficients according to  and literature reported results were plotted in Figure 7. The measured results are at the same magnitude with the literature reported data. Using these fitted k values, oxygen reduction reaction constants of La0.6Sr0.4Co0.2Fe0.8O3-δ at 800°C can be obtained by fitting Equation 16, as the solid line indicates in Figure 7. The results revealed k1n2 = 0.0003cm/atm1/2·s and k2 = 2 × 10⁻⁷cm/s. The most important application for the reaction rate constants is to estimate the net oxygen ionic flow rate and further to estimate exchange current for the SOFC cathode. Besides, the activation energy can be calculated using the deduced reaction rate constants under different temperature. By comparing the activation energies for the forward and backward reactions, we can conclude which reaction occurs more readily at a given temperature.
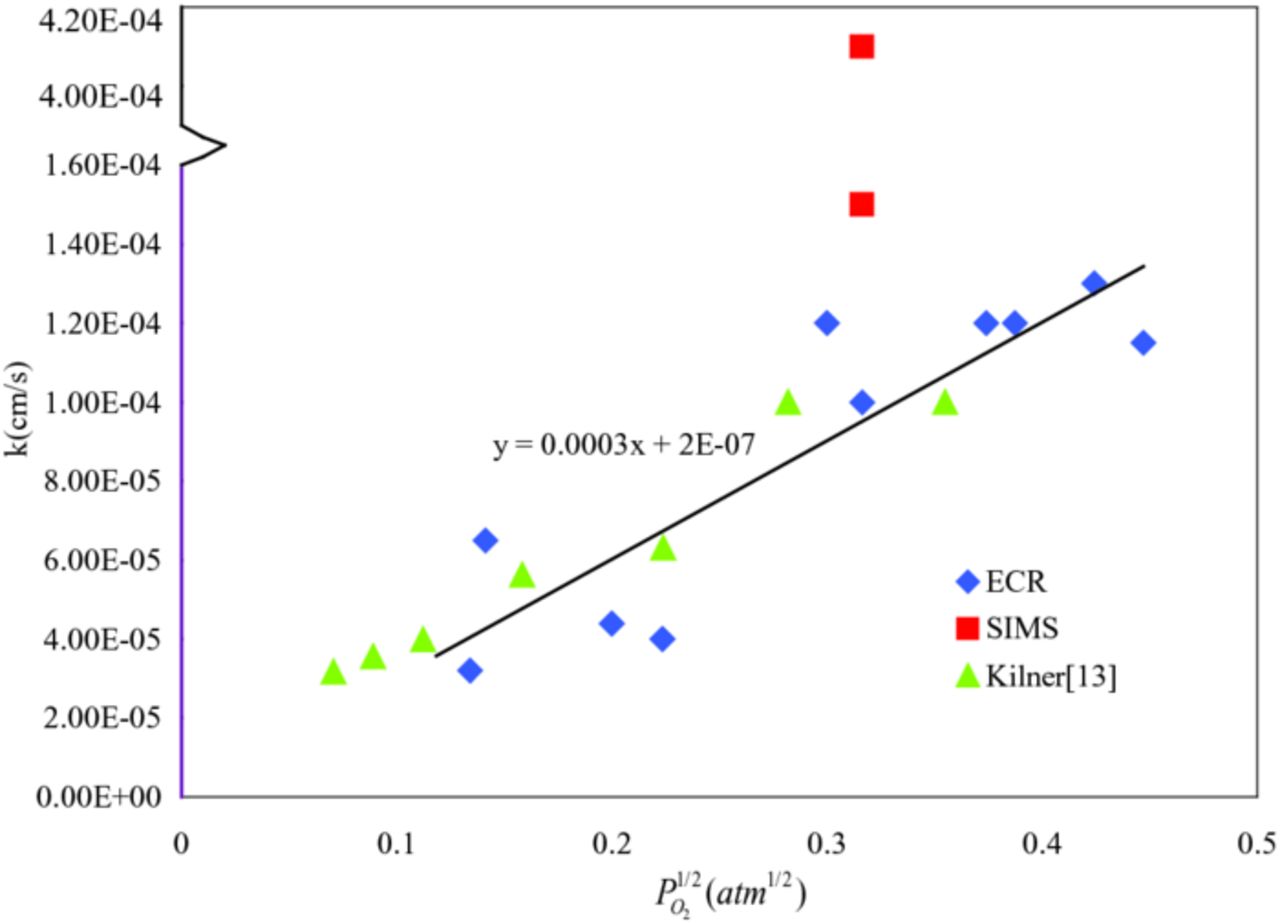
Figure 7. Oxygen surface exchange coefficient for La0.6Sr0.4Co0.2Fe0.8O3-δ at 800°C as a function of oxygen partial pressure obtained from conductivity relaxation and isotope exchange methods.
Bulk diffusion coefficient (D)
The oxygen bulk diffusion coefficient (D) for La0.6Sr0.4Co0.2Fe0.8O3-δ as a function of oxygen partial pressure and literature reported data are shown in Figure 8. The increasing slope of observed bulk diffusion coefficient is smaller than surface exchange coefficient. When oxygen partial pressure is below 0.15 atm, the bulk diffusion coefficient varies in a narrow band and it decreases again until  is lower than 0.02 atm.
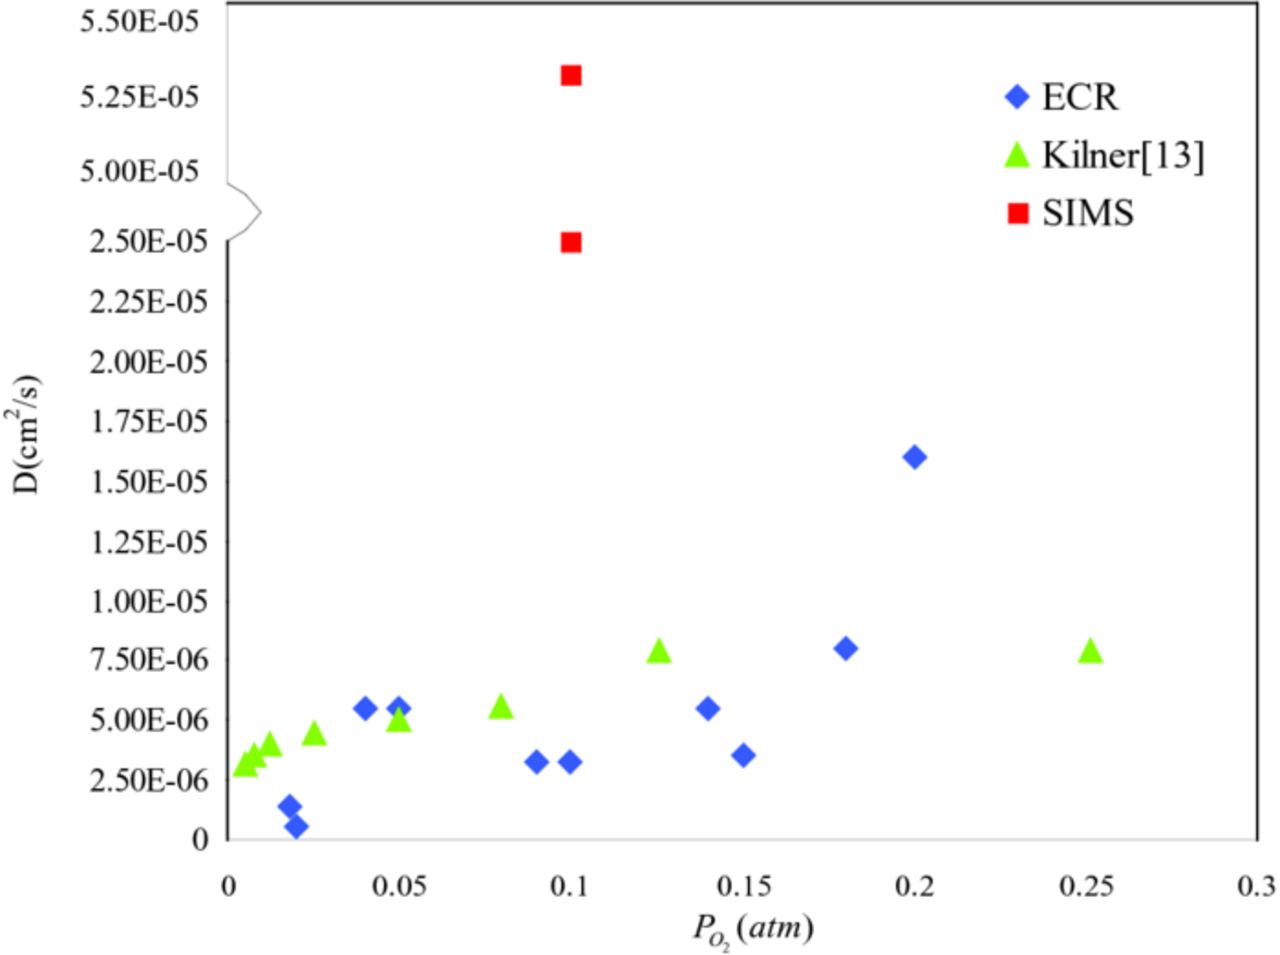
Figure 8. Oxygen bulk diffusion coefficient for La0.6Sr0.4Co0.2Fe0.8O3-δ at 800°C as a function of oxygen partial pressure obtained from conductivity relaxation and isotope exchange methods.
Based on random walk theory, J. A. Kilner31 deduced the relation between oxygen ion self diffusion coefficient and bulk vacancy concentration as below:
![Equation ([17])](https://content.cld.iop.org/journals/1945-7111/160/4/F343/revision1/jes_160_4_F343eqn17.jpg)
Mizusaki32 showed that oxygen vacancy diffusivity (DV) varies little in the perovskite oxides. On the other hand, the oxygen vacancy concentration can be given as an analytical function of δ. Mantzavinos33 and Dalslet34 studied the nonstoichiometry variation under different oxygen partial pressures. Their experimental results revealed that δ was linearly dependant on the value of  with a slope of −0.016 approximately. Therefore, if oxygen vacancies are randomly distributed, oxygen bulk diffusion coefficient should slightly increase with
  decreasing. A possible explanation for the results observed in our study is the oxygen vacancy ordering which depends both on oxygen partial pressure and temperature.35
Direct comparison between ECR and IE results from the same batch of samples
The surface exchange coefficient and bulk diffusivity obtained by IE method are the self–diffusivity and surface exchange coefficient, respectively, while the values obtained by ECR are chemical ones. The relation between self-diffusivity and chemical diffusion coefficient is given by:
![Equation ([18])](https://content.cld.iop.org/journals/1945-7111/160/4/F343/revision1/jes_160_4_F343eqn18.jpg)
Similar for the surface exchange coefficient:
![Equation ([19])](https://content.cld.iop.org/journals/1945-7111/160/4/F343/revision1/jes_160_4_F343eqn19.jpg)
Γ is the thermodynamic factor [-] and can be given by.36
![Equation ([20])](https://content.cld.iop.org/journals/1945-7111/160/4/F343/revision1/jes_160_4_F343eqn20.jpg)
 is the oxygen chemical potential and CO is the oxygen ions concentration. Γ is equal to 148 at 800°C and
  = 0.1 atm.15 Therefore, the isotope testing results can be transferred to chemical diffusivity and surface exchange coefficient and the corresponding values are D = 5.2 × 10⁻⁵cm2/s, k = 1.5 × 10⁻⁴cm/s and D = 2.5 × 10⁻⁵cm2/s, k = 4.1 × 10⁻⁴cm/s. On the other hand, the ECR testing results revealed at 800°C for LSCF D = 5 × 10⁻⁶cm2/s and k = 1 × 10⁻⁴cm/s. The k and D values for various mixed-ionic electronic conductors (MIECs) have been widely reported in the literatures, by either ECR or IE methods, although sometimes the difference among reported results for the same material can be several orders of magnitudes. In this paper, we are trying to study the same batch of sample with both of the two experimental ways and the parameter values obtained by utilizing the two techniques are approximately at the same magnitude. However, from Figure 7 and 8, one group IE results showed large discrepancy compared with the other IE and ECR results. Present data fitting method for isotope method was suspected as the reason and detailed discussion was illustrated below.
In our previous paper, we discussed the possible experimental errors and uncertainty associated with data processing process in ECR method, and developed an improved method to increase the accuracy.22 It was demonstrated in the paper that there are two major possible errors in ECR method: (1) the accuracy of initial values cannot be evaluated in a case where a single control process is assumed, but a mixed control process actually exists; and (2) perhaps more importantly, a global minimum of the error may not be obtained, depending on the initial guesses of D and k used in the fitting process, so if the initial values used are not close enough to the real values, the calculated minimum may only be a local minimum and therefore erroneous. It has been well accepted that typically IE method offers more accuracy original data than ECR. However, Figure 6 indicates results obtained by applying isotope method can be more than 100% difference for the same sample when it was measured twice. Benson37 and Wachsman38 had studied temperature effects on LSCF oxygen transport parameters by isotope exchange method. The results of bulk diffusivity are close and the calculated activation energy is 205 kJ/mol. However, the fitted surface exchange coefficient values showed huge difference. Activation energy based on Benson's results is 180 kJ/mol and based on Wachsman's results is 3 kJ/mol. Although the detail analyzes have not been made by the authors, we believe similar to ECR method, local minimums also existed in IE method when analyzing single set of data and uncertainty can be introduced besides the unavoidable experimental errors. Therefore, even both results are conducted by the same batch of samples, large discrepancy was found between one group of IE results and ECR results.
Conclusions
Oxygen surface exchange and bulk diffusion coefficients of La0.6Sr0.4Co0.2Fe0.8O3-δ were measured by electrical conductivity relaxation and isotope exchange methods. The results from both methods are in general agreement. The relaxation data profile obtained from ECR testing revealed hysteresis with the reduction process requiring more equilibration time than the oxidation process for the same oxygen partial pressure changing step. And the ECR data imply that k only depends on the final oxygen partial pressure as a function of  . Further, oxygen reduction reaction constants were fitted by the expression of k. These reaction constants can be applied directly into the cathode model for expressing the rate of oxygen reduction occurred on MIEC surface. In addition, considering the effects of oxygen vacancy concentration, fitted result of D was considered according to some value between the initial and final oxygen partial pressures.
Acknowledgment
This technical effort from US was performed in support of the National Energy Technology Laboratory's on-going research in West Virginia University under contract #DE-AC26-04NT41817. The valuable technical assistance and discussion from Mingyang Gong and Greg Collins in WVU are acknowledged. The assistance of Richard Pineault, David Ruehl and Randall Gemmen from NETL in Morgantown, WV are highly appreciated.