Abstract
Using tin oxide (SnO2) and niobium-doped tin oxide (Nb-SnO2) as alternative electrocatalyst support materials can effectively solve the issue of carbon corrosion in polymer electrolyte fuel cell (PEFC) cathodes. Here, we systematically explore the effect of support surface area, Pt loading, and Pt nanoparticle size on the electrochemistry of these carbon-free electrocatalysts. Reducing the Pt loading leads to an increase in electrochemical surface area, but the specific activity decreases as previously observed in conventional carbon based electrocatalysts. Removing residual chlorine impurities by replacing the H2PtCl6 nanoparticle precursor with Pt(acac)2 increases the specific activity. Niobium-doping of the SnO2 support also results in an increase in specific activity, due to the increased electronic conductivity. Consequently, the oxygen reduction reaction activity of optimized Pt-decorated Nb-SnO2 is approaching to that of Pt-decorated carbon black, the current state-of-the-art PEFC electrocatalyst.
Export citation and abstract BibTeX RIS

This is an open access article distributed under the terms of the Creative Commons Attribution Non-Commercial No Derivatives 4.0 License (CC BY-NC-ND, http://creativecommons.org/licenses/by-nc-nd/4.0/), which permits non-commercial reuse, distribution, and reproduction in any medium, provided the original work is not changed in any way and is properly cited. For permission for commercial reuse, please email: oa@electrochem.org.
The polymer electrolyte membrane fuel cell (PEFC) is one of the most promising energy conversion technologies for e.g. residential and automotive applications. Pt nanoparticles supported on carbon black are widely used as electrocatalysts.1–6 However, carbon corrosion is an issue under high cathode potential, resulting in detachment of Pt catalyst particles from the carbon support, and leading to a decrease in electrochemical surface area (ECSA) and oxygen reduction reaction (ORR) activity over time.2–6 Due to this problem with carbon, alternative support materials have been investigated. Considerable efforts have been made to develop and analyze alternative carbon-based support materials, including graphitized carbon black,7–9 carbon nanotubes10–15 and nanofibers,14,15 mesoporous carbon,16,17 and graphene.15,18–20
To fundamentally solve this technological issue and improve electrocatalyst durability, alternative carbon-free electrocatalyst support materials such as tin oxide (SnO2)21–29 and titanium oxide (TiOx)30–34 have also been proposed. It has been shown that SnO2 is a promising alternative platinum support, since it has good electronic conductivity and thermochemical stability under the strongly acidic cathode conditions in a PEFC.28,35–37
Remarkable retention of ESCA in Pt-decorated SnO2 electrocatalysts has been demonstrated compared to Pt-decorated Vulcan carbon black, by severe voltage cycling (up to 60,000 cycles) between 0.9 and 1.3 V versus the reversible hydrogen electrode (VRHE) in electrochemical half-cell durability tests.28 Recently, the high durability has been confirmed in membrane electrode assemblies (MEAs), during more severe voltage cycling between 1.0 and 1.5 VRHE.29 These studies have demonstrated the stability of Pt-decorated SnO2 against the start-stop cycles typical in fuel cell vehicles. However, high ORR activity is also required for PEFC cathode electrocatalyst applications and this has not yet been demonstrated. Relatively low ORR activity has been reported to date compared with state-of-the-art Pt supported on carbon black.28,36 Most of the ORR values have been measured below 0.9 VRHE for oxide-supported electrocatalysts, while the ORR of conventional Pt-decorated carbon black is usually evaluated at 0.9 VRHE.2,9,38 Both higher ORR activity and longer durability should be simultaneously fulfilled for practical PEFC applications.
The aim of this study is to obtain sufficiently high ORR activity with high ECSA in Pt-decorated SnO2-based electrocatalysts by optimizing the preparation protocols. We prepare Pt-decorated SnO2 (Pt/SnO2) and niobium-doped SnO2 (Pt/Nb-SnO2) electrocatalysts, and systematically explore the effect of Pt loading, Pt nanoparticle size, support surface area, and residual Cl− ion contamination on the ECSA and ORR activity, through detailed half-cell activity measurements and microstructural characterization. ORR activity values including specific activity and mass activity are reported at 0.9 VRHE for these oxide-supported carbon-free electrocatalysts. The guiding factors to improve the ORR activity of PEFC electrocatalysts with SnO2-based supports are discussed.
Experimental
SnO2, Nb-SnO2, and carbon black were used as electrocatalyst support materials in this study. SnO2 and Nb-SnO2 were prepared via a precipitation method based on our previous study.28,29 Diluted NH3 solution was added to SnCl2·2H2O ethanol solution at 5°C, followed by filtration and drying in air at 100°C for 15 h. After dry milling, the samples were heat-treated in air at 600°C for 2 h. In the case of Nb-SnO2, SnCl2·2H2O ethanol solution and NbCl5 ethanol solution were mixed before co-precipitation, and the final product was Sn0.98Nb0.02O2. For carbon black, commercially available Vulcan XC-72 was used, obtained from Cabot Corp.
Specific surface area and electrical conductivity of these materials were characterized in this study. Specific surface area was evaluated by multipoint Brunauer-Emmet-Teller (BET) analysis based on the nitrogen sorption measurement (BELSORP-mini II, BEL JAPAN, Inc., Japan). For electrical conductivity (σ), their thin layers (area: 0.5 cm2, thickness: 60 μm) were prepared through the spray printing system (Nordson). Then, their electrical conductivity was determined at 80°C based on the impedance measurements by a four-terminal method (SI 1287, Solartron).
Pt nanoparticles were decorated onto the support materials by two different methods, using two different precursors; chloroplatinic acid (H2PtCl6, Kishida Chemical Co., Ltd, Japan),39 and platinum(II) acetylacetonate (Pt(acac)2, Sigma-Aldrich Co. LLC, USA).40 In the former method, H2PtCl6, NaHSO3, and the support materials were dispersed in distilled water. Then H2O2 and NaOH solution were added drop-wise, maintaining pH = 5.0. The dispersion was filtered and the resulting powder dried in air at 100°C for 24 h, then heat-treated at 100°C (for Pt/SnO2 and Pt/Nb-SnO2), or at 200 °C (for Pt/Vulcan) in 5% H2 gas in N2 for 2 h. In the latter method, Pt(acac)2 dissolved in dichloromethane (Wako Pure Chemical Ind., Ltd., Japan) was added to the support material and stirred in an ultrasonic bath until the solvent was completely evaporated. After dry-milling, the samples were heat-treated in pure N2. Actual Pt loading was experimentally determined by dissolving Pt in aqua regia. Preparation conditions such as temperature, time, and Pt loading for the electrocatalysts prepared using H2PtCl6 and for those using Pt(acac)2 are summarized in Table I and in Table II, respectively. Also, commercially available Pt-decorated carbon black, 46 wt% Pt/C (TEC10E50E, TKK Corp.), was used as a standard catalyst. It was denoted as Pt/C (TKK) in this paper.
Table I. Heat-treatment conditions, ECSA, Pt particle size of electrocatalysts prepared using the H2PtCl6 precursor method. Pt loading is 18 wt% in all cases.
| Catalysts | Heat-treatment conditions | ECSA [m2g−1] | Pt particle size [nm] | ||
|---|---|---|---|---|---|
| Pt/SnO2 | 100°C | 19.8 ± 1.7 | 4.4 ± 1.3 | ||
| Pt/Nb-SnO2 | 5% H2 in N2 | 100°C | 2h | 21.4 ± 4.1 | N.A. |
| Pt/Vulcan | 200°C | 62.7 ± 2.0 | N.A. | ||
N.A.: not analyzed.
Table II. Heat-treatment conditions, ECSA, and Pt particle size of electrocatalysts prepared using the Pt(acac)2 precursor method.
| Electrocatalyst | Heat-treatment conditions | ECSA [m2g−1] | Pt particle size [nm] | ||
|---|---|---|---|---|---|
| 2.8wt% Pt/SnO2 | 210, 240°C | 3h + 3h | 63.4 | 2.5 ± 0.5 | |
| 18.4wt% Pt/SnO2 | 210, 240°C | 3h + 3h | 36.8 | 3.3 ± 0.6 | |
| 26.6wt% Pt/SnO2 | 210, 240°C | 3h + 3h | 34.4 | N.A. | |
| 3.7wt% Pt/Nb-SnO2 | N2 | 240°C | 2h | 66.2 ± 2.0 | 2.6 ± 0.4 |
| 8.3wt% Pt/Nb-SnO2 | 240°C | 2h | 60.9 ± 1.1 | N.A. | |
| 11.6wt% Pt/Nb-SnO2 | 240°C | 2h | 44.2 ± 2.9 | 2.7 ± 0.6 | |
| 11.6wt% Pt/Nb-SnO2 | 210, 240°C | 3h + 3h | 39.1 ± 3.1 | 3.0 ± 0.7 | |
| 22.5wt% Pt/Nb-SnO2 | 240°C | 2h | 37.3 ± 3.7 | 3.3 ± 0.9 | |
| 38.7wt% Pt/Nb-SnO2 | 240°C | 2h | 12.2 | 4.6 | |
N.A.: not analyzed.
The nanostructure was observed using field emission scanning electron microscopy (FESEM, Hitachi High-Technologies Corp., S-5200), scanning transmission electron microscopy (STEM, Hitachi High-Technologies Corp., HD-2200), and high-resolution STEM (JEOL, JSM-ARM200F). Energy dispersive X-ray analysis (EDX, AMETEK Co., Ltd., EDAX Genesis 4000) was applied to analyze the chemical composition.
Half-cell measurements were performed using an automatic polarization system (HZ-5000, Hokuto Denko Corp., Japan) with a 50 mL three-electrode cell (HX-107, Hokuto Denko Corp., Japan). An Au disk electrode (0.196 cm2) was used as the working electrode, on which the prepared electrocatalyst was carefully deposited. A Pt wire was used as the counter electrode and Ag/AgCl saturated in KCl was used as the reference electrode. Electrocatalyst ink was prepared by ultrasonically dispersing the electrocatalyst powder in ultrapure water, 2-propanol, and 5% Nafion solution. The ink was then deposited onto the Au disk electrode with a loading corresponding to 17.3 μgPt cm−2. Cyclic voltammetry (CV) measurements were made in a potential range between 0.05 and 1.2 VRHE at a scan rate of 50 mV s−1 in N2-saturated 0.1M HClO4 solution at 25°C. The ECSA of Pt nanoparticles was determined by integrating the area of the hydrogen desorption region (0.05 − 0.4 VRHE) in the CV diagram. ORR activity was characterized by measuring the kinetic current, determined from rotating disk electrode (RDE) measurements. The rotation speed was set at various rates from 2500 to 400 rpm, and the potential was swept from 0.2 to 1.2 VRHE at a scan rate of 10 mV s−1 at 25°C, according to the protocols proposed by the Fuel Cell Commercialization Conference of Japan (FCCJ).41 Specific activity (js) and mass activity (jm) were measured at 0.85 and 0.9 VRHE.
Residual impurity concentration from electrocatalysts was analyzed by dispersing and boiling them in ultrapure water. Then, residual Cl− ion content was measured by inductively coupled plasma atomic emission spectroscopy (ICP-AES, Agilent Technologies Inc., 7500c), with a detection limit of ca. 0.25 ppm for Cl− ions, which was experimentally derived from the calibration curve.
Results and Discussion
Characterization of support materials
Specific surface area of SnO2, Nb-SnO2, and Vulcan was 19.3 m2g−1, 24.7 m2g−1, and 225 m2g−1, respectively. Electrical conductivity (σ) of SnO2, Nb-SnO2, and Vulcan thin layers (area: 0.5 cm2, thickness: 60 μm) was 3.46 × 10⁻⁵ S cm−1, 1.1 × 10⁻⁴ S cm−1, and 1.02 × 10⁻² S cm−1, respectively. The hypervalent Nb5+ ions act as the electron donor to increase electronic conductivity of SnO2. SnO2 and Nb-SnO2 have much smaller specific surface area and lower conductivity than Vulcan.28 Even so, an increase in conductivity by Nb-doping has been successfully confirmed.
Electrochemical surface area of electrocatalysts
For electrocatalysts prepared in this study, Pt particle size and ECSA were evaluated and summarized in Tables I and II. Here, electrocatalysts were prepared in several different conditions. By comparing H2PtCl6 and Pt(acac)2 precursor methods, the Pt(acac)2 precursor method leads to smaller Pt particles, revealed by comparing 18 wt% Pt/SnO2 (4.4 nm) in Table I and 18.4 wt% Pt/SnO2 (3.3 nm) in Table II. The heat-treatment condition of 210°C for 3 h and 240°C for 3h was initially used, but when it was changed to 240°C for 2h only, Pt particles resulted in slightly smaller as seen in the case of 11.6 wt% Pt/Nb-SnO2 in Table II. That is probably due to the shorter heating time from total of 6 h to 2h. Then, the heating condition of 240°C for 2h was rather used in the latter part of our study.
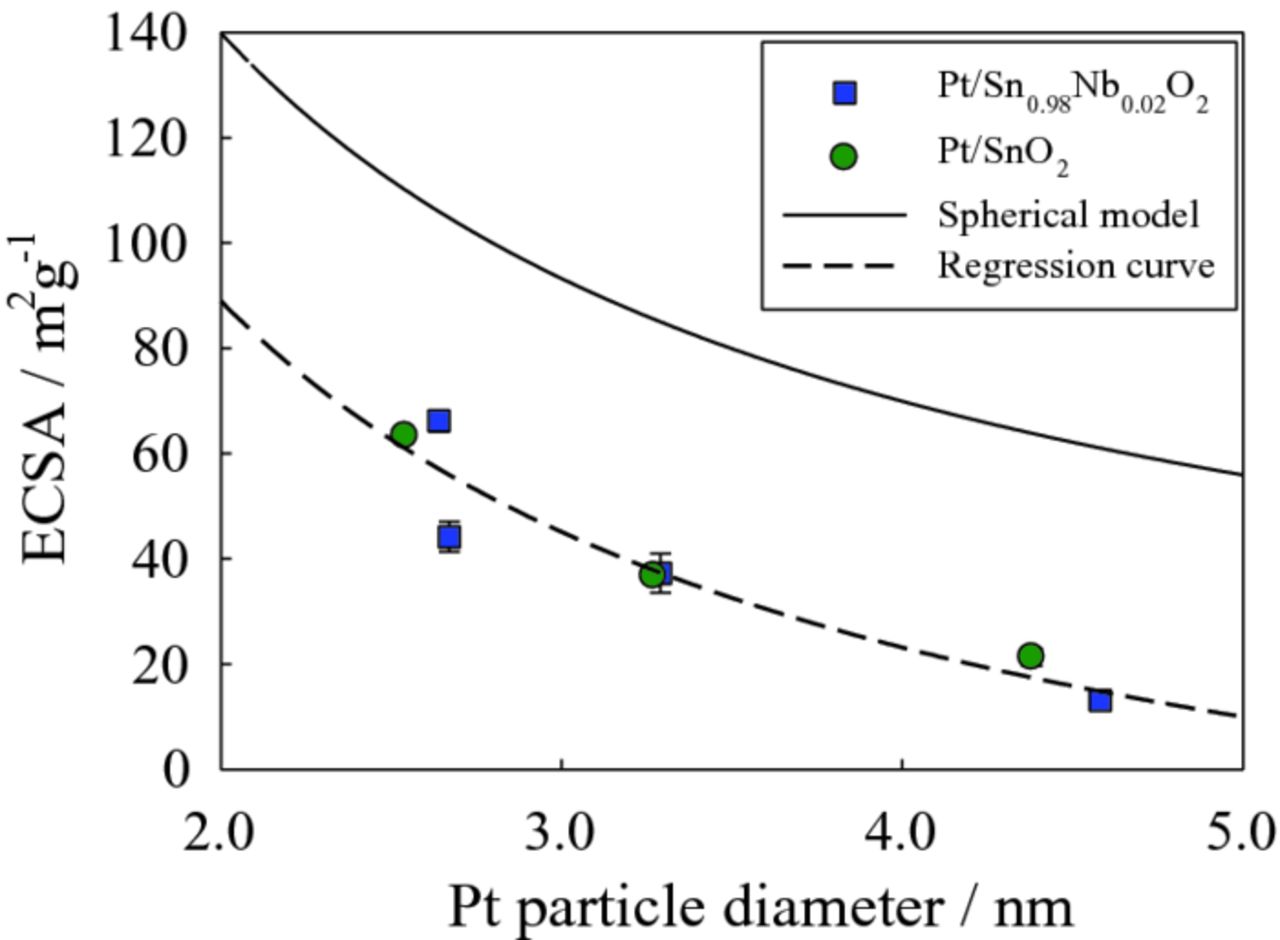
Regarding to ECSA, it increases with decreasing Pt loading in both cases of Pt/SnO2 and Pt/Nb-SnO2 electrocatalysts. The highest ECSA is 63.4 m2 g−1 for 2.8 wt% Pt/SnO2, and 66.2 m2 g−1 for 3.7 wt% Pt/Nb-SnO2 as shown in Table II. These are comparable to 62.7 m2g1 for 20 wt% Pt/Vulcan as listed in Table I. The ECSA is shown as a function of Pt particle size in Figure 1. The solid line shows the theoretical ECSA calculated under the hypothesis that all Pt nanoparticles are spherical with a density of 21.5 m2 g−1. The experimental ECSA decreases as particle size increases, following the same trend with the theoretical values as expected. The difference between the experimental and theoretical values is attributed to a deviation from the spherical model, or the presence of an electrochemically inactive interface between the Pt nanoparticles and the oxide support surface.
Figure 1. ECSA of Pt/SnO2 and Pt/Nb-SnO2 electrocatalysts as a function of Pt nanoparticle size. Theoretical values were calculated using the spherical model (solid line).
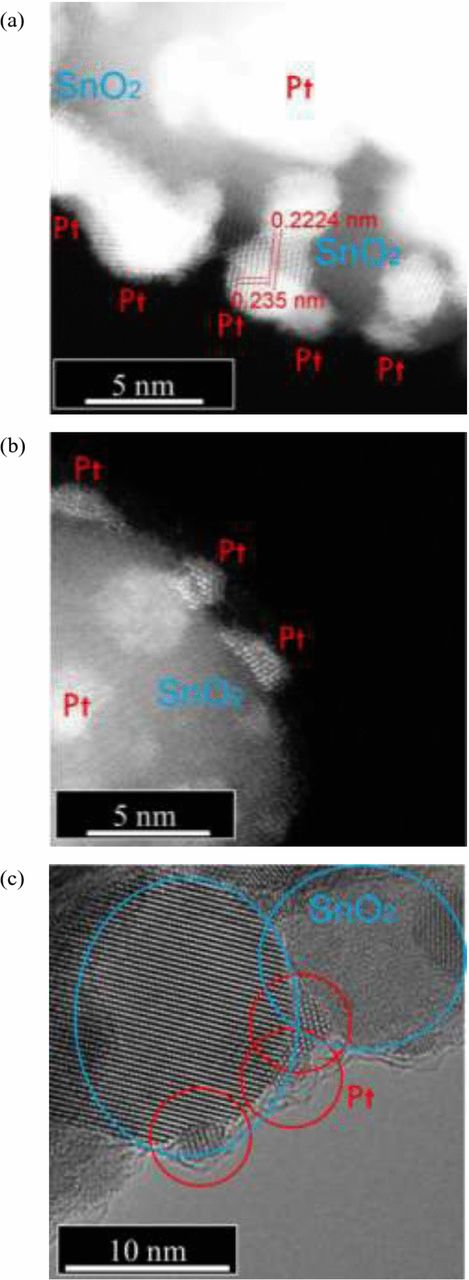
To understand the interface in more detail, STEM/TEM observation was performed. Figure 2 shows high resolution STEM/TEM micrographs of Pt/SnO2 with 26.6 and 2.8 wt% Pt loading. The Pt particles are clearly not ideal spheres; approximately half of the Pt surface is bonded to the support. These images indicate that the Pt nanoparticles deviate from the spherical model due to the formation of significant solid-solid interfaces. In the case of the Pt/SnO2 with higher Pt loading (Fig. 2a), some Pt particles are agglomerated. These deviations from the spherical model account for the overestimate of ECSA in the theoretical calculations. Other factors such as contamination from e.g. the platinum precursor materials may also contribute to the reduced experimental ECSA. This is addressed later in this paper.
Figure 2. High-resolution STEM images of Pt/SnO2 with (a) 26.6 wt% loading and (b) 2.8 wt% loading. (c) TEM image of Pt/SnO2 with 2.8 wt% loading. Pt nanoparticles of a few nm in diameter are dispersed on SnO2 surface. All samples were prepared using Pt(acac)2.
The relationship between ECSA and the surface area of supports was also investigated. The support surface area (As) is normalized against the supported Pt mass (mPt) in order to systematically compare the electrocatalysts in this study. Normalized support surface area (As/mPt) is then expressed in Eq. 1, in terms of the BET specific surface area of the support (AB), and the wt% Pt loading (xPt):
![Equation ([1])](https://content.cld.iop.org/journals/1945-7111/161/12/F1208/revision1/jes_161_12_F1208eqn1.jpg)
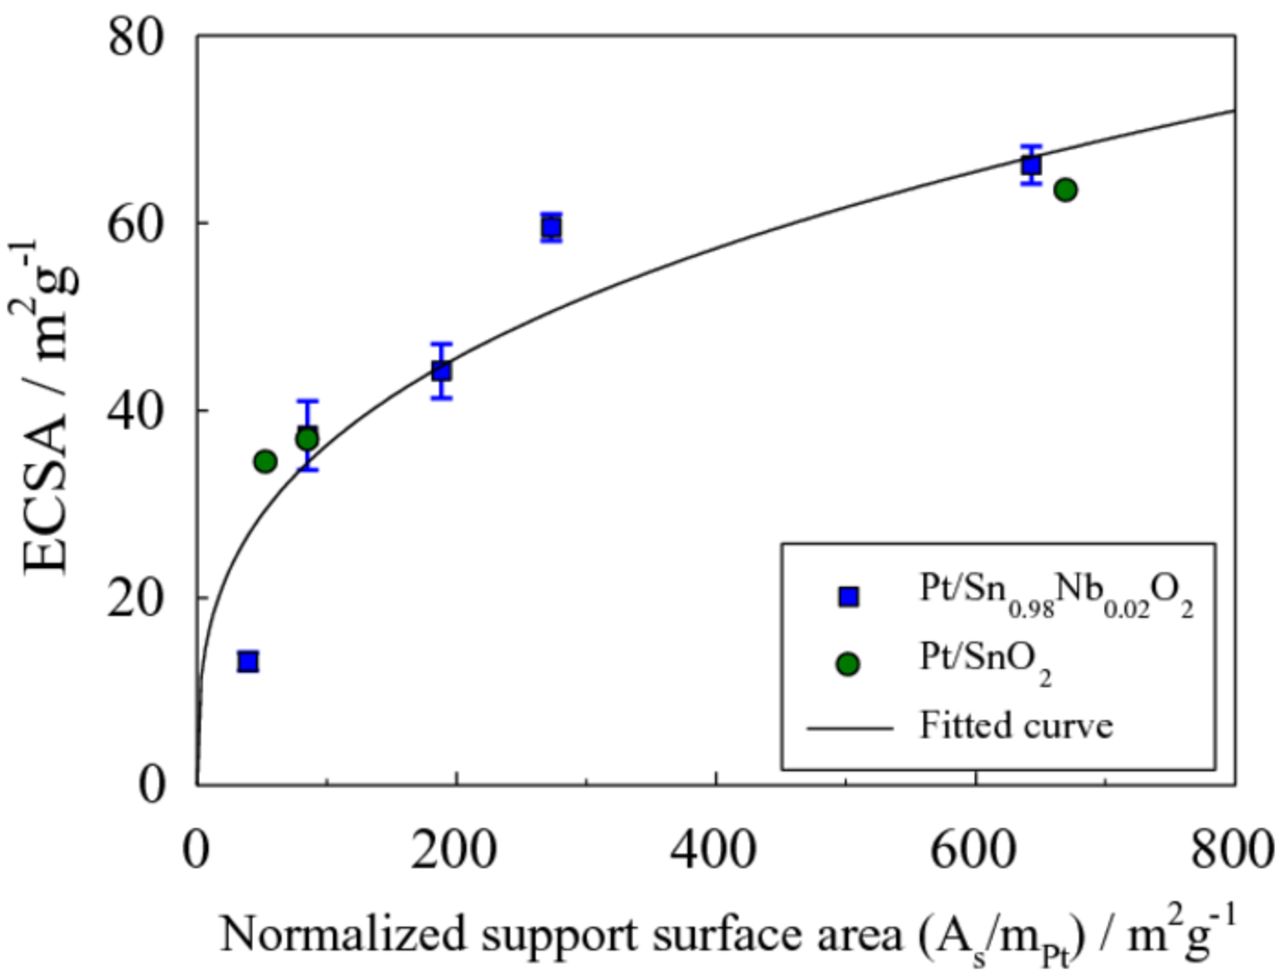
Using BET specific surface area of the SnO2 (19.3 m2 g−1) and Nb-SnO2 (24.7 m2 g−1) prepared in this study, the ECSA as a function of As/mPt is plotted in Fig. 3. The ECSA increases with As/mPt, and appears to saturate at high As/mPt. These results indicate that ECSA can increase as long as support surface area is available for the Pt particles to attach to.
Figure 3. ECSA of Pt/SnO2 electrocatalysts as a function of the normalized support surface area (As/mPt, i.e. the ratio of the SnO2 support surface area to the Pt mass).
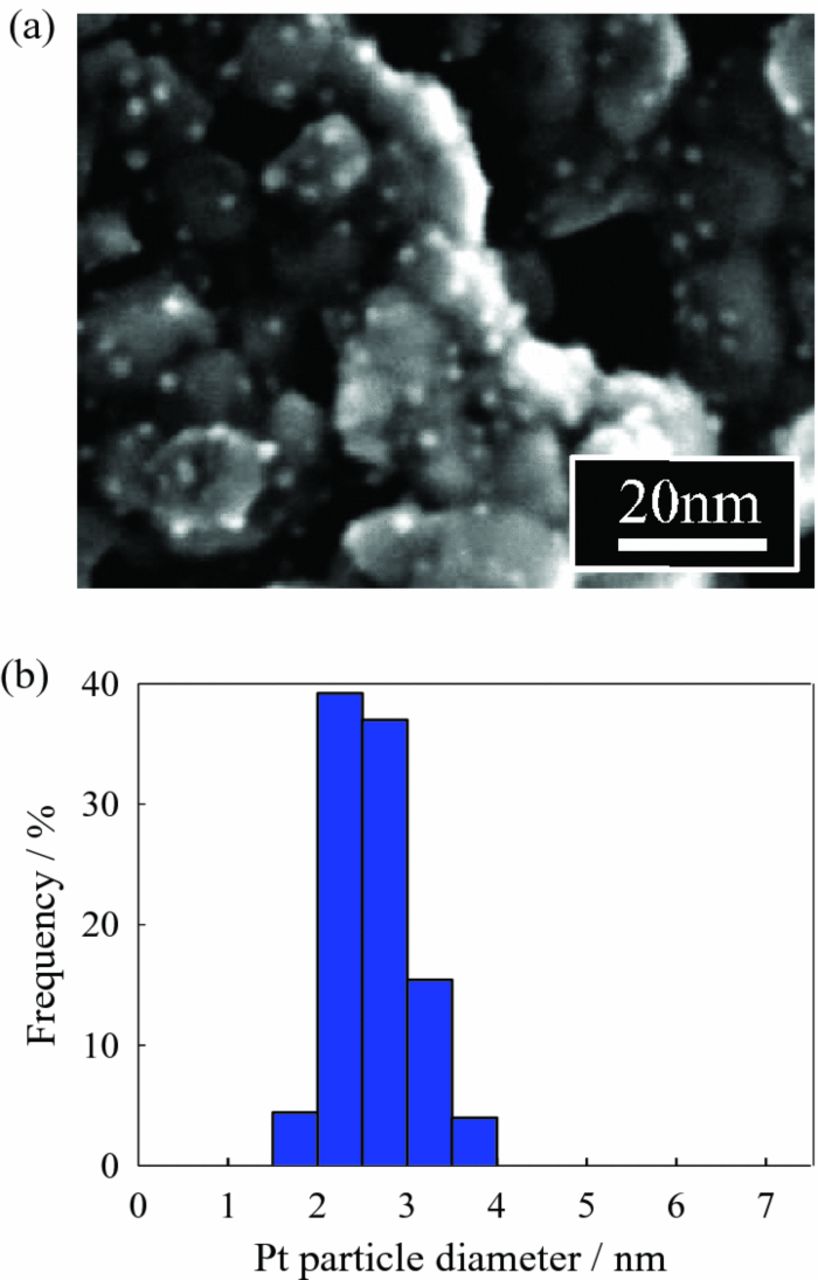
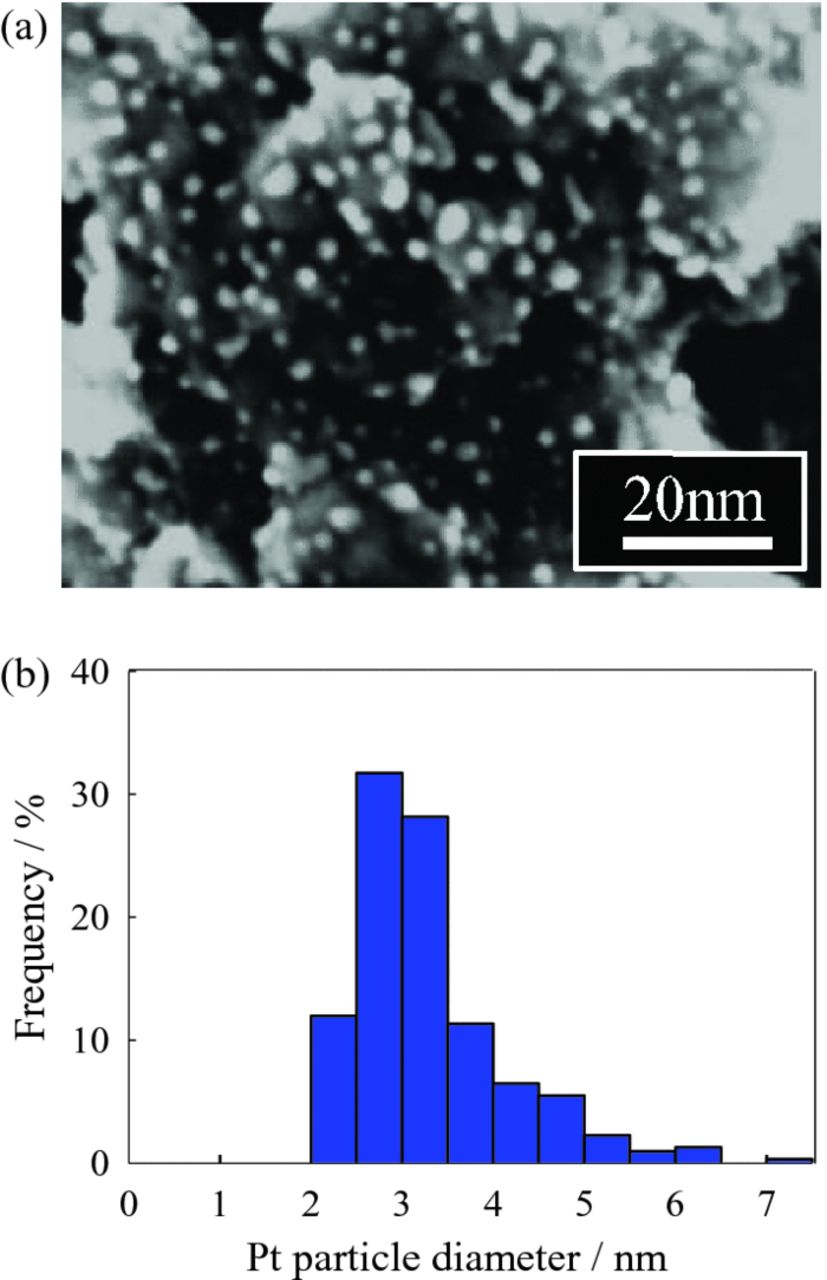
STEM micrographs and Pt particle size distributions of 3.7 wt% and 22.5 wt% Pt/Nb-SnO2 are shown in Figs. 4 and 5, respectively. In the case of Pt/Nb-SnO2 with 3.7 wt% loading, a homogeneous dispersion of Pt particles with a narrow range in diameters (<4 nm) is observed (Fig. 4). On the other hand, increasing Pt loading to 22.5 wt% (Fig. 5) leads to a broader Pt particle size distribution. This suggests that agglomeration and sintering of Pt nanoparticles in the case of higher loading contributes to lower As/mPt and therefore smaller ECSA. These results show that the low ECSA of Pt/SnO2 and Pt/Nb-SnO2 is caused mainly by the low specific surface area of supports. This also explains why the ECSA is comparable to 20 wt% Pt/Vulcan after optimization of the normalized support surface area, As/mPt. An effort to increase specific surface area of supports is therefore necessary for further improvement in the ECSA.
Figure 4. (a) STEM micrograph of 3.7 wt% Pt/Nb-SnO2 prepared using Pt(acac)2 as a precursor. (b) Pt particle size distribution.
Figure 5. (a) STEM micrograph of 22.5 wt% Pt/Nb-SnO2 prepared using Pt(acac)2 as a precursor. (b) Pt particle size distribution.
ORR activity
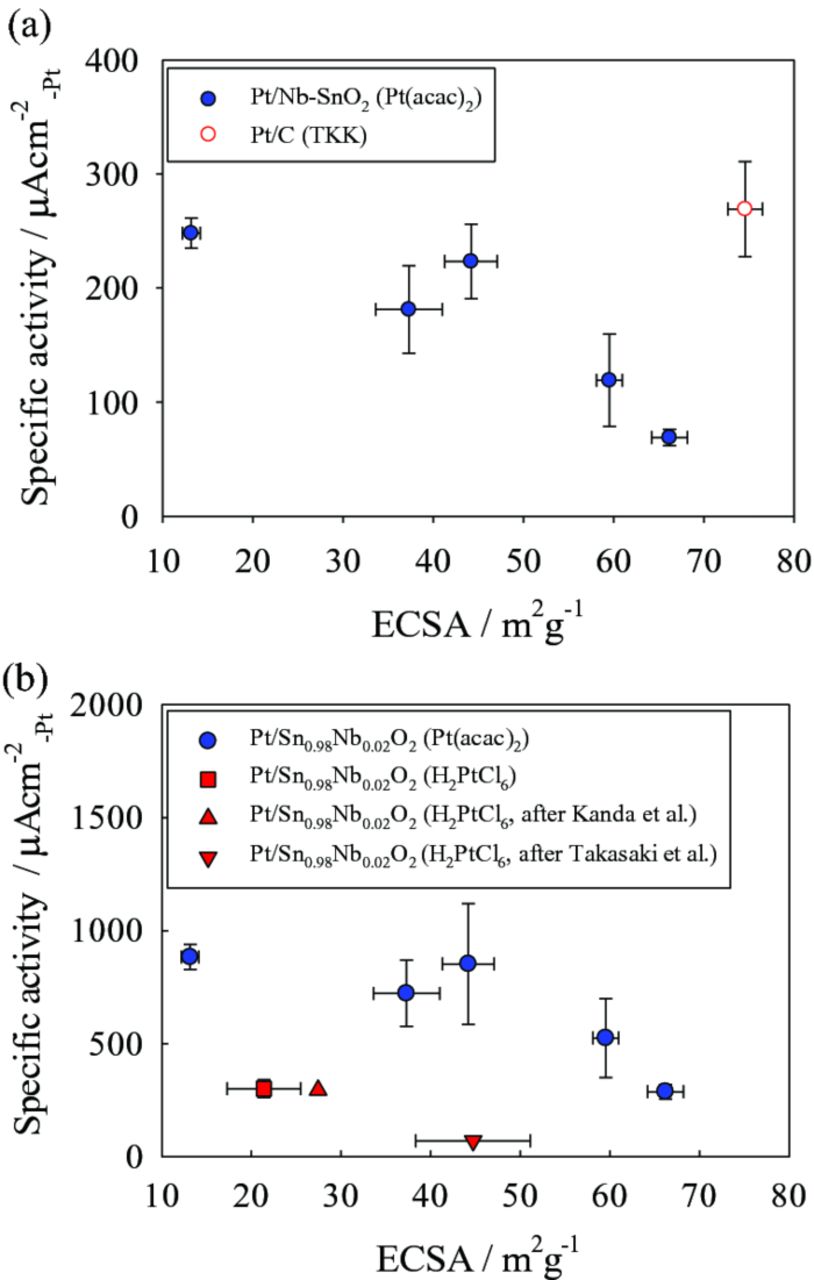
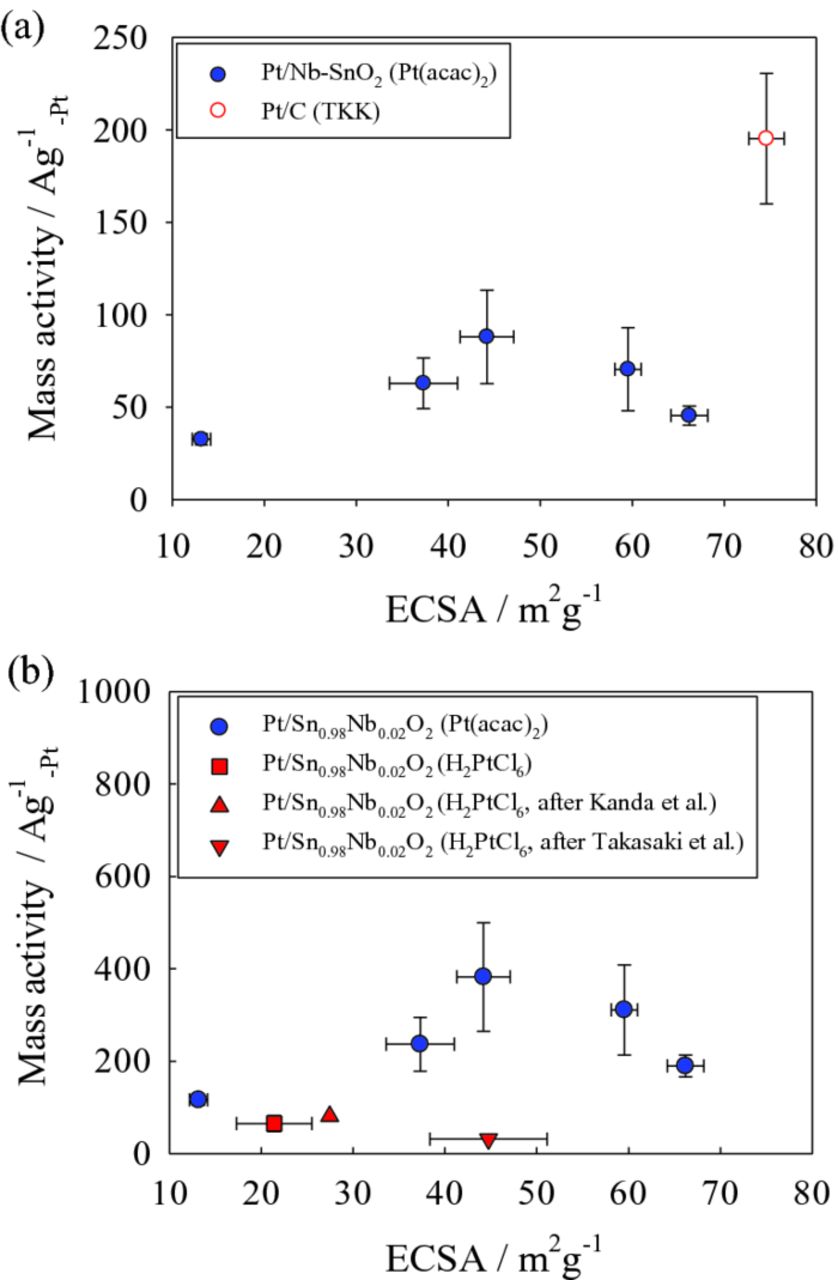
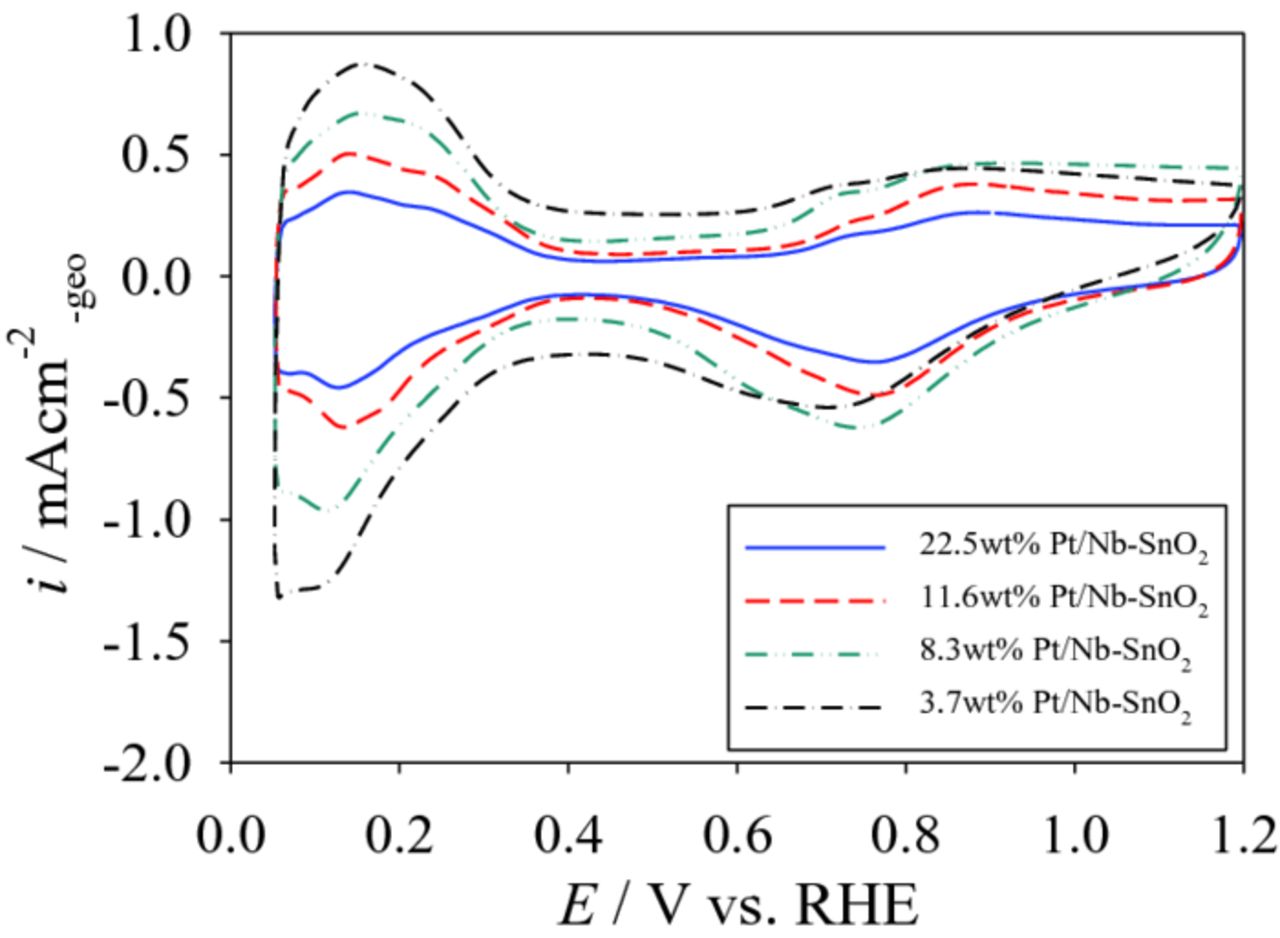
The specific and mass activities of Pt/Nb-SnO2, measured at both 0.9 and 0.85 VRHE as a function of ECSA, are shown in Figs. 6 and 7, respectively. Extra data points from our previous study28,42 and Pt/C (TKK) as the reference are also included to clarify the correlation between ECSA and the specific and mass activities. The specific activity tends to decrease with increasing ECSA (Fig. 6). Due to this decrease in specific activity, a high ECSA did not necessarily result in a high mass activity (the product of specific activity and ECSA), as shown in Fig. 7. This may be attributed to the difference in Pt particle size caused by the different wt% Pt loadings. This might lead to an increase in the fraction of oxygen species (such as Oad and OHad) on the Pt surface at certain potentials, blocking oxygen adsorption sites.38,43–45 In support of this idea, CV curves of the Pt/Nb-SnO2 electrocatalysts synthesized from the Pt(acac)2 precursor is shown in Fig. 8. A negative shift in oxygen desorption peak potential is observed at lower Pt loading (3.7 and 8.3 wt%), indicating stronger oxygen adsorption on the Pt surface.38,45 Consequently, despite lower loading leading to higher ECSA, the specific activity decreases, due to a decrease in Pt particle size. These two opposing tendencies lead to the existence of an optimum condition for mass activity. Alternatively, smaller inter-crystallite distance could also result in a decrease in Pt surface activity.46
Figure 8. Cyclic voltammograms of Pt/Nb-SnO2 electrocatalysts with Pt loadings (Pt(acac)2 method).
Additionally, it is clearly shown in Fig. 6 that electrocatalysts prepared using the Pt(acac)2 method have higher specific activity for their ECSA compared to those prepared using H2PtCl6 (ca. 20 wt% Pt on SnO2). This difference could be attributed to residual impurities such as chloride ions (Cl−). It has been previously shown in the literature that Cl− ions strongly adsorb onto Pt surfaces and decrease the ORR activity.43,44 To clarify this effect, Pt/SnO2 electrocatalysts were prepared using the two different precursors; H2PtCl6 and Pt(acac)2. The residual Cl− ion content was probed by ICP-AES; the catalyst powder was dispersed in ultrapure water and boiled to disperse residual Cl− ions into solution. Residual Cl− ions with a concentration of 5.6×10³ ppm were detected when the H2PtCl6 precursor was used, whilst no Cl− ions were detected using the Pt(acac)2 precursor within the detection limit of the machine. Therefore, we attribute the difference in specific activity to the presence of residual Cl− ions from the H2PtCl6 precursor. Consequently, as expected, residual impurities sensitively affect ORR activity, such that a procedure avoiding Cl− ions is desired for effective electrocatalyst preparation.
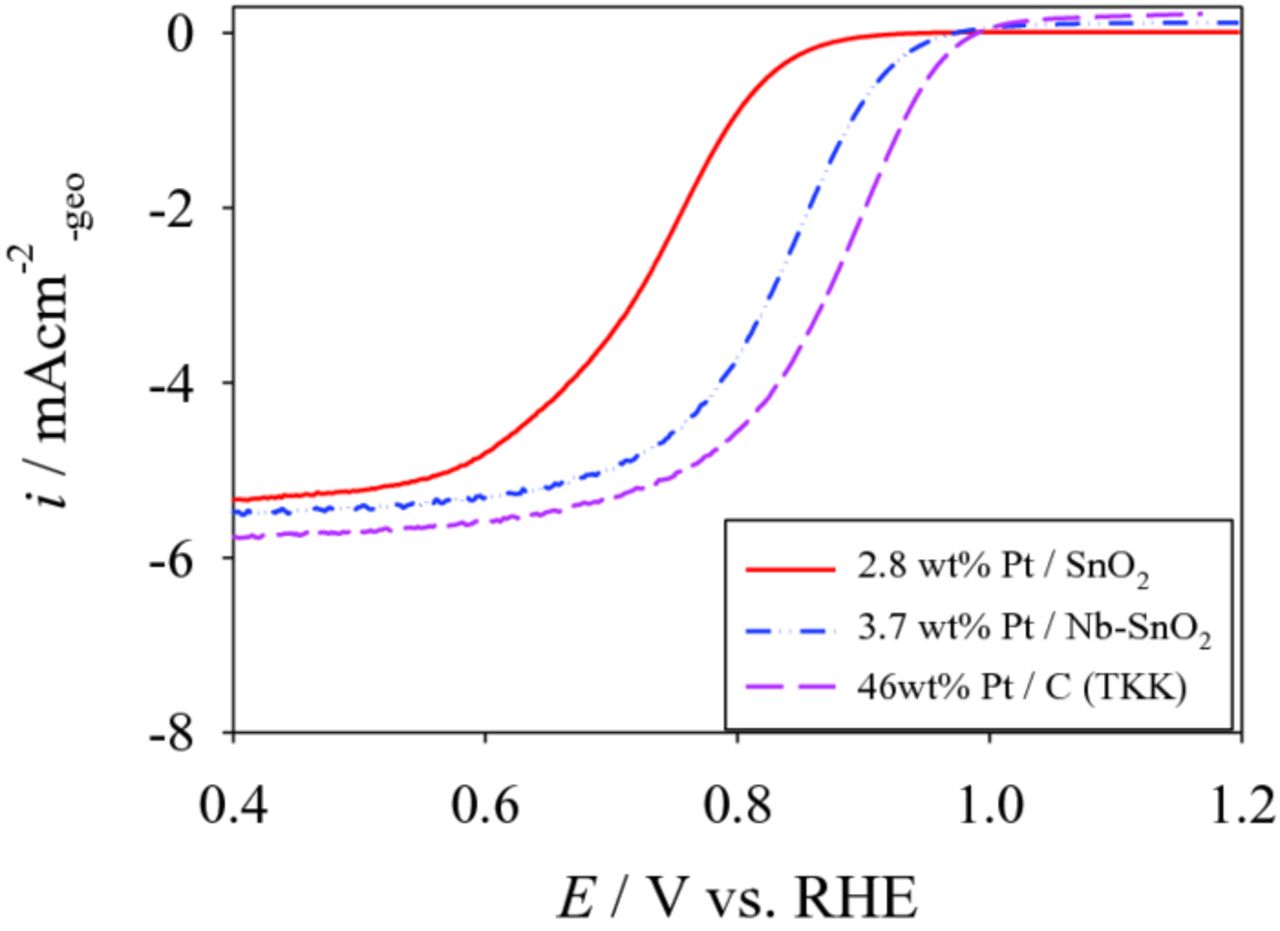
To understand the fundamental electrochemical difference between Pt/SnO2 and Pt/Nb-SnO2, linear sweep voltammmograms of 2.8 wt% Pt/SnO2 and 3.7 wt% Pt/Nb-SnO2 were evaluated and are shown in Fig. 9 with Pt/C (TKK) as the reference. These two electrocatalysts have similar ECSA and Pt particle size (Table II), such that the effect of particle size on the results (as described above) can be neglected. Simply the effect of Nb-doping can be evaluated. As seen in Fig. 9, Pt/Nb-SnO2 exhibits higher ORR activity than Pt/SnO2. ORR activity of Pt/Nb-SnO2 is approaching to that of Pt/C (TKK). Since donor doping leads to increase in conductivity from 3.46 × 10⁻⁵ S cm−1 to 1.1 × 10⁻⁴ S cm−1 as mentioned in the earlier section of this paper, increased electronic conductivity improved the ORR activity. While the heating condition of Pt deposition was slightly different between 2.8 wt% Pt/SnO2 and 3.7 wt% Pt/Nb-SnO2, such difference a little influenced on Pt size as explained for 11.6 wt% Pt/Nb-SnO2 in Table II, and also on ORR. The increase in electrical conductivity was much more effective for ORR.
Figure 9. Linear sweep voltammograms for 2.8 wt% Pt/SnO2 and 3.7 wt% Pt/Nb-SnO2 prepared from Pt(acac)2, measured using a rotating disk electrode at 1600 rpm. Corresponding data for Pt/C (TKK) were also shown as the reference.
Even though ECSA of SnO2 and Nb-SnO2 can be comparative to Pt/Vulcan or Pt/C (TKK), resulting ORR activity of SnO2 based electrocatalysts is still lower than carbon based materials owing to their lower conductivity. Whilst hydrogen adsorption/desorption reactions for ECSA measurements may be relatively fast, ORR may be more strongly affected by electron transfer/transport rate-determining by the electrical conductivity of the support materials, leading to a lower ORR activity with SnO2-based electrocatalyst supports. Other factors affecting ORR activity may not be excluded, such as strong metal-substrate interactions (SMSI), Pt surface defects, and contaminants on Pt catalysts diffused from the support materials.
Conclusions
The electrochemical properties of Pt/SnO2 and Pt/Nb-SnO2 were investigated. The dependence of ECSA and ORR activity on Pt particle size, support surface area, Pt loading, and residual Cl− ion contamination was examined. The ECSA of Pt/SnO2 and Pt/Nb-SnO2 electrocatalysts was comparable to Pt/Vulcan after optimization of the normalized support surface area. However, in this study, since the specific surface area of supports was not large enough, an increase in ECSA derived by decreasing Pt particles size resulted in a decrease in specific activity. Therefore, the importance of increasing the specific surface area of oxide support materials for obtaining higher ECSA was shown. Removal of residual Cl− ions by using an alternative Pt nanoparticle precursor then increased specific activity. Nb-doping of the SnO2 support also increased the specific activity, due to improved electronic conductivity. Consequently, oxide-supported PEFC electrocatalysts with high ORR activity require oxide supports with; (i) large specific surface area, (ii) high electronic conductivity, and (iii) negligible impurities. These should be the guiding factors when further improving oxide-supported PEFC electrocatalysts in the future.
Acknowledgments
Financial support by the grant-in-Aid for Scientific Research (No. 23226015), JSPS Japan, is gratefully acknowledged. The International Institute for Carbon-Neutral Energy Research is supported by World Premier International Research Center Initiative (WPI), MEXT, Japan. The authors thank S. Matsuie for measuring electrical conductivity of SnO2-based materials.

