
Abstract
Based on a multiscale modeling framework, we focus on understanding the impact of CO adsorption on the intrinsic stability properties of PtxCoy nanoparticles under PEMFC anode operating conditions. Firstly, CO adsorption effect on PtxCoy has been studied by using Monte Carlo (MC) simulation. Then, the MC results were coupled with a non-equilibrium thermodynamics kinetics model (MEMEPhys®) to simulate the effect of CO poisoning on the activity and durability of PtxCoy nanoparticles as HOR catalysts. The results are compared with simulations carried out on Pt, where potential self-oscillatory behaviour is observed and experimentally confirmed. The PtxCoy HOR activity and stability properties reveal to be strongly dependent on the nanoparticle size and composition. For certain nanoparticle sizes, simulations show that PtCo nanoparticles provide better CO tolerance than Pt3Co. However, the CO tolerance of PtCo degrades faster than that of Pt3Co in long-term operation. From both modeling and experimental approaches, it is demonstrated for the first time that this observation is due to the fact that CO adsorption enhances Cobalt dissolution.
Export citation and abstract BibTeX RIS
Polymer Electrolyte Membrane Fuel Cells (PEMFCs) are considered as good candidates to replace internal combustion engines for stationary and transportation applications, especially for light-duty vehicles.1 PEMFC have in particular the advantages of higher conversion efficiency and low emissions. Due to low operating temperature and high sensitivity of the platinum catalysts to impurities, PEMFC require high purity hydrogen and air/oxygen feeds at the anode and cathode sides respectively. However, the main hydrogen sources are reforming various kinds of hydrocarbons. Impurities are thus inevitably present and further purification is necessary. In particular, carbon monoxide (CO) is one of the main pollutants in hydrogen and it is well known that Pt-based PEMFC performances decrease rapidly with as low as 5 ppm of CO in hydrogen.2 Figure 1 illustrates the effect of different CO concentrations in the H2 feed stream on short-term single PEMFC voltage.3
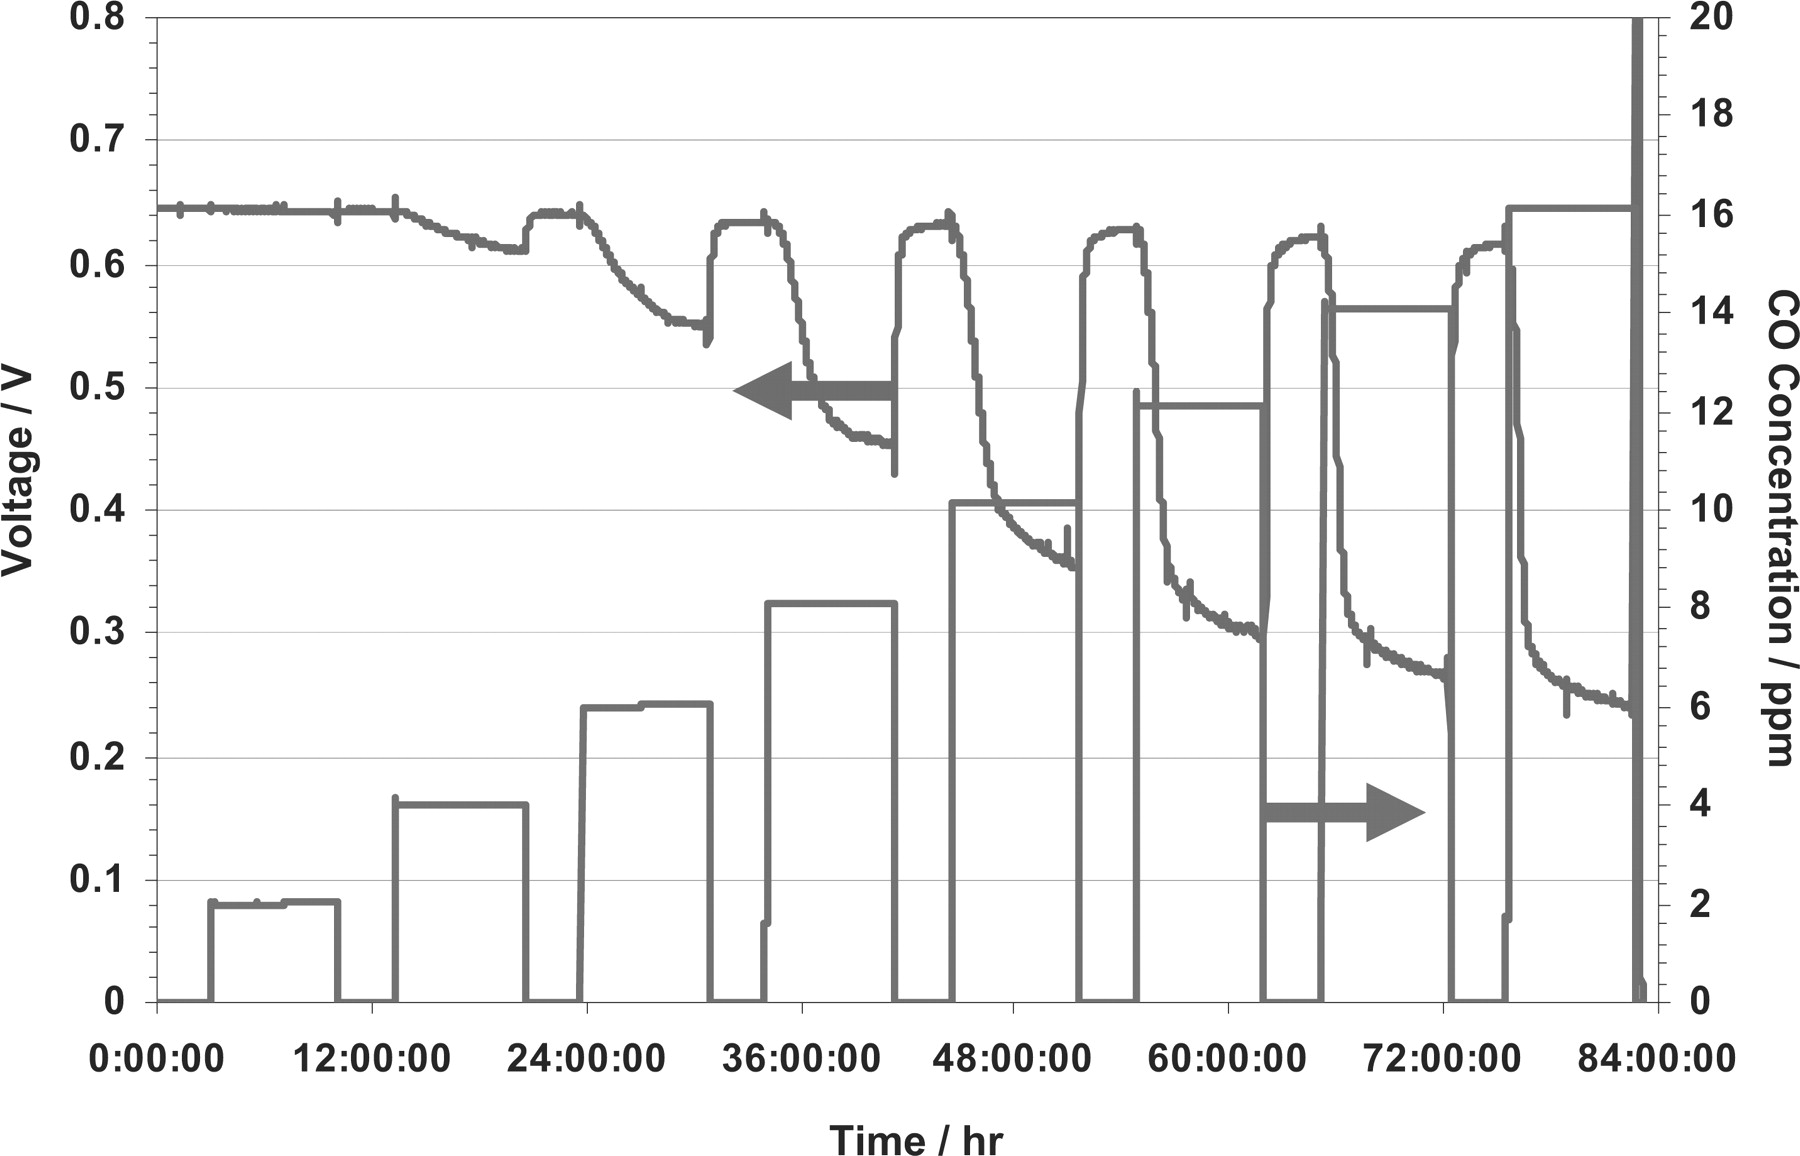
Figure 1. Effect of different CO concentrations in H2 on PEMFC performance under steady-state operating conditions (Pt loading: 0.5 mg.cm−2; fuel cell temperature: 70°C; anode and cathode pressure: 0.15 MPa; anode and cathode relative humidity: 60%; current density: 0.6 A.cm−2).
Some mitigating solutions are currently proposed to limit the CO impact on the PEMFC performance such as high temperature operation,4 air bleeding,2,5 multi-metallic catalysts6–11 and etc. Moreover, together with membrane, Pt catalysts undoubtedly account for the PEMFC high cost.1 In this context, replacement of Pt-alone catalysts by multi-metallic catalysts is currently a promising pathway since it allows a significant decrease of costs and an improvement of the anodic hydrogen impurity tolerance. This is the reason why bimetallic catalysts with higher CO tolerance have been intensively studied during the last years. In particular, PtRu is commercially used due to its high CO tolerance.12,13 However, Ru is also expensive and has to be replaced by another cheaper alternative in the effort to reduce the cost of fuel cells. Therefore, Watanabe et al. have proposed the non-precious transition metals as the alloying elements with Pt.6,7
The CO tolerance mechanisms of the Pt-M catalysts (where M is a non-precious transition metal) have been intensively studied. In general, two mechanisms are proposed by the scientific community:
- Bifunctional effect. The adsorbed CO is oxidized due to the spill-over of adsorbed -OH produced through water dissociation promoted by the alloying metals.14,15
- Ligand effect/electronic effect. The alloying metals decrease the Fermi level of Pt 5d band. As a result, the back donation of the electron from Pt to the 2π* band of CO is reduced, so that the bonding of CO to Pt is weakened. A weaker bonding will result in lower CO coverage or higher mobility of CO, thus more free sites are available for H2 oxidation reaction.7,9
The stability properties of the bimetallic catalysts are crucial to maintain the CO tolerance in long-term PEMFC operation. However, there have been more stability investigations of these materials on the cathode side than on the anode side. It is well known that under high potential and acidic environment, which is the case in most of the PEMFC cathode operating conditions, the alloying metals tend to dissolve from the catalysts.16–19 These degradation phenomena reduce the positive effects of alloying and eventually the catalysts will behave similarly to Pt catalysts. In contrast, the investigations of the stability properties on the anode side are limited. Some studies have been done on the effects of gas molecule adsorption on the surface of bimetallic catalysts and they showed that it may induce surface reconstruction phenomena.20–22 For example, in the case of PtRu, Pt tends to segregate at the surface of particles when no species are adsorbed on the surface. When CO is adsorbed, a reverse segregation of Ru to the surface is observed.23 Nonetheless, to our knowledge hitherto the stability properties of PtxCoy under CO adsorption and the influence on PEMFC anode performance have never been studied. Only Watanabe et al. have studied the influence of temperature on the loss of alloying metal from the catalysts in the anode.8,24
Therefore in this work, we coupled modeling and experimental approaches to have an insight on the intrinsic properties of PtxCoy catalyst with CO adsorption and under PEMFC operating conditions. Monte Carlo (MC) simulation has initially been used to understand the possible CO impact onto the intrinsic stability properties of PtxCoy catalysts. In parallel, the multi-scale kinetic model developed in Dr. Franco's group (MEMEPhys®)25 has been adapted to describe the instantaneous co-reaction of CO and H2 on Pt-alone catalyst in the anode, and has been validated by half cell experiments. Subsequently, the model has been adapted to the case of the PtxCoy catalysts and correlated to their degradation phenomena. By coupling the two approaches, the evolution of the catalyst performance under CO adsorption influence has been investigated.
The paper is organized as follows. First, the global theoretical approach employed is described, followed by the detailed descriptions of both the Monte Carlo and multi-scale modeling approaches. Secondly, the experimental approaches are described. Then the results are presented by considering firstly the Pt-alone catalyst and the PtxCoy catalysts (modeling data, experimental results and discussion). Finally conclusions are presented.
Theoretical Approach
Global modeling algorithm
In Franco et al. previous publications, the MC approach and the multiscale non-equilibrium thermodynamic-based kinetic approach were coupled to describe the time evolution of PtxCoy catalysts activity towards the oxygen reduction reaction in the PEMFC cathode.18 In this work, the same approaches are used and adapted to the reactions that occur in the PEMFC anode. Initially, the influence of CO on the catalyst particles nanostructure is accounted for by using the MC Metropolis algorithm.18 Thus, a library containing the relationship between PtxCoy particles volumetric and surface composition is generated. Then, simulation is carried out by using the multiscale model to simulate the particle temporal volumetric composition of Cobalt,  , and the total number of atoms,
  , in the nanoparticle. They are then used to obtain the instantaneous surface composition of Cobalt,
  , from the library which is then used to continue the simulation of the multiscale model. The implementation of this library in the micro-kinetic model allows the prediction of experimental observables (e.g. PEMFC anode potential at fixed current) time evolution. A schematic diagram of this methodology is described in Figure 2.
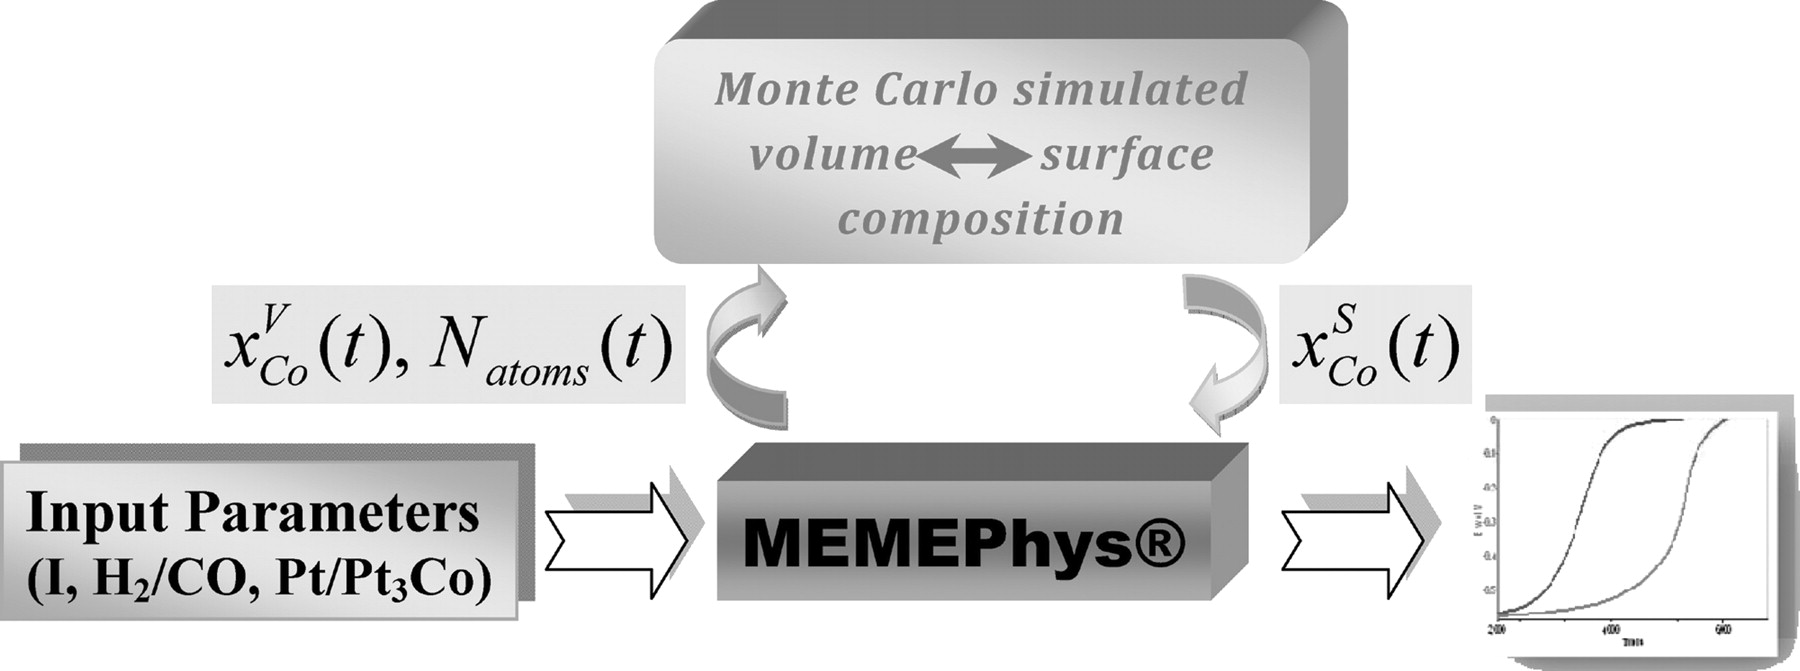
Figure 2. Instantaneous coupling of MC and multiscale modeling approaches that allows the prediction of fuel cells experimental observables time evolution for PtxCoy under the influence of CO in H2.
Monte Carlo algorithm
In this work, a linear combination of the Sutton-Chen multiatomic potential26,27 and the adsorption energies are applied in the Metropolis MC method to simulate the pseudo-equilibrium atomic repartition of PtxCoy nanoparticle. This is coherent with the procedures that were adopted by Khanra et al.20 The total nanoparticle energy, U, is the addition of terms that describes the two-body repulsive interaction between the atoms i and j separated by a distance rij, the many-body cohesion terms associated with atom i, and the CO adsorption energy on the surface atoms terms:

In Eq. 1,  is the so-called energy parameter,
  is the lattice constant, c is a dimensionless parameter, n and m are positive integers with n > m, and x and y are the numbers of Pt and Cobalt atoms with adsorbed CO on the surface of the particle. Table 1 gives the values of the different parameters.
  is the CO adsorption energy on the respective metal where M is either Pt or Cobalt. The values of
  are obtained from the ab initio data provided by Christoffersen et al.23 The detailed description of the Metropolis MC algorithm was described in our previous publications.18,28 The only differences compared with the previous works are that the annealing is not applied during "CO adsorption" and that the U of the system includes the CO adsorption energies on the surface atoms. Initially, the final structure of the PtxCoy particle is obtained with the MC algorithm and annealing cooling schedule as described in our previous publication.18 Then, the MC simulation is continued on the PtxCoy particle structure with current algorithm and the temperature used in the current simulations with CO influence is 353 K, to mimic the typical PEMFC operating temperature. The MC is carried out with sufficient number of trials to ascertain that the system has attained the minimum energy.


Non-equilibrium thermodynamics kinetics-based approach
Our kinetic model, known as MEMEPhys® and being developed by Franco et al. since 2002, is able to simulate the experimental observables (e.g. anode potential evolution at fixed current) from a combination of physical, chemical, and electrochemical models at different scales. Generally, MEMEPhys® model can be separated into three different scales: nanoscale, microscale and cell level (Figure 3). In this work, the cell level consists of only the anode side of the PEMFC, i.e., a half cell. At the cell level, input parameters such as current density, temperature and properties of reactant gases are introduced as input data. This input data are used in the microscale to simulate the transport phenomena of different species such as the H2 and the CO. The results from the microscale are then instantaneously being the input for nanoscale parameters, where elementary chemical and electrochemical reactions rates are described in relation to a non-equilibrium thermodynamics description of the electrochemical double layer structure (interface between the catalyst and the electrolyte).28,29
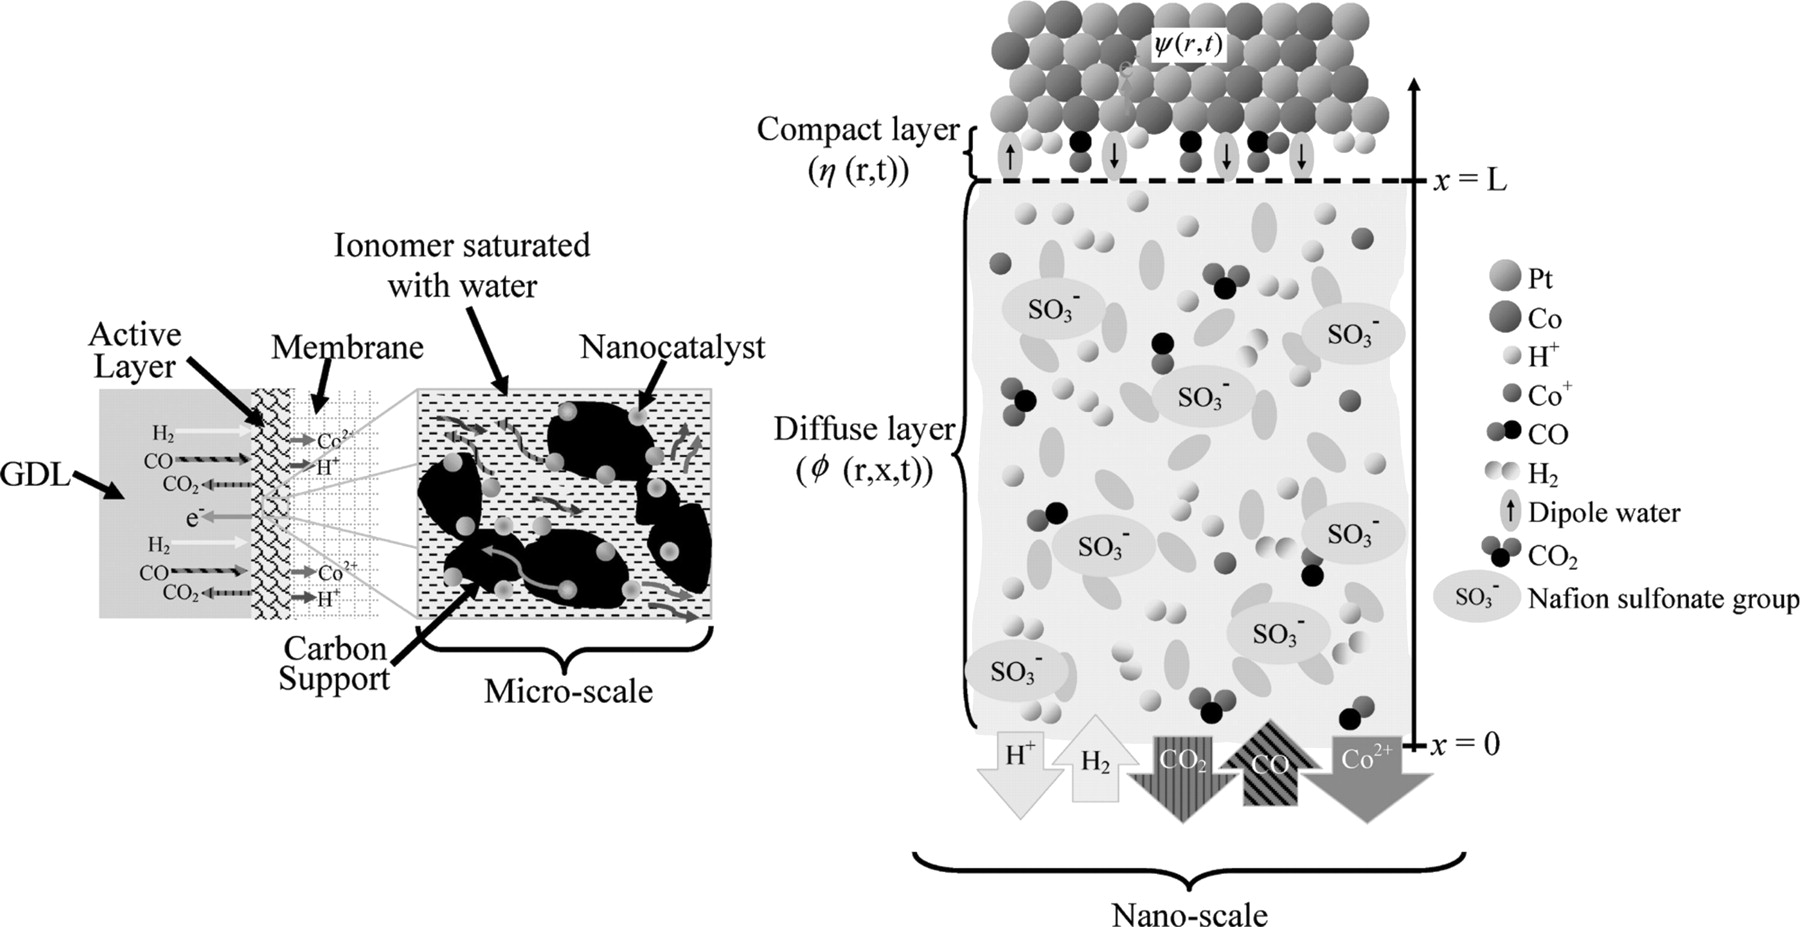
Figure 3. Schematic diagram of micro- and nano-scales of the kinetic model. Diffusion phenomena are modelled in the microscale. The results obtained are used to simulate instantaneously the nanoscale, which is based on the electrochemical double layer model.
Nanoscale compact layer model
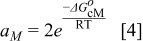
The electrostatic potential drop across the compact layer is denoted as:

The calculation of  was already described in Franco et al. previous publications.28–30 It results from the superposition of the electrostatic potential drop due to the dipolar moment of the ad-layer (here mainly of water, as the dipolar moment of CO is neglected as it is much lower than water) and the surface charge density. By defining
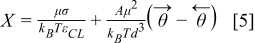
we can show that  is given by:18
and
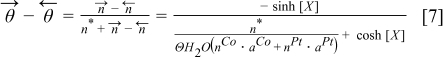
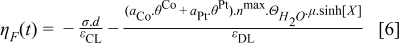
where n* is the addition of number of free sites and occupied sites by reaction intermediates per unit of area. By using Eqs. 5,7 we have:
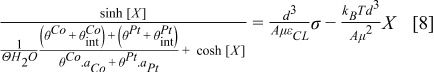
Eq. 8 is the transcendental equation that can be used to determine X and it has a single solution for every σ value. The value of  is determined from
and

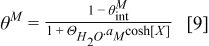
where  is the total coverage of all reaction intermediates for Pt and Cobalt (M = Pt or Cobalt) and
  is the coverage by ionomer (here assumed to be zero).
The hydrogen oxidation reaction (HOR) in the anode is described by using the Tafel–Heyrovsky–Volmer three steps reactions model.28,29,31–33


The rate of these reactions are expressed as below by assuming that the adsorbed species (H and CO) are not interacting with each other


The HOR is assumed to take place only on Pt sites of the bimetallic catalyst. Alloying of the Pt and Cobalt is assumed to be not affecting the HOR reaction parameters.34
On the other hand, the CO reaction with the bimetallic catalyst is described by using a two steps reaction:35,36


and the corresponding reaction rates are determined by:
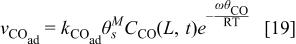

where ω is the CO-CO interaction parameter36 as show by Baschuk et al.: the CO adsorption reaction follows Temkin kinetics instead of Langmuir kinetics that do not depend on the interaction between adsorbates.5
Besides that reaction of external species with the bimetallic catalyst, the degradation reaction of the catalyst, i.e. Cobalt dissolution, is also considered:

with the following reaction rate:18

In the model, the reaction rate is normalized to the catalyst surface area (the unit is thus mol.m−2.s−1). The rate constant is determined by using the Eyring's equation:37
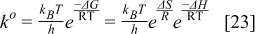
The Gibbs' free energies in Eq. 23 are either obtained from ab initio data or fitted. The Gibbs' energy of HOR is considered to be independent of the composition of the bimetallic catalyst. However, it is well known that the interaction of CO with Pt surface atoms changes from Pt to bimetallic catalysts and, the composition of the bimetallic catalysts give different CO tolerance characters.6,8,9,12 Thus, we propose that the Gibbs' energies of COad and COOR on Pt are the functions of the bimetallic catalysts composition (surface or volumetric) as a first approximation. Besides, Cobalt oxidation Gibbs' energy is also a function of Cobalt composition.18 The Gibbs' energies are written as:

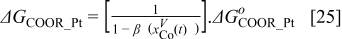
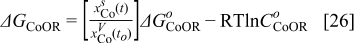
Eqs. 24,25 are written in an empirical way that reflects the facts where the adsorption reactions and CO oxidation reactions are modified through alloying Pt with Cobalt. As shown by Watanabe et al., Cobalt has reduced the back donation of electron from Pt to CO and thus reduced the adsorption strength of CO-Pt.7 Therefore, we proposed that the Gibbs energy of Eq. 24 is inversely proportional to the Cobalt alloying composition while the rate of CO electro-oxidation (Eq. 25) is proportional to the Cobalt contents with an empirical factor β. Eq. 26 is corresponding to our previous publication on PtxCoy where the oxidation of metal is a function of the relative surface/bulk composition.18 By using the reaction rates of the corresponding reactions, the flow of reactants and products to and from the compact layer can be determined. At the same time, the evolution of the catalyst surface charge density can be calculated based on:
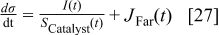
and

Diffuse layer model
In this part, we describe the transport of the electrically charged species (H+, Co2+) and electrically neutral species (CO, H2 and CO2) in the diffuse layer and the coupling with the compact layer model. This allows the calculation of the time-dependent species concentrations at the compact layer (x = L, cf. Figure 3). The diffuse layer model is based on the diffusion and migration transport of the reaction species coupled with the electric field generated by the resulting charge distribution. All species mentioned above including SO3− (sulfonate group of Nafion®) and water, are considered as punctual, so the inter-particle electrical interaction is neglected. The solvatation and convection by water are not considered.
The flow of the electrically neutral species, i.e H2 and CO, are assumed to be given by Fick's law of diffusion and the mass balance leads to

where we assume that the diffusion coefficients Di are constant. For the case of the electrically charged species, for example H+, the diffusion coefficient in the medium is also supposed to be independent of the concentration. In a similar way that in the H2/CO case, combining the flow related to the Fick's diffusional force to the electrical force, with the mass balance, we obtain the equation representing the iz+ concentration (Nernst–Planck equation):
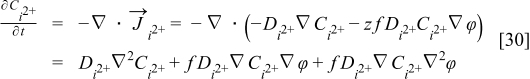
Where z is the valence change and  is the electric potential in the electrolyte and calculated from the Poisson's equation:

where the sulfonate groups concentration  is assumed to be constant. These sulfonate sites are supposed to be located outside of the compact layer and its structure is not affected. Eqs. 30,31 are introduced because at the nanoscale (near the electrode surface where the electron transfer takes place) electroneutrality cannot be assumed and because there is not any supporting electrolyte (the conductivity of protons in the Nafion® is not infinite). Far from the compact layer, the system becomes electro-neutral.
The following boundary conditions are used to solve the differential equations. The bulk electrolyte is located at x = 0, where  and the concentration of H2 and CO at x = 0 are calculated by using Henry's law assuming Nafion® behaves like water. The scalar potential
  . At x = L, the boundary conditions are calculated by using the reaction rate:


(negative when it is consumed and positive when it is produced)

The boundary condition for Eq. 36 is given by  , where σ is obtained from Eq. 27. Then, Eq. 31 allows the calculation of
  , which, using Eq. 2, allows the calculation of the electronic potential
  in the catalyst.
Experimental Approach
Electrochemical characterization: self-oscillation
An 8 mm diameter sample of an ELAT® gas diffusion electrode (GDE) from BASF was used to perform the experiments. The Pt catalyst loading was 0.5 mg.cm−2. By using hot pressing method, a Nafion® NRE 212 CS membrane was bonded on the GDE at 150°C and 4 MPa to form the half membrane electrode assembly (MEA). The MEA was then placed in the sample holder and immersed in 0.5 M of H2SO4 liquid electrolyte with the membrane facing the electrolyte and the GDL in contact with the gold grid current collector to be the working electrode.
A three electrodes system was set up with a Pt mesh as the counter electrode and an Hg/HgSO4 reference electrode. The experimental setup used here has been shown in previous publication of our group.38 The three electrodes system was connected to a Bio-logic VMP2 potentiostat. The electrolyte was de-aerated by continuous bubbling of nitrogen gas. A galvanostatic experiment was carried out at 20 mA while a mixture of H2 and CO gases was fed to the working electrode. The experiments were carried out with 15, 30 and 45 ppm of CO.
Electrochemical characterization: PtCo catalysts Cobalt dissolution
Half MEA were prepared by depositing PtCo/Vulcan (De Nora North America E-TEK) catalyst ink on GDL 24 BC (SIGRACET®) to form the GDE, and followed by bonding a Nafion® NRE 212 CS membrane on the GDE using hot pressing method at 150°C and 4 MPa. The Pt loading was 0.4 mg.cm−2. The MEA were mounted in the same setup and conditions as mentioned above. To assess that Cobalt dissolution from the working electrodes is due to the effect of CO adsorption and not to chemical leaching and cyclic voltammetry at 20 mV.s−1 (CV), three experiments with different conditions for the same duration were carried out, i.e., galvanostatic experiment at 20 mA with a feed of H2 mixed with 50 ppm of CO gases, galvanostatic experiment at 20 mA with a feed of pure H2, and experiment under open circuit voltage (OCV) conditions with a feed of pure N2. Cyclic voltammetry were carried out on the samples between 0.05 to 1 V/RHE before and after the experiments except the third experiment which was always under OCV. The concentration of Co2+ that dissolved into the electrolyte were determined with ICP-AES on an iCAP 6500 (Thermo Scientific) after the experiments. The sample was also characterized by using BRUKER D8ADVANCE diffractometer in θ-2θ configuration, equipped with a LynxEye PSD detector and using Cu Kα1α2 X-ray radiation, ICP-AES « Activa » Jobin Yvon, HRTEM (JEOL 3010) working at 300 kV with a LaB6 filament and an objective lens with chromatic and spherical aberration of 1.3 and 0.6 nm respectively, and TEM (JEOL 2000FX) conventional microscope working at 200 kV, equipped with an X ray Energy Dispersive Spectrometer (EDS). The chemical analysis was performed on the CoKa line at 6.93 keV and the PtLa line at 9.44 keV.
Results and Discussions
Monte Carlo simulation
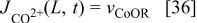
We have simulated the PtxCoy bimetallic catalyst particles using the Metropolis MC method. As a first approach we consider an extreme condition where the catalyst is under CO rich environment, which the catalyst was under full coverage of CO. The results of simulation are shown in Figure 4. The simulation results show that the CO adsorption on the truncated octahedron catalyst structure does not induce reverse segregation as observed in the case of PtRu where the Ru atoms are clearly being "pulled out" from the core of the catalyst.23 Particles with different composition and number of atoms (using the magic numbers18) were simulated and the same results were observed. It shows that the particle in which more Pt segregation on the surface is rather stable. Therefore, the number of available Pt sites is only proportional to the composition and particle size as shown in our previous results18 regardless of the CO coverage. The data obtained here were then coupled with the kinetic model to simulate different experimental observables. However, ones have to be noted that for geometrical structures or number of atoms other than those used in our simulation (i.e. magic numbers), PtxCoy particles may not be as stable as shown by our simulation results. Bao et al. have shown that H2 and O2 atmosphere are capable of reversibly changing the PtCo surface structure under ultra high vacuum.22
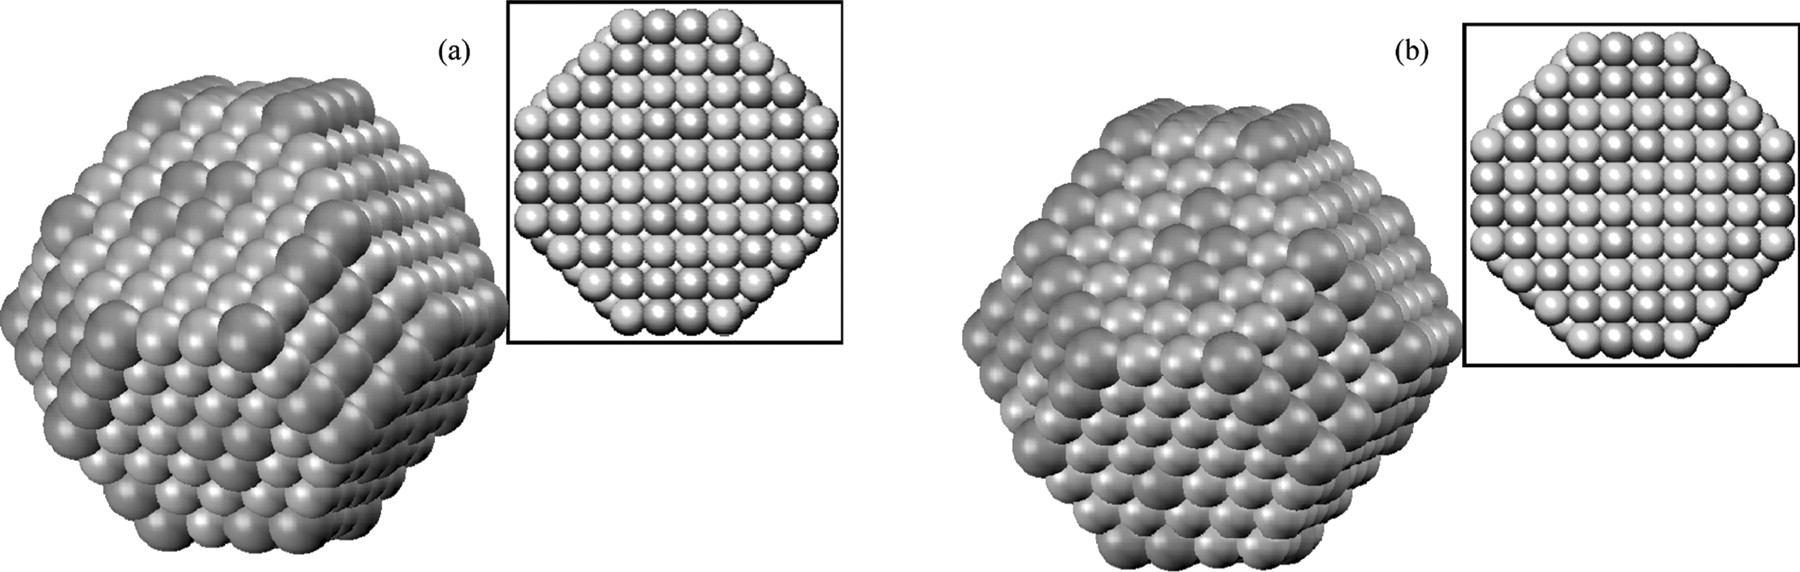
Figure 4. Simulated PtCo nanoparticle with the influence of CO (a), and without the influence of CO (b). Insets are the horizontal cut view at the center of the respective particles. The green atoms represent Cobalt and the grey atoms represent Pt.
Kinetic model simulation
The developed kinetic model is easily tuneable to take into account different sizes and compositions of PtxCoy catalysts. Besides, we are able to simulate the response of the catalysts in the context of a half cell. Simulations have been carried out with Pt catalyst as it is the conventional fuel cells catalyst. Then, the performance of Pt3Co and PtCo catalyst are evaluated in particular because the former has a Cobalt-core and Pt-shell structure while the latter has a rather homogeneous distribution of Pt and Cobalt atoms on the surface. These specific structures are believed to affect the CO tolerance and stability properties of the particles. Besides, these two compositions are commercially available on the contrary to other compositions.
Initially, simulations of the half cell anodic response under CO poisoning effect have been performed on Pt catalyst. The nanoparticles radius of Pt catalysts has been predetermined to be 2 nm and the half cell is operating at 298 K. The results are shown in Figure 5. It is clear that the Pt catalysts are seriously poisoned by CO. These results are well consistent with the experimentally known poisoning effect of CO on Pt nanocatalyst.2 However, when the potential of the half cell with Pt catalyst was simulated in galvanostatic conditions, a potential self-oscillatory behaviour was observed. As shown in Figure 6, the anode potential oscillates in the range of 0.18 V – 0.7 V under a constant current of 10 mA.cm−2 when H2 contains CO from 30 to 100 ppm. The observed oscillation amplitudes were rather constant after the onset of oscillations, in which was earlier for higher CO concentration. In the case with 16 ppm of CO, the anode potential increases but the poisoning is not enough to achieve oscillation, while oscillation was not observed in pure H2. Figure 6b is a detailed view of the results with 30 ppm of CO. It shows that the potential increases gradually from 0.18 V up to 0.7 V, and then abruptly drops down to 0.18 V in a periodical way.
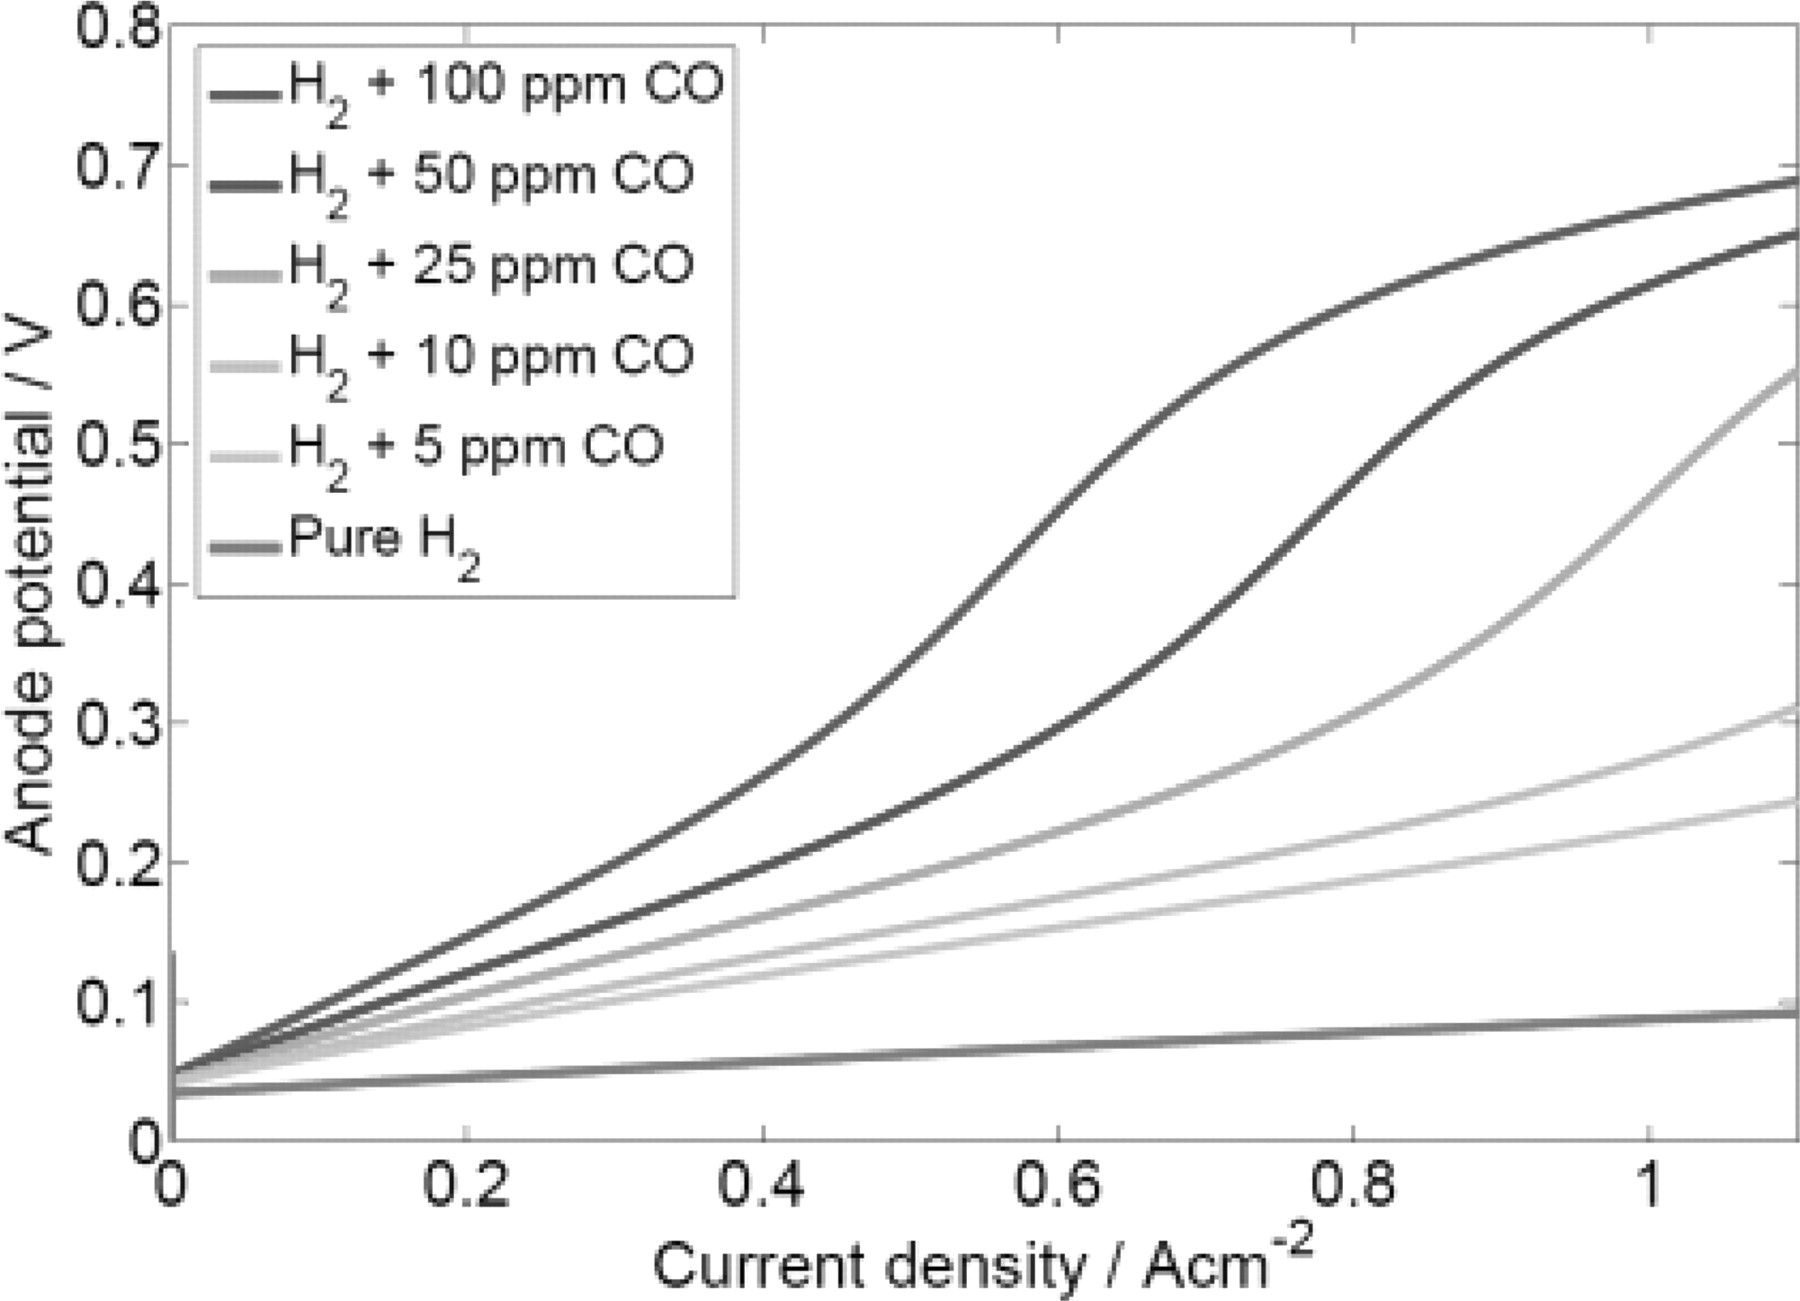
Figure 5. Anodic polarization curves of a half cell loaded with Pt catalysts with radius of 2 nm under the influence of different CO concentrations.
Figure 6. (a) Simulation results of potential of anodic half-cell with Pt catalyst under constant current of 20 mA (40 mA.cm−2) for different CO concentrations. (b) Detailed view of (a) for 30 ppm CO in H2.
Experiments on half cells under similar conditions were carried out in order to confirm the simulation results. The experiment results are shown in Figure 7. Qualitatively, they are in good agreement with our simulation results. As seen in Figure 7a, the potential self-oscillations start earlier for higher CO concentration,39 like in the simulation results (Figure 6a). The detailed behaviour of the oscillations is shown in Figure 7b, where the periodic gradual potential increases were followed by abrupt potential drops. The potential self-oscillatory behaviour under the poisoning effect of CO has also been reported elsewhere for bimetallic catalysts.40–42 Although there have been experimental results on potential self-oscillation reported elsewhere,43,44 we report here for the first time a model that is able to simulate this potential self-oscillatory behaviour on pure Pt catalyst.
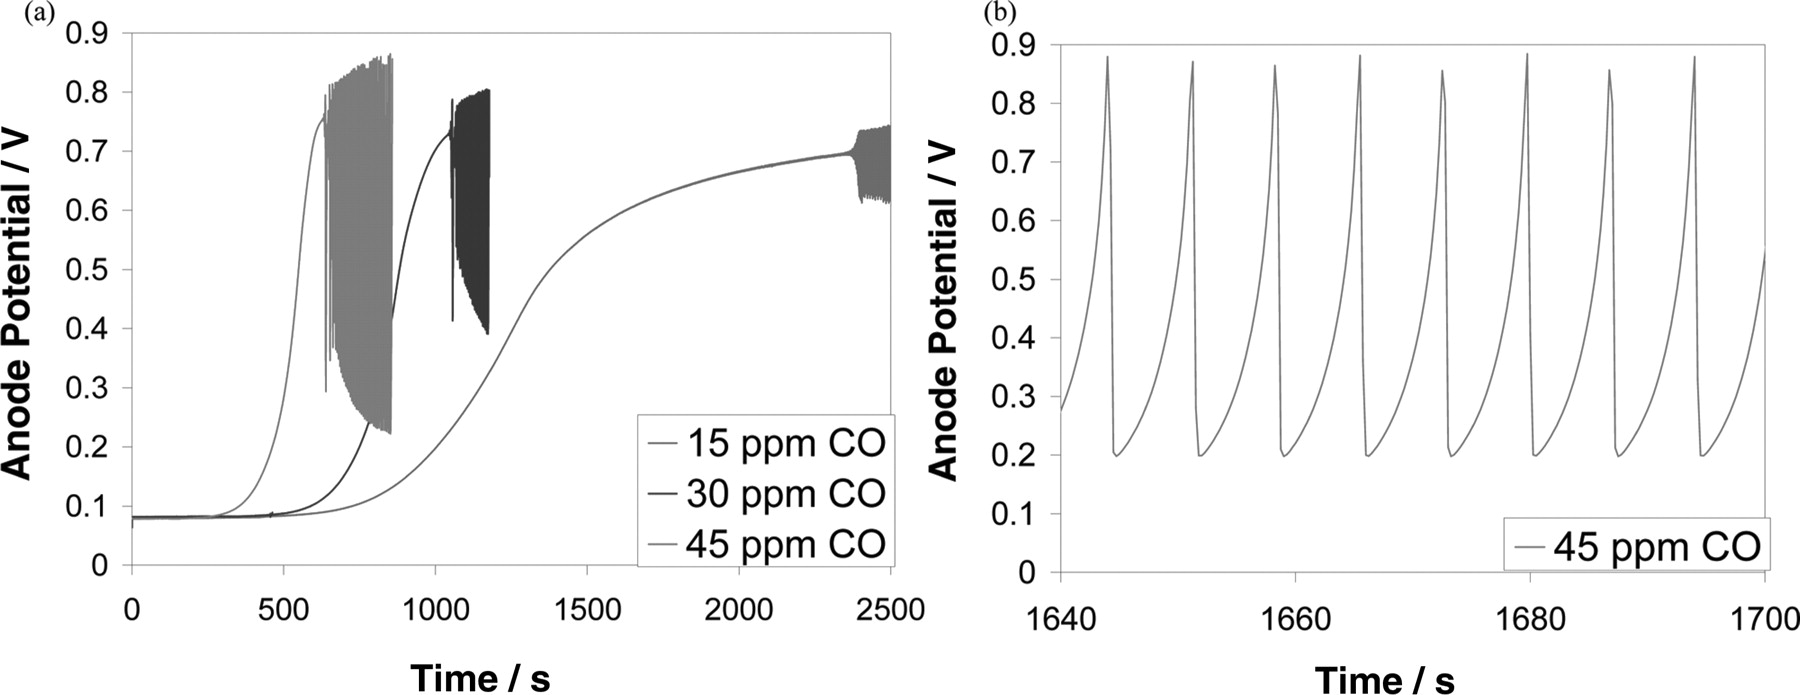
Figure 7. (a) Experimental measurements of the potential of an anodic half-cell with Pt catalyst with different concentrations of CO in H2 under constant current of 40 mA.cm−2. (b) Detailed view of (a) for 30 ppm of CO in H2.
The phenomenon of potential self-oscillations can be explained by considering the reactions 17,18. The increase of anode potential is due to the gradual poisoning of CO on the Pt catalysts (reaction 17). As a consequence, the availability of free sites for H2 oxidation to sustain the constant electrical current is consistently decreased. Therefore, the surface charge density equilibrium that can be achieved under pure H2 feed is disrupted. The non-equilibrium condition increases the surface charge density and thus increases the electrostatic potential drop across the compact layer, which is reflected in the continuous increase of anode potential, to enhance the HOR rate to compensate for the losses of reaction sites. Moreover, Eq. 19 has clearly shown that the adsorption rate of CO is proportional to its concentration where higher CO concentration resulted in higher poisoning rates. Thus, the onset of oscillation is the earliest for the highest CO concentration. On the other hand, the abrupt potential drop is due to the fast kinetics of CO electro-oxidation reaction 18 at high potential. A fast electro-oxidation of adsorbed CO recovers the free sites for HOR and thus decreases the anode potential in short instances. After that, CO is filling up the free sites that are available due to the electrooxidation reaction and raises the potential again. The continuous proceeding of the intermittent adsorption and electrooxidation processes resulted in the potential oscillation. The potential oscillation is indeed a system that is far from equilibrium as mentioned in the early work of Prigogine et al.45 A far from equilibrium system may develop instable, oscillation, waves or chaotic behaviour due to coupling of different reactions. Since CO contaminates Pt nanocatalysts and increases the complexity of reactions on PEMFC anode, this oscillation behaviour is not a surprising phenomenon.
Simulations were also carried out on Pt3Co bimetallic catalysts. The polarization curves are shown in Figure 8. Compared with Pt catalyst, the anode overpotential of Pt3Co does not exhibit big increment under H2 + CO feeds. According to our model, this is due to the decrease of CO adsorption Gibbs' energy as a result of Cobalt existence in the bimetallic. The presence of Cobalt reduces the adsorption energy of CO on Pt sites thus the coverage of CO is also reduced. Therefore, the decrease in free sites that brings to the increase of overpotential due to CO adsorption does not occur on Pt3Co catalyst as for the case of Pt. The result is corresponding to the certain experimental observations where Pt3Co catalyst exhibits higher CO tolerance properties.8,9,46
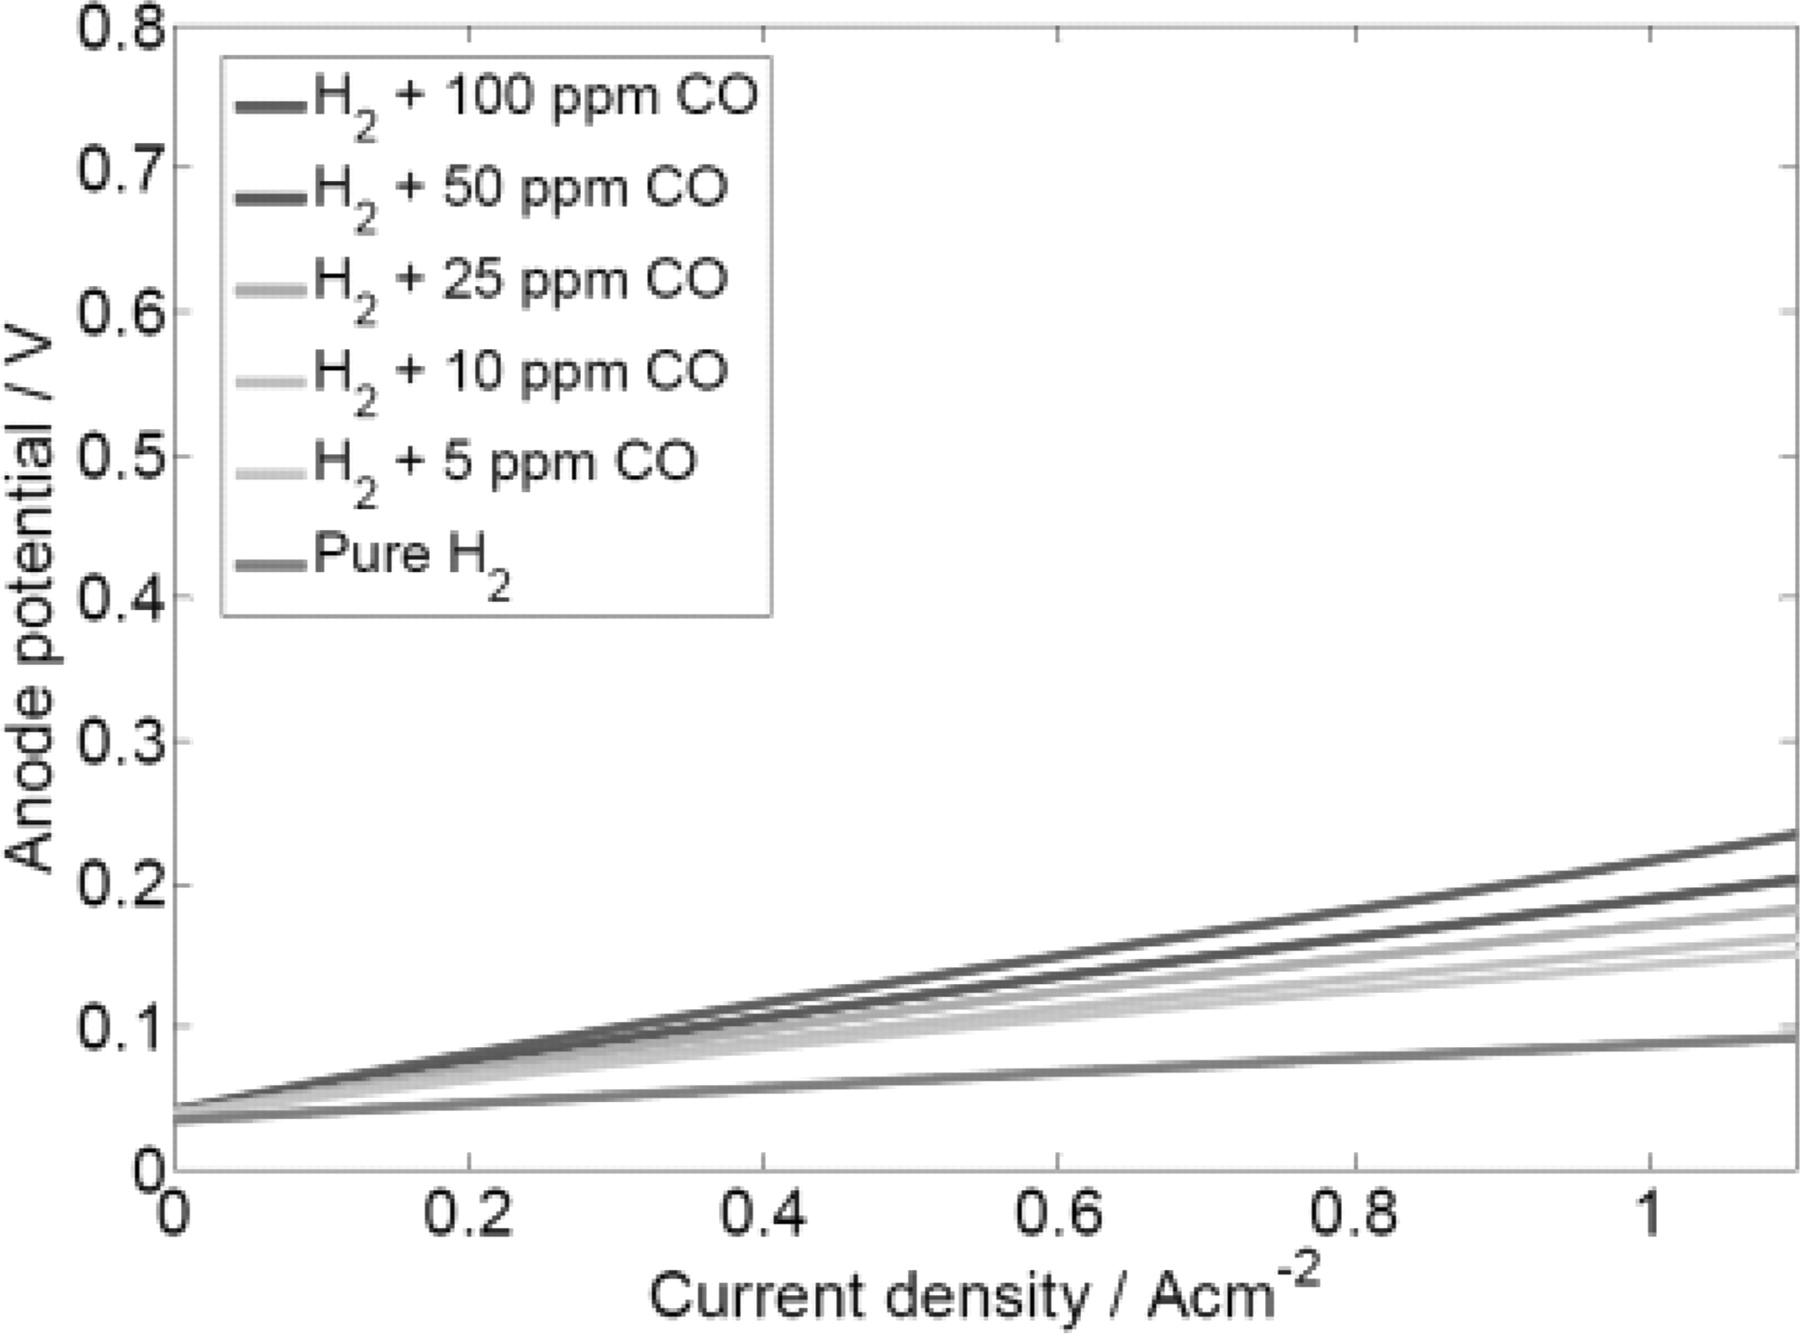
Figure 8. Anodic polarization curve of a half cell loaded with Pt3Co catalysts with radius of 2 nm under the influence of different CO concentrations.
PtCo and Pt3Co catalysts performances with H2 + 10 ppm CO gas mixture under galvanostatic condition were simulated and compared. With our model, we are able to investigate simultaneously the performance and durability of the half cell. The current density used for the simulation was 0.5 A.cm−2 and the catalysts particle size was fixed to be 2 nm. The results in Figure 9a show that the anode potential for Pt3Co is constant whereas a gradual anode potential increase is observed for PtCo catalyst. These observations are attributed to the differences in the stability properties between Pt3Co and PtCo catalysts. For Pt3Co, MC simulation shows that the particle has a Pt skin structure.18 The Cobalt atoms are "protected" from dissolving into the electrolyte due to oxidation, and maintain its CO tolerance property. As a consequence, the catalyst is not poisoned by CO and the anode potential remains constant. On the contrary, PtCo catalyst has surface Cobalt atoms which can be dissolved easily. The losses of Cobalt atoms due to oxidation have degraded its CO tolerance property. Therefore, CO poisoning is getting easier, which increases the anode potential. Although the performance of Pt3Co is stable (Cobalt dissolution is negligible) with particle size of 2 nm, our simulation results showed that Cobalt dissolution could be observed when the PtxCoy particle size is less than 1.5 nm as the Cobalt atoms statistically begin to be located on the surface.
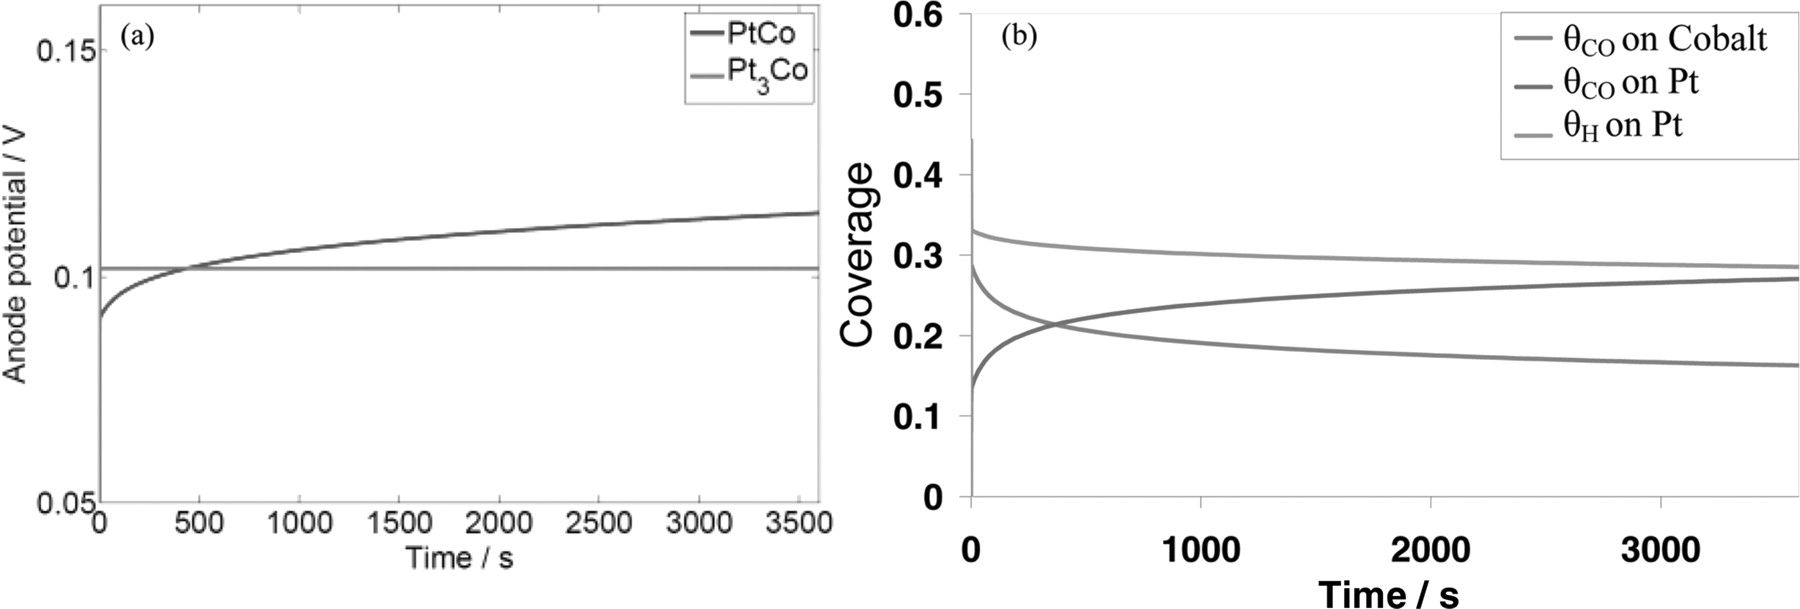
Figure 9. (a) Simulated anode potential for PtCo and Pt3Co catalysts for H2 + 10 ppm CO under 0.5 A.cm−2 constant current (b) The coverage of different adsorbed species (COad, Had) on PtCo catalyst (b).
PtCo catalysts were further investigated to understand the influence of CO poisoning on the Cobalt dissolution. As explained before, the Cobalt dissolution is a crucial phenomenon degrading the catalyst CO tolerance performance. Therefore, Cobalt dissolution needs to be limited. As seen in Figure 10a, Cobalt dissolution is lower for higher CO concentration in the short term. Nonetheless, an opposite behaviour was observed for a longer duration. The amount of Cobalt dissolved from the PtCo catalyst increases with the CO concentration as shown in Figure 10b. These contradicting behaviours can be explained by considering the CO coverage effect. At the beginning, CO is adsorbed on the catalyst surface. The result in Figure 9b shows that the CO is more preferentially adsorbed on the Cobalt, which slows down the Cobalt dissolution. This effect is more pronounced for higher CO concentration, as the CO coverage on the catalyst is higher. Thus, the initial Cobalt dissolution is lower for higher CO concentration. However, higher CO concentration leads to higher CO coverage on Pt and reduces the free sites that are required for the HOR to generate sufficient current. As a consequence, the electrostatic potential is increased and Cobalt is electrochemically dissolved. Thus, higher CO concentration will favour dissolution of Cobalt atoms at long term.
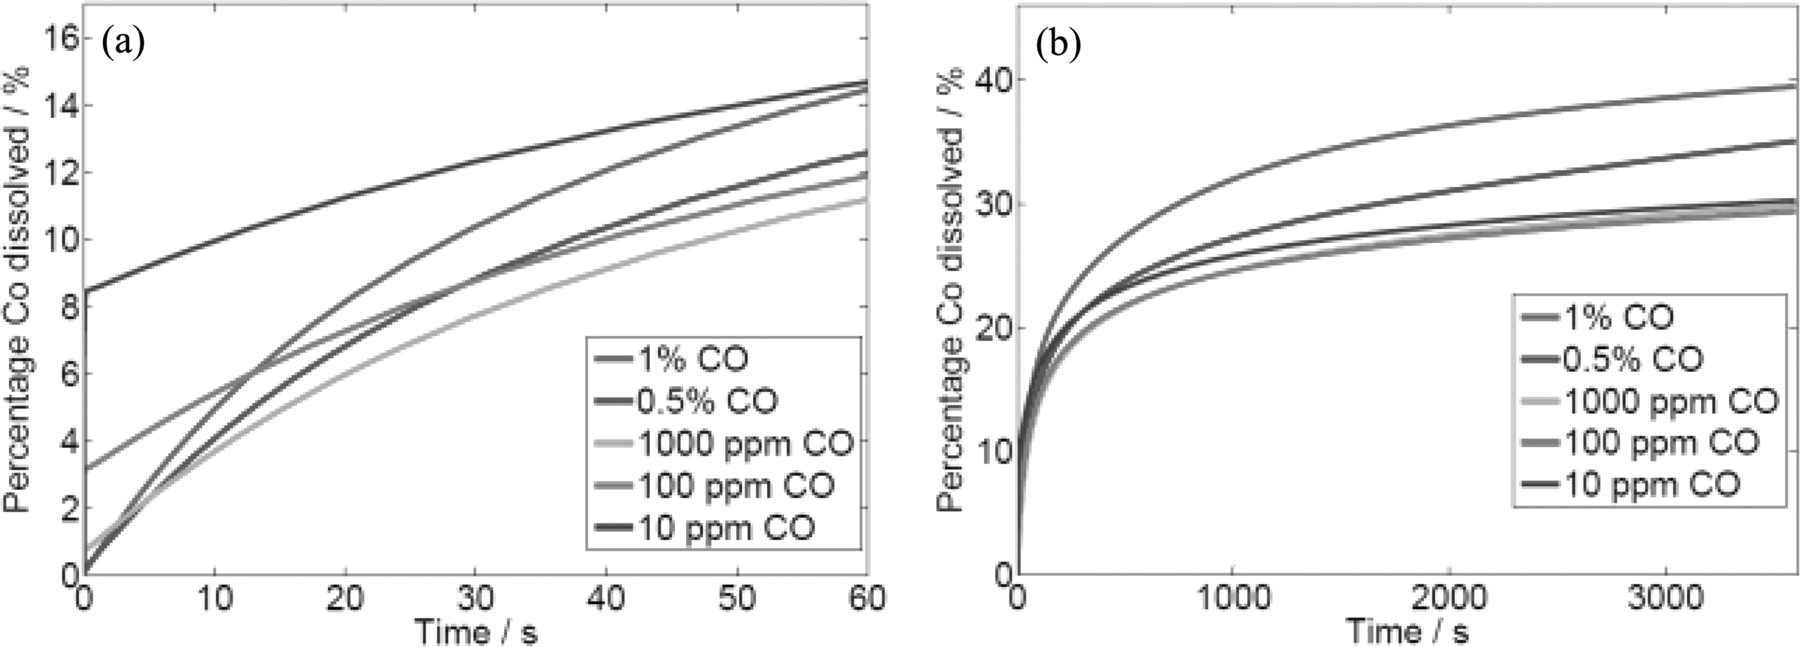
Figure 10. Percentage of Cobalt dissolved from PtCo catalyst versus operation time with H2 + CO mixtures, under 0.5 A.cm−2 constant current. (a) Simulated results for the first 60 s. (b) Simulated results for the long run.
Galvanostatic experiments (as described in the experimental section) have been carried out to verify the phenomenon of Cobalt dissolution enhancement due to CO poisoning. The PtCo catalyst used as sample has been characterized and the summary of results are shown in Table 2. The HRTEM results in Figure 11 show that the PtCo nanoparticles are rather homogeneous. We would like to emphasize that in the experiments, constant current has been applied to the samples instead of constant potential or potential dynamics as commonly found in the literature. Although the actual operation profile of a real PEMFC can vary substantially, the basic principle is that an external load, i.e., current is withdrawn from the PEMFC anode. Thus, galvanostatic experiments that were carried out are more representative of the actual operating conditions of PEMFC.
Table II. Summary of characterization results of PtCo/Vulcan sample used in the electrochemical half cell experiments.
| Methods | XRD | TEM-EDX | ICP |
|---|---|---|---|
| Composition | Pt75Co25 | Pt70Co30 | Pt45Co55 |
| Mean Particles size (nm) | 3.1 | 3.1 | − |
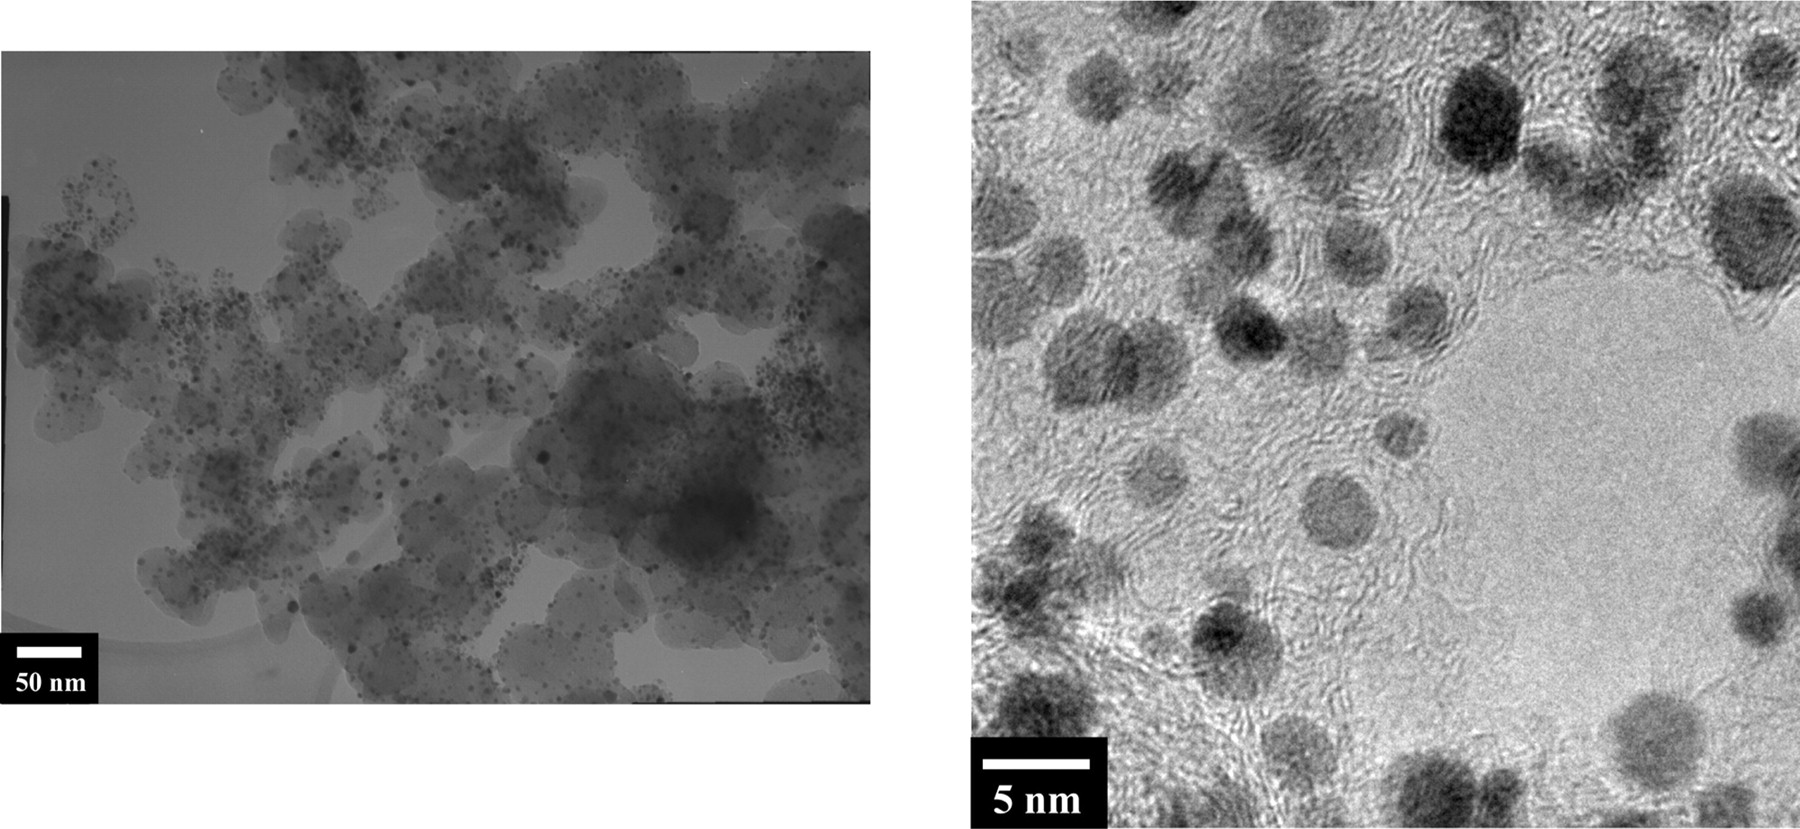
Figure 11. HRTEM images of PtCo nanoparticles used in the experiments to study the effect of CO on the Cobalt dissolution where (a) is low magnification, and (b) is high magnification
Aside from CO adsorption as shown by our model, there are two other common factors that can induce Cobalt dissolution during galvanostatic experiments. Cobalt can also be dissolved through chemical leaching by the acidic H2SO4 electrolyte and through electrochemical dissolution during the potential sweep of CV. In order to distinguish the three different factors, three experiments with the same setup have been performed. The first experiment started with CV in N2 followed by galvanostatic experiment under H2 gas containing 50 ppm of CO and finished with another CV. In the second experiment the same procedure was applied but pure H2 was used during the galvanostatic experiment. In the third experiment no electrochemical test was performed. Rather, the catalyst was left in the electrolyte and purged under N2 for the same duration as the other two experiments. Therefore, the amount of Cobalt dissolved into the electrolyte in the third experiment is solely due to chemical leaching. The additional amount of Cobalt that can be detected in the electrolyte in the second experiment with respect to the third experiment is thus due to the effect of CV and galvanostatic step. Finally, the difference in the detected amount of Cobalt dissolved in the electrolyte between first and second experiments is due to the CO enhancement effect.
The CVs of the experiments are shown in Figure 12 and the electrochemical area (ECA) are determined and shown in Table 3. The ECA is deduced from the underpotentially hydrogen deposition (Hupd) region (0-0.4 V/RHE), based on the total amount of charge obtained due to the desorption of the Had adsorbs on surface Pt. It is a common practice that the ECA is obtained by dividing the total charge with 210 μC.cm−2.17,47,48 For experiment using Pt single metallic nanocatalyst, this is a good approach to obtain the actual ECA. However, the method cannot provide accurate determination of ECA for PtCo bimetallic catalyst. As explained, this method relies on the Hupd. Since Hupd does not happen on the surface Cobalt atoms, the ECA determined with this method may differ by as high as 40% from the actual ECA depending on the nanocatalyst surface composition.49,50
Table III. Cobalt concentration in the electrolyte after experiment with different feed gas and conditions and the ECAs determined from the CVs in Figure 12.
| Feed gas | H2 + 50 ppm CO | Pure H2 | Pure N2 |
|---|---|---|---|
| Conditions | 20 mA | 20 mA | OCV |
| Cobalt concentration (mg/L) | 0.62 | 0.37 | 0.33 |
| Surface area (cm2) | 31 | 32 | − |
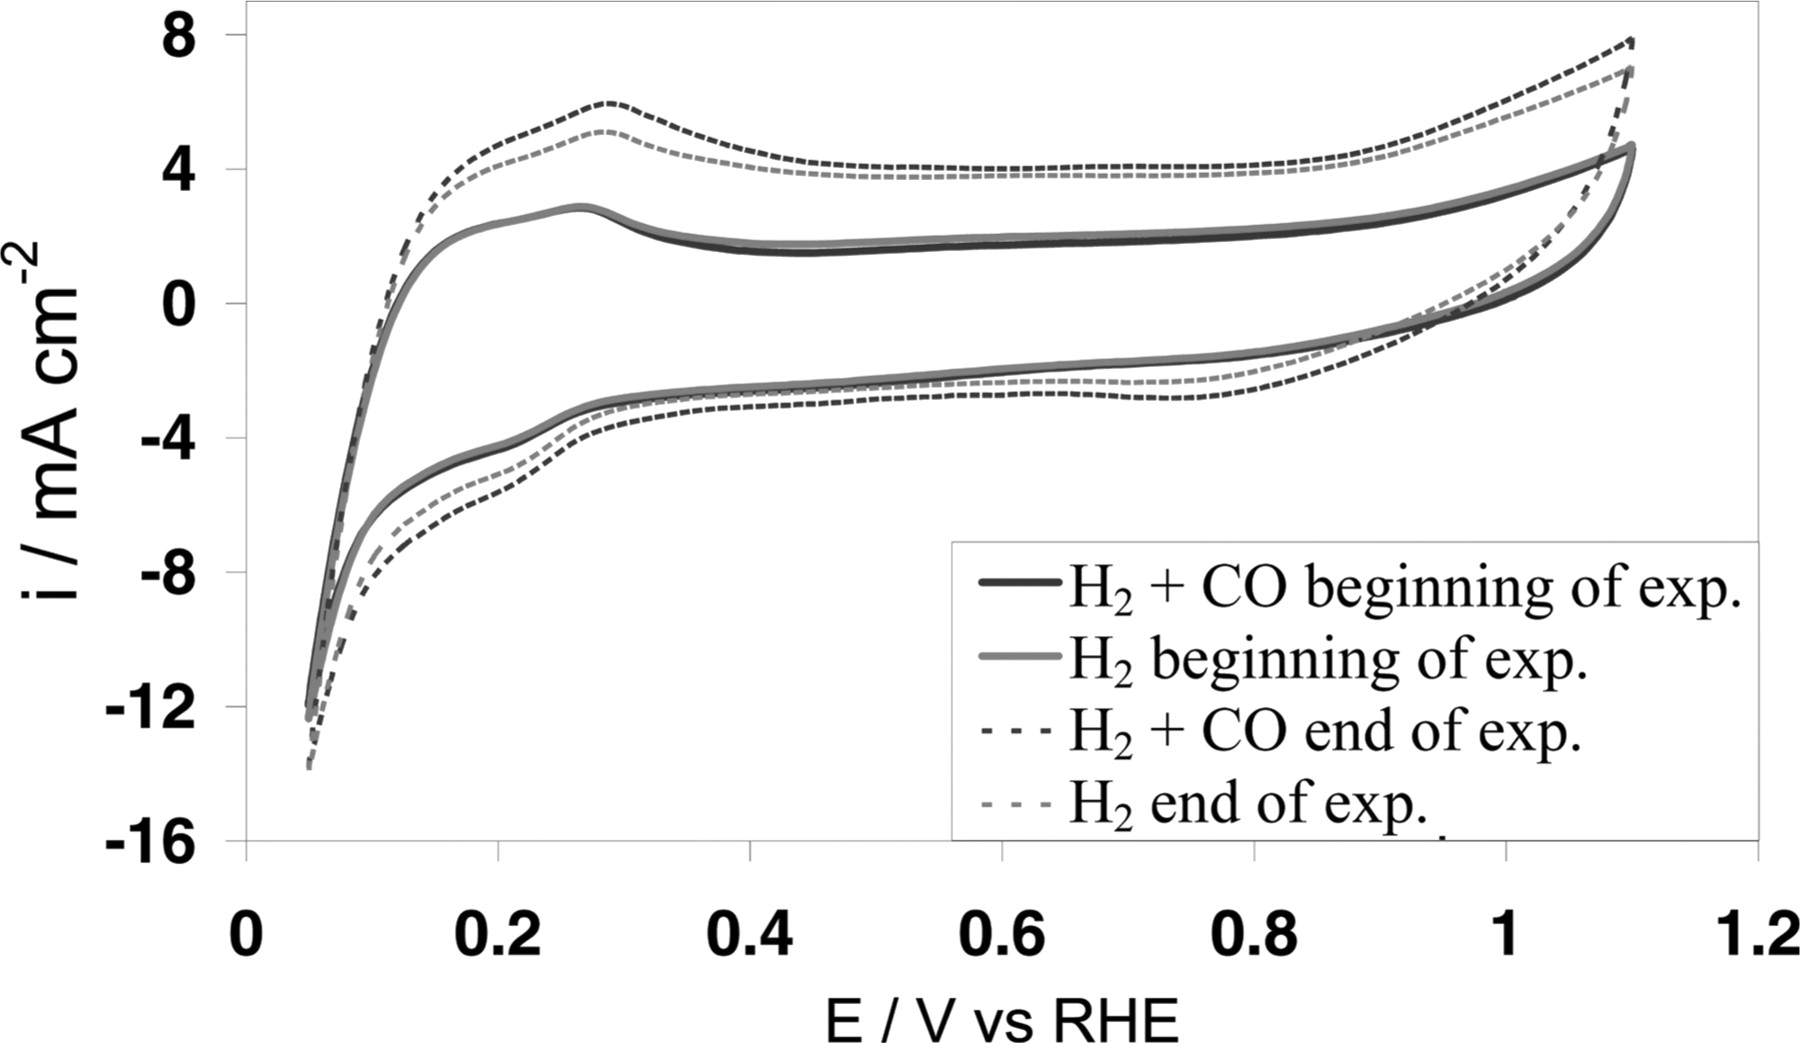
Figure 12. CV (20 mVs−1) of PtCo nanocatalyst before (solid lines) and after (dash lines) galvanostatic experiment. During the galvanostatic experiments, H2 comprises 50 ppm CO (blue) or pure H2 (red) was used.
Although there is a discrepancy between the real surface area and the surface area determined with Hupd, the method can be nonetheless used as a means to compare two samples using the same nanocatalyst. The surface area determined for the samples used in experiments is rather low considering the nanocatalyst loading of the samples. This is due to the inadequacy of the Hupd method as explained above. However it can be inferred that both samples have the same nanocatalyst loading based upon relative surface area measurements. This is further supported by the rather identical "beginning of experiment" CVs of the two samples. Although this argument cannot be considered for the sample used in the experiment under OCV, the reproducibility of the experiments allows to conclude that all samples have similar metal loadings.
The experiments results are also shown in Table 3. They show that the amount of Cobalt in the electrolyte is higher when the galvanostatic experiment was carried out with H2 containing 50 ppm of CO as feed gas, whereas Cobalt amount is lower for experiments, either under galvanostatic or under open circuit voltage (OCV) conditions, with pure H2 and N2 as feed gas respectively. Since the experiment under OCV did not go through any electrochemical test, the Cobalt dissolved to the electrolyte is solely due to chemical leaching. The amount of dissolved Cobalt in the electrolyte after the galvanostatic experiment with pure H2 is similar to the experiment at OCV under N2. This result shows that the chemical leaching in acidic solution is the main cause of Cobalt dissolution compared with the effect of CVs and galvanostatic step. In the experiment where 50 ppm CO is present in the gas feed during the galvanostatic experiment, the amount of Cobalt found in the electrolyte is much higher. Thus, the presence of CO has further enhanced the Cobalt dissolution in agreement with our modeling results.
The loss of Cobalt atoms from the PtCo nanoparticles surface can also be evident from the "end of experiment" CVs shown in Figure 12. The double layer capacitance at ca. 0.5 V/RHE is higher compared with the "beginning of experiment" CVs. This is due to the increase in surface roughness as a result of Cobalt atoms dissolution from the surface.50 There is apparently higher increase in surface roughness for the case where CO was present during the galvanostatic step. Thus, this is another evidence of the CO enhanced Cobalt loss from the PtCo nanoparticles. Nonetheless, the amount of Cobalt found in the electrolyte is not the absolute amount of Cobalt atoms lost from the PtCo nanoparticles since some of the Cobalt atoms are inevitably trapped by the membrane. However, the fact that the amount of Cobalt in the electrolyte varies is sufficient to prove that CO enhances Cobalt dissolution. Moreover, it is supported by the "end of experiments" CVs results as explained above.
The effect of enhanced Cobalt dissolution due to CO that has been demonstrated here may not be the major cause for anode catalyst degradation. Other operation conditions such as undergoing 0V to OCV or 0V to 1V cycles due to the anode filling with air during shut down has a larger impact on anode catalyst degradation. However the effect of CO induced Cobalt dissolution should not be overlooked since Cobalt is not stable due to its low oxidation potential. Besides, it has been shown by Uchida et al. that the degradation effects it further enhanced at 80°C, which is the common PEMFC operating temperature.8 We have managed to reproduce the experimental results. Thus, we have qualitatively validated our modeling trends.
Other parameters used in the simulation can be found in our previous publications.18,27,28,35 See Table 4.


Conclusions
We have studied the impact of CO adsorption on the intrinsic stability properties of PtxCoy nanoparticles under PEMFC anode operating conditions. First, Monte Carlo (MC) simulation has been applied to study the CO adsorption effect on PtxCoy nanostructure. Then, the MC results were coupled with an elementary kinetic model to simulate the effect of CO poisoning on the activity and durability of the PtxCoy nanoparticles as HOR catalysts. The results were compared with simulations carried out with Pt, where potential self-oscillatory behaviour was observed and experimentally confirmed. The PtxCoy HOR activity and stability properties reveal to be strongly dependent on the nanoparticle size and composition. For some nanoparticle sizes, simulations show that PtCo nanoparticles provide better CO tolerance than Pt3Co. Moreover, CO adsorption on PtCo slows down Cobalt dissolution in short-term operation as CO preferentially adsorbed on Cobalt. Nonetheless, in long-term constant current operation, CO adsorption on PtCo decreases the HOR activity on the catalyst and thus increases the electrostatic potential inducing in turn higher dissolution of surface Cobalt. Due to this Cobalt dissolution, the HOR activity with CO adsorption over PtCo degrades faster than Pt3Co in long-term operation. The CO induced Cobalt atoms dissolution phenomenon is verified by using electrochemical half cells. The experimental results showed that there are more Cobalt ions dissolving into the electrolyte when the hydrogen feed contains CO.
Acknowledgments
This work was partially funded by the French Research Agency (ANR) through the program PAN-H and within the context of the POLIMPAC project. The authors gratefully acknowledge Nicolas Guillet from LCPEM for his help and discussions for the experiments with half cells. The characterization work has been performed on the NanoCharacterization Center (PFNC) of Minatec Campus at CEA Grenoble.
List of symbols
| ψ(r, t) | Electrostatic potential at the metallic phase |
| Φ(L, t) | Electrostatic potential just outside the water adsorbed layer |
 | The electric permittivity of the diffuse layers. |
 | The electric permittivity of the compact layers. |
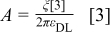
| ξ[3] | Riemann's zeta function |
| μ | Dipolar moment of water molecule |
| σ | Metallic surface charge density |
| kB | Boltzmann's constant |
| T | Temperature |
| d | Thickness of the water layer |
 | Volume fraction of free water molecule |
| nmax | Maximal quantity of free sites per unit of area |
 | Number of water molecules that have the dipoles oriented towards/opposed the metallic phase. |
 | Coverage of water molecules that have the dipoles oriented towards/opposed the electrode. |
| nM | Number of free site on Pt or Cobalt |
| kx / k−x | Rate constants of different forward /reverse reactions |
| Cx(L, t) | Instantaneous concentration of species x at x = L |
 | The nominal current |
 | The instantaneous active catalyst surface area |