Abstract
Lithium- and manganese-rich layered composite cathodes in the general form (Li2MnO3•LiMO2; M = transition metals), suffer from voltage profile suppression during cycling in Li-ion cells leading to overall gradual energy losses in the system. The suppression in cathode voltage which is called 'voltage fade' is a general phenomenon for these class of materials which needs to be understood and mitigated for enabling this chemistry in advanced Li-ion cells. Synthetic manipulation of the composition in 0.5Li2MnO3•0.5LiNi0.375Mn0.375Co0.25O2 (= Li1.2Ni0.15Mn0.55Co0.1O2 in layered notation) cathode material via aluminum and gallium substitution (max. 10%) via sol-gel reaction was completed and the voltage fade percentage was measured following a prescribed electrochemical testing protocol. While the specific capacities (∼ 250 mAh/g) are unaffected by the Al and Ga substitution (up to 5%), ∼3 to 4% of the impedance-corrected average voltage is still lost (first 25 cycles) which is comparable to what the pristine material experiences. This result suggests that the path of structural change that occurs in the material during Li cycling is unaltered by synthetic manipulation of octahedral and/or tetrahedral sites though the use of Al and Ga non-redox active cations.
Export citation and abstract BibTeX RIS

This is an open access article distributed under the terms of the Creative Commons Attribution 4.0 License (CC BY, http://creativecommons.org/licenses/by/4.0/), which permits unrestricted reuse of the work in any medium, provided the original work is properly cited.
Recently, lithium- and manganese-rich transition metal layered oxides (LMR-NMC) have received much attention as cathode materials for the next generation lithium-ion battery. They are composite structured materials consisting of nano-scale Li2MnO3 and LiMO2 (M = Ni, Mn, and Co) domains.1–4 These domains are crystallographically integrated to provide unique electrochemical properties that are different from those of the single-phase end members, Li2MnO3 and LiMO2.5 One of the advantages of LMR-NMC materials is their high energy density, which could meet the demanding requirements of cathodes for electric vehicle applications.6 While it varies according to composition, morphology, and synthesis methods, the typical specific capacity is well over ∼250 mAh/g with an average voltage of ∼3.8 V; the resulting energy density is more than ∼900 Wh/kg. In addition, the higher contents of inexpensive manganese over expensive cobalt and nickel in LMR-NMC can lower the material costs. In spite of good capacity retention property, however, the materials suffer from continuous suppression of equilibrium voltage which is called 'voltage fade' leading to overall gradual energy losses in the system.7 Furthermore, the unstable voltage profile that is changing with progressive cycles causes difficulty in the determination of state of charge and cell management; the voltage fade needs to be understood and mitigated for enabling this chemistry in advanced Li-ion cells.
The presence of voltage fade can be captured in depressing voltage profiles, and thus, a simple diagnostic method based on a qualitative comparison of voltage profile shapes after an extended number of cycles has been specifically used to evaluate the degrees of voltage fades in comparing materials.8–10 However, this practice requires meticulous attention to avoid misinterpretation of data, especially when the baseline electrode is not optimized, because a depression in the discharge voltage profile can be not only due to voltage fade (thermodynamic parameter) but also a rise in electrode impedance (kinetic parameter). The impedance of LMR-NMC electrodes increases rapidly with cycle number, and the rise becomes more significant compared to that originating from voltage fade at high cycle number.7,11 In addition, different specific capacities between samples can affect the degree of depression in the voltage profile. If two samples have different specific capacity, those samples will have different degrees of electrochemically induced structural stress. This difference will become exaggerated with progressive cycles since the difference in cumulative amounts of cycled Li ions will become greater. In order to address these difficulties in evaluating the voltage fade in different LMR-NMC cathode materials, Bettge et al. devised a test protocol.7 In this protocol, the voltage fade between samples is quantitatively compared by monitoring their iR-corrected average voltages within a limited number of cycles (typically ∼ 20), where most of the major structural rearrangement takes places. Using the cycling protocol, Bloom et al.12 evaluated the voltage fade of surface-modified LMR-NMC. Observing no significant effect on voltage fade from the surface modification, they suggested that the voltage fade is not related to a surface reaction but instead involves a structural transformation in the bulk.13
In layered LiMO2 (M = transition metals) cathodes, a cation substitution strategy has been used to stabilize the layered structure and improve cycling performance. For example, cations such as Al,14,15 Ti,15 Mg,15,16 and Mn17 have been substituted for Co to obtain stable high-voltage cycling performance of LiCo1-xMxO2. Cation substitution also stabilizes the layered structure of LiNi1-xMxO218–20 and LiMn1-xMxO2,21 resulting in improved cycling performance. For LMR-NMC cathode materials, earlier studies attempted a similar substitution strategy with cations such as Al,22,23 Cr,24 Mo,25 and Mg26,27 and determined the changes in morphology, structure, and electrochemical performance. However, they focused only on the apparent electrochemical properties of LMR-NMC, such as first-cycle irreversible capacity, cycle capability, and rate performance, and thus, the effect of cation substitution on voltage fade in LMR-NMC cathodes remains unclear.
In this study, we performed a systematic evaluation to determine the effect of cation substitution on the voltage fade for LMR-NMC cathode materials. We prepared a series of Al- or Ga-substituted Li1.2Ni0.15Mn0.55Co0.1O2 cathode samples by the sol-gel synthesis method and measured their electrochemical properties. Using the voltage fade testing protocol, we quantitatively compare the degree of voltage fade in pristine and cation-substituted samples and determine the effectiveness of Al or Ga substitution on suppressing the voltage fade.
Experimental
Electrode materials with nominal composition Li1.2Ni0.15Mn0.55Co0.1O2 (in composite notation, 0.5Li2MnO3•0.5LiNi0.375Mn0.375Co0.25O2) and cation-substituted samples were prepared by sol-gel reaction of metal acetates and glycolic acid in water solvent. Li(CH3COO)•2H2O (≥99.0%, Sigma-Aldrich), Ni(CH3COO)2•4H2O (≥99.0%, Sigma-Aldrich Co.), Mn(CH3COO)2•4H2O(≥99.0%, Sigma-Aldrich), and Co(CH3COO)2•4H2O (≥99.0%, Sigma-Aldrich) were dissolved in deionized water, and this solution was added to a continuously stirred aqueous solution of glycolic acid. For Al or Ga substituted samples, the required amounts of Al(NO3)3•9H2O (≥98.0%, Sigma-Aldrich) or Ga(NO3)3•xH2O (≥99.9%, Sigma-Aldrich) were added together with other lithium and transition metal precursors. After the solution pH was adjusted to ∼8 by adding ammonium hydroxide, the solution was evaporated at ∼75°C until a transparent sol and gel were obtained. The resulting gel precursor was decomposed at 400°C for 12 h in air and thoroughly ground for final heat-treatment at 850°C for 12 h in air. The transition metal ratio of the synthesized material was determined by inductively coupled plasma-mass spectroscopy (ICP-MS). The crystallographic structure was examined by X-ray diffraction (XRD) with CuKα radiation. The lattice parameter values were extracted by whole powder pattern decomposition, assuming space group R-3m. The particle morphology was studied by scanning electron microscopy (SEM), in a field emission gun instrument with imaging carried out at 2 keV.
Cathode electrodes were prepared from a slurry of 84 wt% active material, 8 wt% carbon (Super P-Li, Cabot Co.), and 8 wt% polytetrafluoroethylene (PVDF, Solvay). The slurry was coated on aluminum foil, and the dried laminate was calendared. Coin cells (2032 size) were prepared in an Ar-filled glove box (O2 < 10 ppm, H2O < 1 ppm). These cells included a lithium metal disc as the anode, 1.2 M LiPF6 in a mixture of ethylene carbonate and ethyl methyl carbonate (3:7 by weight) as the electrolyte, and Celgard 2325 (a polypropylene/polyethylene/polypropylene trilayer membrane) as the separator. Galvanostatic cycling was conducted at ambient temperature according to a cycling protocol developed to track voltage fade. The details of the cycling protocol are explained elsewhere.7 Briefly, the first cycle was conducted at the current rate of 10 mA/g in a voltage range of 2–4.7 V vs. Li for activation, and then the current rate was increased to 20 mA/g for the following cycles. From the second cycle onward, current interrupt measurements were carried out to estimate cell resistance at various voltages (3.5, 3.9, and 4.3 V during charge and at 4.0, 3.6, and 3.2 V during discharge). The current was stopped for 10 min, and the voltage differences were recorded to obtain the cell resistance (i.e., dV/dI). The average cell resistance (Ravg) was obtained from the three cell resistance values at each charge or discharge step. The overpotential, iRavg was then substracted from the average voltage (Vavg) to calculate resistance-corrected average voltage (Vavg,iR-corr). The relative voltage fade (VF) in different compounds was also used for the purpose of comparison. Specifically, the following equations were used in calculation of Vavg, Vavg,iR-corr, and relative VF for each charge or discharge step:
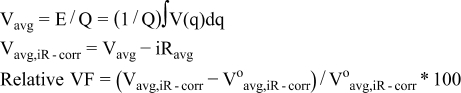
where, E: total energy, Q: Total capacity, V(q): capacity-dependent cell voltage, i: applied current, and Voavg,iR-corr: resistance-corrected average voltage at the second cycle.
Results and Discussion
Sol-gel synthesis
It is important, in the study of cation substituted LMR-NMC, to make sure that the substituting cations (here, Al or Ga) are homogeneously mixed with Ni, Mn, and Co. We prepared samples using sol-gel synthesis method that ensures good atomic mixing between multiple cations. In order to confirm the equivalence of the sol-gel synthesized samples, the electrochemical performance of the baseline Li1.2Ni0.15Mn0.55Co0.1O2 sol-gel material is compared with that of a commercial grade sample having the same composition (HE5050, Toda). Figure 1 shows the initial voltage profiles of the two samples. The overlapping voltage profiles indicate that the initial electrochemical characteristics (including activation of Li2MnO3 component) of the two samples are equivalent to each other. In Fig. 1b, the voltage fades in the two samples are compared by plotting the relative fade in the iR-corrected average voltages (Vavg, iR-corr) as a function of cycle number. The two samples show the same degree of voltage fade confirming the efficacy of employing our sol-gel method in the synthesis of cathode materials during the study of cation substituted LMR-NMC.
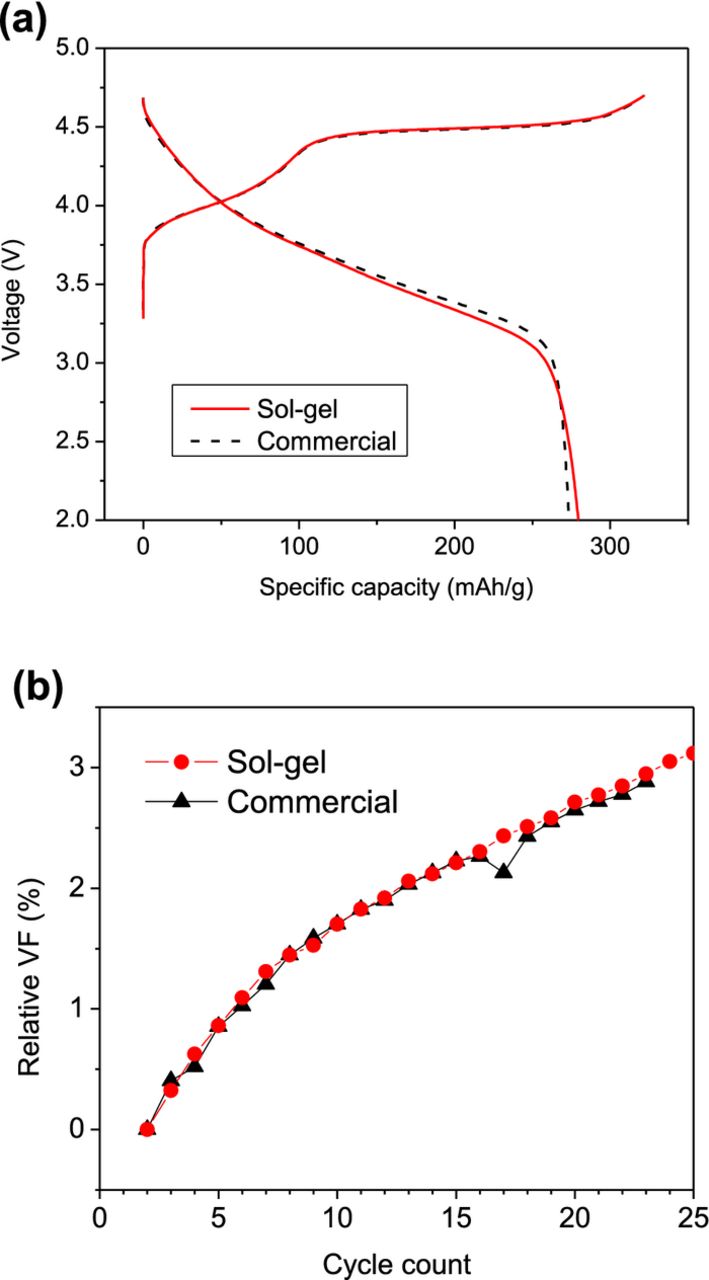
Figure 1. (a) Voltage profiles and (b) changes in iR-corrected average discharge voltage in sol-gel prepared and commercial (HE5050, Toda) Li1.2Ni0.15Mn0.55Co0.1O2 baseline samples.
Cation substitution
Two series of Al- and Ga-substituted Li1.2Ni0.15Mn0.55Co0.1O2 samples were prepared for this study. For each series, 2.5%, 5%, and 10% levels of substitutions were tried at the expense of the transition metals, Ni0.15Mn0.55Co0.1, in stoichiometric ratio. The target and actual compositions of the synthesized samples are summarized in Table I. The actual ratio of cations in each sample is similar to the nominal ratio. Although slightly lower than expected values, the actual percent substitutions of cations in samples are close to the target values. Figure 2 shows SEM images of the pristine and cation-substituted sample. The overall morphologies of all powder samples are similar, generally consisting of agglomerates. The size of agglomerates are less than 1 μm. The SEM analysis confirms that the cation substitution itself does not affect the particle morphologies.
Table I. Elemental analysis of cation-substituted Li1.2Ni0.15Mn0.55Co0.1O2.
| Cation ratio (Ni : Mn : Co : M) | |||
|---|---|---|---|
| Sample | Nominal | Actual (ICP-MS) | Actual percent substitution (%) |
| Al-0% | 0.15 : 0.55 : 0.1 : 0 | 0.150 : 0.539 : 0.111 : 0.000 | 0 |
| Al-2.5% | 0.14625 : 0.53625 : 0.0975 : 0.02 | 0.145 : 0.527 : 0.108 : 0.019 | 2.4 |
| Al-5% | 0.1425 : 0.5225 : 0.095 : 0.04 | 0.141 : 0.518 : 0.103 : 0.038 | 4.7 |
| Al-10% | 0.135 : 0.495 : 0.09 : 0.08 | 0.132 : 0.490 : 0.098 : 0.079 | 9.9 |
| Ga-0% | 0.15 : 0.55 : 0.1 : 0 | 0.150 : 0.540 : 0.110 : 0.000 | 0 |
| Ga-2.5% | 0.14625 : 0.53625 : 0.0975 : 0.02 | 0.147 : 0.524 : 0.111 : 0.018 | 2.2 |
| Ga-5% | 0.1425 : 0.5225 : 0.095 : 0.04 | 0.142 : 0.514 : 0.109 : 0.035 | 4.4 |
| Ga-10% | 0.135 : 0.495 : 0.09 : 0.08 | 0.135 : 0.490 : 0.102 : 0.073 | 9.1 |
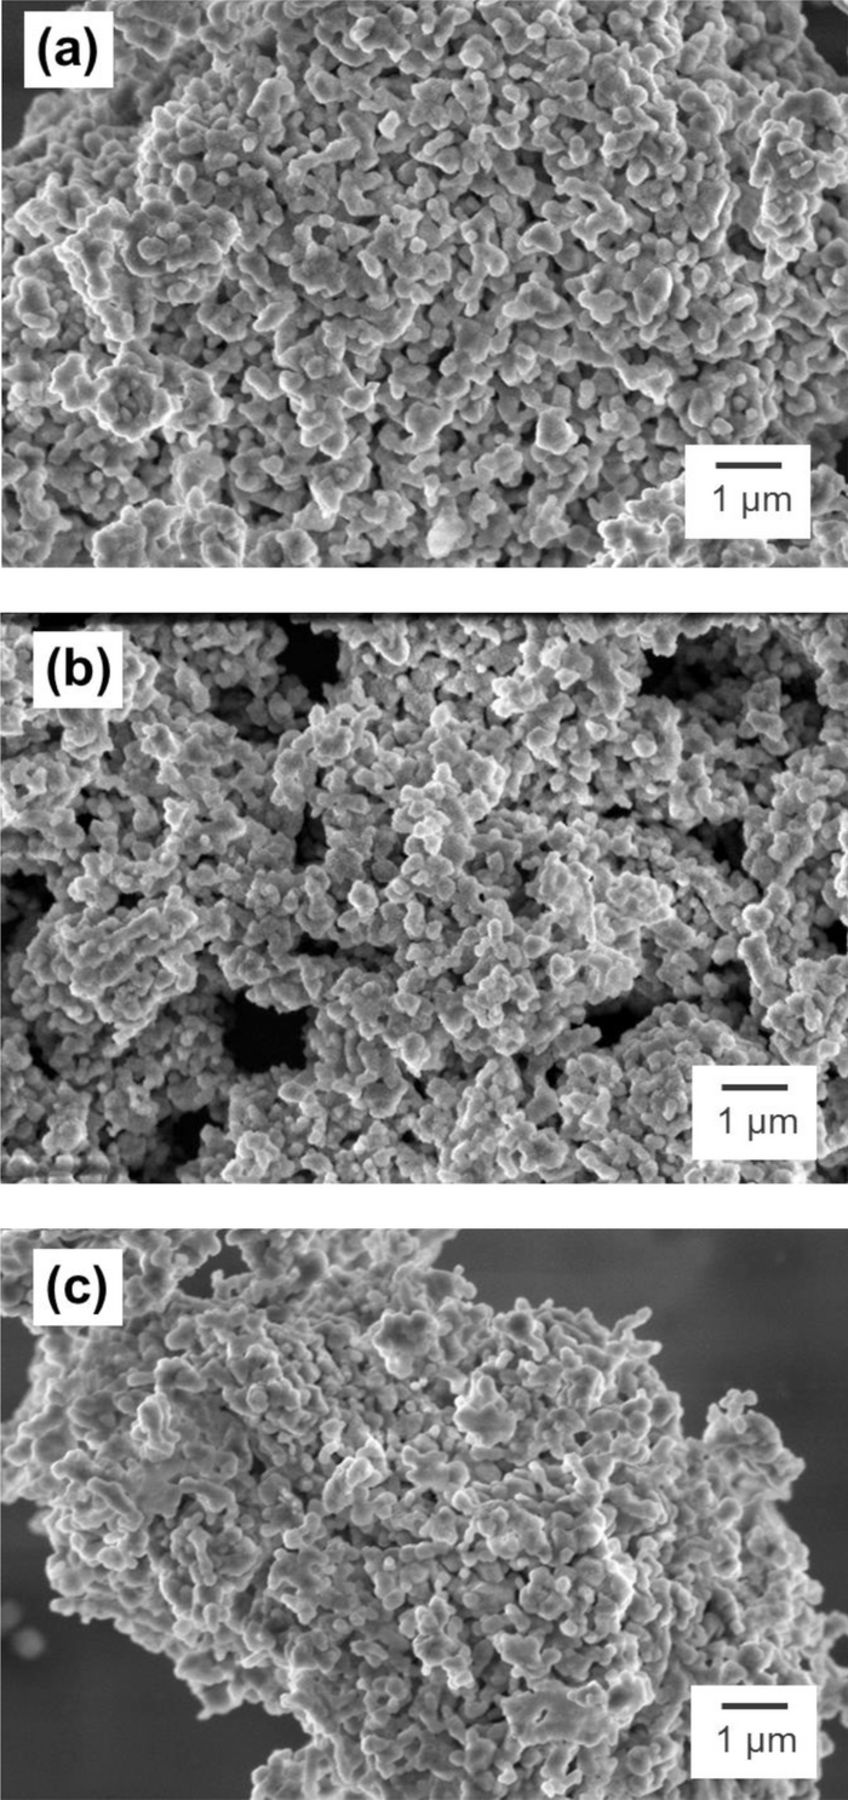
Figure 2. Particle morphology of (a) pristine Li1.2Ni0.15Mn0.55Co0.1O2, (b) 5% Al-substituted, and (c) 5% Ga-substituted powder samples.
Figure 3 shows typical XRD patterns for the Li-Mn-rich layered composite materials. They are indexed with the R-3m space group despite the appearance of the Li-Mn ordering super-lattice peaks at 20–22°. In Fig. 3a, the Al-substituted samples have no impurity phases up to 10% substitution. The Li-Mn ordering peaks become broader as the Al content increases, suggesting that the Li-Mn ordering is perturbed by the presence of Al in the transition metal plane. The Ga-substituted samples also present similar XRD patterns in Fig. 3b. However, small impurity peaks, which are assigned to LiGaO2 (JCPDS Card# 72–1640), are also observed with excessive 10% Ga substitution. Figure 4 plots the lattice parameter values as a function of percent cation substitution. The average lattice parameters of three pristine samples are presented as black square symbols with error bars. The 10% Ga sample, which contains an impurity phase, is marked as open triangles and excluded from further interpretation. The plots show that, as the Al contents increase, the lattice parameters decrease in both the a- and c-axis lattice parameters In contrast Ga substitution increases the lattice constants. The observed trends correspond well with the ionic radii of the substituted cations (rAl3+ = 53.5 pm and rGa3+ = 62 pm).28 The average ionic radius for the transition metals in the stoichiometric ratio, rNMC (NMC = Ni0.15Mn0.55Co0.1), is 56.2 pm;28 hence, the ionic radius of the cations increases in the order rAl3+ < rNMC < rGa3+ , indicating lattice contraction with Al substitution and lattice expansion with Ga substitution. This difference confirms the effective incorporation of the substituents into the parent lattice structure without formation of a significant amount of secondary phase.
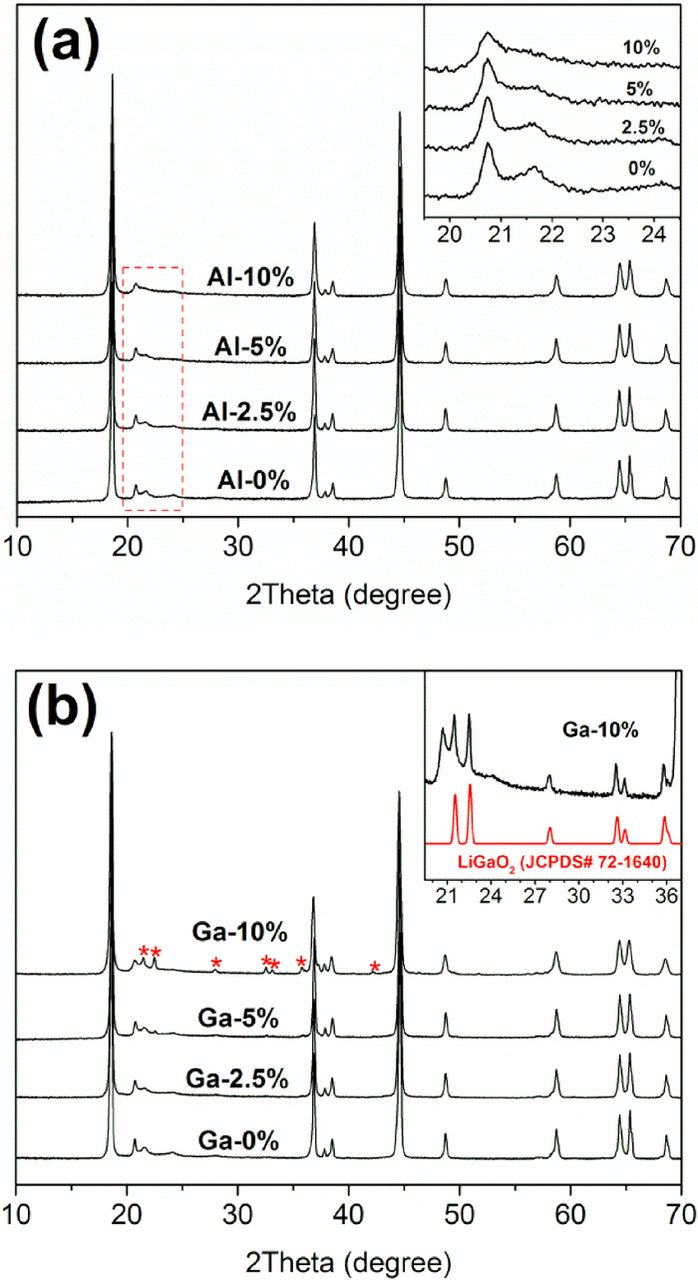
Figure 3. XRD patterns of (a) Al- and (b) Ga-substituted Li1.2Ni0.15Mn0.55Co0.1O2.
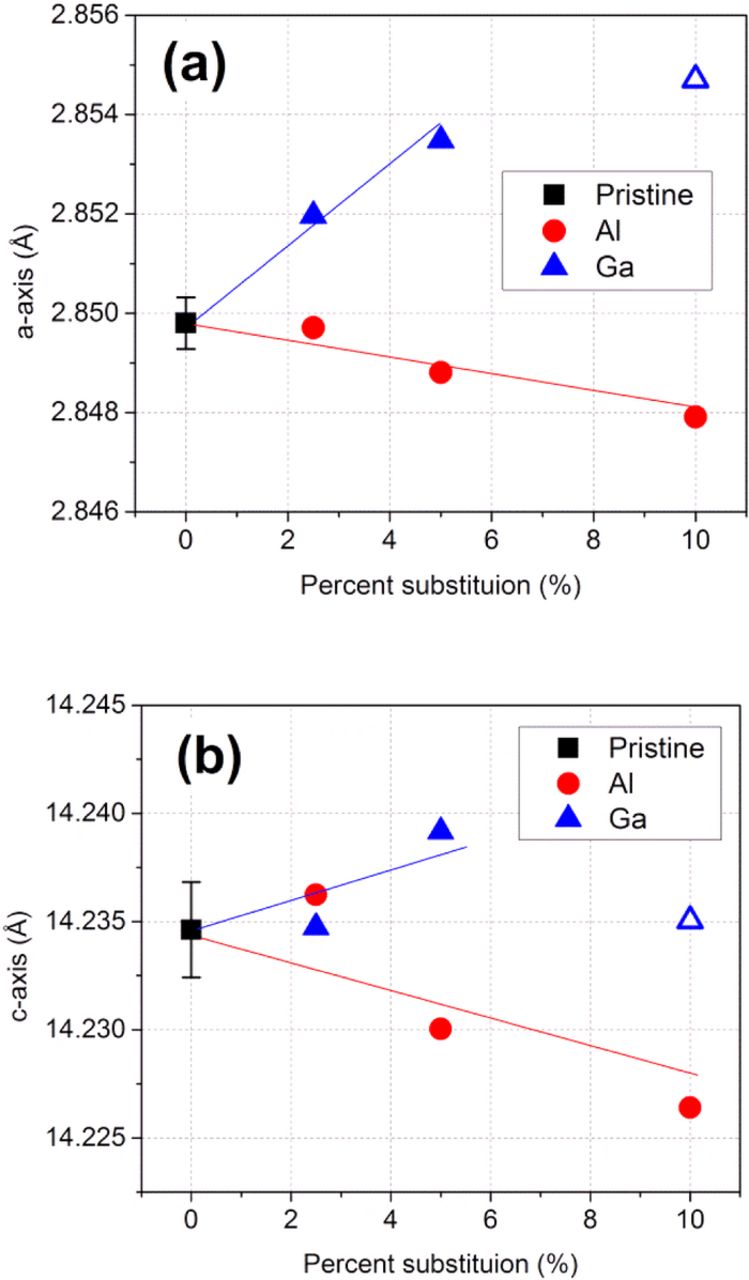
Figure 4. Plots of lattice parameters in (a) a-axis and (b) c-axis as a function of percent substitution of Al and Ga. For baseline data, three batches of pristine samples are used to obtain average lattice parameter values. The samples containing impurity phases (10% Ga) are marked with hollow symbols. Solid lines are for visual guidance.
Confirming effective substitution leads to another question whereby the Al or Ga is substituted within Li2MnO3 and NMC layered domains. In LMR-NMC, the Li2MnO3 domains are formed because of a strong ordering tendency for the Li+ and Mn4+ ions. Considering the relatively lower charge ordering effect between the Li+–Al3+ or Li+–Ga3+ ions, it is presumed that the Al and Ga ions may be substituted into the NMC layered domains instead of Li2MnO3 domains. Nevertheless, it should be noted that sophisticated calculations and experiments are required to determine the position of substituent cations, and this topic remains for a future study.
Electrochemical performance
Figure 5 shows the voltage profiles during the initial activation cycle for the cells with Al- or Ga-substituted cathode material. The voltage profiles are characterized by a long 4.5 V plateau on the 1st charge. While the detailed mechanism of the electrochemical activation process is not clearly understood yet, it is generally believed that oxygen loss and irreversible structural change occur in the plateau region.5,29–31 In Figs. 5a and 5b, the voltage profiles for the two pristine samples (no Al or Ga substitution) are identical. The initial charge and discharge capacities for the pristine samples are, respectively, 320 and 275 mAh/g. These values are comparable to the initial capacity of a commercial sample with the same nominal composition.7,12 The capacity decreases with increasing Al or Ga substitution. Previously, Whittingham et al.23 reported a decreasing capacity as Al substitution increases in Li1.2Ni0.16Mn0.56Co0.08-yAlyO2, which is similar to the composition used in this study. This reduction in capacity is consistent with the dilution of the redox-active cations by redox-inactive Al or Ga ions. The initial coulombic efficiency during the activation cycle decreases with increasing Al or Ga substitution. After the activation cycle, however, all of the samples show similar high coulombic efficiencies (> 99 %).
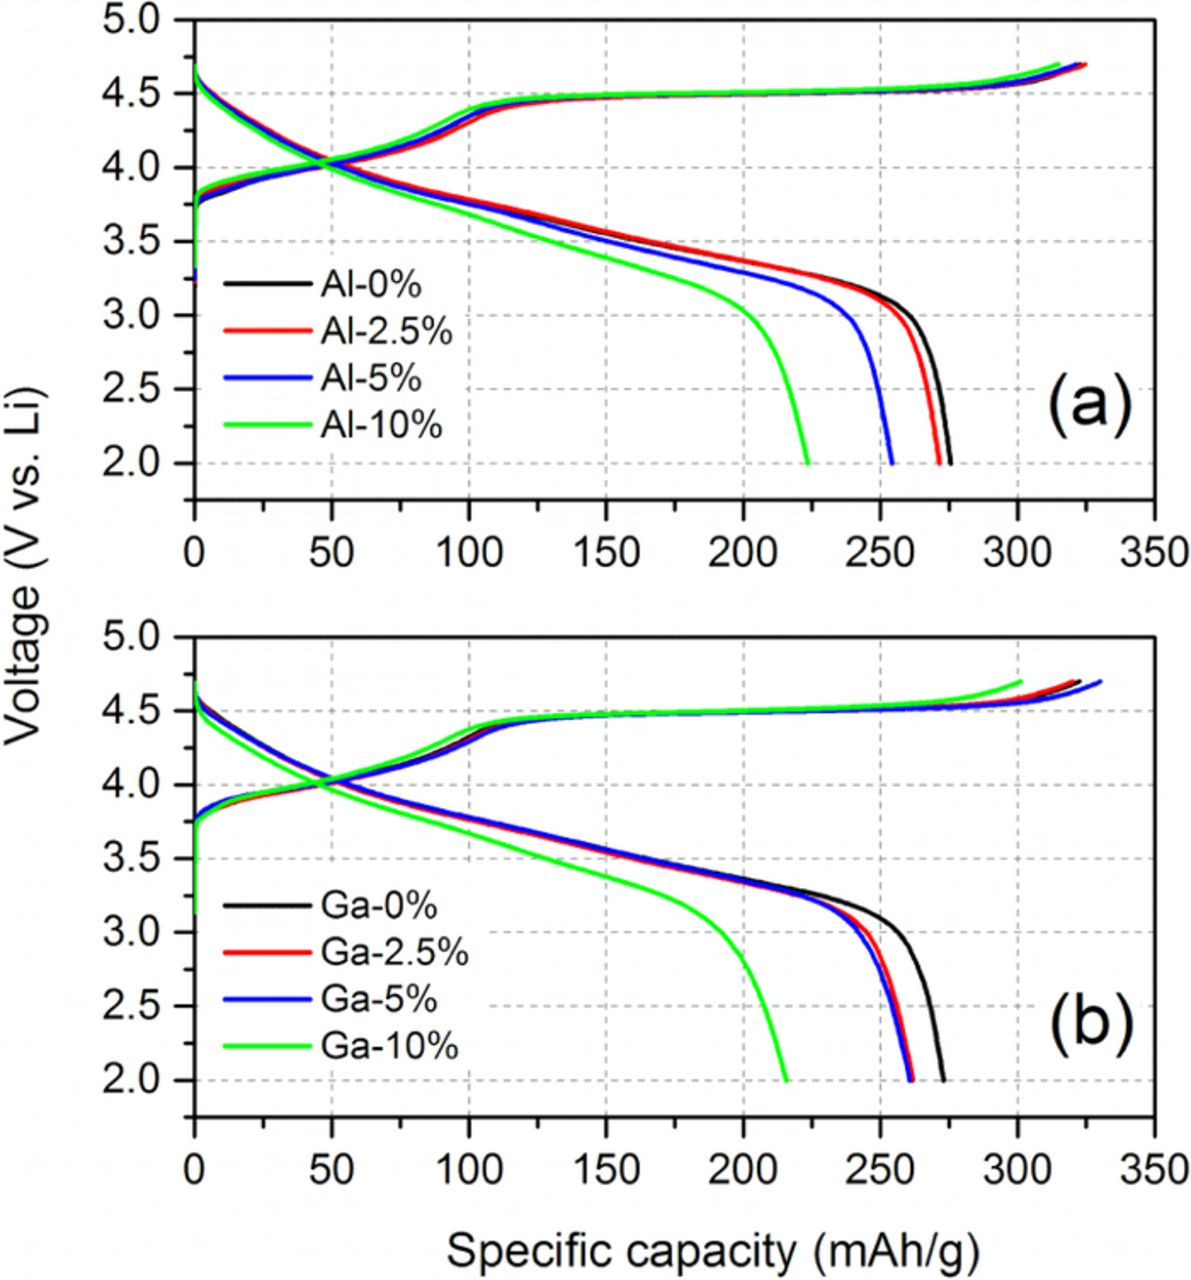
Figure 5. Initial voltage profiles of (a) Al- and (b) Ga-substituted Li1.2Ni0.15Mn0.55Co0.1O2. (Voltage window: 2–4.7 V vs. Li; current: 10 mA/g).
Figure 6 compares the discharge capacity as a function of cycle number. After the initial activation cycle (10 mA/g) the coin cells were repeatedly charged and discharged at 20 mA/g in the subsequent cycles. The abrupt drop in capacity between the 1st and 2nd cycle is due to the increased current density. In general, only a small change in cycle performance occurs with cation substitution. The specific capacity values for each sample at the 2nd and 20th cycles are compared in Table II. The pristine samples have ∼89% capacity retention after 20 cycles. The cation substitution shows only a marginal influence on the cycle performance within the cycle counts used here. The capacity retention slightly decreases with Al substitution to 87.7% for the 2.5% Al samples and 85.3% for the 5% Al samples. Several groups have reported a beneficial effect from Al2O3-coatings and Al-infused surface phase on the cycle performance of Li1.2Ni0.15Mn0.55Co0.1O2,11,12,32–34 in contrast to bulk Al-substituted samples found elsewhere22,23 and this work. Note, instead a slight increase in cycle performance is observed with Ga substitution (90.7% for 2.5% Ga and 92.8% for 5% Ga), which may be attributed to possible Ga atom surface segregation thus forming some sort of surface-protecting secondary phase.35
Table II. Specific capacity at the 2nd and 20th cycle number and percent retention.
| Specific capacity (mAh/g) | |||
|---|---|---|---|
| Sample | At 2nd cycle | At 20th cycle | Capacity retention (%) |
| Al-0% | 256.7 | 228.5 | 89.0 |
| Al-2.5% | 253.3 | 222.1 | 87.7 |
| Al-5% | 234.5 | 200.1 | 85.3 |
| Al-10% | 201.4 | 171.7 | 85.3 |
| Ga-0% | 256.5 | 227.7 | 88.8 |
| Ga-2.5% | 244.5 | 221.7 | 90.7 |
| Ga-5% | 242.6 | 225.1 | 92.8 |
| Ga-10% | 201.2 | 170.6 | 84.8 |
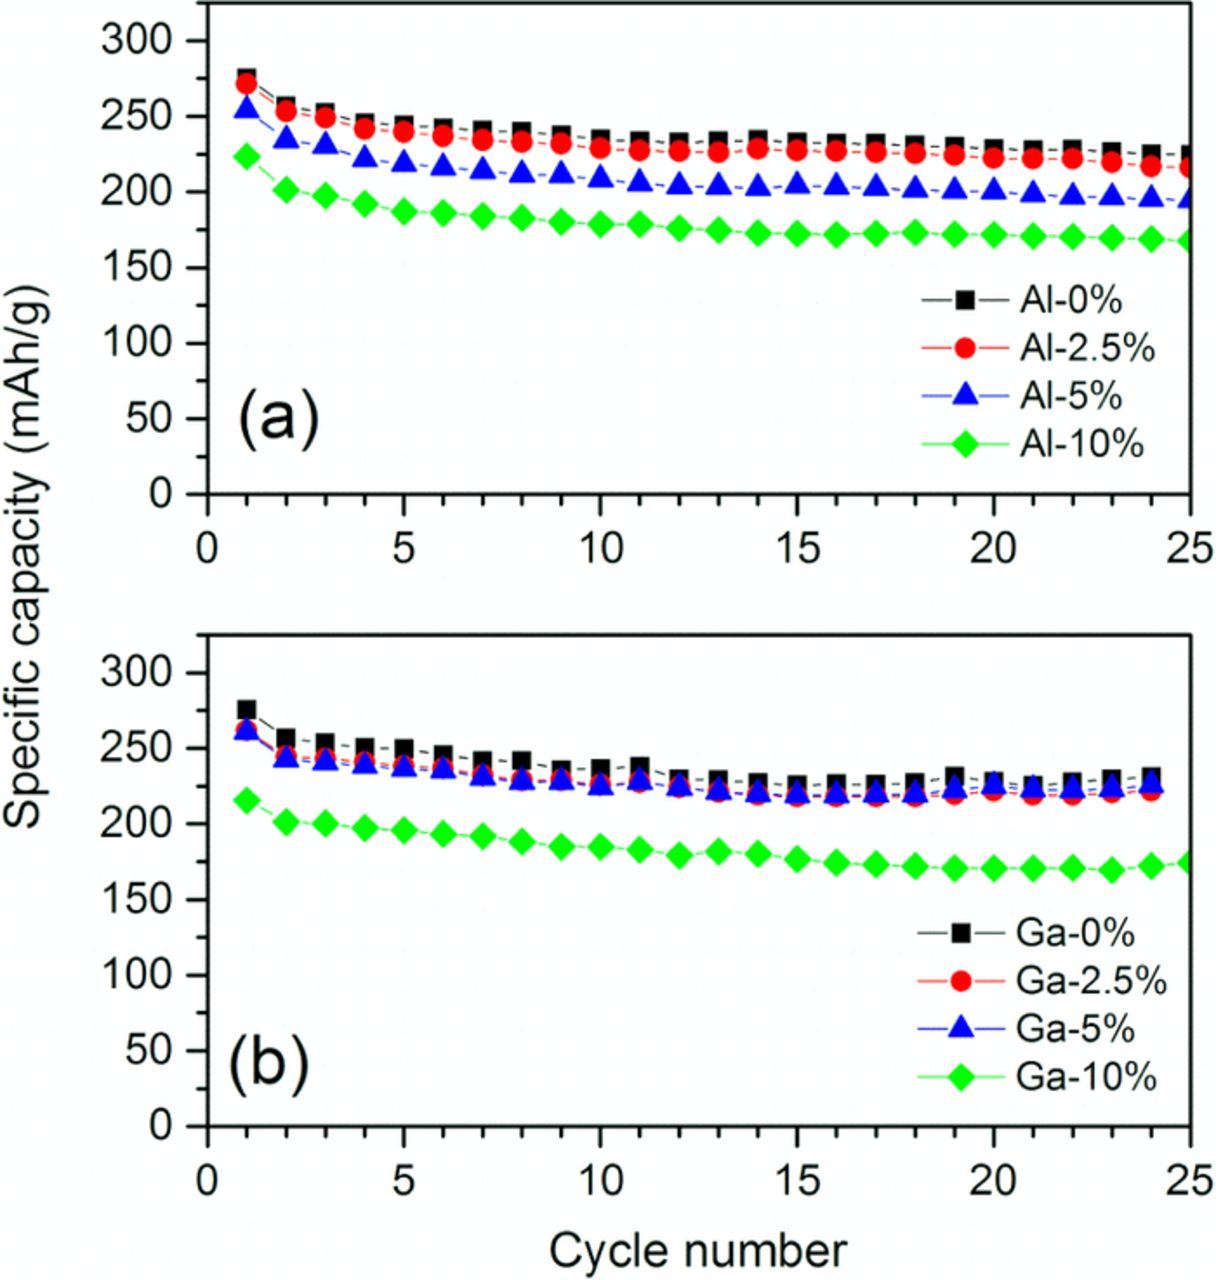
Figure 6. Capacity retention of (a) Al- and (b) Ga-substituted Li1.2Ni0.15Mn0.55Co0.1O2. (Voltage window: 2–4.7 V vs. Li; current: 10 mA/g for the 1st cycle and 20 mA/g for the following cycles).
Voltage fade
Voltage fade in these LMR-NMC cathodes effectively lowers the energy density (ED) over the lifetime of the battery. The question arises; what is the diagnostic feature for this ED change? Figure 7 depicts the normalized voltage profiles and differential capacity plots for the pristine and cation-substituted samples. In these voltage profiles, the capacities are normalized for each half-cycle to present changes in electrode potential more clearly. After the activation cycle (1st cycle, not shown here), all of the materials' voltage profiles exhibit a cycle-to-cycle depression in both charge and discharge. Note that the depression in charge curves is a better indicator for the voltage fade than that observed in discharge curves. Since the two major causes of energy density loss arise from cell impedance increase and voltage fade, the charge curve actually better represents the voltage fade phemomena. The two effects simultaneously depress the discharge curve, but are competing against each other in the charge curves: the impedance rise effect increases the over-potential pushing the charge curves to higher voltage, but the voltage fade lowers the equilibrium voltage for the charge process. Therefore, the observed depression in the charge voltage curves during cycling suggests that the voltage fade process is the main cause for the ED losses in the tested materials.
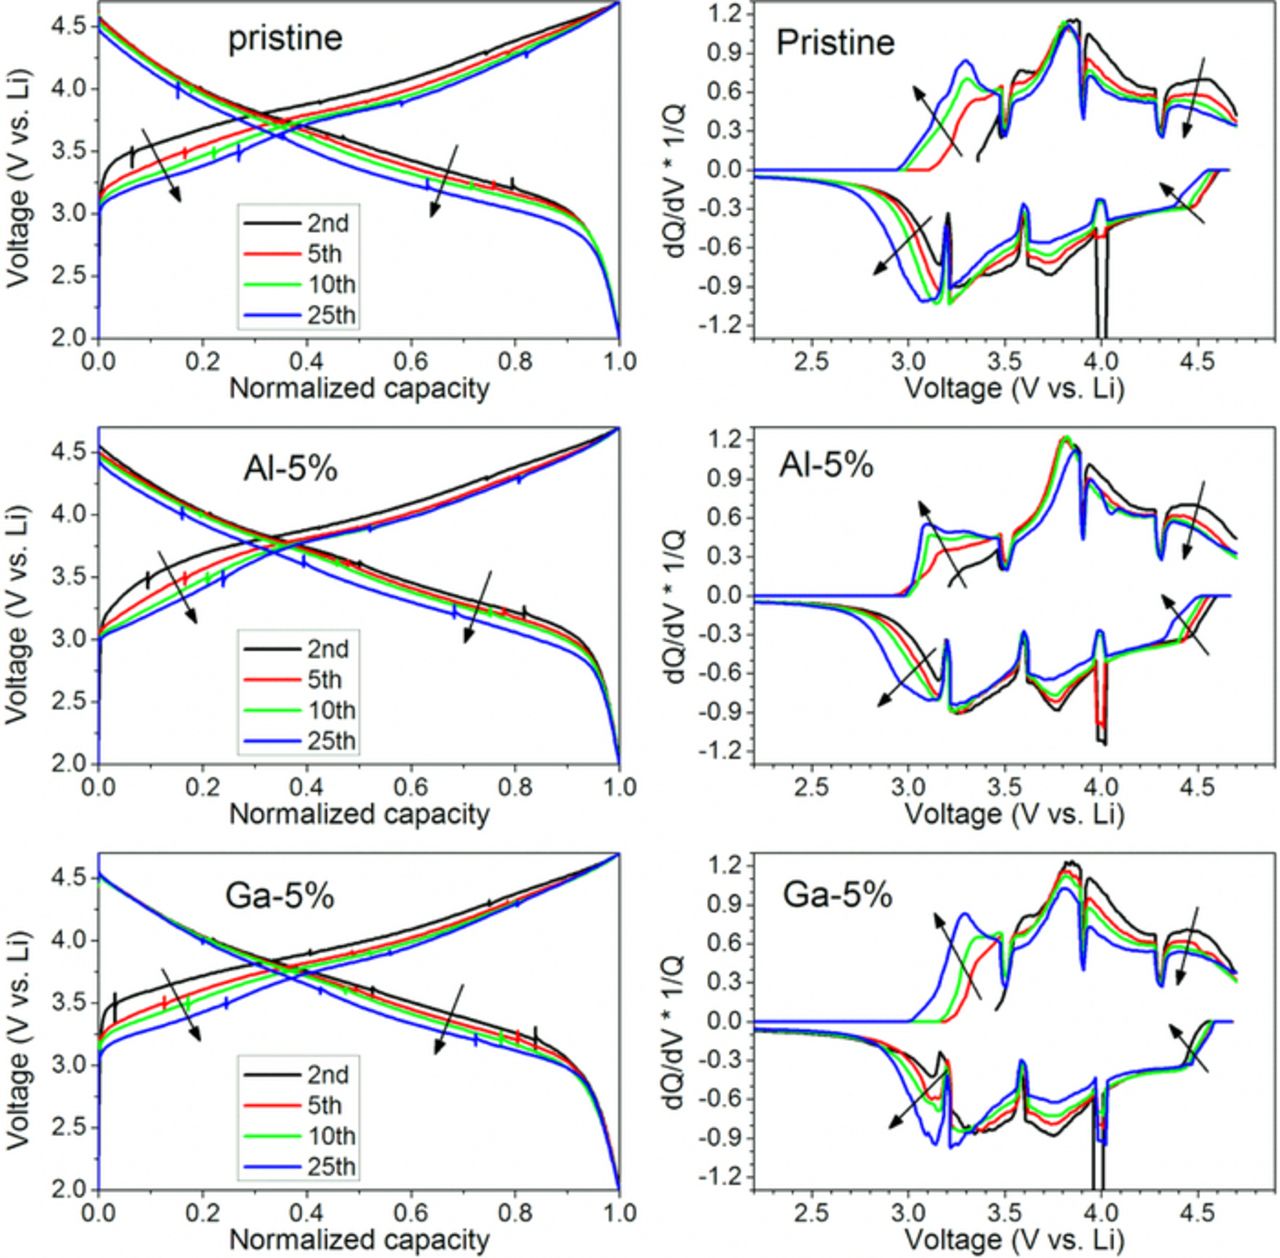
Figure 7. Normalized voltage profiles (left side) and (dQ/dV)*1/Q plots (right side) for pristine and cation-substituted samples. Arrows indicate the movements of the curves on progressive cycling.
The voltage fade is also noticed by the peak shifts in the differential capacity plots (dQ/dV*1/Q plots). During the first 25 cycles with the pristine material, the charge peaks at 3.0–3.5 V grow stronger and shift to lower potential, whereas the peak intensity decreases at 3.8–4.7 V. A similar behavior is observed for the corresponding discharge peaks. These irreversible changes in the differential capacity plots are interpreted in the literature7,13 as the transformation of an initial phase(s) that is redox active at high potential (> 3.5 V) into one or more redox-active phases located below 3.5 V. The phase change from layered-type to spinel-type structure has been proposed for LMR-NMC with experimental evidences by neutron diffraction methods.36–40 A redox process for lithium manganese oxide spinel-type material (Li1+x+yMn2-xO4; 0 < x < 0.1; y > 1) would typically appear at ∼3.0 V.41 Notably, the differential capacity plots for both Al and Ga substituted samples show similar shape changes as cycling progresses. However, a detailed comparison indicates cation substitutions may have some influence on the way the high-potential phases decay and the low-potential phases increase and evolve. In the 3.0–3.5 V region of the dQ/dV*1/Q curve during charge, each cation-substituted sample exhibits different doublet peak shapes after 25 cycles. While the pristine sample has a strong peak at ∼3.3 V with a shoulder peak at ∼3.1 V, the 5% Al sample clearly exhibits faster growth for the ∼3.1 V peak, leading to a different dQ/dV*1/Q curve shape in the 3.0–3.5 V region after 25 cycles. In contrast, the growth of the ∼3.1 V peak seems suppressed for the 5% Ga sample.
The effect of Al and Ga substitution on voltage fade of Li1.2Ni0.15Mn0.55Co0.1O2 was quantitatively evaluated by comparing the changes in resistance-corrected average voltage (Vavg, iR-corr). We excluded the 10% Al and 10% Ga samples from this evaluation to avoid any biased conclusion that might arise from the much lower specific capacities of those samples. The different specific capacity values (hence, the different cumulative amounts of cycled lithium ions) imply different levels of structural stress imposed on the different cathode materials. Furthermore, only the Vavg, iR-corr values within the initial 25 cycles are considered because (1) major structural relaxation followed by the initial activation process is manifested within early cycles, (2) impedance effect becomes more dominant at longer cycle numbers, and (3) even a small difference in specific capacity values or cycle capability could cause a significant difference in the cumulative amounts of cycled lithium ions after a greater number of cycles. Figure 8a shows plots of Vavg, iR-corr vs. cycle number for the Al-substituted samples. The Vavg, iR-corr continuously decreases as cycle number increases. For the pristine sample (no Al) after 20 cycles, the value drops by 151 mV during charge and by 101 mV during discharge. The plot of relative voltage fade in Fig. 8b does not reveal any beneficial effect from Al substitution in Li1.2Ni0.15Mn0.55Co0.1O2, showing similar percent voltage fade of ∼3.8% during charge and ∼2.8% during discharge. In contrast, the Ga substitution plots in Fig. 9 a appear to show some influence on the charge voltage decays; the average charge voltages for the Ga-substituted samples are slightly higher than the pristine (0% Ga) sample data. This effect is better represented in the relative voltage fade plot in Fig. 9b. During the initial 20 cycles, the relative voltage fade for 2.5% and 5% Ga samples is, respectively, 3.3% and 3.1% on charge, which is lower than that of 0% Ga sample (3.8%). This suppression of voltage drop echoes the suppressed dQ/dV*1/Q peak at 3.1 V, as shown in Fig. 7.
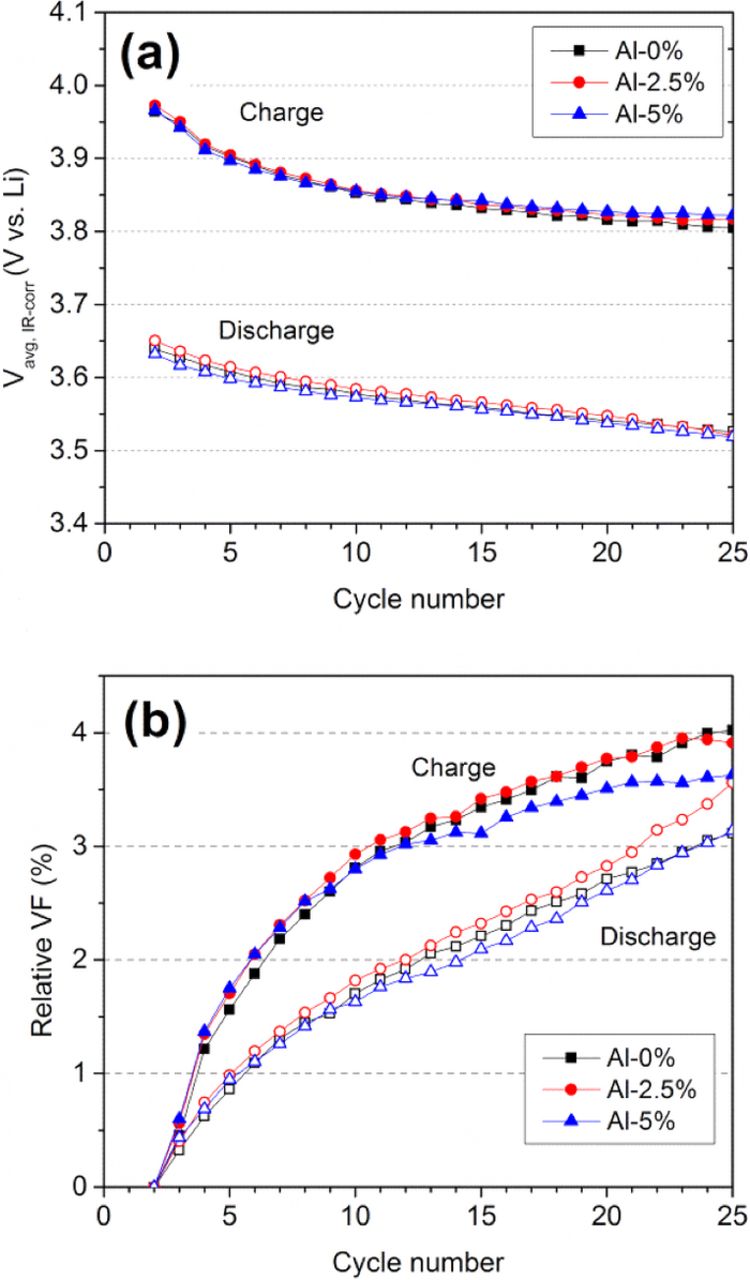
Figure 8. Plots of (a) iR-corrected average voltage (Vavg, iR-corr) and (b) relative voltage fade (VF) as a function of cycle number in Al-substituted Li1.2Ni0.15Mn0.55Co0.1O2. The relative voltage fade is defined as the percent decay in Vavg, iR-corr relative to Vavg, iR-corr at 2nd cycle.
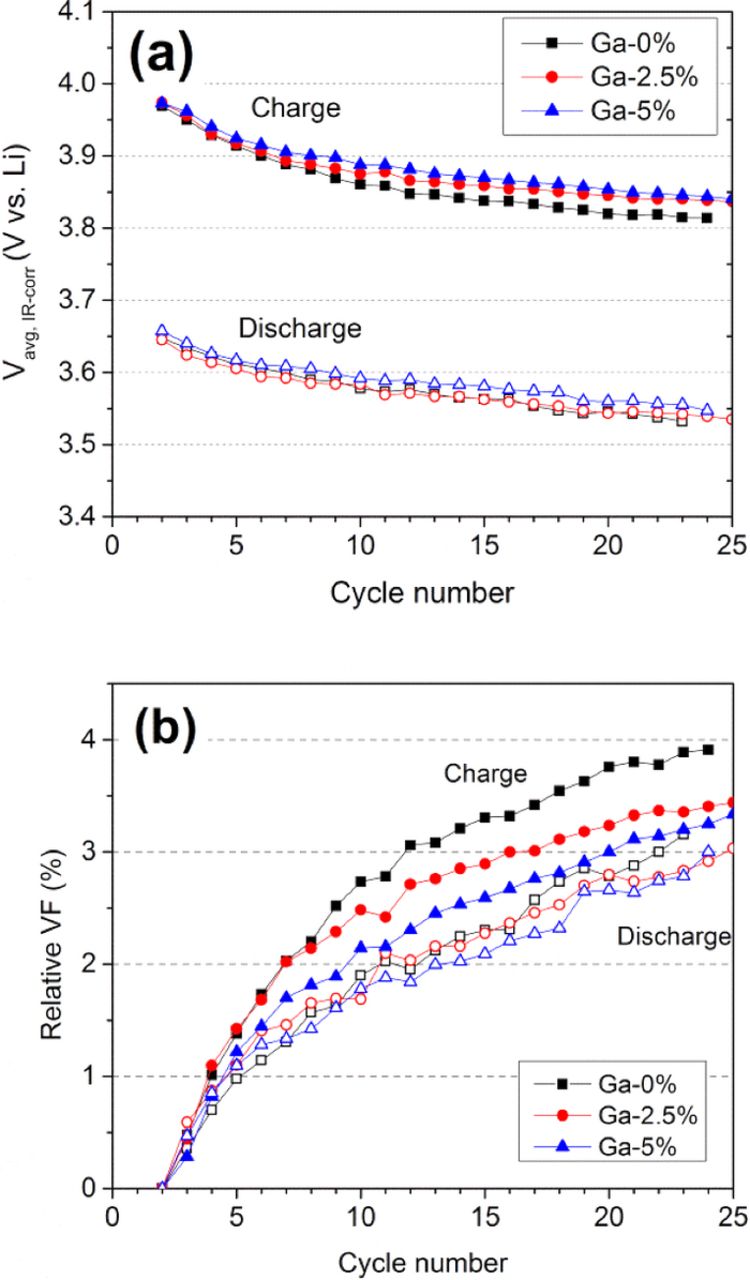
Figure 9. Plots of (a) iR-corrected average voltage (Vavg, iR-corr) and (b) relative voltage fade (VF) as a function of cycle number in Ga-substituted Li1.2Ni0.15Mn0.55Co0.1O2. The relative voltage fade is defined as the percent decay in Vavg, iR-corr relative to Vavg, iR-corr at 2nd cycle.
The layered-type to spinel-type phase transition requires major rearrangements of transition metals from the transition metal layers to lithium layers. The migration of transition metals occurs through the tetrahedral sites, as represented in Fig. 10.42 The different shape change in the dQ/dV*1/Q curves for the cation-substituted samples may be related to the cations deflecting the migration path of the transition metals. Indeed, Balasubramanian and coworkers43 have observed that Ga3+ ions have a stronger tendency to migrate from octahedral sites to tetrahedral sites during charging of LiNi0.908Co0.085Ga0.003O2. Therefore, the presence of Ga3+ ions in the transition metal layer and its preferential migration to tetrahedral sites may affect (block) the irreversible migration of other transition metals and, subsequently, voltage fade during charge cycles. Nevertheless, the voltage fade during discharge, which is more directly related to the performance of the material, does not show a meaningful improvement due to the Ga substitution (see voltage fade during discharge in Figs. 9a and 9b). Note that the suppression of voltage fade only in the charge profile leads to an increase in hysteresis between the charge and discharge profiles and, hence, a lower energy efficiency. This result indicates that the path of structural change leading to voltage fade is unaltered by Al or Ga substitution. It has been reported that Al or Ga substitution for Mn in layered LiMnO2 materials marginally slows the layered to spinel transformation, but does not completely stop it.44,45 Certainly, for LMR-NMC, the large stoichiometric content of Mn could undergo the same fate. The formation of Jahn-Teller distorted trivalent Mn octahedra in the local environment during the discharge reduction cycle could be related to the transformation. However, reports in the literature have not precisely determined large Mn redox change,46 and accordingly a Jahn-Teller driven mechanism leading to spinel then voltage fade has not been invoked to this point. In contrast, the same degree of voltage fade observed in Al or Ga substituted LMR-NMC implies the material's strong tendency to undergo cation rearrangements as a result of the creation of oxygen vacancies during the initial activation cycle and not due to Jahn-Teller effects.47 More efforts are required to understand and control the initial activation process for LMR-NMC materials if the voltage fade problem and energy loss are to be solved.
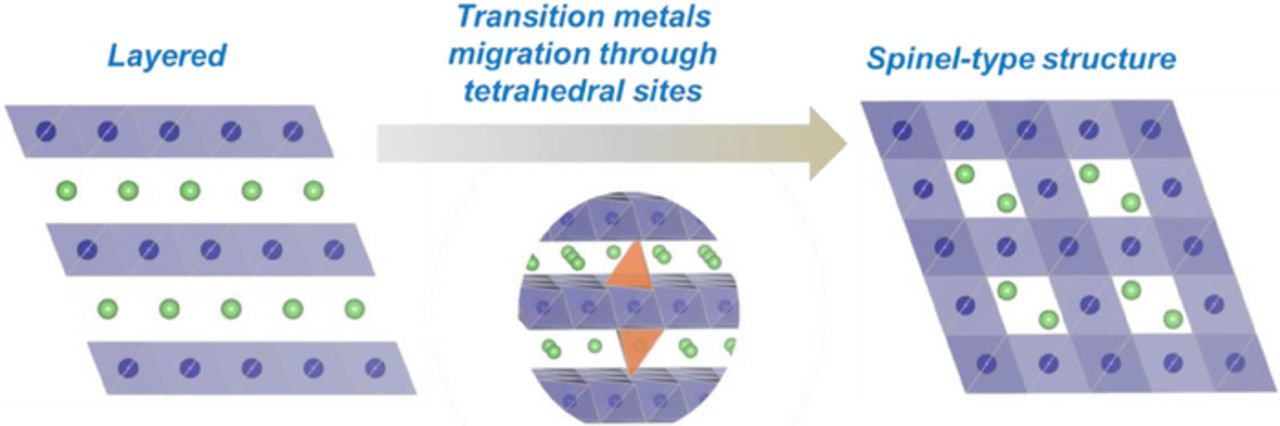
Figure 10. Schematic illustration of layered to spinel-type phase transition.
Conclusions
The effects of Al and Ga substitution on suppressing voltage fade in Li1.2Ni0.15Mn0.55Co0.1O2 cathode materials were systematically evaluated by using a voltage fade test protocol. The data show little-to-no effect from the cation substitution. Despite some hints of structural modification during charge as measured from the dQ/dV electrochemical response, the ≤ 10% degree of cation substitution may not be enough to impose significant structural stability to the layered composite cathode, which is subject to significant rearrangement of transition metals as a result of oxygen loss and lithium extraction from the transition metal layer during the initial charge activation. Subsequent cycles presumably involve continued transition metal migration from octahedral sites in the transition metal layer through tetrahedral sites and into the lithium layer.42 The cation rearrangement adds impedance but also contributes to voltage fade and energy loss. While we expect that Al and Ga can reside in tetrahedral sites in the structure and potentially block transition metal movement, the approach did not appear to be effective. The results indicate that the voltage fade is a global process, which is difficult to be completely stopped by small modification through non-redox atom substitution.
Acknowledgments
Support from the Vehicle Technologies Program, Hybrid and Electric Systems, in particular, David Howell, Tien Duong, and Peter Faguy, at the U.S. Department of Energy, Office of Energy Efficiency and Renewable Energy is gratefully acknowledged. Use of the Center for Nanoscale Materials, including resources in the Electron Microscopy Center, was supported by the U. S. Department of Energy, Office of Science, Office of Basic Energy Sciences, under Contract No. DE-AC02-06CH11357.
The submitted manuscript has been created by UChicago Argonne, LLC, Operator of Argonne National Laboratory ("Argonne"). Argonne, a U.S. Department of Energy Office of Science laboratory, is operated under Contract No. DE-AC02–06CH11357. The U.S. Government retains for itself, and others acting on its behalf, a paid-up, nonexclusive, irrevocable worldwide license in said article to reproduce, prepare derivative works, distribute copies to the public, and perform publicly and display publicly, by or on behalf of the Government.