Abstract
The sluggish kinetics of hydrogen oxidation/evolution reaction (HOR/HER) is one of the major barriers for the breakthrough of alkaline membrane fuel cells. In particular, the effects of different cations on the HOR/HER kinetics are poorly understood to date. In this work, the catalytic HOR/HER activity on polycrystalline platinum (poly-Pt) and high surface area carbon-supported platinum nanoparticles (HSAC-Pt) in various alkaline 0.1 M electrolyte solutions (MOH, M = Li+, Na+ and K+) at different temperatures was studied using rotating disc electrode (RDE) technique. Our results show the increase of the HOR/HER activity for Pt in the order of K+ < Na+ < Li+. The improved kinetics are attributed to the water arrangement controlled by the monovalent cations resulting in non-covalent interactions of the hydrated cations and the adsorbed hydrogen. We assume that these non-covalent interactions cause the superior HOR/HER activity on the Pt surface in presence of LiOH.
Export citation and abstract BibTeX RIS

This is an open access article distributed under the terms of the Creative Commons Attribution Non-Commercial No Derivatives 4.0 License (CC BY-NC-ND, http://creativecommons.org/licenses/by-nc-nd/4.0/), which permits non-commercial reuse, distribution, and reproduction in any medium, provided the original work is not changed in any way and is properly cited. For permission for commercial reuse, please email: oa@electrochem.org.
A fundamental understanding of bonding interactions at the electrolyte-electrode interface is the main key to design electrocatalyst materials for applications in electrolyzers, batteries or fuel cells.1–3 Nowadays, platinum and other rare transition metals are the state-of-the-art catalysts for numerous electrochemical reactions which are relevant for fuel cells and electrolyzers like hydrogen oxidation/evolution reaction (HOR/HER) and oxygen reduction/evolution reaction (ORR/OER). The catalytic properties of the electrode material strongly influence the interactions between reaction intermediates and metal surface including adsorption, desorption and bond formation. In case of an aqueous electrolyte, two types of interactions might to be considered; the surrounding electrolyte and the electronic properties of metallic surface.4 At first, the formation of a chemical bond between adsorbates and electrode surface which involves the chemisorption, electron transfer and partial release of hydration shell from the reactants. Secondly, weak electrostatic metal-ion forces which might influence the concentration of ions near the electrode surface and do not include chemical adsorption on the metal. The spectrum of physicochemical appearance related to these two types of bonds is extremely wide, from ionic hydration and electron-charge transfer processes to adsorption and catalytic processes.
The formation of a direct chemical bond includes orbital overlap and chemical interactions of adsorbates with the metal surface. For platinum and platinum group metals, these adsorbed species are important and include O2, H2O2 or OHad in the ORR as well as the underpotentially and overpotentially deposited hydrogen.5,6 Chemisorption of the hydrated ions takes place in the inner Helmholtz plane and plays a relevant role in the kinetics of electrocatalytic processes. The total energy stemmed from the ad-/ desorption of reactants, intermediates and products is strongly affected from the supporting electrolyte, leading to a significant variation in the electrocatalytic reaction rates. Moreover, surface-ion interactions like the electrostatic forces which act in distances of tens of Ångstroms and non-specific interaction of hydrated ions occur in the outer Helmholtz plane.
In the last years, large efforts have been made to improve the understanding of the mechanism and kinetics of the HOR/HER particularly in alkaline media. The critical parameters to achieve high catalytic HOR/HER performance are still unclear and have intensively been discussed in the literature. For instance, it is suggested that the reactivity of metals toward the HOR is mainly depended on the Pt-Hads binding energy.7 Schwammlein et al.8 have shown increased HOR/HER activities for platinum-ruthenium core-shell particles and attributed this enhancement to the changed electronic structure of the d-band of platinum. In contrast, Strmcnik et al.9 have reported that the adsorbed hydroxide species (OHads.) are the key reactants for the HOR and the Pt-Hads. binding energy might not be the entirely controlled factor of the HOR/HER mechanism in alkaline media. They investigated the oxophilic character of various metals like platinum, platinum-ruthenium and iridium using RDE set-up and found out that more oxophilic metals (e.g., Pt vs Ru) show increased HOR activity in alkaline media.9 Another example is the formation of highly oxophilic Ni(OH)2 clusters on metal surfaces, which cause an enhancement of the activity for the HER in alkaline environment due the stabilization of OHads.10 In contrast, Gasteiger and coworkers11 have carefully compared the exchange current densities of carbon supported platinum, palladium and iridium nanoparticles in hydrogen-pump fuel cells and RDE experiments, showing that the highest activity for the HOR/HER was determined on platinum followed by iridium and palladium. These works and others illustrate the high complexity of the reaction mechanism and kinetics of the HOR/HER in alkaline environments.
Recent studies have investigated the influence of different alkaline electrolyte solutions containing various monovalent cations on electrochemical reactions like CO2 reduction12,13 and oxygen reduction reaction (ORR).14,15 Thorson et al.13 have shown a correlation of the current density for the HER as undesired side reaction during CO2 reduction with the used cations. They pointed out that the current density for the HER is attributed to the preferred adsorption of smaller cations on the electrode surface. In case of the ORR, the interaction of cations in the Helmholtz plane on different single crystal platinum surfaces as well the influence of the platinum (hydr)oxide formation have comprehensively investigated by Markovic and coworkers.14 They have demonstrated the role of non-covalent interactions between the hydrated cations in the outer Helmholtz and the adsorbed hydroxide species on the metal surfaces because the performance for the HOR and ORR is attributed to the physical blocking of the active surface by hydrated cations.16 However, the effect of different monovalent cations on the mechanism and kinetics of the HOR/HER in alkaline environment is poorly understood for poly-Pt and Pt nanoparticles to date.
The target of this work is to study the effect of various monovalent cations like Li+, Na+ and K+ from the alkali metal group on the kinetics of the HOR/HER for high surface area carbon-supported Pt catalyst (HSAC-Pt) and polycrystalline platinum (poly-Pt) by using RDE set-up in alkaline media. Since caesium hydroxide could not be provided in a sufficient purity for our experiments and the hydroxide salts of the earth alkali metal group have poor solubility in water, we have focused on soluble, purified and commercially available alkali metal hydroxide like LiOH, KOH and NaOH in this work. We analyzed the polarization curves of the HOR/HER by using the Butler-Volmer equation and the linear approximation of the Butler-Volmer equation in the micro-polarization region to determine the exchange current densities, transfer coefficients and activation energies of the HOR/HER in 0.1 M LiOH, NaOH and KOH at various temperatures. Based on our results we show that the catalytic properties of the HSAC-Pt and poly-Pt are strongly influenced by the non-covalent interactions between solvated cations in the outer Helmholtz plane and adsorbed hydrogen on the Pt surface.
Experimental
Preparation of HSAC-Pt and poly-Pt electrodes
A commercially available high surface area carbon-supported Pt catalyst (HSAC-Pt) with a metal loading of 28.4 wt% (Tanaka Kikinzoku International Inc, TKK, Japan) and a polycrystalline Pt (poly-Pt) disc electrode (diameter of 5 mm, Pine Research Instrumentation, USA) were used as working electrodes for the electrochemical experiments. A catalyst ink was prepared by mixing of HSAC-Pt and highly purified water (18 MΩ cm at room temperature, Elga Purelab Classic) to obtain a concentration of ∼0.25 gPt L−1. After sonication, an aliquot of 20 μL was pipetted onto a clean and polished surface of a glassy carbon (GC) electrode (diameter of 5 mm, Pine Research Instrumentation, USA) and then dried at 40°C in air, resulting in a homogenous thin catalyst film. The calculated Pt loading was around ∼7 μgPt cm−²geo. The GC electrode and poly-Pt electrode were previously polished with 0.05 μm aluminum oxide powder (Bühler, USA) onto a Microcloth paper (Bühler, USA) until a mirror-like surface had been obtained. Afterwards, both polished electrodes were washed in propan-2-ol (Fisher Chemica, HPLC) and highly purified water by using an ultra-sonication bath.
Electrochemical measurements
Rotating disc electrode (RDE) experiments were performed in a home-made electrochemical three-compartment glass cell by using a potentiostat (VSP300, Biologic, France) and a rotator (Pine Research Instrumentation, USA). A three-electrode configuration consisted of a Pt mesh as counter electrode, mercury-mercury oxide (MMO) as reference electrode and poly-Pt or HSAC-Pt as working electrode, respectively. Electrolyte solutions like 0.1 M LiOH (99.995%, SigmaAldrich), 0.1 M NaOH (99.99%, AlfaAesar) and 0.1 M KOH (99.98%, AlfaAesar) were freshly prepared by dissolution of the respective pellets in highly purified water. All chemicals were used as received without further purification. The kinetic measurements for the poly-Pt at different temperatures were performed in a home-made double-walled electrochemical three-compartment glass cell by using a thermostat (Lauda, ECO silver RE620). All potentials reported in this paper were converted into the reversible hydrogen electrode (RHE) scale. All electrochemical data were collected within 30 minutes to avoid contamination (e.g. corrosion of the glass cell, electrolyte purities and carbonate formation).
Cyclic voltammetry
The working electrode was electrochemically cleaned by cyclic voltammetry (CV) between 0.03−1.0 V vs RHE with a scan rate of 50 mV s−1 for HSAC-Pt and with 150 mV s−1 for poly-Pt in an Ar-saturated electrolyte, respectively, until steady-state CV profile had been achieved. The quality of the Ar (Air Liquide) was 99.999%.
To determine the electrochemically active surface area (ECSA) for both Pt-based electrodes, CV profiles were recorded between 0.05−1.0 V vs RHE with a scan rate of 50 mV s−1 directly after the electrochemical cleaning process. The ECSA values were estimated from the hydrogen underpotential deposition (Hupd) region by integrating the hydrogen adsorption/desorption region after double layer current correction, assuming a pseudo-capacity of 210 μC cm−²Pt. The Hupd [cm²Pt] is then normalized by the used mass of platinum [mPt] to express the ECSA:
![Equation ([1])](https://content.cld.iop.org/journals/1945-7111/166/2/F66/revision1/d0001.gif)
Additionally, the surface roughness (rf) is given by the ratio of Hupd [cm²Pt] and geometric area of the working electrode (Ageo.) [cm²geo.]
![Equation ([2])](https://content.cld.iop.org/journals/1945-7111/166/2/F66/revision1/d0002.gif)
Linear sweep voltammetry (LSV)
The electrolyte was exchanged and saturated with hydrogen (quality of 99.999%, AirLiquide) by bubbling through the solution for at least 10 minutes prior to each LSV measurement. For the HOR/HER polarization curves, LSV profiles were recorded between −0.05 and 0.50 V vs RHE with a rotation speed of 1600 rpm (revolutions per minute), whereby the potential was cathodically changed with a scan rate of 10 mV s−1.
The kinetic current densities of the polarization curves are calculated by using the Koutecky-Levich equation
![Equation ([3])](https://content.cld.iop.org/journals/1945-7111/166/2/F66/revision1/d0003.gif)
where j is the measured current density [mA cm−2Pt], jkin - the kinetic current density [mA cm−2Pt] and jD - the diffusion-limited current density [mA cm−2 Pt]. The kinetic currents are normalized by the Hupd obtained from CV profiles in the corresponding 0.1 M electrolyte solution. By fitting the experimental data with the Butler-Volmer (B.V.) equation, the exchange current densities (j0RT, B.V.) can be extracted from:
![Equation ([4])](https://content.cld.iop.org/journals/1945-7111/166/2/F66/revision1/d0004.gif)
where η is the overpotential [V], α - the transfer coefficient [0 < x < 1], F - the Faraday constant [96485.3 As mol−1], T - the temperature [K] and R - the gas constant [8.314 J mol−1 K−1], respectively. The obtained exchange current densities (j0RT, B.V.) are compared to exchange current densities (j0RT, Micro.) established from fitting in the micro-polarization region (−10 – +10 mV vs RHE), which is simply given by the linearization of the B.V. Equation 4:
![Equation ([5])](https://content.cld.iop.org/journals/1945-7111/166/2/F66/revision1/d0005.gif)
The measured exchange current densities (j0 B.V.) at various temperatures were used to determine the activation energy [J mol−1] given by the corresponding Arrhenius relationship:
![Equation ([6])](https://content.cld.iop.org/journals/1945-7111/166/2/F66/revision1/d0006.gif)
High resolution transmission electron microscopy (HR-TEM)
A JEOL 2100F transmission electron microscope (operated with an accelerating voltage of 200 kV) was employed to determine the morphology, structure and mean particle size of HSAC-Pt catalyst before and after the electrochemical experiments. A catalyst dispersion in a water/propan-2-ol solution was pipetted onto a holey carbon film-coated Cu grid and dried in air. The TEM images were evaluated with the ImageJ 1.51f Software to establish the particle size distribution and mean particle diameter by counting more than 400 particles.
Results
Electrochemical characterization of poly-Pt and HSAC-Pt in different alkaline electrolytes
Figures 1a and 1c show the CV profiles of a HSAC-Pt and poly-Pt recorded in three different Ar-saturated 0.1 M electrolyte solutions: LiOH (in blue, 99.995%, SigmaAldrich), NaOH (in red, 99.99%, AlfaAesar) and KOH (in black, 99.98%, AlfaAesar). Firstly, we observed that the CV profiles for both, poly-Pt and HSAC-Pt, exhibit the typically electrochemical characteristics of a clean Pt surface. More precisely, the electrochemical characteristics of a Pt surface can be divided in three regions: the underpotentially deposited hydrogen (Hupd) region (0.05–0.45 V vs RHE), capacitive double-layer region (0.45–0.60 V vs RHE) and region for formation/reduction of Pt (hydr)oxide above 0.65 V vs RHE. It is noted that the capacitive current densities for the HSAC-Pt are larger than those for the poly-Pt due to the contribution of the carbon support material.
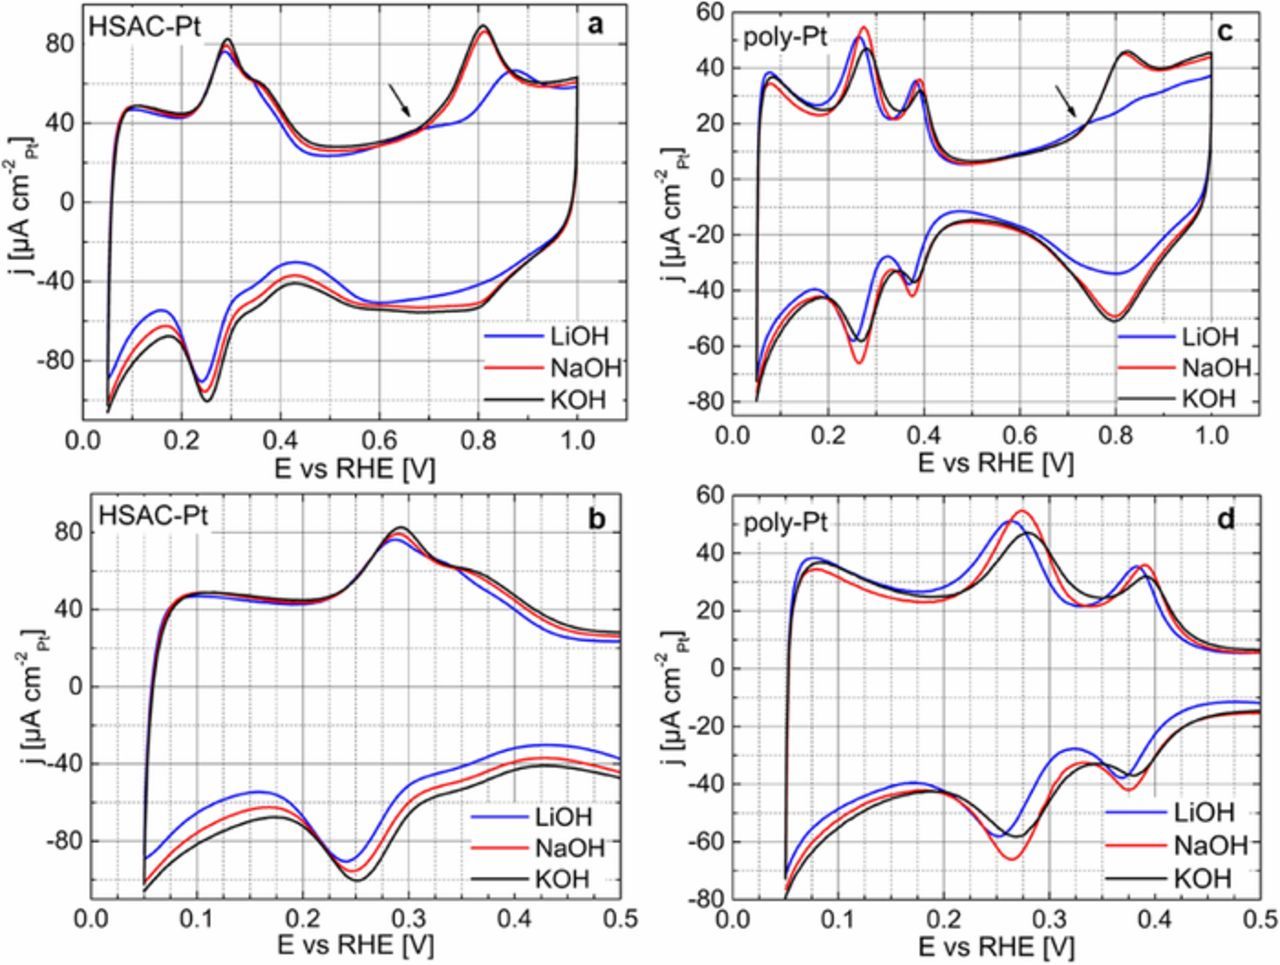
Figure 1. CV profiles of HASC-Pt (a-b) with a loading of ∼7 μgPt cmgeo.−2 and poly-Pt (c-d) recorded at 50 mV s−1 and 298 K in various Ar-saturated 0.1 M electrolyte solutions (blue: LiOH, red: NaOH, and black: KOH). The current density is normalized to the measured electrochemically active Pt-surface area obtained from the Hupd region in the respective electrolyte solution. Arrows in Figs. 1a and 1c denote the broad current peak in the anodic scan which was only observed in 0.1 M LiOH.
Despite the observed similarities in the CV profiles of the poly-Pt and HSAC-Pt, some differences based on the surrounding electrolyte solution (0.1 M concentration of Na+, K+, and Li+) were observed. To highlight the effect of monovalent cations, Figures 1b and 1d display only the Hupd region for the HSAC-Pt and poly-Pt, whereby the current features at around 0.08, 0.30 and 0.38 V vs RHE can be ascribed to Pt(100) and Pt(110) crystal planes, respectively, verified by the CV profiles of Pt single crystals in alkaline environments.17,18
In our case, the potentials for the hydrogen ad-/desorption on the poly-Pt are significantly shifted to lower values (around 15 mV) in the Li+-containing electrolyte compared to those in 0.1 M NaOH and KOH. Almost no differences were observed in the Hupd region in NaOH and KOH. A similar trend is visible for the HSAC-Pt shown in Fig. 1b. However, this potential shift in the Hupd region is lower based on the less defined polycrystalline surface for nanoparticles. Therefore, we suggest that this observed potential shift is caused by non-covalent interactions of the adsorbed hydrogen and hydrated metal cations leading to thermodynamically preferred ad-/ desorption of hydrogen in the presence of Li+ compared with that in Na+- and K+-containing solutions. A negative shift of Hupd features for a Pt(553) in presence of different monovalent cations has also been reported by Koper and coworkers,19 which is in excellent agreement with our results.
Apart from the Hupd region, we see different electrochemical behaviors in the oxide regions for the poly-Pt and HSAC-Pt in various cation-containing solutions. While almost no changes in the formation/reduction of Pt hydr(oxide) in NaOH and KOH were detected, the presence of Li+ cations strongly influence the (hydr)oxide formation process by shifting the onset potential to higher positive values accompanied with suppressed current densities in the oxide regions. This features were previously observed by Markovic et al.14 and can be explained by non-covalent interactions between hydrated cations in the outer Helmholtz plane and adsorbed OH species on the electrode surface. They postulated the formation of a quasi-specifically adsorbed OHads-M+(H2O)x (M = Li, Na or K) complex at the electrolyte-electrode interface in alkaline environment. In particular, the number of water molecules in the hydrated shell is attributed to the different solvation properties and thus different ionic radii of these cations (Li+, Na+ and K+).20 For instance, Li+ cations exhibit the lowest ionic radius and consequently the highest hydration number compared to Na+ or K+. Therefore, they suggest that a higher concentration of postulated OHads-Li+(H2O)x complex is generated at the electrolyte-electrode interface and cause a stronger suppression of irreversible "oxide" formation on the Pt surface. This experimental observation has been supported by respective DFT calculations.14,21
Additionally, the CV profiles of the poly-Pt and HSAC-Pt in LiOH signify a broad anodic current peak at 0.5–0.7 V vs RHE. This broad current peak appears more pronounced for the HSAC-Pt than that for the poly-Pt, indicating impurities on the Pt surface. We suggest that the origin of the impurities is not only stemmed from the electrolyte solution (LiOH 99.995%, SigmaAldrich), because the magnitude of this current peak strongly varies by exchanging the electrolyte solutions and decreases with increasing cycle number until a steady-state CV profile had been achieved (Figure S1, supporting information). It is more reliable, that this additional current peak is likely related to the formation of the OHads-Li+(H2O)x complex which takes place in this potential range.14 As consequence, this broad current peak does not appear in NaOH or KOH assuming that a low concentration of hydrated cations or weak interactions of K+ and Na+ exists in the Helmholtz plane at higher anodic potential.
Based on the Hupd region, we established the electrochemically active surface area (ECSAHupd) and roughness factor (rf = Hupd/Ageo.) for the HSAC-Pt and poly-Pt electrodes in various cation-containing electrolyte solutions. Table I sums up the resulting ECSAHupd and rf values for the HSAC-Pt and poly-Pt electrodes in 0.1 M LiOH, NaOH and KOH. For the HSAC-Pt, the ECSAHupd values in 0.1 M LiOH, NaOH and KOH are 62 ± 4, 67 ± 5 and 63 ± 5 m²Pt g-1Pt, respectively. Hence, the obtained rf values for the HSAC-Pt are around 3-fold higher than those for the poly-Pt which is attributed to the nanosizing of the Pt. As the ECSAHupd and rf values are very similar in the different alkaline solutions, the accessibility and utilization of the catalytically active centers for Pt in the potential range of 0.05 and 0.45 V vs RHE seem to be independent of the surrounding cations (Li+, Na+ and K+ with 0.1 M concentration). A similar behavior was observed for the poly-Pt, where the obtained rf values are 1.5 ± 0.4, 1.4 ± 0.1 and 1.3 ± 0.1 cm²Pt cm −²geo. measured in 0.1 M LiOH, NaOH and KOH, respectively. Despite different properties like solvation energies, ionic radii and Nernst potentials for Li+, Na+ and K+ cations, we can conclude that the co-adsorption of these cations in the Hupd region can be mainly neglected. Thus, the accessibility of the catalytically active centers for Pt in the Hupd region is independent of the surrounding alkali metal cations. We suggest that the observed shift of the potential in hydrogen ad-/desorption (Figs. 1b and 1d) on the Pt surface in 0.1 M LiOH is very likely related to the changes in the energetics of the adsorbed hydrogen on the Pt surface induced by cation arrangements in Helmholtz plane and/or electrolyte conductivity which modify the potential drop into the electrolyte. Due to the formation of M+(H2O)x (M = Li, Na and K) complexes, the local pH value and ionic strength might be different at the electrolyte – electrode interface compared to those in the bulk electrolyte solution.
Table I. Overview of the ECSA and rf values for the HSAC-Pt and poly-Pt in different 0.1 M electrolyte solutions (LiOH, NaOH and KOH). The values in brackets indicate the number of independent experiments on several days.
| HSAC-Pt | poly-Pt | ||
|---|---|---|---|
| HSAC-Pt | roughness | roughness | |
| Electrolyte | ECSAHupd | factor (rf) | factor (rf) |
| (0.1 M) | [m²Pt g−1Pt] | [cm²Pt cm −²geo.] | [cm²Pt cm −²geo.] |
| LiOH | 62 ± 4 (4) | 4.4 ± 0.4 (4) | 1.5 ± 0.2 (3) |
| NaOH | 67 ± 5 (3) | 5.2 ± 0.7 (3) | 1.4 ± 0.1 (3) |
| KOH | 63 ± 5 (3) | 4.4 ± 0.5 (3) | 1.3 ± 0.1 (4) |
Furthermore, we established the mean particle diameter of the Pt nanoparticles obtained from the high resolution TEM analysis and calculated the theoretical ECSATEM via
![Equation ([7])](https://content.cld.iop.org/journals/1945-7111/166/2/F66/revision1/d0007.gif)
where ρPt represents the density of platinum [21.45 g cm−3] and  – averaged particle diameter based on the evaluation of more than 400 particles. In our case, the average particle size (
 ) is 2.6 ± 0.9 nm for the HSAC-Pt (Figure S2 and S3, supporting information), resulting in an ideal ECSATEM value of around 108 m² g−1Pt. The strong difference between the ECSAHupd and theoretical ECSATEM can likely be explained by the insufficient cleaning process of the Pt nanoparticles to remove carbon-based impurities and the inadequate model for a perfect spherical Pt nanoparticle without considering any anchoring and embedding of nanoparticles on a support material.
HOR/HER activity of poly-Pt and HSAC-Pt electrodes in different alkaline electrolytes
The HOR/HER polarization curves of the poly-Pt and HSAC-Pt at a scan rate of 10 mV s−1 in H2-saturated 0.1 M electrolyte solutions (KOH, NaOH and LiOH) are illustrated in Figure 2. Basically, the HOR polarization curve can be distinguished in three regimes: kinetically controlled regime (0.0–0.015 V vs RHE), mixed region with different kinetically-controlled as well as diffusion-controlled contributions (0.015–0.15 V vs RHE) and finally mass transport-limiting regime (0.15–0.35 V vs RHE). All polarization curves for both electrodes exhibit a plateau behavior at 0.15–0.4 V vs RHE, indicating the hydrogen mass transport-limiting regime for the HOR. The diffusion-limiting current densities are in the range between 2.5–3.0 mA cm-2geo. at 1600 rpm. The onset potential from the mixed kinetic-diffusion controlled regime to a diffusion-limiting regime occurs at around 0.2 V vs RHE for the poly-Pt and at 0.05 V vs RHE for the HSAC-Pt in all three electrolyte solutions, respectively. It is noted, that the observed negative shift in the onset potential for the HSAC-Pt signifies improved HOR/HER activity compared to the poly-Pt. The enhanced activity is caused by the nanostructuring of Pt and thus the increased surface area. In addition, we observed that the HOR/HER polarization curves for the HSAC-Pt in 0.1 M LiOH, NaOH and KOH are almost on top of each other, indicating similar activities at first glance. In contrast, the HOR/HER polarization curves for the poly-Pt recorded in various monovalent cation containing solutions (Li+, K+, Na+) show clear differences in its catalytic properties. In particular, the polarization curve for the poly-Pt in 0.1 M LiOH exhibits a significant shift to negative potentials in the mixed kinetic-diffusion regime (0.0 V–0.15 V vs RHE), signifying an enhancement of the catalytic HOR activity compared to those in NaOH and KOH.
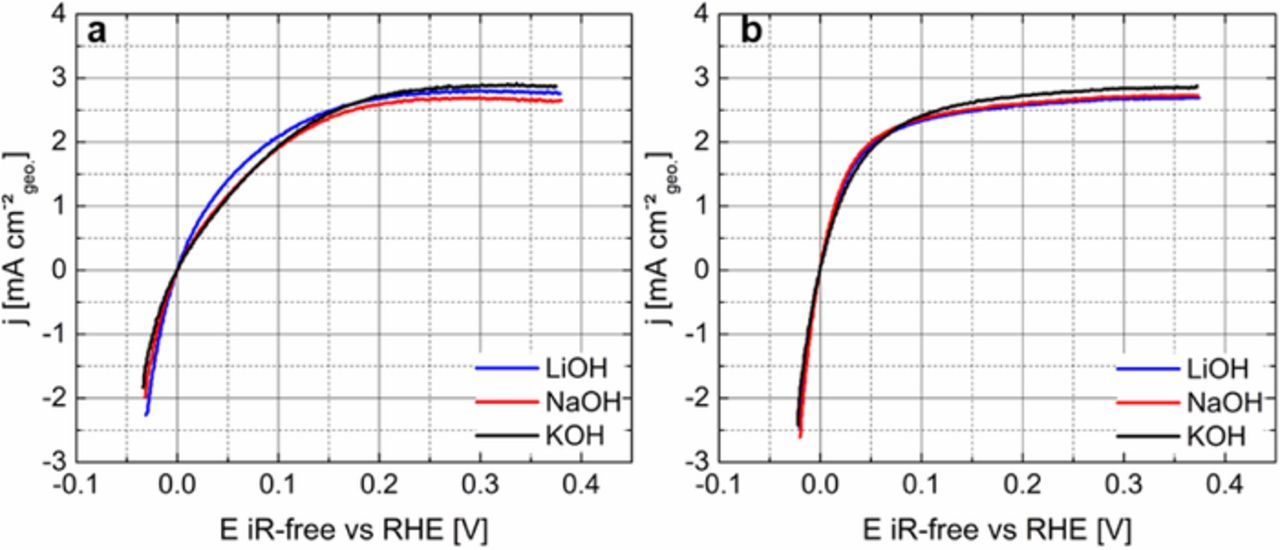
Figure 2. HOR/HER polarization curves of the poly-Pt (a) and HSAC-Pt (b) recorded with 1600 rpm and 10 mV s−1 from −0.05 – 0.4 V vs RHE in various 0.1 M electrolyte solutions (blue: LiOH, red: NaOH and black: KOH) at room temperature. The current density is normalized to the geometric area of the poly-Pt and HSAC-Pt electrodes, respectively.
To establish the exchange current densities and transfer coefficients for the poly-Pt and HSAC-Pt in different alkali metal cation-containing solutions, the measured HOR/HER polarization curves were fitted by using B.V. (Equation 4) as well as linear approximation of the B.V. (Equation 5) in the micro-polarization region.
Figure 3 illustrates the analysis of the micro-polarization region of −10 mV and +10 mV vs RHE for the poly-Pt and HSAC-Pt in 0.1 M LiOH (blue), NaOH (red) and KOH (black). Based on the micro-polarization curves, we reveal that the HER/HOR activities for the poly-Pt and HSAC-Pt in 0.1 M Li+-containing solutions are clearly higher than those in NaOH and KOH with the same concentration. This trend is more enhanced for the poly-Pt compared to that for the HSAC-Pt. A minor experimental deviation was observed during the analysis of the HOR/HER measurements on the HSAC-Pt, because the fitted lines intersect the potential axis at around – 0.7 mV vs RHE in all three electrolyte solutions. The minimal potential shift at the origin of the micro-polarization curve is very likely based on the small fluctuation of the reference electrode and therefore is among the experimental error range. The exchange current density (j0RT, Micro.) for the HOR/HER was extracted from the slope of the micro-polarization curves and are listed in Tables II and III.
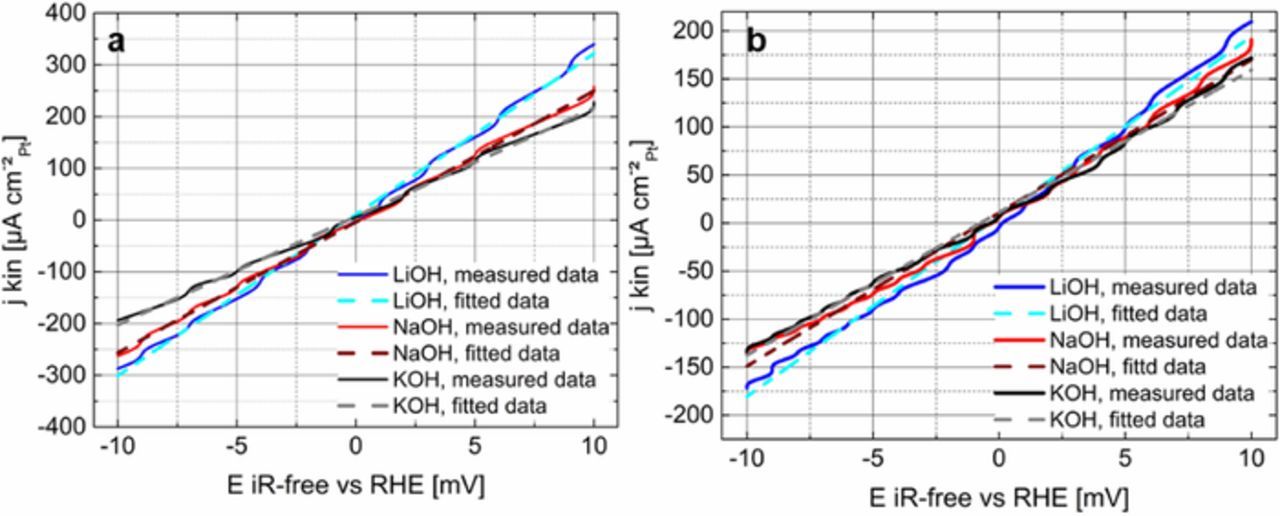
Figure 3. HOR/HER micro-polarization curves of the poly-Pt (a) and HSAC-Pt (b) in various H2-saturated 0.1 M electrolyte solutions (blue: LiOH, red: NaOH and black: KOH), recorded with 1600 rpm and 10 mV s−1 at room temperature. Experimental data are denoted with a solid line, while the dashed lines show the corresponding fits based on the simple linearization of the B.V. equation (Eq. 5). The current density is normalized to the measured electrochemically active Pt surface area in the respective electrolyte solution.
Table II. HOR/HER exchange current densities based on the B.V. (j0RT, B.V.) and linear approximation of the B.V. (j0RT, Micro.) as well as transfer coefficient (α) for the poly-Pt in different 0.1 M electrolyte solutions at room temperature. The values in brackets indicate the numbers of independent experiments on several days.
| Electrolyte | j0RT, B.V. | j0RT, Micro. | |
|---|---|---|---|
| (0.1 M) | [mA cm−²Pt] | α | [mA cm−²Pt] |
| KOH | 0.57 ± 0.07 (4) | 0.53 ± 0.02 (4) | 0.52 ± 0.07 (4) |
| NaOH | 0.70 ± 0.01 (3) | 0.53 ± 0.02 (3) | 0.65 ± 0.01 (3) |
| LiOH | 0.88 ± 0.02 (3) | 0.54 ± 0.03 (3) | 0.80 ± 0.02 (3) |
Table III. HOR/HER exchange current densities based on the B.V. (j0RT, B.V.) and linear approximation of the B.V. (j0RT, Micro.) as well as transfer coefficients (α) for the HSAC-Pt in different 0.1 M electrolyte solutions at room temperature. The values in brackets indicate the number of independent experiments on several days.
| Electrolyte | j0RT, B.V. | j0RT, Micro. | |
|---|---|---|---|
| (0.1 M) | [mA cm−²Pt] | α | [mA cm−²Pt] |
| KOH | 0.46 ± 0.03 (3) | 0.48 ± 0.04 (3) | 0.38 ± 0.01 (3) |
| NaOH | 0.62 ± 0.02 (3) | 0.47 ± 0.04 (3) | 0.41 ± 0.01 (3) |
| LiOH | 0.72 ± 0.04 (3) | 0.49 ± 0.01 (3) | 0.50 ± 0.02 (3) |
In addition, the HOR/HER polarization curves were fitted by the B.V. equation (Eq. 4) to evaluate the exchange current densities (j0RT, B.V.) and transfer coefficients (α) for the poly-Pt and HSAC-Pt in different alkali metal cation-containing electrolytes at room temperature. Figure 4 compares the measured data (jkin, denoted with black dots) with the fits established from the entire B.V. equation (gray dashed lines) for the poly-Pt (a-c) and HSAC-Pt (d-f) in 0.1 M NaOH, KOH and LiOH. Obviously, the fitted B.V. curves match excellent to the experimental HOR/HER data for the poly-Pt (Figs. 4a, 4b and 4c), while slight deviations to the measured data for the HSAC-Pt in NaOH and LiOH (Figs. 4d and 4e) were observed. We suggest that the slight deviations are likely based on the less defined surface structure of the nanoparticles compared to that of the poly-Pt.
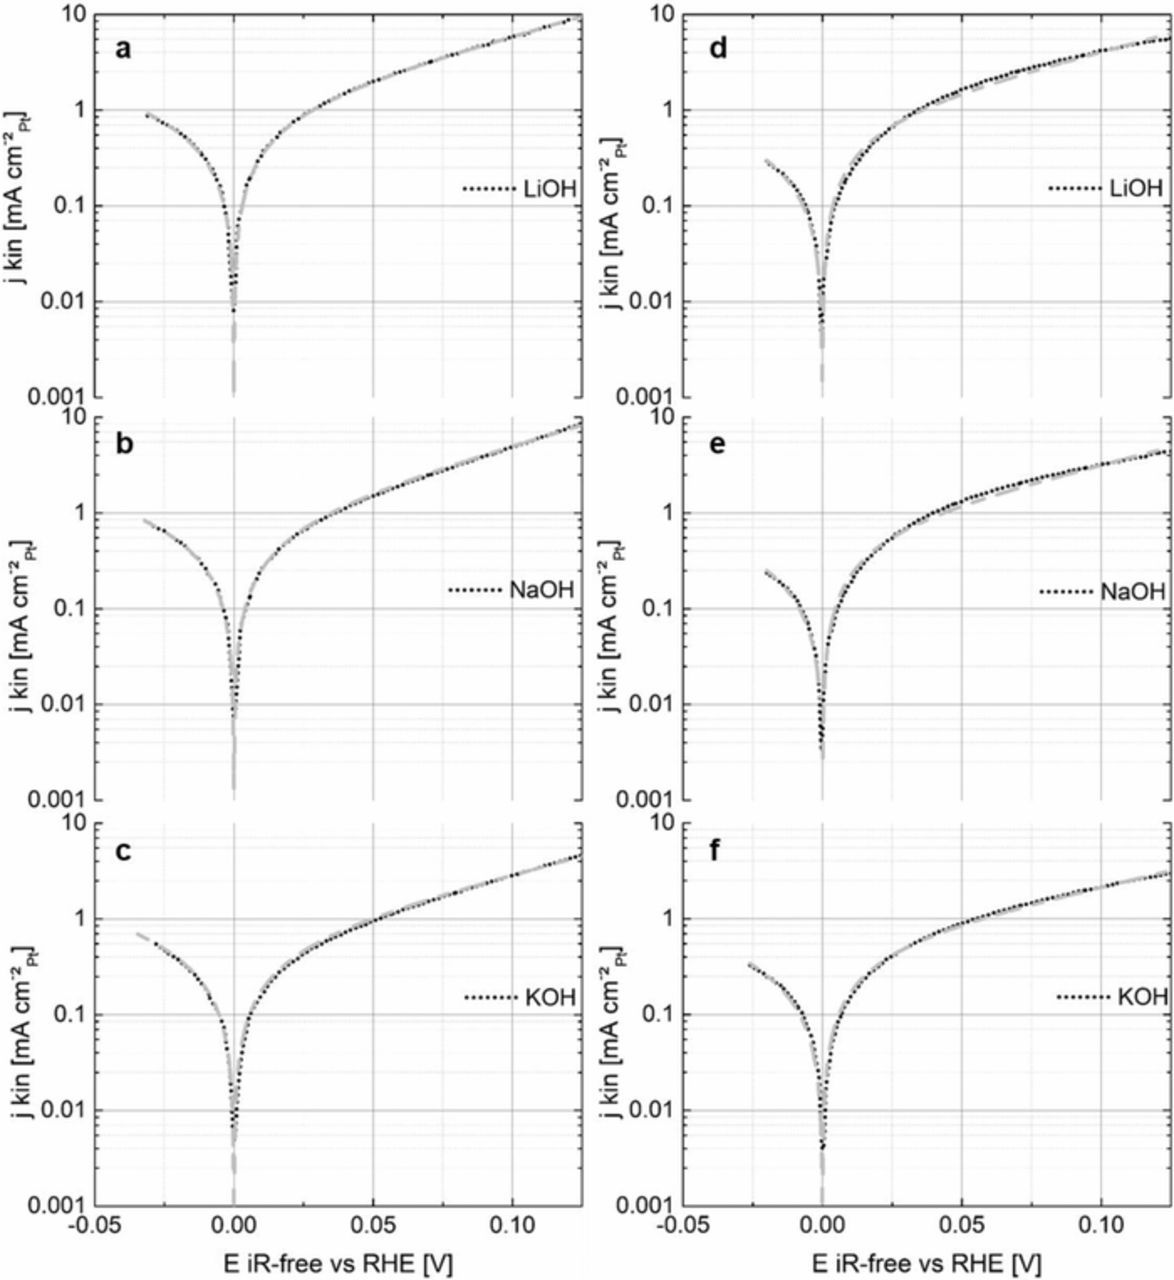
Figure 4. HOR/HER measured kinetic current densities (doted black lines) and the respective fits obtained from the B.V. equation (dashed gray lines) for the poly-Pt (left) and HSAC-Pt (right) in various H2-saturated 0.1 M electrolyte solutions (LiOH: a, d / NaOH: b, e / KOH: c, f) at room temperature. The kinetic current densities are normalized to the measured electrochemically active Pt surface areas in the respective electrolyte solution.
Based on the fits of the B.V. equation to the experimental data, the exchange current densities (j0 RT, B.V.) and transfer coefficients (α) for the poly-Pt and HSAC-Pt in various electrolyte solutions were established and are listed in Tables II and III. The exchange current densities (j0RT, B.V.) for the poly-Pt in 0.1 M LiOH, NaOH and KOH are 0.88 ± 0.02, 0.70 ± 0.01 and 0.57 ± 0.07 mA cm−²Pt and the corresponding transfer coefficients (α) are determined with 0.54 ± 0.03, 0.53 ± 0.02 and 0.53 ± 0.02 respectively. In case of the HSAC-Pt, the exchange current densities (j0RT, B.V.) and the respective transfer coefficients (α) in brackets were calculated with 0.72 ± 0.04 (0.49 ± 0.01), 0.62 ± 0.02 (0.47 ± 0.04) and 0.46 ± 0.03 (0.48 ± 0.04) mA cm−²Pt in 0.1 M LiOH, NaOH and KOH, respectively. The obtained exchange current densities (j0RT, B.V.) in 0.1 M KOH or NaOH are in good agreement with values published in the literature, which were performed in glass cells or PTFE cell compartments.18,22–25
Moreover, we observed that the branches for the HER (−0.025–0 V vs RHE) and HOR (0 – 0.125 V vs RHE) show a high degree of symmetry, indicating a similar reaction pathway for both reactions. The high symmetric shape for the HER and HOR branches is given by the absolute values of the transfer coefficient (α). The transfer coefficient is theoretically set as 0.5, which is in excellent agreement with our values for both electrodes. Altogether, we sum up that the catalytic HOR/HER activities increase in order of: KOH < NaOH < LiOH for the poly-Pt and HSAC-Pt, respectively. More precisely, the catalytic activity for the poly-Pt and HSAC-Pt in 0.1 M LiOH are around 1.5-fold higher than those in 0.1 M KOH or NaOH. In addition, we found that the exchange current densities for the poly-Pt are larger than those for the HSAC-Pt. The enhanced reactivity for the poly-Pt is very likely attributed to the extended surface arrangement with less defects and reduced number of low-coordinated surface atoms compared to that for Pt nanoparticles with particle sizes of around 2 nm. However, the differences in the exchange-current densities (j0RT, B.V.) of poly-Pt and HSAC-Pt in identical electrolytes are neglected. Thus, no particle size effect for HOR/HER on platinum can be claimed. Nevertheless, we can conclude that cations are able to accelerate the kinetics of HER/HOR on the Pt surface in the order of K+ < Na+ < Li+.
Slight deviations were observed by comparing the values of j0RT, B.V. extracted by fitting to the B.V. equation (Eq. 4) with the data of j0RT, Micro. obtained from the linear approximation of the B.V. equation (Eq. 5) in the micro-polarization range. This observation can be explained by the narrow potential range of ± 10 mV associated with less data points and non-consideration of the transfer coefficient for the determination of the j0RT, Micro.. In contrast, a larger potential range between −0.05 V and 0.125 V vs RHE was used for the evaluation of j0RT, B.V. in this work.
We want to emphasize that the determination of the exchange current density (j0) is not standardized in the literature and thus the activity comparison with other research groups is very difficult to date. The benefits of fitting the original data to the B.V. equation (Eq. 4) are the consideration of the transfer coefficient and the broad potential range associated with more data points. In some studies, the transfer coefficient (α) has been set as a constant value of 0.5,23,25 while other groups set α as variable parameter during the fitting process.22,26 In this work, α was set as variable parameter during the fit. These different approaches for the same electrochemical reaction highlight that there is a need for a standard protocol to evaluate the exchange current density and transfer coefficient for the HOR/HER in alkaline media like that for the well-known oxygen reduction reaction (ORR) studies.
Determination of the activation energy for HOR/HER on a poly-Pt surface at different electrolytes
Temperature-dependent electrochemical measurements were carried out to establish the activation energies for the different kinetics of the HOR/HER on a poly-Pt surface in various monovalent cation-containing electrolytes. The HOR/HER polarization curves for the poly-Pt at 278 K, 288 K, 298 K and 308 K in 0.1 M of LiOH, NaOH and KOH are displayed in Figure S4 (see supporting information). We estimated the temperature-dependent exchange current densities in all three electrolyte solutions and then correlated the exchange current densities with the applied temperature according to the Arrhenius's relationship.
Figure 5 shows the Arrhenius plot of the HOR/HER exchange current densities on the poly-Pt electrode in 0.1 M LiOH (blue), NaOH (red) and KOH (black), highlighting the effect of the monovalent cations. The linear fits (denoted with dashed lines) signify a good relationship of the logarithmic exchange current density and the reciprocal temperature.
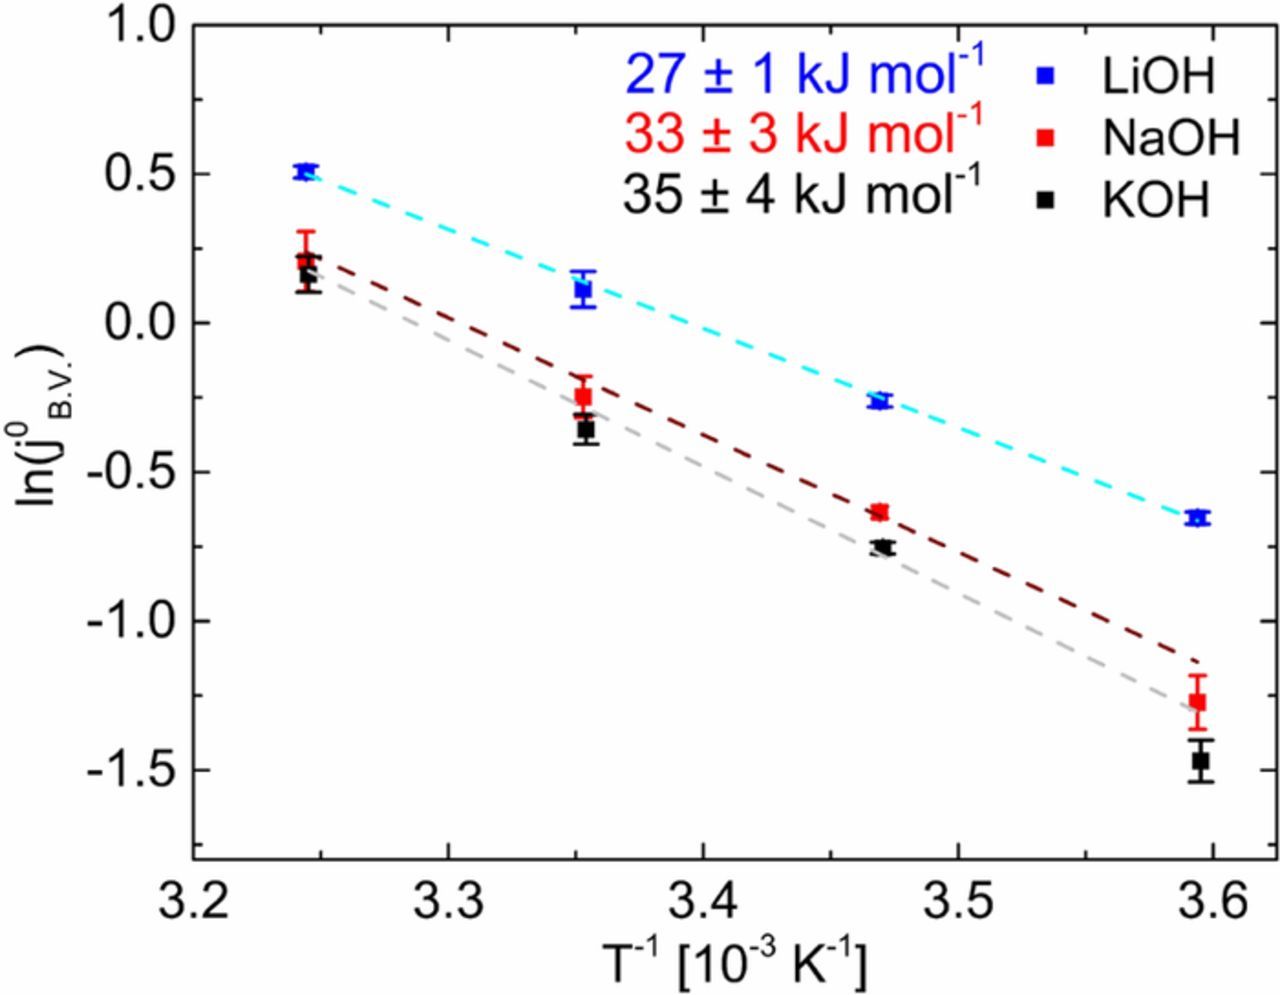
Figure 5. Arrhenius plots of the HOR/HER exchange current densities (j0B.V.) on a poly-Pt in 0.1 M LiOH (blue), NaOH (red) and KOH (black). The colored points are the measured j0B.V., while the dashed lines symbolize the linear regression. The exchange current densities at each temperature were confirmed by three independent measurements.
The activation energy (EA) for the HOR/HER kinetics on the poly-Pt electrode in various cation-containing solutions was determined according to Eq. 6. First, we observed that the logarithmic exchange current densities (j0B.V.) measured in 0.1 M LiOH are significantly higher over the entire temperature range compared to those in NaOH and KOH. This observation is related to the lower activation energy (EA) for the HOR/HER kinetics in the presence of Li+ cations. In other words, the activation energy clearly increases in the following order: 27 ± 1 (Li+), 33 ± 3 (Na+) and 35 ± 4 (K+) kJ mol−1 in 0.1 M of alkaline electrolyte solution, respectively. Our results in 0.1 M KOH are in good agreement with the literature.22,23 We can sum up that the presence of Li+ cations in the Helmholtz plane decreases the activation energy for HOR/HER kinetics in alkaline media compared to Na+ or K+. This trend points out the role of monovalent cations in the kinetics of HOR/HER on a Pt surface.
Effect of monovalent cations on the HOR/HER kinetics
The question arises about the origin of the HER/HOR activity differences on the Pt surface in the environment of monovalent cations with the same concentration. Since the pH value and consequently the concentration of hydroxide ions can be seen as constant, we assume that the change of the HOR/HER kinetics are stemmed from the presence of monovalent cations with different ionic radii.27,28 Cations might co-adsorb on a Pt surface at lower potentials and high pH values. The co-adsorption of alkali cations during the HER has recently been reported from Thorson et al.13 They have shown that the current density of the HER decreases by increasing ionic radius of the used cation, indicating the tendency of smaller cations to adsorb on the electrode surface at cathodic potentials more negative than −0.1 V vs RHE and high pH values. However, we observed that the ECSA and surface roughness for the poly-Pt and HSAC-Pt are very similar in LiOH, KOH and NaOH with 0.1 M of concentration, indicating that the co-adsorption of Li+, K+ and Na+ cations can mainly be neglected at positive potentials. In the other hand, cations can modify the arrangements in the Helmholtz plane and/or electrolyte conductivity which alter the potential drop into the electrolyte.
To highlight the effect of monovalent cations, Figure 6 shows two cations with different ionic radii, the corresponding arrangement of water molecules as well as the possible non-covalent interactions of water molecules with the adsorbed hydrogen on the Pt surface. In principle, smaller monovalent cations exhibit higher hydration number in the first shell. The ionic radius of the alkali metal cations increases within the group (for Li+ 69 pm, Na+ 102 pm and K+ 138 pm)20 and thus number of water molecules in the M+-(H2O)x complex are 22 for Li+, 13 for Na+ and 7 for K+, respectively.29,30 We suggest that due to the hydrogen bond interactions, the close-by water molecules are stronger oriented in the environment of Li+ cations compared to those in the environment of Na+ and K+ with the same concentration. These oriented water molecules interact with the adsorbed hydrogen by hydrogen bond. As illustrated in Figure 6, the close-by water molecules in the outer Helmholtz plane might go electrostatic attraction or repulsion with the adsorbed hydrogen (Had) on a Pt surface. We assume that the non-covalent interactions of hydrated cations with adsorbed hydroxide affect the ad-/desorption energetics of the hydrogen in the Hupd region. The weakening of the energetics of adsorbed hydrogen appears in the CV profile measured in various monovalent cations with same concentration. In our case, we observed a significant potential shift for the Pt-H ad-/desorption in Li+-containing 0.1 M electrolyte solution (Figure 1). Obviously, this potential shift to lower values implies a decrease of the free enthalpy (ΔG) for the hydrogen ad/desorption process in the surrounding of Li+ cations. It seems so that Li+ cations are able to weaken the adsorbed hydrogen on the Pt surface, which is very critical for the HOR in alkaline environment. This is in line with the observed the enhanced kinetics of the HOR in Li+-containing electrolyte solutions (see Tables I and II and Figure 3). The exchange current densities for the HOR/HER on the Pt surface increase in the same order as the hydration number of cations (K+< Na+ < Li+). Consequently, the activation energy for the HOR/HER kinetics decreases accordingly: 27 ± 1 (Li+), 33 ± 3 (Na+) and 35 ± 4 (K+) kJ mol−1 in 0.1 M of alkaline electrolyte solution. Further work is progress to better understand the role of the supporting electrolyte and the resulting non-covalent interactions based from the hydrated cations and hydrogen bond during the HOR/HER.
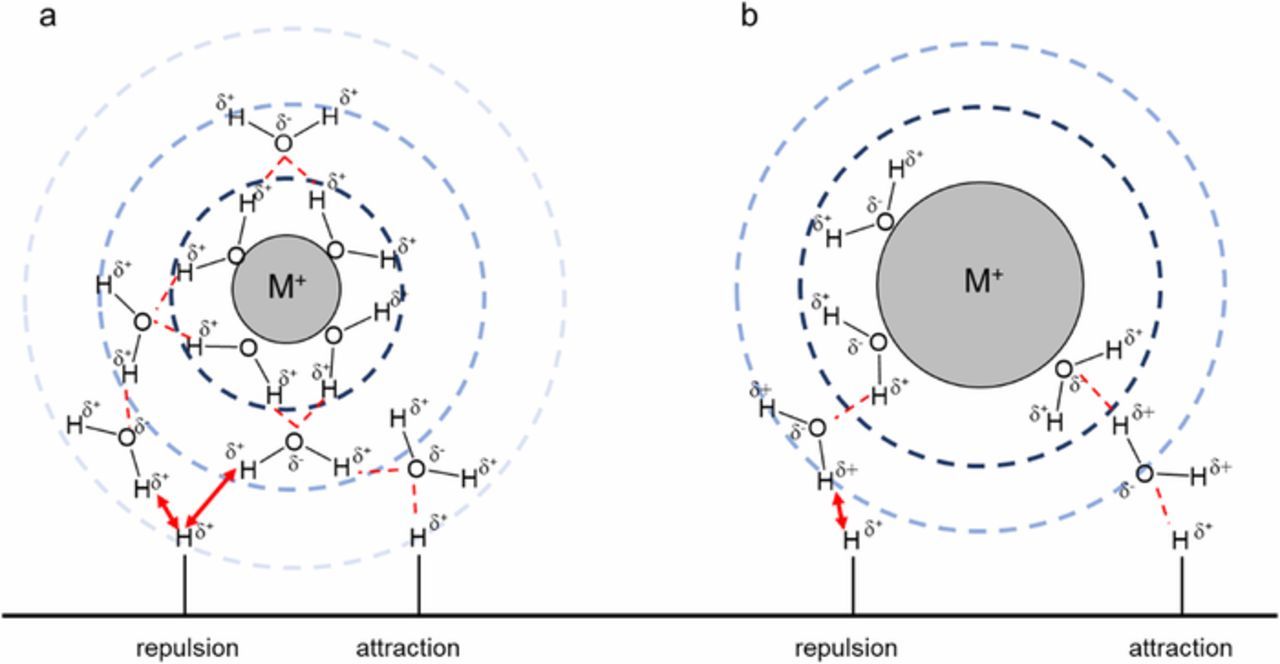
Figure 6. Proposed model for non-covalent interactions between the water molecules in the outer Helmholtz plane and adsorbed hydrogen on a Pt surface. The arrangement of the water molecules is influenced by the ionic radius of the monovalent cation and hydrogen bond. For instance, smaller monovalent cations show a high number of solvated water molecules in the M+-(H2O)X complex compared to larger cations at the same concentration. Based on the strength of the hydrogen bond, the non-covalent interactions between the water molecules and adsorbed hydrogen can be modified by repulsion and attraction. This controls the energetics of the adsorbed hydrogen which is very critical for the kinetics of HOR in alkaline environment.
We can sum up that the solvated cations which go non-covalent interactions with the adsorbed hydrogen on the Pt surface play a critical role in the reaction rate of the HOR/HER in alkaline media. It is obvious that the kinetics of the HOR in alkaline environment is mainly controlled by the electronic stabilization/interaction of the adsorbed hydrogen by hydrogen bond in the outer Helmholtz plane.
Conclusions
In this work, we presented a comprehensive study about the effect of various monovalent cations (Li+, Na+, and K+) on the HOR/HER activity for the poly-Pt and HSAC-Pt in alkaline environment. Based on our electrochemical results, the ECSA and rf-values for the poly-Pt and HSAC-Pt are not affected by the various cation-containing solutions, indicating that the co-adsorption of these cations can mainly be neglected in the Hupd region. More interestingly, our results show that the HOR/HER kinetics are strongly influenced from the nature of the used cation in the electrolyte. In particular, the exchange current densities for the HOR/HER increase in the order of: KOH < NaOH < LiOH for the poly-Pt and HSAC-Pt. The improved activity on the Pt surface in Li+-containing electrolyte is associated with the lower activation energy compared to those in NaOH and KOH. The activation energy for the HOR/HER on a poly-Pt electrode increases in the order of Li+<Na+<K+. We suggest that the differences in HOR activities are stemmed from the critical arrangement of water molecules which is strongly controlled by the monovalent cations and respective hydrogen bond. This kind of non-covalent interactions cause a change in the energetics of absorbed hydrogen and might modify the reactivity of Pt for the HOR/HER.
Altogether, we provide deeper understanding about the effect of monovalent cations on the kinetics of the HOR/HER and show that the energetics of adsorbed hydrogen on the metal can be used as a critical descriptor to improve the HOR performance under alkaline conditions.
Acknowledgment
This work was supported by Federal Ministry of Education and Research (BMBF, ECatPEMFC, FKZ 03SF0539).
ORCID
M. Oezaslan 0000-0001-8545-7576