
Abstract
A model is proposed on the origin of the reversible redox transitions of molybdenum (Mo) and its oxides. The major and minor redox transitions are proposed to be associated with two thermodynamically non-equivalent adsorption sites at the structured surface oxides. Anion interaction/adsorption was found to be a decisive factor. The criterion is based on the combination of evidences and assumptions and is derived from the variations observed in the two redox transitions during a series of cyclic voltammetry (CV), linear sweep voltammetry (LSV), electrochemical impedance spectroscopy (EIS), and open circuit potential (OCP) transient studies. The experiments were conducted using different electrolytes with dissimilar anions (Cl−, SO42− and ClO4−) and spanned a range of different pH values. The results described herein constitute an important step towards understanding the interfacial electrochemical processes of Mo and its oxides, and will be of use for a wide range of their applications.
Export citation and abstract BibTeX RIS
It has been suggested that the reversible redox transitions of Mo oxides are primarily the results of the redox reactions involving the H+/cations of the electrolyte.1,2 Mo oxides exhibit two redox transitions: one major and one minor.2,3 Most reports in this area focus on bulk Mo oxides,2 whereas only a few have addressed the redox behavior of metallic Mo.3,4 For metallic Mo, the redox transitions correspond to the extremely thin surface oxides. Detailed description of the topic with comprehensive literature analysis is provided elsewhere.3
The major process occurring during the electrochemical reduction is the formation of Mo oxide bronzes.1–3 The available reports attribute the two redox transitions to either Mo oxide bronzes or lower Mo oxides.2,5,6 We recently disclosed the results of our investigation into this phenomenon on metallic Mo as a function of electrolyte cations and anions.3 Our study provided, for the first time, clear evidence for the role of electrolyte anions on the redox transition. We also demonstrated that the major redox transition was related to the interaction/adsorption of electrolyte anions and cations at the surface oxides.3
Despite the significant number of reports on the various electrochemical aspects of Mo and its oxides,2,3 a satisfactory explanation for the appearance of the two redox transitions is notably missing. Perhaps this is due to the quiet complex interfacial electrochemistry associated with these systems. Even sophisticated instruments may not reveal the secrets behind such processes. Here, we propose a modified explanation on the origin of the redox transitions. The conclusions presented in this report are based on comprehensive studies carried out on the pH and anion dependency of the redox transitions. The results disclosed are significant when considering the large number of electrochemical studies reported on Mo and its oxides in different application areas.2
Experimental
Commercial-grade thin film ∼1 μm Mo/glass electrodes were sequentially cleaned ultrasonically in detergent solution, deionized water and finally in ethyl alcohol. They were dried in an Ar flow prior to use. An X-ray diffraction (XRD) of the Mo/glass electrode revealed a major peak at 2θ of ∼40.6 (Supporting information, Figure S1). All the chemicals were of AR grade (Sigma Aldrich) and double distilled water was used.
A conventional three-electrode cell consisting of a 1 cm2 Mo working electrode, a Pt mesh counter electrode and a Ag/AgCl reference electrode was employed for the electrochemical studies. The electrolyte was de-aerated using an Ar gas flow (∼0.04 L min−1) for 1 h in a sealed cell prior to use. Ar entered and exited the cell through inlet and outlet valves, respectively. The Ar gas inlet nozzle maintained a purging Ar flow immediately above the electrolyte during the measurement. The positive potential limit of scanning was set to be –0.05 V so as to study the redox behavior in the passive range.2,3 Peak current (ip) and peak potential (vp) were obtained by manual curve fitting (Supporting information, Figure S2).
EIS (Autolab with FRA module) measurements were carried out under 0.01 V AC signals in the frequency range of 10−2 to 105 Hz. The best fit of EIS plots was obtained using a simple equivalent circuit that comprised of solution resistance (Rs) in series with capacitance (C) in parallel with resistance (Rox). The C and Rox represent the total capacitance at the oxide/solution interface and the oxide film resistance, respectively.3,7
Results and Discussion
pH and anion dependent redox transitions
Figure 1 shows CVs of Mo/glass electrodes recorded at various pH levels and with the three electrolytes bearing different anions. Peaks corresponding to two redox processes emerged. In SO42−, the major redox peaks (a1 and c1) were evident at pH 1.5, 2.5, 3.0 and 3.5. A similar variation was observed in Cl−, even though a clear redox peak was not detected at pH 3.5 at scan rate (ω) ≥ 0.10 V.s−1; whereas in ClO4−, the redox peak was not apparent when the pH exceeded 2.5. The minor redox peaks (a2 and c2) in general underwent analogous variation to the major redox peaks. The redox transitions were not distinct in neutral media.
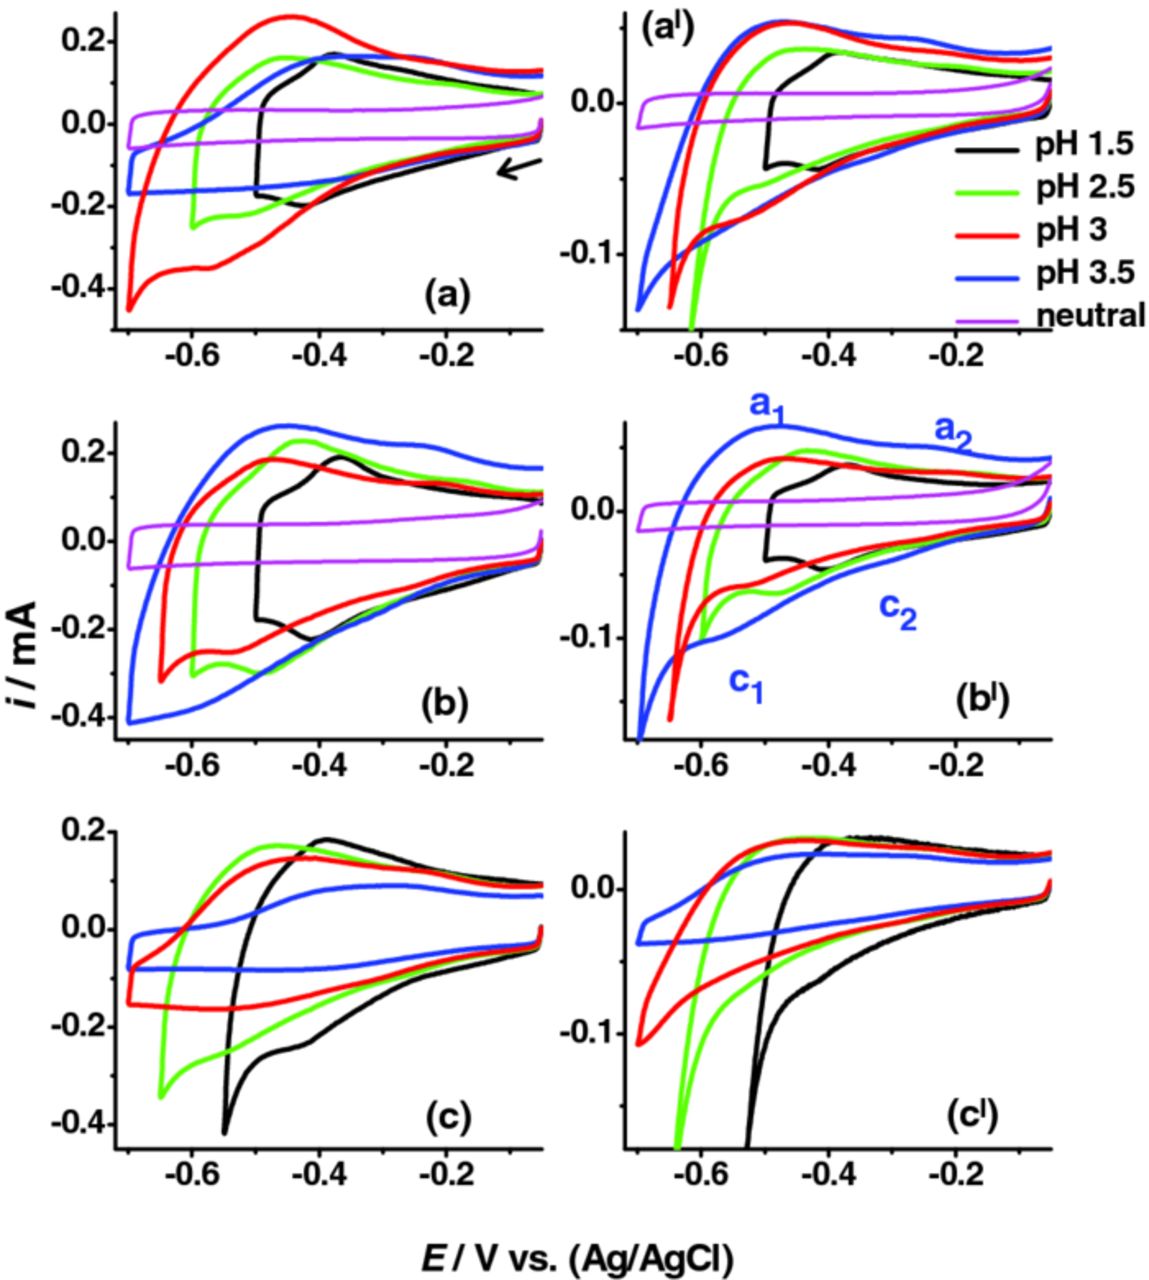
Figure 1. CVs of Mo electrodes in de-aerated (a, al) NaCl + HCl, (b, bl) Na2SO4 + H2SO4 and (c, cl) NaClO4 + HClO4 at different pH (0.6 M salt concentration). Scan rates of 0.10 and 0.02 V.s−1 were used for left side (a, b, c) and right side (al, bl, cl) plots, respectively. Cathodic limiting potential was adjusted marginally to see the c1 peak clearly.
The linear dependence of ip of peak c1 with ω confirmed that the peak was associated with the surface oxide species and the electrode process was adsorption controlled (Figure 2).8 The ip and vp of peak a1 showed a similar variation (Supporting information, Figure S3). At pH 1.5, the difference between the vp of a1 and c1 peaks in Cl−, SO42− and ClO4− were always less than 0.06 V and the peak current ratios (ipc1/ipa1) were near unity: all of which are characteristics of reversible redox processes. The corresponding peak separations at pH 2.5 were 0.059, 0.053 and 0.080 V (at 0.10 V.s−1), respectively. The c1 and a1 peak separation showed a proportional increment with pH increased, which is indicative of the deviation more from reversibility.8
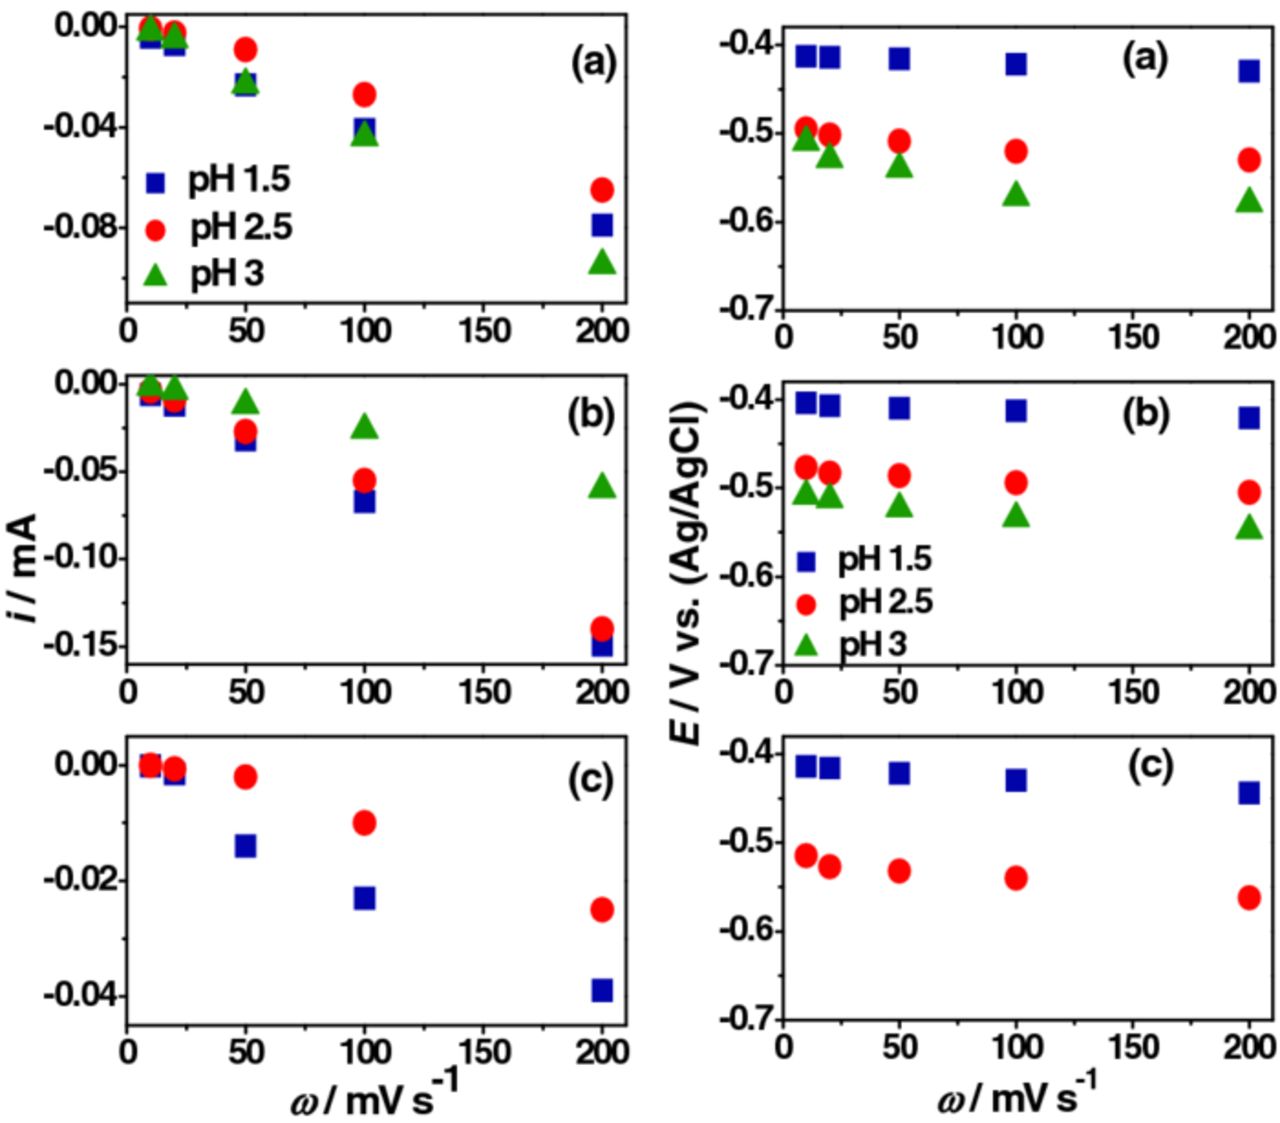
Figure 2. ip and vp of peak c1 from Figure 1: (a) NaCl + HCl, (b) Na2SO4 + H2SO4 and (c) NaClO4 + HClO4.
The role of cations and anions on the major redox transition can be understood from Figures 1 and 2. The decreased ip of the c1 peak and the shifting of vp to more negative values with increased pH can be attributed to the decreased H+ concentration in the electrolyte (main reducing agent). The maximum ip and most positive vp of the c1 peak were recorded in SO42− except at pH 3 where the ip of the c1 peak in Cl− was higher than the corresponding value in SO42−. The ip of c1 peak were lowest in ClO4− with a more negative vp irrespective of the pH level. These variations can be explained as due to a more effective interaction/adsorption of SO42− and Cl− at the surface oxides.3 The absence of redox peaks and the decreased overall reduction current above pH 2.5 in ClO4− can be correlated to its adsorption capabilities.3,9,10 Figures S4 and S5 (Supporting information) compares CV, ip and vp with the nature of anions. The odd behavior in Cl− at pH 3 (where ip of c1 peak was higher than those at pH 1.5 or 2.5) can be explained by the complex Cl− chemistry and its ability to form strong interaction with the hydrated surface oxides.3,11 The passive surface oxides at pH 1.5 and 2.5 is likely to be different from those at pH 3 or 3.5 (Supporting information, Figure S6). It was expected that the MoO2/MoO(OH)2 ratio of the passive film12,13 would decrease at pH 3 and hence excess hydroxide facilitated more effective Cl− interaction/adsorption. According to the passive film structure proposed by Lu and Clayton,12 the film at the potential range of redox transitions was composed mainly of Mo(IV) oxide/hydroxides (MoO2 and MoO(OH)2). The outer portion of the film is expected to be rich in the hydroxide fraction and the inner layer rich in MoO2.
Interestingly, there was an absence of redox transitions in neutral media. We primarily attributed this to the thin passive surface oxide and its instability in neutral/alkaline media leading to the formation of soluble surface species.2 The Na+ or anions in the electrolyte would have contributed to the redox peak provided a stable passive surface oxide or a much thicker oxide layer existed on Mo. Despite the apparent instability, presence of a thicker oxide layer may provide ample catalytically active centers for the redox process. Because of the excess hydroxides in the passive film12 and the reduced H+ activity in the electrolyte, anion interactions can be facilitated at higher pH levels provided the thin passive surface oxides remains stable. The absence of distinct redox behavior in Cl− at pH 3.5 at ω ≥ 0.1 V.s−1 (Figure 1) may also be related to its corrosive interactions. Time-dependent anion adsorption (at OCP) or anion adsorption during repeated CV scans was not found to have any significant impact on the major redox transition (Supporting information, Figure S7).
OCP transient studies coupled with Ar gas bubbling experiments and EIS phase angle plots (Supporting information, Figure S8 and S9 respectively) were employed in order to gain insight as to the extent and nature of the interactions between the cations/anions and the surface oxides. Representative OCP transient plots were recorded in SO42− (Supporting information, Figure S8). The OCP was initially recorded after immersion of the Mo electrode in the de-aerated electrolyte for 10 min (line a). Next the electrode was subjected to an LSV from –0.05 to –0.60 V (the potential range corresponding to the redox transition) and the OCP was recorded thereafter (line b). Subsequently Ar bubbling was performed for 2 min prior to additional OCP recording (line bl). The lines c and cl corresponds to similar experiment where LSV was extended up to –0.90 V (from –0.05 to –0.90 V) on a new electrode. The OCP shift was significant after the LSV corresponding to the redox transition (lines a and b). However, soon after the Ar bubbling, the OCP retained potentials close to the original value (line bl is close to line a). Such a behavior suggests that the ionic (anion and/or cation) interaction/adsorption at the surface oxides that occurred during the LSV corresponding to the redox transition was weak. Perhaps this indicates that the anion interaction during the potential range of redox transition is predominantly electrostatic in nature. The figure also indicates that the cation interaction at the potential range of redox transition mainly transpires at the surface/near-surface of the passive oxides and significant irreversible ingression of H+/cation into the oxides occurs only after the potentials corresponding to the redox transitions. This was evident when the LSV was performed to more negative values (lines c and cl), where Ar bubbling does not considerably affect the OCP variation. Under these conditions, the electrode was unable to retain the original OCP (line a). Similar variations were observed for the corresponding Cl− and ClO4− electrolytes (data not shown).
The difference between the lines a and bl can be associated with the electron transfer processes and/or the ion's adsorption/interaction. Considering the adsorption factor, one can suggest that only a few anions would have specifically adsorbed and/or a few cations would have irreversibly adsorbed during the reduction process corresponding to the redox transition. We propose that most of the anion interaction would have happened via electrostatic attraction possibly via the hydrated oxide (MoO(OH)2). The extent of chemisorbed Cl− and SO42− are expected to be higher than that of ClO4−. To the best of our knowledge, there are only a few studies in which experimental evidences were provided for the existence of anion (Cl−) on Mo passive film through in-situ XPS studies.7,12 When compared to the anion interaction, cation migration to the surface oxides is a much more facile process and the cations can be intercalated into the film of oxide layer. Both the anions and cations in the electrolyte can contribute to the redox transition through interaction/adsorption at the surface oxides.3
EIS phase angles plots corresponding to the redox transition, recorded before and after the LSV, provided noticeable differences among the three electrolytes (Supporting information, Figure S9). At low frequencies in ClO4−, the decrease in phase angles provides an evidence for the higher concentration of H+/cations charging into the surface oxides. The higher H+/cations charging in ClO4− can be associated with a lower anionic barrier effect (due to the lower adsorption tendency of ClO4−),3 and/or due to the possible formation of a marginally thicker surface oxide (due to the higher oxidizing nature of HClO4). The second factor was evident through variation in the high frequency region where higher phase angles were always recorded in ClO4−. Conversely, the decline in phase angles at low frequencies indicates the deterioration of the protective properties of the passive film. This supports the lower adsorption capabilities of ClO4− (faster H+ ingression) and the associated lower ip of c1 peak in Figure 1. Both the SO42− and Cl− exhibited a similar variation. Further discussion on EIS is provided in Section - EIS studies.
Variation of the minor redox transition
Both the major and minor redox transitions were expected to change with the surface species (cations/anions interacting at the surface oxides). Several alternative electrochemical experiments were conducted in order to reveal any significant variation in the minor redox peak. Among them, the time-dependent studies in Cl− revealed some interesting results (Figure 3). The peak a2 showed a noteworthy enhancement in the CVs recorded after 6 h. In order to study the variation of the redox peaks, the electrode was kept immersed in the same electrolyte for 8 h (t = 8 h) following the initial CV scan (t = 0 h). The ip vs. ω plot of the CVs recorded at t = 8 h for peaks c1, a1 and a2 are provided (Supporting information, Figure S10). The c2 peak was not present to a significant level. Both the c1 and a1 peaks showed adsorption controlled behavior (similar to Figure 2). However, the ip vs. ω plot of peak a2 showed an apparent deviation from the linear behavior.
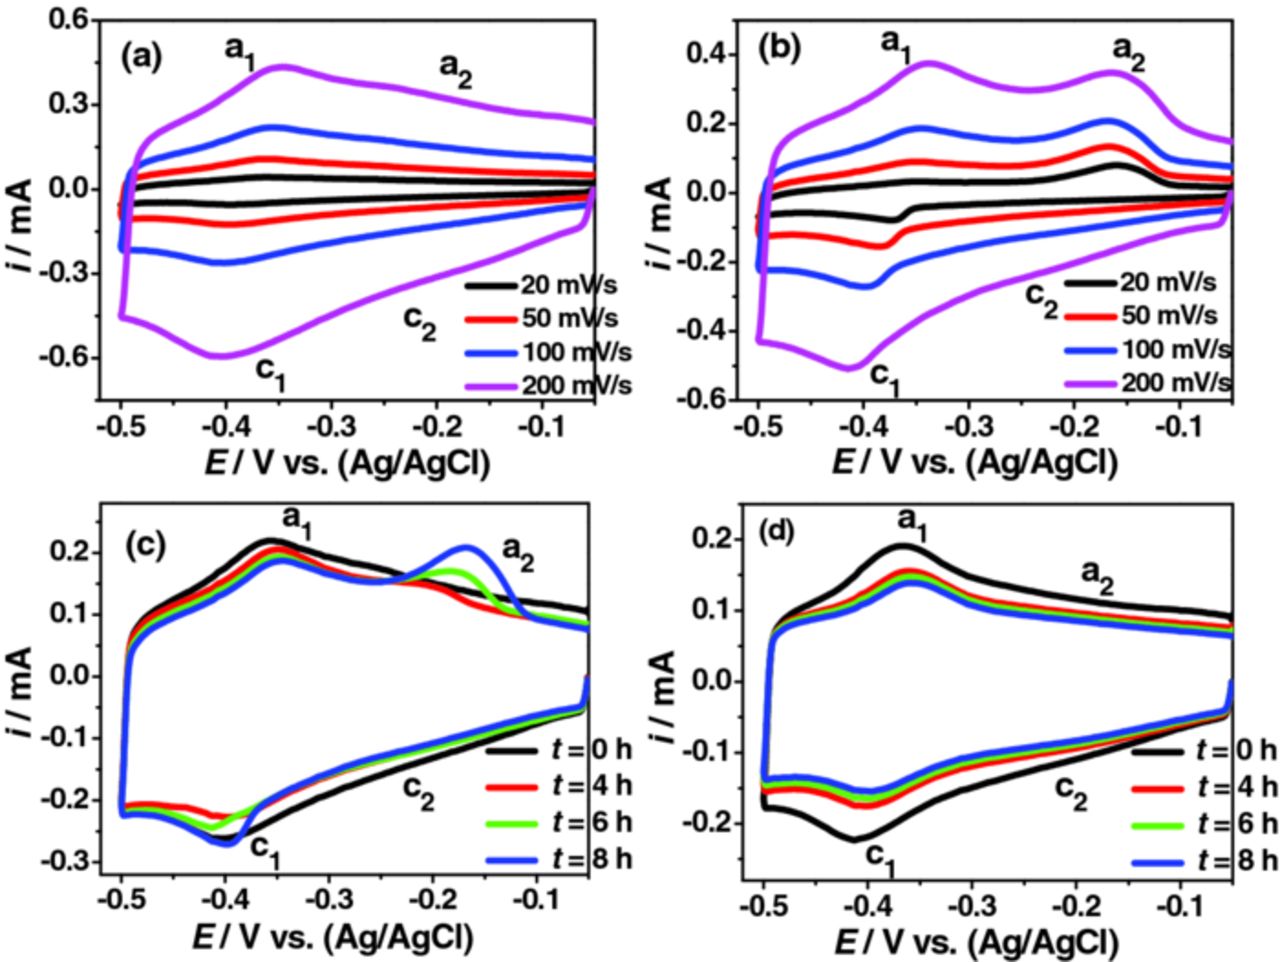
Figure 3. (a-c) Variation of the redox peaks in de-aerated KCl + HCl (0.6 M salt at pH 1.5) during time-dependent studies; (a) and (b) ω - dependent CVs recorded at t = 0 h and t = 8 h; (c) time-dependent CVs recorded at 0.10 V.s−1; (d) corresponding time-dependent CVs recorded in K2SO4 + H2SO4. Experimental procedure used was similar to that of Figure S7. A faster Ar gas bubbling rate (∼0.20 L min−1) was employed and the gas nozzle was kept very close to the electrode's surface.
Figure 4 shows the CVs (after t = 8 h) scanned at different potential ranges. The minor redox transition was not seen when the maximum negative potential was –0.20 or –0.35 V (Figure 4a and 4b). However, peak a2 was observed once the cathodic limiting potential was extended to –0.40 V (Figure 4c). Both the peaks a1 and a2 become evident upon extension of the scan to include more negative potentials, but only after the appearance of the peak c1 (Figure 4d and 4e). The corresponding plots at a lower ω of 0.01 V/s are also provided (Figure 4f – 4i). Here, the ip of peak a2 was significantly higher than that of peak a1. Initially it appeared as if the ip of peak a1 varied in proportion to the ip of peak a2 over time (Figure 3c). However, this was not the case as the variation of peak a1 was in a similar line to when ip of peak a1 remained constant after an initial decrease at t = 2 h (Supporting information, Figure S7). A gradual decrease in the ip of the a1 or c1 peak with increased CV scans is characteristic of the system of Mo with passive surface oxides and can be correlated with the decreased availability of the surface oxides for the redox process due to the initial CV scans.2
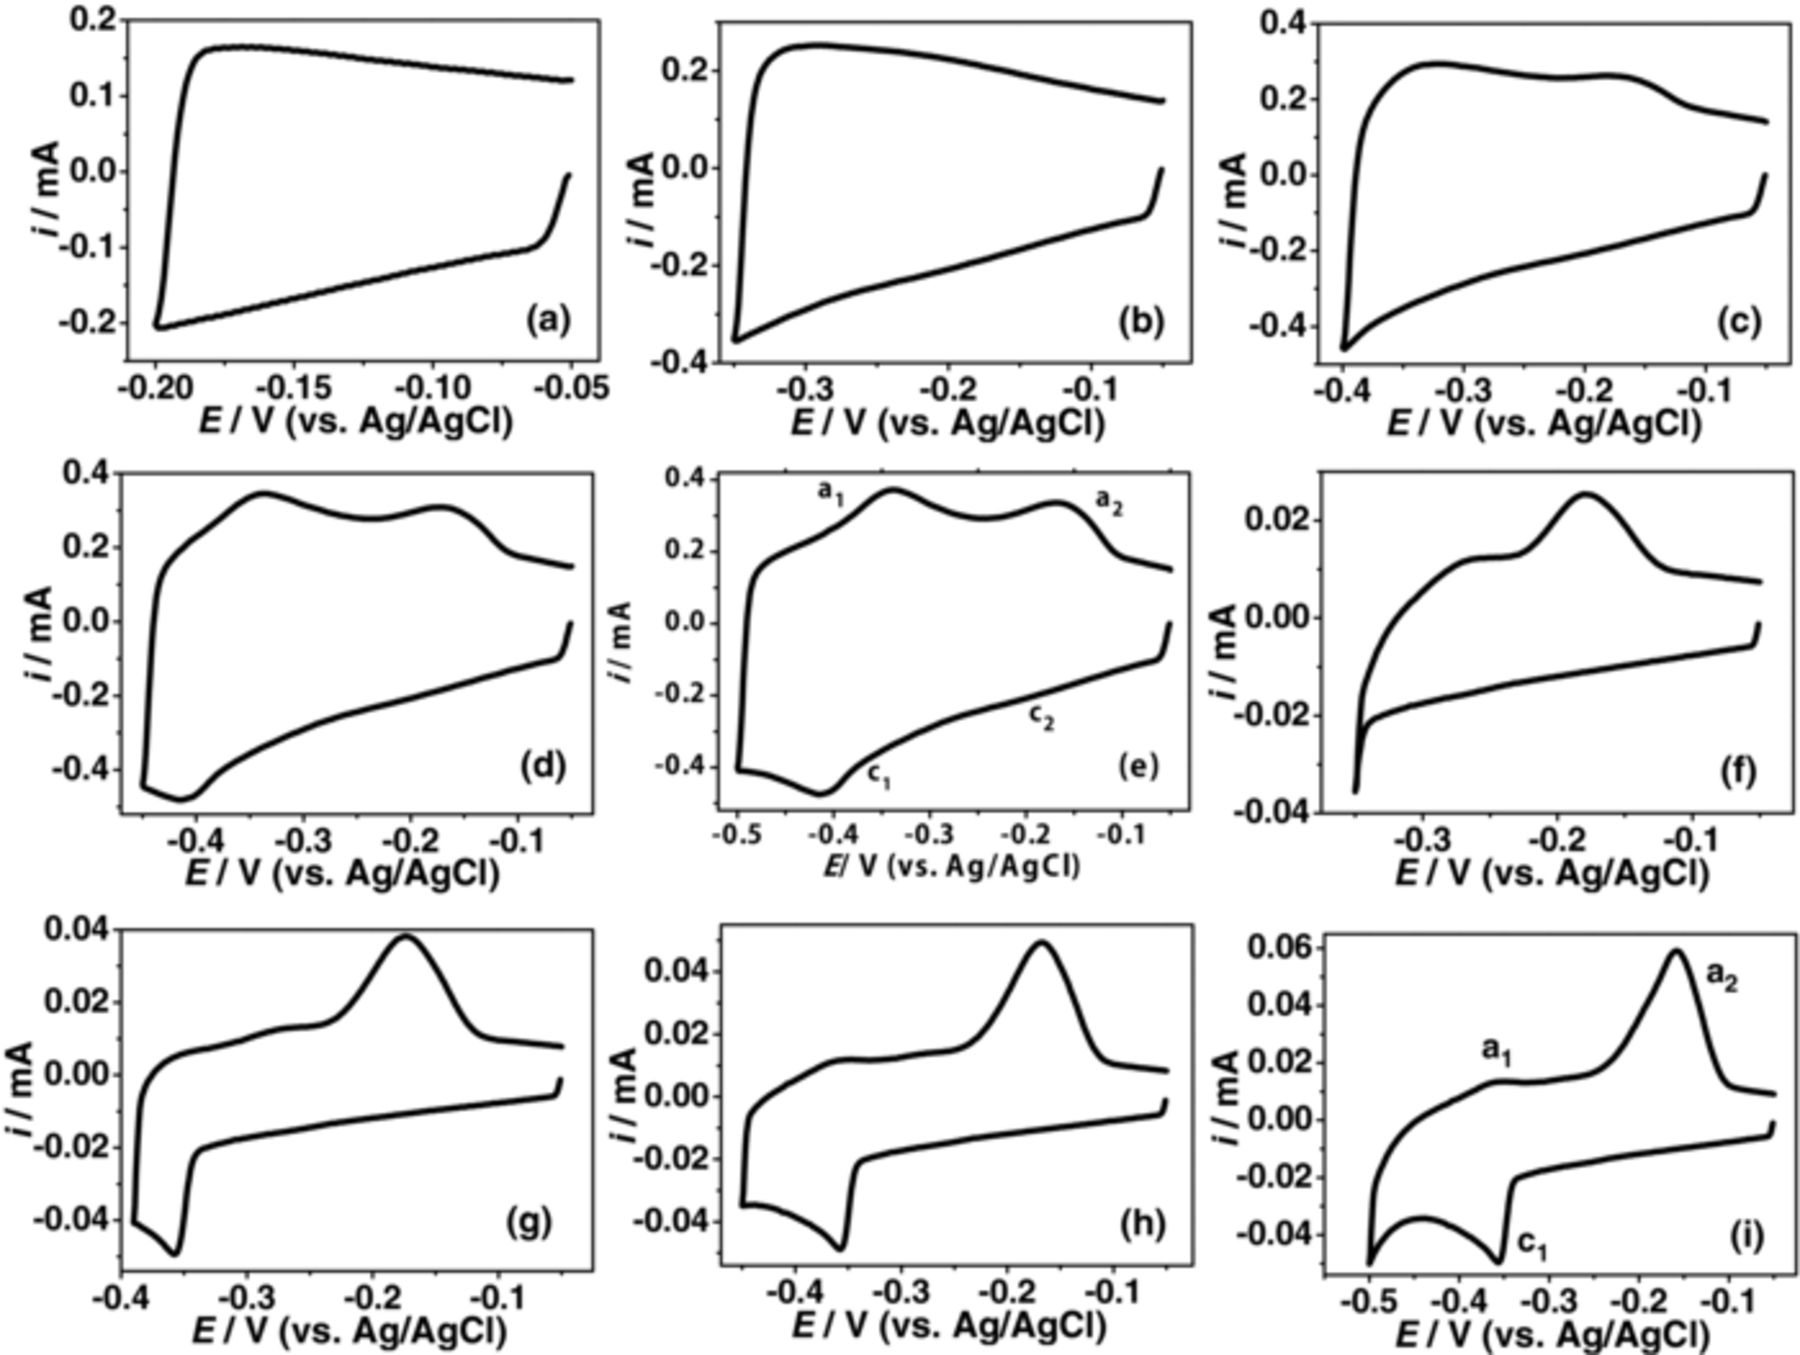
Figure 4. (a-c) Variation of the redox peaks in de-aerated KCl + HCl (0.6 M salt at pH 1.5) after t = 8 h at different potential ranges. The scan started from –0.05 V to different cathodic limiting potentials. Plots (a)-(e) were recorded at 0.10 V.s−1, whereas plots (f)-(i) corresponds to 0.01 V.s−1.
The oxidation/desorption process corresponding to the peak a2 should have been clear with the increase in the number of CV scans. Yet, the similar variations were not observed when the experiments were repeated in SO42− or ClO4− irrespective of the cationic species used (Na+ or K+). Representative plots recorded in SO42− are provided in Figure 3d. The data suggest that the variation observed for the peak a2 (Figure 3b and 3c) is associated with either Cl− or cations or both. By increasing the time from t = 0 to t = 8 h, a small number of adsorbed Cl− or cations should have been able to participate in the oxidation process. Due to the thin passive oxide layer, such a process may not occur at t = 0 h. This is further supported by our multiple cycle CV experiments recorded at t = 0 h (Figures 5 and 6). The variation of the major redox transition with electrolyte anions is further evident from Figure 5a–5c. The minor redox transition was well resolved in Cl− and SO42− at higher pH (Figure 5e–5g). The continuous increase expected in overall reduction current, resulting from an increase in the number of CV cycle was not observed due to the thin passive surface oxide. After the first CV cycle, the overall reduction current showed an abrupt decrease followed by a marginal gradual increase. Figure 6 shows corresponding plots recorded from a more positive potential (scan started from 0.35 V). It was expected that the electrode would have a thicker transpassive Mo(VI) surface oxide due to the positive potential range used. The CVs vary significantly with anion content in the electrolyte (Figure 6a–6c). A continuous increment in the overall reduction current was not observed in SO42− (Figure 6b), while it was for Cl− (Figure 6a). This is perhaps due to the formation of a more effective SO42− anionic barrier layer at the surface oxide.3 The absence of such an effective anionic barrier layer in Cl− and ClO4− would facilitate the continuous ingression of cations to the thicker surface oxide. Change in the overall reduction current may also depend on the variation in the anion reduction at the surface oxides. The data indicate that with an increase in the number of CV cycle, the reduction tendency of anion is in the order of Cl− > ClO4− > SO42−. Considering the faster cation reduction/intercalation kinetics and the presence of thicker oxide layer, we theorize that the contrasting behavior in the overall reduction current variation in the three electrolytes contains significant contribution from the restricted cation reduction kinetics by the SO42− anionic barrier layer formation (Figure 6a–6c).
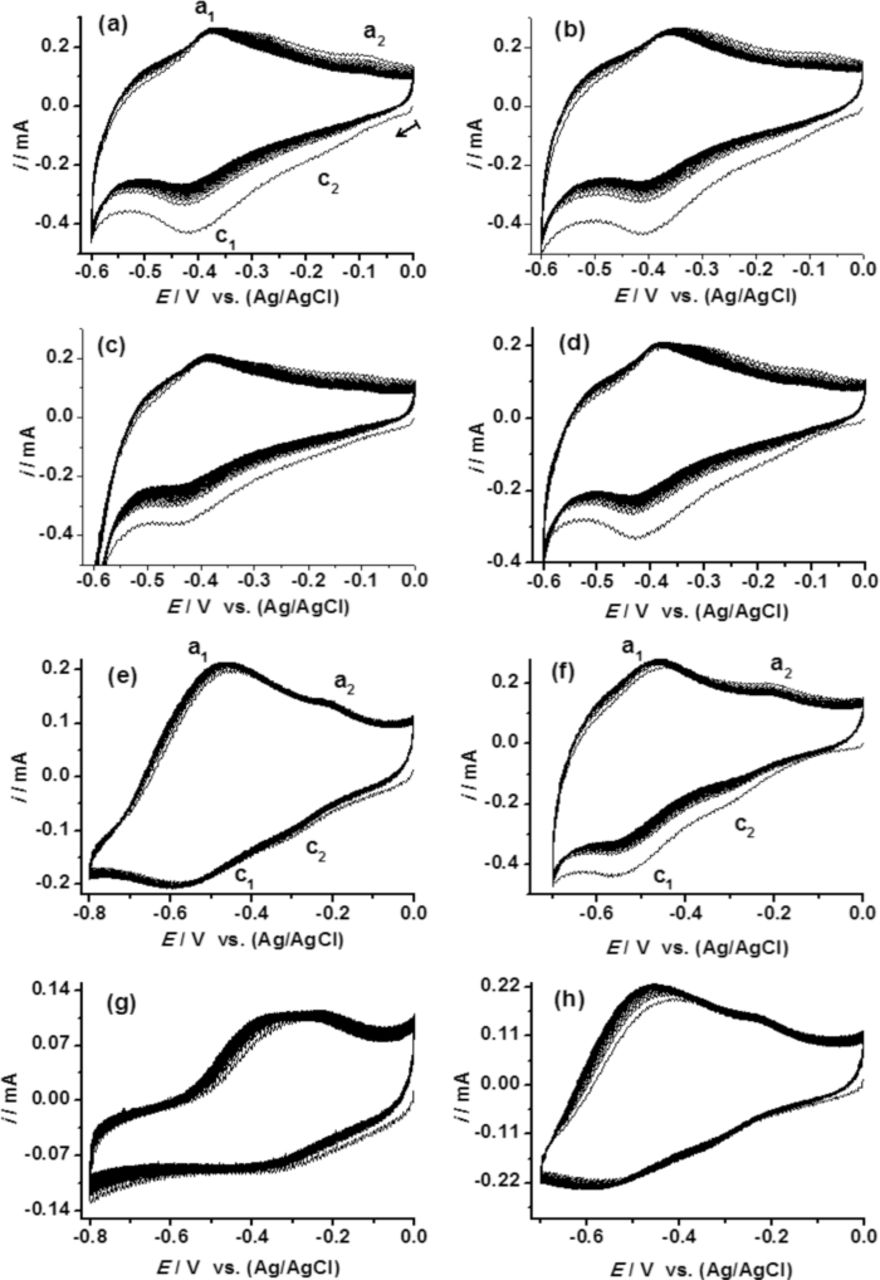
Figure 5. Comparison of 50 cycles CVs recorded in the passive potential range of Mo at 0.20 V.s−1 at two pH levels in various electrolytes: (a) & (e) NaCl + HCl, (b) & (f) Na2SO4 + H2SO4, (c) & (g) NaClO4 + HClO4 and (d) & (h) KCl + HCl. The electrolyte pH was 1.4 in (a) to (d) and 3.4 in (e) to (h). Scan started from 0 V.
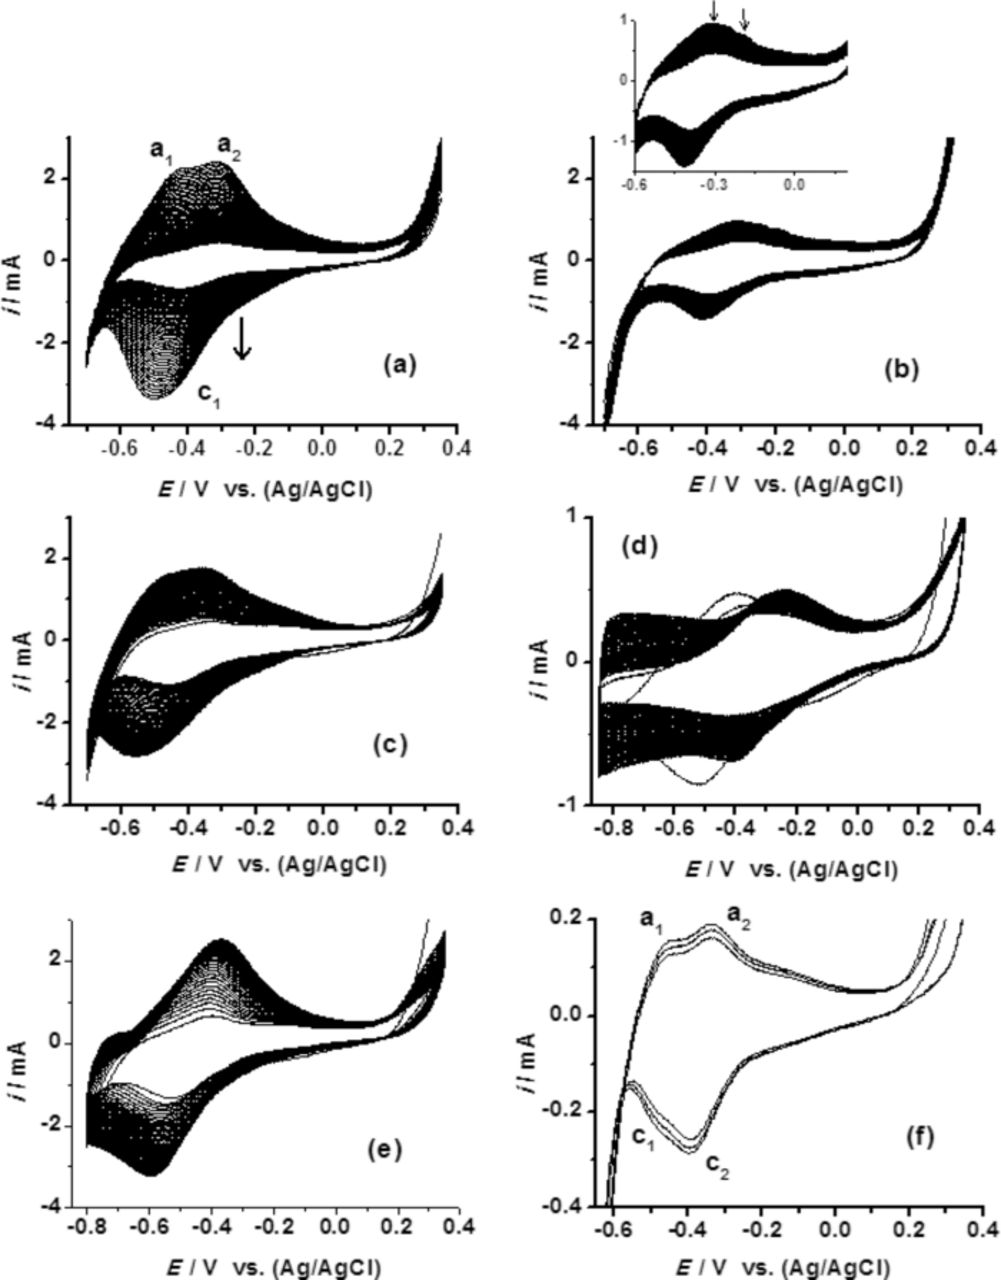
Figure 6. Comparison of 50 cycles CVs recorded from transpassive potential range of Mo in various electrolytes: (a), (d) & (f) NaCl + HCl, (b) & (e) Na2SO4 + H2SO4, (c) NaClO4 + HClO4. The electrolyte pH was 1.4 for (a), (b), (c) and (f), and 3.4 for (d) and (e). Scan started from +0.35 V. The scan rate in (a) to (f) was 0.20 V.s−1 and in (e) was 0.010 V.s−1.
The appearance of the two oxidation peaks (Figure 6a) is interesting and is analogous to that of Figures 3 and 4. At higher ω, the two oxidation peaks seem to correspond to a single reduction peak. However, the equivalent reduction peaks became evident at a low ω (Figure 6f). The redox peaks were very close to each other. The anodic peaks were well resolved in Cl− whereas it was least resolved in SO42−. The SO42− barrier layer seems to prevent the oxidation/desorption corresponding to the redox transition. This suggests that the cations play a pronounced role in the appearance of the oxidation peaks. Well-defined anodic peaks in Cl− (Figure 6a) when compared to ClO4− (Figure 6c) suggest that Cl− interaction/desorption also contributed to the oxidation peak.
Mechanism for redox transitions
When the redox transitions are attributed to the ion's adsorption/interaction at the surface oxides, it is reasonable to think that the appearance of the two redox peaks can be associated with the variations in the adsorption strength and/or adsorption sites. Considering the passive oxide structure,12,14–16 and the results of the present and our earlier3 studies, we propose that the major and minor redox transitions are associated with two thermodynamically non-equivalent adsorption sites in the surface oxides. The following description is based on the consideration that the major passive surface oxide of Mo is of the structured MoO2 or its hydrated forms.14–16
Mo(IV) oxide crystallizes normally in monoclinic systems. The structure of its constituent building blocks is distorted [MoO6], where the Mo-O bonds vary in length (between 1.97 and 2.07Å) and the O-Mo-O angles are in the range of 78–97°. In MoO2 structures, the two types of oxygen centers are each coordinated to three Mo.14–16 The MoO6 octahedra can be cut in different ways. This gives rise to the formation of different surface terminations with various surface active centers. The atomic layers parallel to the surface are ordered as O'-MoO-O-O' on the surface of the most commonly studied (011) monoclinic system. Hence such a surface can have different terminus with exposed O and O' centers as wells as Mo and O centers.16 The Mo centers in the surface oxides bear a positive metallic character since only a limited number of Mo atoms/unit cell can have d electrons.17 Density of states plots of MoO2 showed that the Fermi level was located within the band dominated by Mo orbitals, and the system exhibited a clear metallic behavior.16 During the reduction process, the Mo centers accept electrons and the electrolyte ions are attracted mainly towards the O centers.
The redox transitions can be related to the adsorption/interaction of anions/cations to two different O centers of the surface oxides (Scheme 1). Analogous to the weak and strong H+ adsorption peak on Pt,18 the minor and major redox peaks can be correlated to a stronger and weaker ion interaction/adsorption, respectively. Thus the major redox peak can be attributed to the electrostatic interaction of anions with the O or -OH centers. The hydrated outer oxide layer is rich in MoO(OH)2, which can favor such a process.12 It is expected that many of the coordinated oxygen species exist as terminal -OH or OH2. This results in a far less cross-linked structure that is much more dispersed during the reduction half cycle. It is worthy of note that H+/cations can be easily adsorbed and even migrate to the interior of the oxides without much difficulty. The adsorption of the cations is expected to enhance the major redox peaks in much the same manner as that of the anions. As the minor redox transition is appearing at the initial potential ranges, it can be correlated to faster ion adsorption occurring preferably at the most easily accessible O or O' centers. The reduced ip associated with the minor redox peaks can be explained as due to the lower extent of ion adsorption/interaction with the O' centers. This is perhaps the reason for the pronounced ip of peak a2 during the Ar bubbling experiment in which the maximum desorption of specifically bound anions (Cl−) would have occurred.
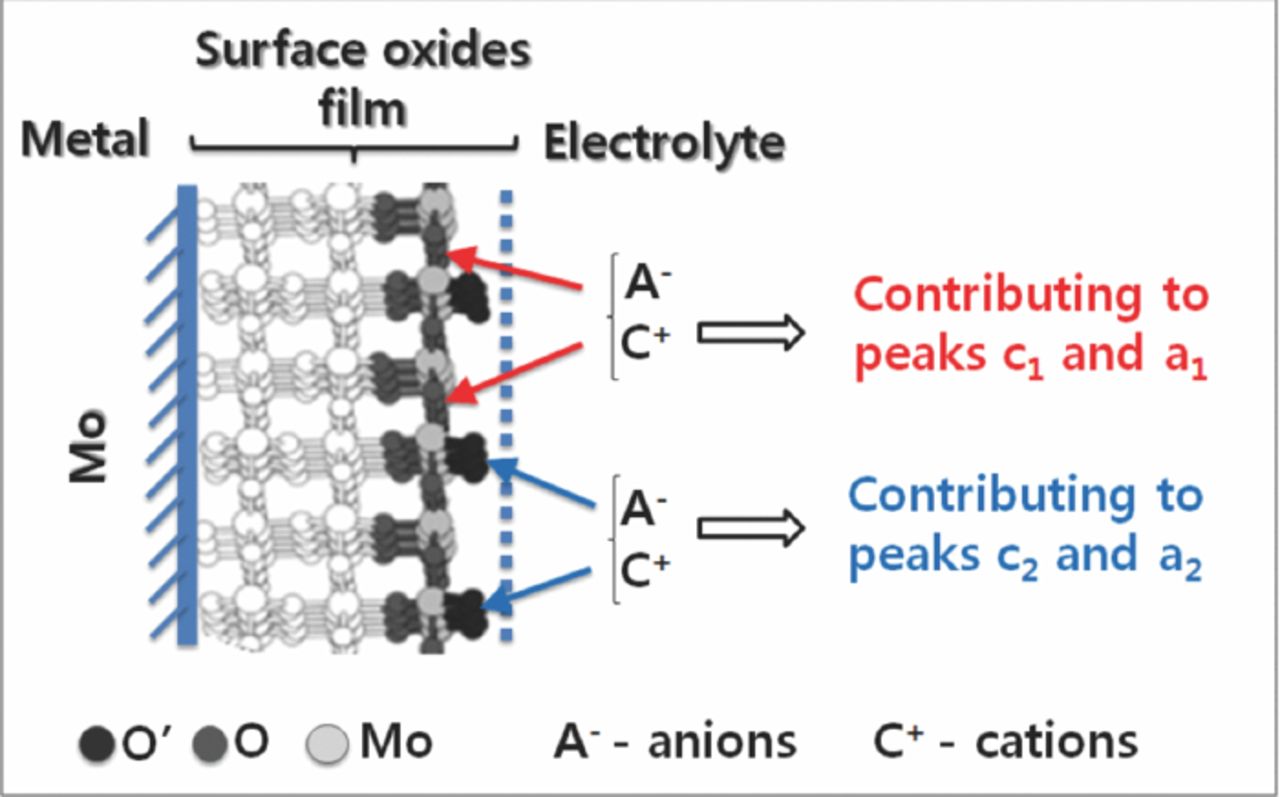
Scheme 1. A suggested mechanism for the interaction/adsorption of electrolyte anion/cation at the surface oxides contributing to the redox transitions. The passive oxide film is represented by the monoclinic structure of MoO2.12,14–16 The redox transitions were correlated with the ion's interaction/adsorption at thermodynamically non-equivalent sites. The MoO2 structure was taken from ref. 16 (Copyright Elseveir, 2011), where (011) surface was modeled. The process represented at the surface is expected to occur in the same sequence in the film of the oxide.
The oxidation peaks a1 and a2 can be attributed to the desorption processes about the O and O' centers. The variation from linearity of ip vs. ω plot of peak a2 (Supporting information, Figure S10) suggests that the extent of desorption/oxidation process at peak a2 may involve contributions from processes other than desorption of surface anions or cations, such as desorption of cations trapped/intercalated at the surface oxides. The higher ip of peak a2 when compared to that recorded for peak a1 at a low ω (Figure 4i) can be associated with this. The time provided by the slow ω would have continuously allowed a greater number of cations to desorb, which in turn would have resulted in larger ip of peak a2. These observations suggest that a small number of anions/cations that were firmly linked with O centers at peak a1 may be desorbed at peak a2 in addition to those from O' centers. The redox transitions and the associated pseudocapacitance of the surface oxides, corresponds primarily to the surface or near-surface reversible redox reactions.1,2 The cations intercalation in the gap between the interlayer spacing of the layer-layer structure through single phase faradaic reaction is not expected to affect the ip of cathodic peaks significantly (not the overall variation of the cathode current density); however, it may affect the variation in the ip of anodic peaks as discussed below.
During oxidation, high resistance is expected between the compact oxide/electrolyte interface. Because of the dispersed nature of the reduced film, however, electroactive species can freely enter/adsorb into the film throughout the reduction half cycle, while the oxidation of the adsorbed species can occur during the reverse scan. The higher ip of peak a2 (Figures 3 and 4) suggests that during the reduction half cycle an increasing number of cations and Cl− were able to get trapped/intercalated in the oxide. These species were later oxidized/desorbed during the reverse cycle. At first glance the negligible presence of peak c2 (Figures 3b–3c and 4) is contrary to this. However, careful examination of Figures 1, 3 and 4 reveals that the reduction process contributing to peak c2 is happening throughout the reduction half cycle whereas the oxidation process is particularly sensitive to the desorption potential. Due to the compact oxide film present during the oxidation half cycle, the desorption process is specific and stringently occurred at the oxidation potential corresponding to the peak a1 and a2. This fact is further supported by the integrated area calculation. The sum of the integrated area under anodic peaks a1 and a2 was ∼54% higher than that of the cathodic peaks (Figure 4d). At low ω (Figure 4i), this value increased to ∼63%.
The two oxidation peaks obtained in multiple cycles CV experiments (Figure 6) and in time-dependent studies (Figures 3b–3c and 4) vary significantly in potentials. In multiple cycles CVs, the thicker Mo(VI) oxide becomes the controlling factor as the scan started from transpassive potentials. Due to the thicker oxide layer, the role of cations dominates the redox transitions whereas the anions become less significant. In this case the two anodic peaks can be mainly attributed to the oxidation/bond breaking/desorption of cations from the two adsorption sites in the surface oxides. The reason for the pronounced appearance of the oxidation peak in Cl− (Figure 6a) may be related to its ability to form strong bonds with the surface oxides. It is well known that halides have the ability to complex with Mo species of different valence.19,20
Studies on bulk Mo oxides (not metallic Mo) resulted in different views on the origin of the redox peaks.5,6 Anbananthan et al. assigned the minor redox peak to Mo(VI)/Mo(V) reduction and the major redox peak to the formation of Mo bronzes due to the removal of O ions and the associated structural relaxation.5 Studies by Wang and Dong6 on Mo(VI) oxides suggest that the two redox transitions corresponds to the formation of two Mo oxide bronzes. Potential contribution via sub-stoichiometric lower Mo oxides formation was also suggested.6 The formation of bronzes such as blue (A0.3MoO3), red (A0.33MoO3) and purple (A0.9Mo6O17),1,21–23 can take place during the reduction half cycle and that primarily depends on the availability (thickness) of the oxide layer and the concentration of the electrolyte cations. While we have not observed a color change corresponding to the bronze formation on the electrode's surface, this is likely due to the presence of thinner surface oxides. However, when the CV scan was started from more positive potentials where thicker transpassive surface oxides formed, distinct blue color was formed in the potential range of the study.3
Some aspects of the present work are in agreement with the above views.5,6 On the other hand, we explained the phenomenon in terms of interaction/adsorption of electrolyte ions at the surface oxides. The redox transition corresponds to surface species and is adsorption controlled. O ion removal, ion reduction, bronzes formation and electron accepting process are expected to be taking place throughout the reduction half cycle. These processes involve a significant contribution from electrolyte cations/anions and the way they interact with the surface oxide. The extent of enhancement of the ip of the redox transition can be employed for detecting a particular electrolyte species in trace amounts. The species adsorbing at the electrode surface can change the ip through non-faradaic process with a relative shifting of the vp. Standardizing the variation of the redox transition with and without the species to be detected can yield advantageous results. In general, voltammetric sensors examine the concentration effect of the detecting species on the current-potential characteristics of the reduction or oxidation reaction involved and the height of the ip can be used for the quantification of the concentration of the oxidation or reduction species.24 The following EIS studies further substantiate the variation of the interfacial behavior with different electrolyte ions.
EIS studies
EIS studies were conducted at two different potentials analogous to the major and minor redox transitions in order to identify the interfacial behavior in the three selected electrolytes. In addition to the de-aerated media (DA), the experiments were also conducted in oxygenated media (OX) in order to study the variation of the EIS plots with different electrolyte anions. EIS plots recorded in DA were curve fitted and the C and the Rox were compared.
The protective anionic barrier layer formation of SO42− is prominent (Figure 7). The behavior of SO42− and Cl− was similar in de-aerated media although a marginally higher oxide film resistance (Rox) was observed in the case of SO42− (Figure 7g). A higher Rox in SO42− may indicate a more effective anionic barrier layer formation, while the lower Rox in ClO4− can be associated with faster H+ ingression. The complex interaction of Cl− is especially evident in the presence of dissolved oxygen. This is indicated by the appearance of depressed semicircle in the Nyquist plots. These variations were pronounced at –0.50 V, where the oxide film was expected to be more conductive and porous.
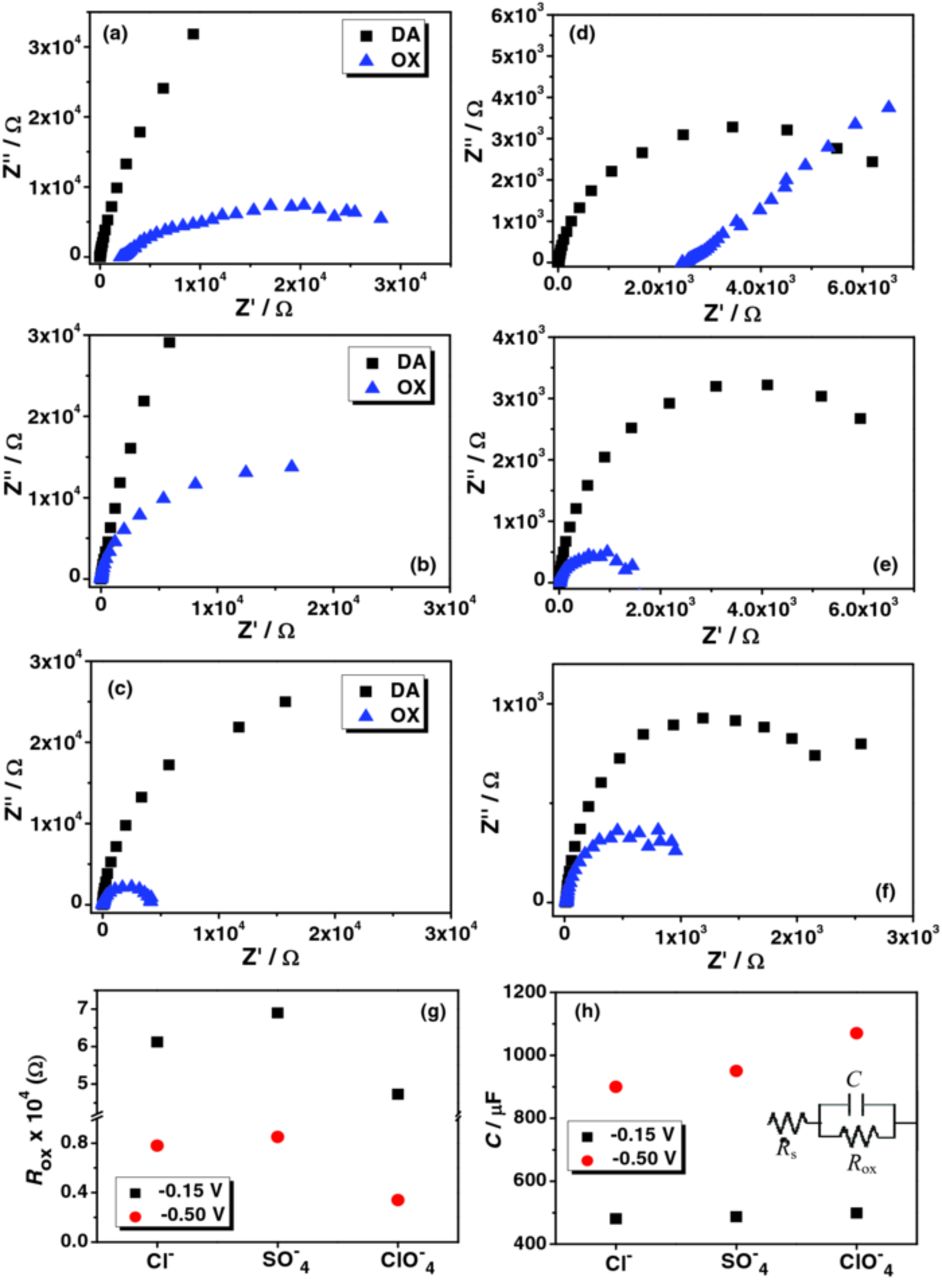
Figure 7. Nyquist plots in (a) & (d) NaCl + HCl, (b) & (e) Na2SO4 + H2SO4 and (c) & (f) NaClO4 + HClO4 (0.6 M salt at pH 1.5). (a), (b) & (c) were recorded at –0.15 V and (d), (e) & (f) were recorded at –0.50 V. DA and OX correspond to de-aerated and oxygenated media; (g) comparison of oxide film resistance (Rox) and (h) interfacial capacitance (C) in DA. The equivalent circuit employed for curve fitting the EIS plots in DA was also provided.
A lower capacitive behavior with the reduced resistance in the presence of dissolved oxygen may correspond to the formation of a thicker surface oxide layer (Figure 7). SO42− exhibited the typical behavior in the oxygenated media in accord with the protective passive layer formation, whereas Cl− showed the depressed semicircles. Higher Rs observed in Cl− at –0.50 V (evident from the Nyquist plot in Figure 7d) can be attributed to the corrosive involvement of Cl−. Representative Bode plots were provided (Supporting information, Figure S11).
The lowest Rox was recorded in ClO4− and can be explained in terms of the oxidizing power of the acids, analogous to the behavior of Nyquist plots in OX media. Higher capacitive behavior and reduced Rox in ClO4− may be associated with the comparatively higher oxidizing power of HClO4 (Figures S9 and 7). If so, the Mo electrode could have a marginally thicker passive oxide layer in ClO4− when compared to Cl− or SO42− and the ip of the c1 peak would have a maximum value in ClO4− due to the higher availability of the surface oxides. However this was not case. This further supports our postulated mechanism on the redox transition. This also suggests that the peak c1 does not completely correspond to the extent of cation ingression or bronze formation at the surface oxides.
The variation of the Nyquist plots as a function of electrolyte pH (Figure 8) reflects the decreased passive film stability in the neutral medium. Here, the reduced impedance in the neutral medium (Figure 8a–8c) suggests the formation of soluble surface species. This, in effect, would hinder the appearance of the redox transitions (due to the nanometer scale thickness of passive surface oxides). The Rox in ClO4− was always lower than that of Cl− and SO42− at lower pH (Figure 7g and 8e). However, in the neutral medium the opposite was observed (Figure 8e). A similar pattern was observed when the experiment was repeated at more negative potentials (Figure 8d). In the neutral medium, Rox showed a significant increase at –0.50 V as compared to the –0.15 V experiment (Figure 8d). This is in contrast to Figure 7 where Rox at –0.50 V was always lower than that of –0.15 V. This behavior can be attributed to the formation of a thicker oxide/hydroxide layer on the electrode's surface due to the unstable surface oxides in the neutral pH.2,13 Such a process can be facilitated by the conductive porous oxides formed at more negative potentials.

Figure 8. Nyquist plots recorded at –0.15 V in de-aerated (a) NaCl + HCl, (b) Na2SO4 + H2SO4 and (c) NaClO4 + HClO4 (0.6 M salt) as a function of pH; (d) comparison of Nyquist plots recorded at two different potentials (–0.15 and –0.50 V) in neutral pH (0.6 M Na2SO4); (e) comparison of oxide film resistance (Rox) and (f) interfacial capacitance (C) at –0.15 V at two different pH levels.
A comparison of the interfacial C was provided (Figure 7h and 8f). The total interfacial C of Mo-oxides can have contributions from both non-faradaic double layer (expected to be low; 20–50 μF cm−2) and faradaic pseudocapacitance (more than ten times the pure double layer capacitance). The faradaic charge storage is expected to be taken place primarily by cation (H+/Na+) adsorption onto the oxide surface by redox processes and/or through cation intercalation in the interlayer spacing of the layered oxide structure through single phase faradaic reaction.25 As the cathodic ip of the redox transition was directly proportional to ω, the contribution from intercalation pseudocapacitance can be suggested to be not significant as in such a case charge storage is limited by solid state diffusion and therefore the ip would scale with square root of ω, or it can be assumed that the intercalation process is taking place mainly in the near-surface region. A higher C obtained at –0.50 V when compared to that at –0.15 V can be attributed to a higher cation adsorption/intercalation at the surface oxides.3 The decreased C in the neutral pH is associated with the decrease of H+ concentration in the electrolyte where the faradaic process can be largely attributed to Na+. The marginal variation of C with different electrolyte anion can be correlated to the variation in the anionic barrier layer effect.3
Conclusions
A series of electrochemical studies were conducted on metallic Mo/glass electrodes with surface Mo oxides and the results were correlated with the appearance of the two reversible redox transitions. Systematic investigation on the variation of the major redox transition with electrolyte's pH (1.5 to neutral) and anion (Cl−, SO42−, ClO4−) helped to elucidate the role of electrolyte ions on the major redox transition. The redox transition was found to vary significantly with the nature of electrolytes. The absence of redox transitions in the neutral media was attributed to the thin passive surface oxide and its instability in neutral/alkaline media leading to the formation of soluble surface species. The time and potential dependent variation of the minor redox transition was studied and a mechanistic model has been suggested on the origin of the redox transitions. It was proposed that the appearance of the two redox transitions was associated with two thermodynamically non-equivalent adsorption sites in the structured surface oxides. EIS studies provided interesting supportive evidences.
Supporting information
XRD of Mo electrode, model showing peak fitting in CV, ip and vp of peak a1, comparison of CVs with nature of anions, time-dependent variation of ip of c1 and a1 peaks, OCP decay experiments during Ar gas bubbling experiments, EIS phase angle plots before and after LSV, ip vs.ω plot corresponding to Figure 3b and representative EIS Bode plots were provided.
Acknowledgments
This work was financially supported by National Research Foundation of Korea (2010-0029164).