Abstract
Adding esters as co-solvents to Li-ion battery electrolytes can improve low-temperature performance and rate capability of cells. This work uses viscosity and electrolytic conductivity measurements to evaluate electrolytes containing various ester co-solvents, and their suitability for use in high-rate applications is probed. Among the esters studied, methyl acetate (MA) outperforms other esters in its impact on the conductivity and viscosity of the electrolyte. Therefore, viscosity and conductivity were measured as a function of temperature and LiPF6 concentration for electrolytes ethylene carbonate (EC): linear carbonate: MA in the ratio 30:(70-x):x, where linear carbonate = {ethyl methyl carbonate (EMC), dimethyl carbonate (DMC)}, and x = {0, 10, 20, 30}. Adding MA leads to an increase in conductivity and decrease in viscosity over all conditions. Calculations of electrolyte properties from a model based on a statistical-mechanical framework, the Advanced Electrolyte Model (AEM), are compared to all measurements and excellent agreement is found. All electrolytes studied roughly agree with a Stokes' Law model of conductivity. A Walden analysis shows that the ionicity of the electrolyte is not significantly impacted by either MA content or LiPF6 concentration. Li[Ni0.5Mn0.3Co0.2]O2/graphite cells containing MA were cycled at charging rates up to 2C and showed improved cycling performance.
Export citation and abstract BibTeX RIS

This is an open access article distributed under the terms of the Creative Commons Attribution 4.0 License (CC BY, http://creativecommons.org/licenses/by/4.0/), which permits unrestricted reuse of the work in any medium, provided the original work is properly cited.
Typical performance metrics of Li-ion batteries such as lifetime and power capabilities depend strongly on the electrolyte used. The ionic conductivity of the electrolyte is one transport property that helps to determine how fast a cell can be charged or discharged, and has been reported for a vast number of aqueous and non-aqueous electrolyte systems.1–14 While it does not give a full picture of ionic transport in an electrolyte, conductivity can be measured easily and accurately, giving a rapid evaluation of the electrolyte in question. In addition to conductivity, the dielectric constants and viscosities of the constituent solvents must be considered.5,15 For a more rigorous analysis of cell performance using physics-based models, other transport properties such as Li-ion transference number, diffusivity, and activity coefficient are required.9,16–19 Traditional solvent blends for Li electrolytes have been made with mixtures of ethylene carbonate (EC), ethyl methyl carbonate (EMC), diethyl carbonate (DEC) and dimethyl carbonate (DMC). EC has a high dielectric constant, aiding the disassociation of the lithium salt in solution. Traditionally, EC has also been required in the electrolyte to help form a passivating solid electrolyte interphase (SEI) on a graphite negative electrode.20 DEC, EMC and DMC have lower viscosities and melting points than EC, and when mixed with EC result in an electrolyte with a good balance between desirable electrochemical properties, high dielectric constant, and low viscosity.21–24
Aliphatic esters have lower melting points and viscosities than "low viscosity" linear carbonates such as EMC or DMC.21,25,26 Many studies have investigated the impact of esters on the performance of Li-ion cells at low temperature when added as a co-solvent to traditional carbonate-based Li-ion electrolytes. Esters considered in previous studies include: methyl acetate (MA), ethyl acetate (EA), ethyl proprionate (EP), ethyl butyrate (EB), methyl proprionate (MP), methyl butyrate (MB), propyl butyrate (PB), and butyl butyrate (BB).25,27–33 Smart et al. have found that the addition of esters as co-solvents can improve the conductivity of the electrolyte and the cycling performance of cells at low temperature (< 0°C). However, it was found that the effectiveness of the ester co-solvent over many cycles depended on the molecular weight (MW) of the ester being added. Low MW (short chain) esters such as MA or EA apparently did not form favorable SEI layers, and led to increased polarization and impedance at the electrodes.25 High MW esters such as EB, while providing a smaller increase in conductivity than MA or EA, apparently formed more desirable SEI layers than the small MW esters. Ester co-solvents have also been studied for use in electric double layer capacitors (EDLCs). Jänes and Lust used carbonate-based electrolytes with ester co-solvents to replace toxic acetonitrile (AN), while maintaining the high power density required in an EDLC.34,35
Esters have also been shown to be viable as the primary solvent in a Li electrolyte. Petibon et al. showed that high voltage cells with good capacity retention can be constructed using MP or EA as the primary solvent in the electrolyte, provided that a minimum of 3% w/w of additives such as vinylene carbonate (VC) are added to the electrolyte to form an effective SEI at the graphite negative electrode.36,37
The Advanced Electrolyte Model (AEM) is a theoretical model for calculating the transport properties of electrolytes, developed by Gering.3,38,39 Using a statistical-mechanics framework, the AEM considers microscopic-level interactions such as ion solvation and ion association, among others, to calculate a diverse array of electrolyte properties. The outputs of the model range from microscopic (solvated ion sizes, solvation numbers, solvent residence times) to macroscopic (electrolyte conductivity, viscosity, permittivity) properties. Other AEM quantities support cell-level transport modeling and electrolyte optimization (activity coefficient, transference number, thermodynamic, kinetic and thermo-physical properties). The AEM has already been validated for a number of aqueous and non-aqueous systems.3,38 If the predictions of the AEM can be validated for electrolytes containing esters, then it can be used to quickly screen electrolyte candidates by optimizing specific electrolyte properties such as conductivity and Li-ion diffusivity. Measurements in this study are compared to calculations from AEM version 2.17.4B.
In this work, the physical properties of a number of different electrolyte systems containing esters were measured. Viscosity was measured for several esters as a function of temperature and compared to typical "low viscosity" carbonate solvents EMC and DMC. Additionally, conductivities and viscosities were compared for Li electrolytes containing 80% (wt%) linear carbonate mixture + 20% different esters. Finding MA to be the most promising ester, a large, systematic study of conductivity and viscosity for electrolytes containing MA was carried out. High rate cycling tests were done with Li[Ni0.5Mn0.3Co0.2]O2 (NMC 532)/artificial graphite cells containing MA and fluoroethylene carbonate (FEC) in the electrolyte to investigate the rate capability of cells containing MA as a co-solvent.
Experimental
Preparation of electrolyte
All electrolyte mixing was done in an Ar-filled glove box. All chemicals used in this work were received from BASF. These include: lithium hexafluorophosphate (LiPF6) (purity 99.94%, water content 14 ppm), ethylene carbonate (EC) (purity 99.95%, water content < 10 ppm), ethyl methyl carbonate (EMC) (purity 99.92%, water content < 6 ppm), dimethyl carbonate (DMC) (purity 99.95%, water content < 20 ppm), fluoroethylene carbonate (FEC) (purity 99.94%), methyl acetate (MA) (purity > 99.95%, water content < 20 ppm), ethyl acetate (EA) (99.99% pure, water content 19.4 ppm), methyl propionate (MP) (99.9% pure, water content 19.9 ppm), and methyl butyrate (MB) (99.8% pure, water content 18.1 ppm). For tests of the impact of different esters on viscosity and conductivity, a base solvent blend composed of EC:EMC:DMC 25:5:70 (vol %) (as received, water content 19.7 ppm) was used. Esters were added at a fraction of 20% by weight to the ester-free solvent blend. Solvents were mixed with 1.2 molal (denoted m, mol/kg solvent) LiPF6 with the exception of the electrolyte containing 20% MA, where an LiPF6 concentration of 1.2 molar (mol/L) was used.
A large matrix of different electrolytes was made to determine the impact of solvent composition and salt concentration on electrolyte conductivity and viscosity for electrolytes containing MA. For each solvent blend, electrolytes with a range of LiPF6 concentrations were made, ranging from 0 m to 2.0 m. Two series of solvent blends were studied: EC:EMC:MA 30:(70-x):x, and EC:DMC:MA 30:(70-x):x, both with x = {0, 10, 20, 30} (wt. %).
Cell filling and cycling
The cells used for cycling tests were single crystal Li[Ni0.5Mn0.3Co0.2]O2 (NMC 532) / artificial graphite (AG) 402035-size pouch cells with a capacity of 240 mAh at 4.4V obtained from LiFun Technology (Xinma Industry Zone, Golden Dragon Road, Tianyuan District, Zhuzhou City, Hunan Province, PRC, 412000). Descriptions of the loadings, compositions, and calendared densities of the NMC532 and artificial graphite electrodes can be found in Reference 40. Briefly, the positive electrode material loading was 21.1 mg/cm2 (one side) and the electrodes were calendared to a density of 3.5 g/cm3. The positive electrode active weight fraction was 94%. The negative electrode loading was 12.4 mg/cm3 (one side) and the electrodes were calendared to a density of 1.55 g/cm3. The negative electrode active weight fraction was 96%. Pouch cells were obtained without electrolyte and were vacuum sealed for shipment. Before use in our laboratory, they were cut open and dried at approximately 100°C for 14 hours under vacuum to remove any excess moisture. After drying, cells were moved to an Ar-filled glove box for filling.
Electrolytes used for the cycling tests were 1.2 mol/L LiPF6 in (100-x) % [EC:EMC 30:70 (w/w)] + x% MA, where x = {0, 20, 40}. In addition, each electrolyte contained 2% by weight FEC. Each cell was filled with 1.0 g of electrolyte. Cells were then sealed by a vacuum sealer (MSK-115V, MTI Corp.) to a level of −95.2 kPa gauge. Sealing time was 4 seconds at 165°C. Cells were cycled between 2.8 and 4.3 V at 20°C ± 1°C. Cells were charged at a rate of 1C for 30 cycles, then 1.5C for 30 cycles, then 2C for 30 cycles. Between each step up in charge rate, the cells were cycled at C/5 for three cycles. For all cycles, cells were discharged at a rate of 0.5C.
Viscosity measurements
Viscosity was measured using an Ostwald viscometer (Sibata Scientific Technology, Japan). Two different sized viscometers were used in these experiments, with capillary diameters of 0.5 mm and 0.75 mm, respectively. The temperature of the electrolyte in the viscometer was controlled by a circulating bath (Thermo Scientific) filled with a water/ethylene glycol mixture. The viscometer was placed inside a triple walled glass Dewar where the water/ethylene glycol mixture could be pumped through. A resistance temperature detector (RTD) attached to the surface of the viscometer measured the temperature of the electrolyte. Measurement of the viscosity was completed using computer vision (CV) software developed by Beaulieu et al. A full description of this setup, including the data acquisition software is described in the literature.41 Viscosity measurements were taken for temperatures ranging from 10°C to 40°C with the exception of the pure solvents, which were measured between 0°C and 50°C. The raw data were interpolated to temperatures in 5 degree increments using a linear interpolation method in MATLAB.
Conductivity measurements
Ionic conductivity was measured using a commercial conductivity meter (Hach model 3455) capable of performing four separate conductivity measurements using four separate conductivity probes. Each probe had an integrated PT1000 RTD to monitor the temperature of the electrolyte. Probes were calibrated in air and to a known standard (12.88 mS/cm, Hanna Instruments HI70030C). Approximately 14.5 mL of electrolyte was added to a custom-made stainless-steel holder under a fume hood. The probe was then sealed to the holder by an O-ring to limit electrolyte-air contact. The seal was maintained by using custom-made stainless-steel clamps. Sealed sensors were then placed in a temperature controlled bath (VWR Scientific model 1151) filled with ethylene glycol. The temperature of the bath was varied between 0°C and 40°C, in increments of 5°C. The temperature of the bath was verified in this range using an external thermocouple thermometer (Omega HH802U), found to be accurate to ±0.5°C between 0.0°C and 100.0°C. At each step, the electrolyte was allowed to equilibrate with the temperature of the bath for at least 40 minutes. Measurement accuracy was within ±2% of the measured conductivity value.
Results and Discussion
Conductivity and viscosity
Table I shows some basic physical properties of the carbonate solvents EC, EMC, DMC, and the esters MA, EA, MP, and MB, including melting point, boiling point, dielectric constant, chemical structure, and viscosity at room temperature. Some of the advantages of adding esters to a carbonate-based electrolyte should be immediately apparent. The melting points of all the esters considered in this study are much lower than that of EC, EMC, and DMC. The dielectric constants are slightly higher than the dielectric constants of EMC and DMC, which could marginally aid in salt dissociation in the electrolyte. The viscosities of these esters at room temperature are also lower than the carbonate solvents. The molecular dissimilarities between carbonate and ester solvents can also contribute to greater randomness and related structure-breaking in solution, thereby further decreasing mixture viscosity.38 It may be assumed, then, that the addition of esters to the electrolyte should then reduce the overall viscosity of the electrolyte. Viscosity was measured for these compounds as a function of temperature, with the exception of EC. Figure 1 shows measured viscosity for the esters MA, EA, MP, and MB, compared to EMC and DMC for temperatures between 0°C and 50°C. The viscosities of the esters are all lower than that of EMC and DMC over the temperatures considered. The viscosity of DMC is lower than that of EMC, but it should be noted that its melting point is significantly higher (4.6°C, and −53°C, respectively, Table I). The viscosity of MB is only marginally lower than that of DMC over this temperature range. MA has the lowest viscosity of all the esters considered. AEM calculations, shown as solid lines in Figure 1, agree well with the experimental viscosity of both the esters and carbonates. Uncertainties in the measurements are shown as vertical bars on Figure 1 and in subsequent Figures.
Table I. Melting points, boiling points and dynamic viscosities at 25°C (unless otherwise specified) for several carbonate and ester solvents used in this study.
| Name | MP (°C) | BP (°C) | dielectric constant at 25°C | Viscosity at 25°C (cP) | Structure |
|---|---|---|---|---|---|
| Ethylene carbonate (EC) | 36.4a | 248a | 89.78 (40°C)a | 1.93 (40°C)a | |
| Ethyl methyl carbonate (EMC) | −53a | 110a | 2.958b | 0.65b | |
| Dimethyl carbonate (DMC) | 4.6b | 90b | 3.1075b | 0.59b | |
| Methyl acetate (MA) | −98b | 57b | 6.68b | 0.40c | |
| Ethyl acetate (EA) | −84d | 77d | 6.0e | 0.46c | |
| Methyl butyrate (MB) | −85.8d | 102.8d | 5.48d | 0.541d | |
| Methyl proprionate (MP) | −87.5d | 79.8d | 6.200d | 0.431d |
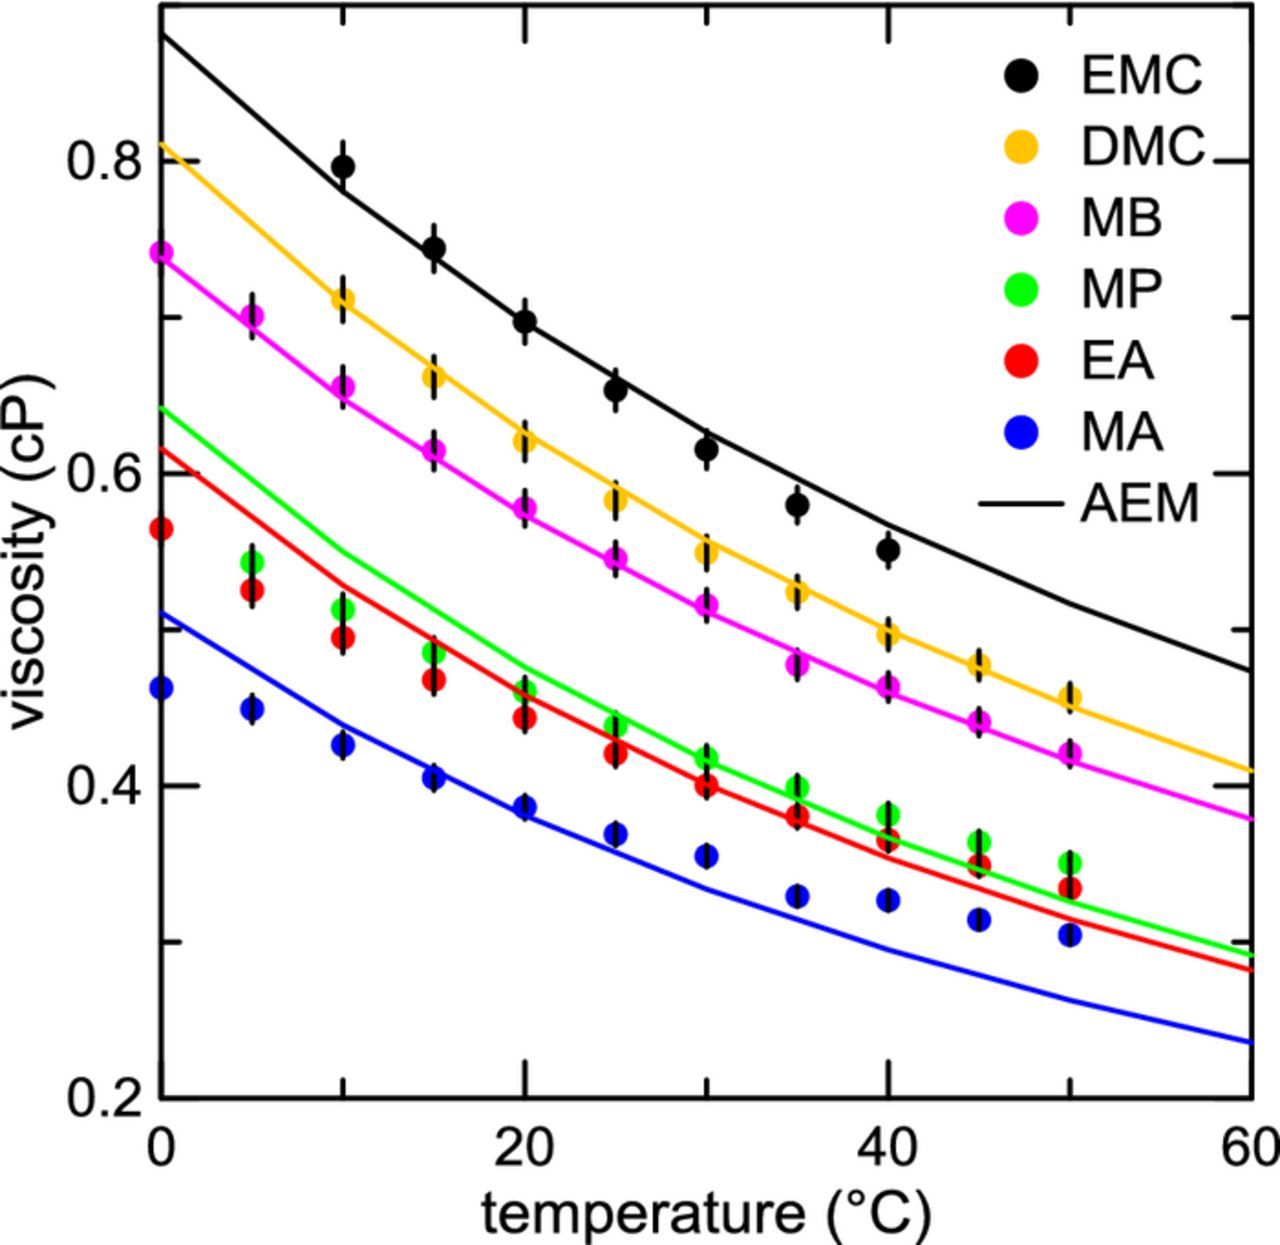
Figure 1. Viscosity measured as a function of temperature for pure solvents MA, EA, MP, MB, EMC, and DMC. Solid lines are calculated viscosities from the Advanced Electrolyte Model (AEM).
Figures 2a and 2b show temperature-dependent viscosity and conductivity measurements, respectively, for electrolytes containing different esters. Electrolytes composed of a base electrolyte containing 1.2 m LiPF6 in a mixture of EC:EMC:DMC 25:5:70 (vol %) plus 20% by weight ester (either MA, MP, or MB) are compared to the base electrolyte without any ester co-solvents. The trend in the viscosity of the electrolytes with a fraction of ester co-solvent echoes the results presented in Figure 1. The base electrolyte has the highest viscosity at all temperatures. Adding any of the esters to the electrolyte lowers the viscosity to some degree. MA and EA give similar reductions in viscosity and appear to be competitive in this test. However, the electrolyte with MA has a much higher conductivity than the electrolyte with EA at all temperatures, as seen from the results for conductivity in Figure 2b. The electrolyte containing MP appears to perform only marginally better than the control electrolyte. At elevated temperatures, the conductivity for the electrolyte containing MB is lower than the ester-free electrolyte. Other studies have also observed a drop in conductivity when adding MB as a co-solvent.29,30 Over the whole temperature range, the electrolyte containing MA outperforms the other esters studied.
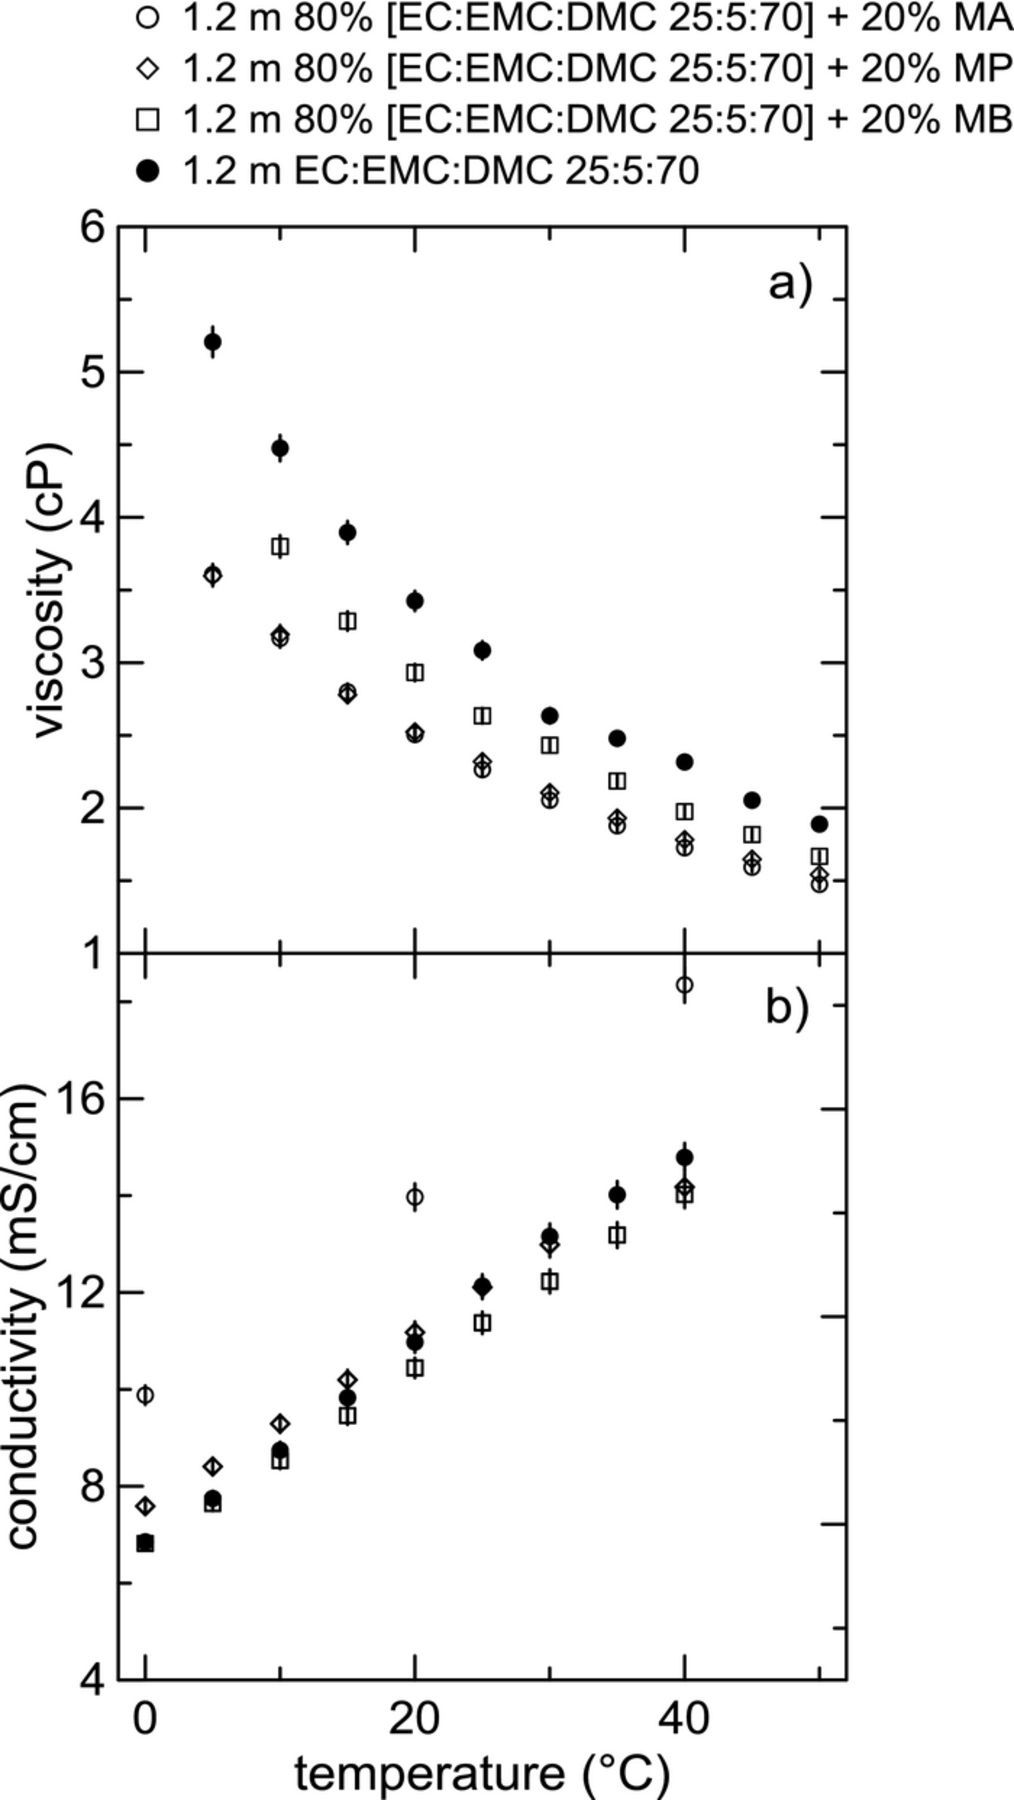
Figure 2. a) Viscosity and b) conductivity as a function of temperature for electrolytes composed of 1.2 mol/kg LiPF6 in 80% [EC:EMC:DMC 25:5:70 (w/w)] + 20% ester by weight compared to the base electrolyte without ester co-solvents.
Next, the impact of MA on electrolyte viscosity and conductivity was studied systematically as a function of MA content, LiPF6 concentration, and temperature. Two different ternary solvent blends were considered: EC:EMC:MA 30:(70-x):x, and EC:DMC:MA 30:(70-x):x, with x = {0, 10, 20, 30} (wt. %). The fraction of EC in the electrolyte was held constant throughout. Figure 3 shows electrolyte viscosity as a function of LiPF6 concentration for electrolytes with solvent blends a) EC:EMC 30:70, b) EC:EMC:MA 30:60:10, c) EC:EMC:MA 30:50:20, and d) EC:EMC:MA 30:40:30, for temperatures ranging from 10°C to 40°C. It is clear here that viscosity over both temperature and concentration decreases monotonically with the addition of MA, with 30% MA-containing electrolytes having the lowest observed viscosity. The dependence of viscosity on LiPF6 concentration changes depending on other conditions such as temperature or MA content. In electrolytes at low temperatures without MA, the dependence of viscosity on salt concentration is nearly quadratic. This can become a serious issue in the operation of real Li-ion cells. Such a large increase in viscosity should lead to a corresponding severe drop in conductivity. This may inhibit the performance and/or lifetime of cells under high rates of charge and discharge.21 This dependence of viscosity on salt concentration is much weaker at higher temperatures, where the increase in viscosity over LiPF6 concentration is only moderate. Figure 4 shows viscosity as a function of temperature for electrolytes of the form EC:DMC:MA 30:(70-x):x, x = {0, 10, 20, 30} (wt. %), where similar trends are seen. However, viscosity for this system is lower than electrolytes composed of EC:EMC:MA. This is to be expected since the viscosity of DMC is slightly lower than that of EMC at all temperatures (Figure 1). In Figures 3 and 4, calculations from the AEM are shown as solid lines. AEM calculations agree well with the experimental viscosity data, especially at low concentrations of salt. It correctly captures the dependence of viscosity on temperature, and correctly predicts the impact of adding MA. At very high concentrations of salt (2.0 m) and lower temperatures, the AEM starts to deviate from the experimental data by a modest amount. The average deviation of the AEM predictions of viscosity data from experiment over all conditions is 5.5%. Average deviation for pure solvents (i.e. 0 m LiPF6) over all temperatures is 4.4%, while the average deviation from experiment for electrolytes with 0.5 m, 1.0 m, 1.5 m, and 2.0 m LiPF6 is 5.7%, 7.6%, 4.9%, and 4.9%, respectively, over all temperatures. Viscosity measurements (described in more detail in Ref. 41) are consistently accurate and repeatable. This has been demonstrated for water and for non-aqueous solvents.41 Repeated measurements typically fall within 1% of each other. The interpolation routine introduces some additional error; the average deviation from accepted literature values for the viscosity of water is 1.79% after the interpolation has been applied. Therefore, the uncertainty in viscosity is taken to be 2% of the measured value. In most cases, the error is smaller than the plotting symbol in Figures 3 and 4. Therefore, in many cases where there is greater disagreement between experiment and AEM calculations the disagreement is taken to be a limitation of the model. This is better seen in Figure 3 at high concentrations of salt in electrolytes without MA (x = 0), where the AEM under-estimates the experimental result at the lowest temperature, yet is still within about 8% deviation from the experimental value. Experimental viscosity data shown in Figures 3 and 4 has been tabulated in Tables IIt3t4–V.
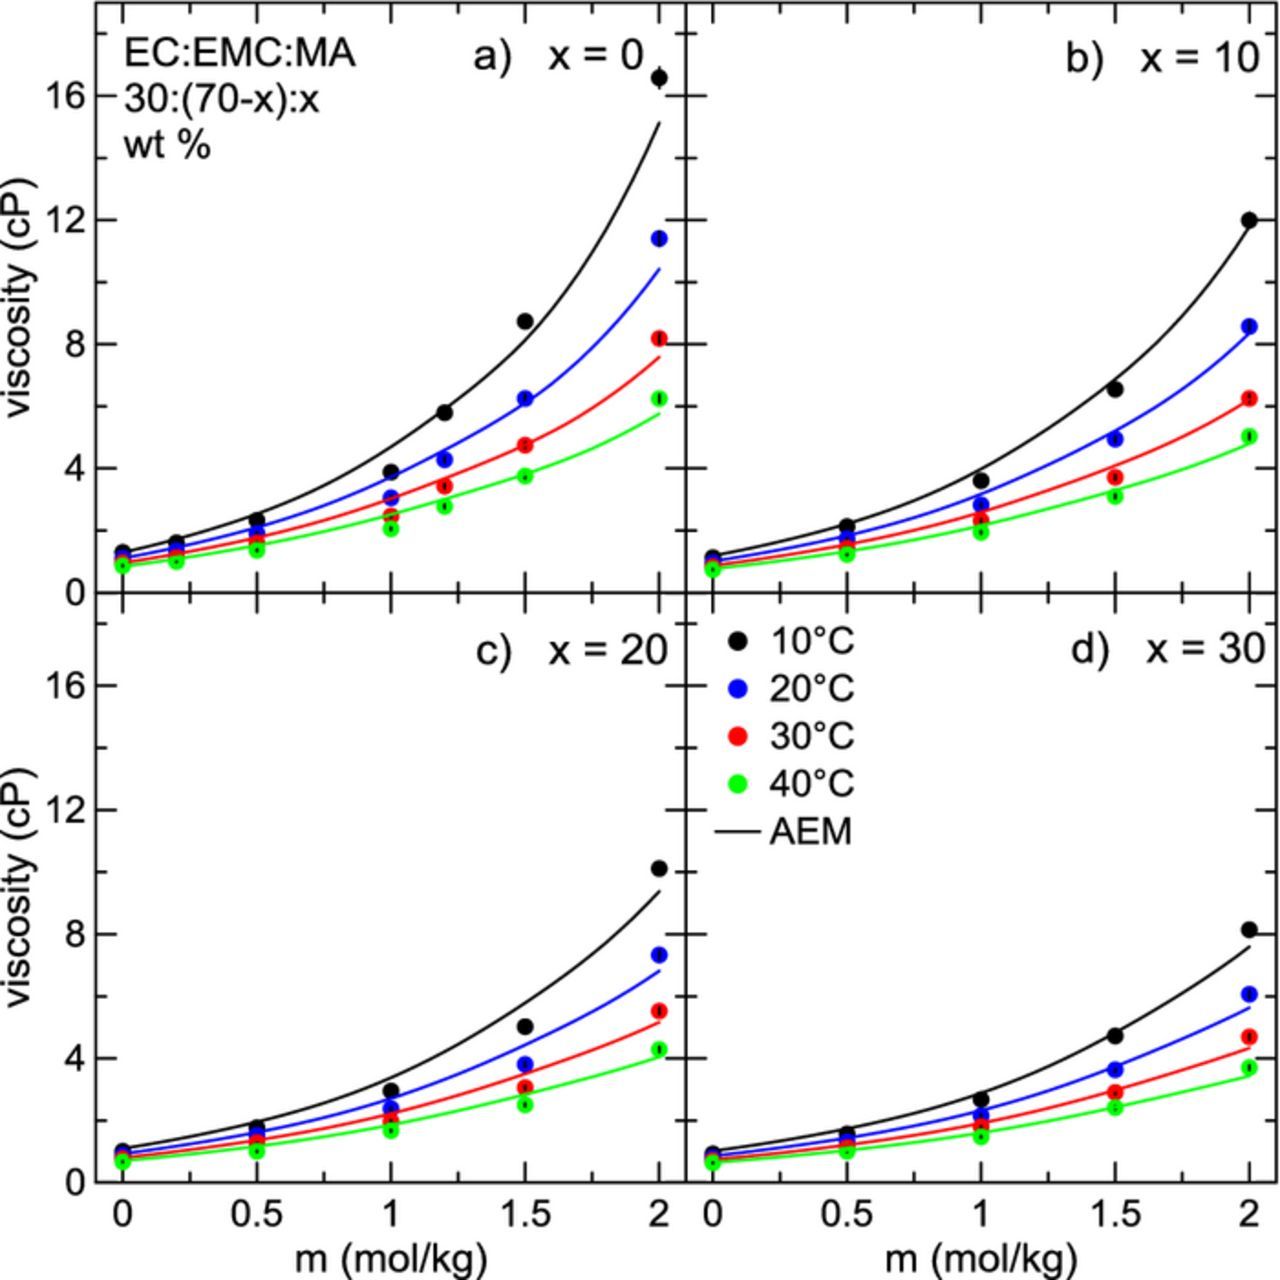
Figure 3. Viscosity as a function of LiPF6 concentration for electrolytes with the solvent composition EC:EMC:MA 30:(70-x):x, with a) x = 0, b) x = 10, c) x = 20, and d) x = 30 for temperatures between 10°C and 40°C. Solid lines are calculations from the AEM.
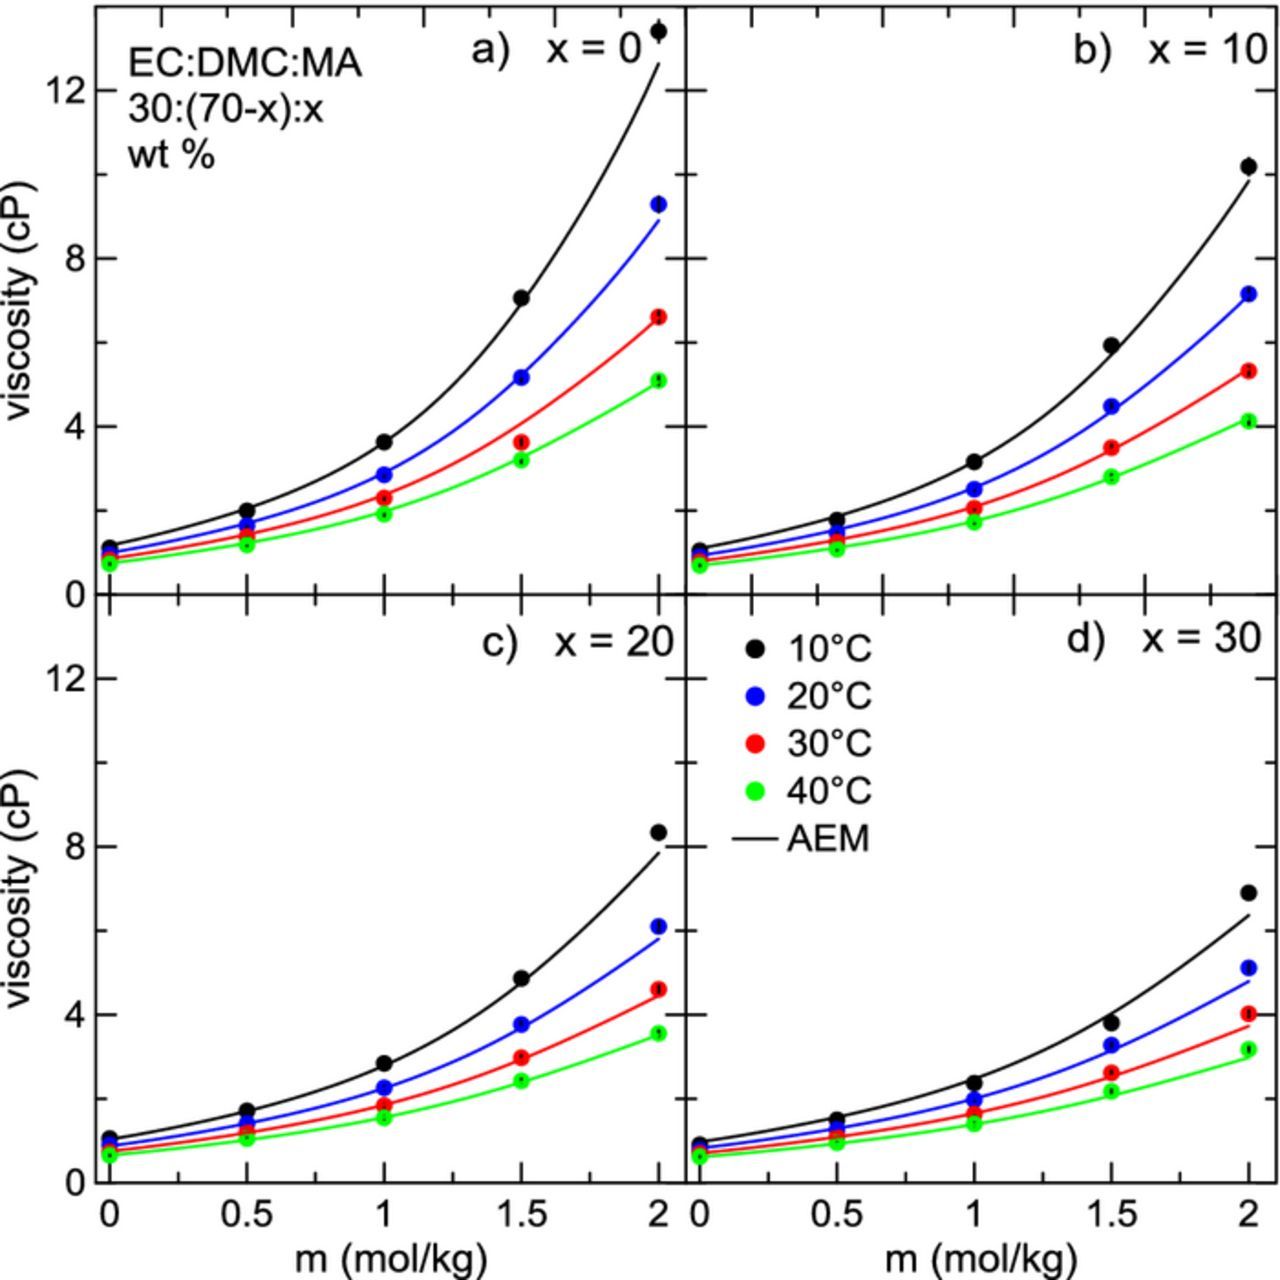
Figure 4. Viscosity as a function of LiPF6 concentration for electrolytes with solvent composition EC:DMC:MA 30:(70-x):x, with a) x = 0, b) x = 10, c) x = 20, d) x = 30 for temperatures between 10°C and 40°C. Solid lines are predictions from the AEM.
Table II. Viscosity at 10°C for the different solvent blends studied for LiPF6 concentrations between 0 m and 2.0 m.
| Solvents | Weight % solvent | Viscosity (cP) at LiPF6 concentration (mol/kg) | ||||||||
|---|---|---|---|---|---|---|---|---|---|---|
| 1 | 2 | 3 | 1 | 2 | 3 | 0 | 0.5 | 1.0 | 1.5 | 2.0 |
| EC | DMC | MA | 30 | 70 | 0 | 1.11 | 2.00 | 3.63 | 7.06 | 13.41 |
| EC | DMC | MA | 30 | 60 | 10 | 1.05 | 1.78 | 3.16 | 5.93 | 10.19 |
| EC | DMC | MA | 30 | 50 | 20 | 1.05 | 1.71 | 2.84 | 4.87 | 8.34 |
| EC | DMC | MA | 30 | 40 | 30 | 0.91 | 1.50 | 2.37 | 3.81 | 6.90 |
| EC | EMC | MA | 30 | 70 | 0 | 1.30 | 2.33 | 3.88 | 8.73 | 16.58 |
| EC | EMC | MA | 30 | 60 | 10 | 1.20 | 2.22 | 3.98 | 6.87 | 11.79 |
| EC | EMC | MA | 30 | 50 | 20 | 1.11 | 1.95 | 3.38 | 5.79 | 9.38 |
| EC | EMC | MA | 30 | 40 | 30 | 1.03 | 1.74 | 2.88 | 4.83 | 7.59 |
Table III. Viscosity at 20°C for the different solvent blends studied for LiPF6 concentrations between 0 m and 2.0 m.
| Solvents | Weight % solvent | Viscosity (cP) at LiPF6 concentration (mol/kg) | ||||||||
|---|---|---|---|---|---|---|---|---|---|---|
| 1 | 2 | 3 | 1 | 2 | 3 | 0 | 0.5 | 1.0 | 1.5 | 2.0 |
| EC | DMC | MA | 30 | 70 | 0 | 0.95 | 1.64 | 2.85 | 5.17 | 9.29 |
| EC | DMC | MA | 30 | 60 | 10 | 0.91 | 1.47 | 2.51 | 4.49 | 7.16 |
| EC | DMC | MA | 30 | 50 | 20 | 0.90 | 1.41 | 2.26 | 3.77 | 6.10 |
| EC | DMC | MA | 30 | 40 | 30 | 0.78 | 1.27 | 1.98 | 3.28 | 5.12 |
| EC | EMC | MA | 30 | 70 | 0 | 1.11 | 1.91 | 3.05 | 6.25 | 11.40 |
| EC | EMC | MA | 30 | 60 | 10 | 0.96 | 1.73 | 2.82 | 4.94 | 8.57 |
| EC | EMC | MA | 30 | 50 | 20 | 0.88 | 1.52 | 2.38 | 3.81 | 7.33 |
| EC | EMC | MA | 30 | 40 | 30 | 0.81 | 1.32 | 2.15 | 3.63 | 6.06 |
Table IV. Viscosity at 30°C for the different solvent blends studied for LiPF6 concentrations between 0 m and 2.0 m.
| Solvents | Weight % solvent | Viscosity (cP) at LiPF6 concentration (mol/kg) | ||||||||
|---|---|---|---|---|---|---|---|---|---|---|
| 1 | 2 | 3 | 1 | 2 | 3 | 0 | 0.5 | 1.0 | 1.5 | 2.0 |
| EC | DMC | MA | 30 | 70 | 0 | 0.83 | 1.38 | 2.30 | 3.63 | 6.61 |
| EC | DMC | MA | 30 | 60 | 10 | 0.79 | 1.25 | 2.06 | 3.50 | 5.33 |
| EC | DMC | MA | 30 | 50 | 20 | 0.73 | 1.21 | 1.84 | 2.98 | 4.61 |
| EC | DMC | MA | 30 | 40 | 30 | 0.70 | 1.09 | 1.64 | 2.62 | 4.02 |
| EC | EMC | MA | 30 | 70 | 0 | 0.97 | 1.60 | 2.47 | 4.75 | 8.18 |
| EC | EMC | MA | 30 | 60 | 10 | 0.84 | 1.43 | 2.31 | 3.71 | 6.25 |
| EC | EMC | MA | 30 | 50 | 20 | 0.77 | 1.30 | 1.97 | 3.06 | 5.52 |
| EC | EMC | MA | 30 | 40 | 30 | 0.71 | 1.14 | 1.80 | 2.90 | 4.69 |
Table V. Viscosity at 40°C for the different solvent blends studied for LiPF6 concentrations between 0 m and 2.0 m.
| Solvents | Weight % solvent | Viscosity (cP) at LiPF6 concentration (mol/kg) | ||||||||
|---|---|---|---|---|---|---|---|---|---|---|
| 1 | 2 | 3 | 1 | 2 | 3 | 0 | 0.5 | 1.0 | 1.5 | 2.0 |
| EC | DMC | MA | 30 | 70 | 0 | 0.73 | 1.18 | 1.92 | 3.21 | 5.10 |
| EC | DMC | MA | 30 | 60 | 10 | 0.70 | 1.08 | 1.73 | 2.81 | 4.13 |
| EC | DMC | MA | 30 | 50 | 20 | 0.66 | 1.05 | 1.55 | 2.43 | 3.56 |
| EC | DMC | MA | 30 | 40 | 30 | 0.62 | 0.95 | 1.40 | 2.18 | 3.18 |
| EC | EMC | MA | 30 | 70 | 0 | 0.87 | 1.36 | 2.06 | 3.75 | 6.25 |
| EC | EMC | MA | 30 | 60 | 10 | 0.74 | 1.23 | 1.94 | 3.10 | 5.03 |
| EC | EMC | MA | 30 | 50 | 20 | 0.67 | 1.00 | 1.67 | 2.50 | 4.29 |
| EC | EMC | MA | 30 | 40 | 30 | 0.63 | 1.00 | 1.47 | 2.41 | 3.70 |
Figure 5 shows the conductivity as a function of LiPF6 concentration for electrolytes of the form EC:EMC:MA 30:(70-x):x, x = {0, 10, 20, 30} (wt. %), for temperatures ranging from 0°C to 40°C. AEM calculations are displayed as solid lines. Panels a) to d) show increasing MA content in the electrolyte. The maximum conductivity increases as MA is added at all temperatures. Additionally, the LiPF6 concentration corresponding to maximum conductivity increases slightly with increasing MA content. The concentration of maximum conductivity has been shown to depend on the dielectric constant of the solvent system,21 but is also profoundly impacted by viscosity. Since MA has a higher dielectric constant than EMC (Table I), replacing EMC with MA in the electrolyte should marginally increase the dielectric constant of the electrolyte as a whole, and thereby lessen conductivity-robbing ion association.
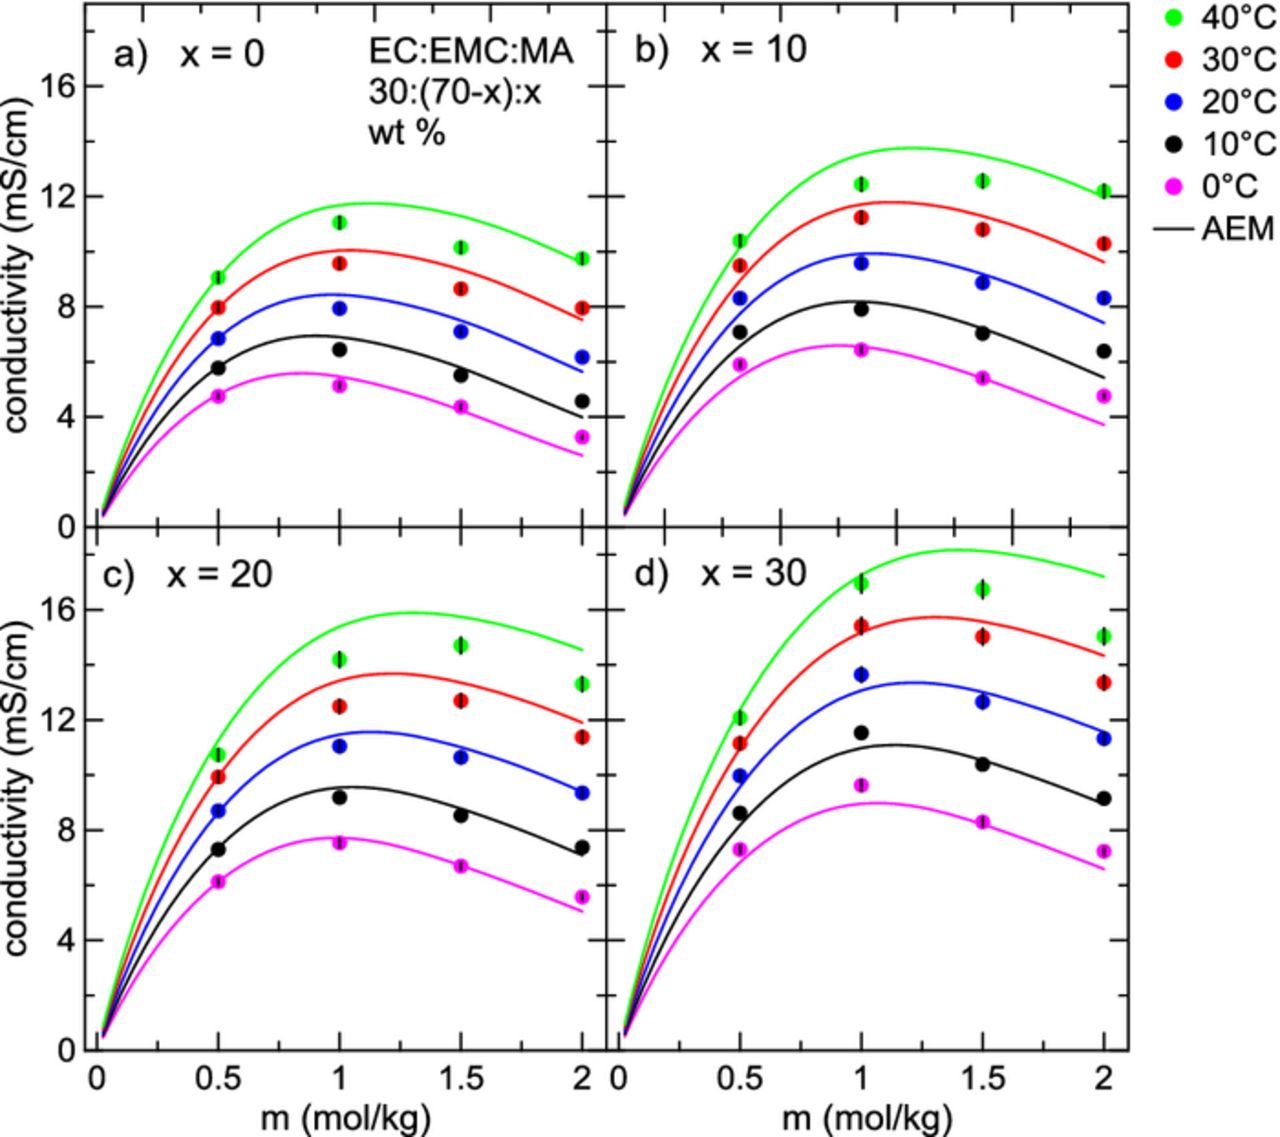
Figure 5. Conductivity as a function of LiPF6 concentration for electrolytes with the solvent composition EC:EMC:MA 30:(70-x):x, with 0 ⩽ x ⩽ 30 for temperatures between 0°C and 40°C. Calculations from the AEM are shown as solid lines.
During the operation of a Li-ion cell, especially at high charge rate, local variations in salt concentration arise.16 As well, over the lifetime of the cell, various reactions between solvent molecules, salt species, and the positive and negative electrodes can also lead to consumption of salt.42 Therefore, in addition to the importance of the maximum conductivity, an electrolyte chosen for high-rate cycling should maintain a high conductivity over a wide range of salt concentrations. Adding MA as a co-solvent slightly increases the width of the conductivity profile.
Figure 6 shows plots of conductivity as a function of LiPF6 concentration for electrolytes with solvents EC:DMC:MA 30:(70-x):x, x = {0, 10, 20, 30} (wt. %) in the temperature range 0°C – 40°C, with corresponding AEM calculations shown as solid lines. In Figures 3 and 4, it was found that the viscosities of DMC-containing electrolytes over all conditions were lower than in corresponding EMC-containing electrolytes. Similarly, the conductivities of DMC-containing electrolytes tend to be higher than their EMC-containing counterparts. At 40°C, the AEM predicts the maximum conductivity for an electrolyte with the solvent blend EC:DMC:MA 30:40:30 is around 20 mS/cm, while the maximum conductivity for EC:EMC:MA 30:40:30 is closer to 16 mS/cm. This difference in conductivity will begin to matter more at low temperature, especially at very high charging rates. In Figure 6, the LiPF6 concentration at maximum conductivity shifts higher at larger proportions of MA in the electrolyte, again due to the small increase in dielectric constant and decrease of viscosity on the addition of MA. As well, the width of the conductivity curves is greatly increased, more so than in the EMC-containing electrolytes. Conductivity data displayed in Figures 5 and 6 are also provided in Tables VIt7t8t9–X.
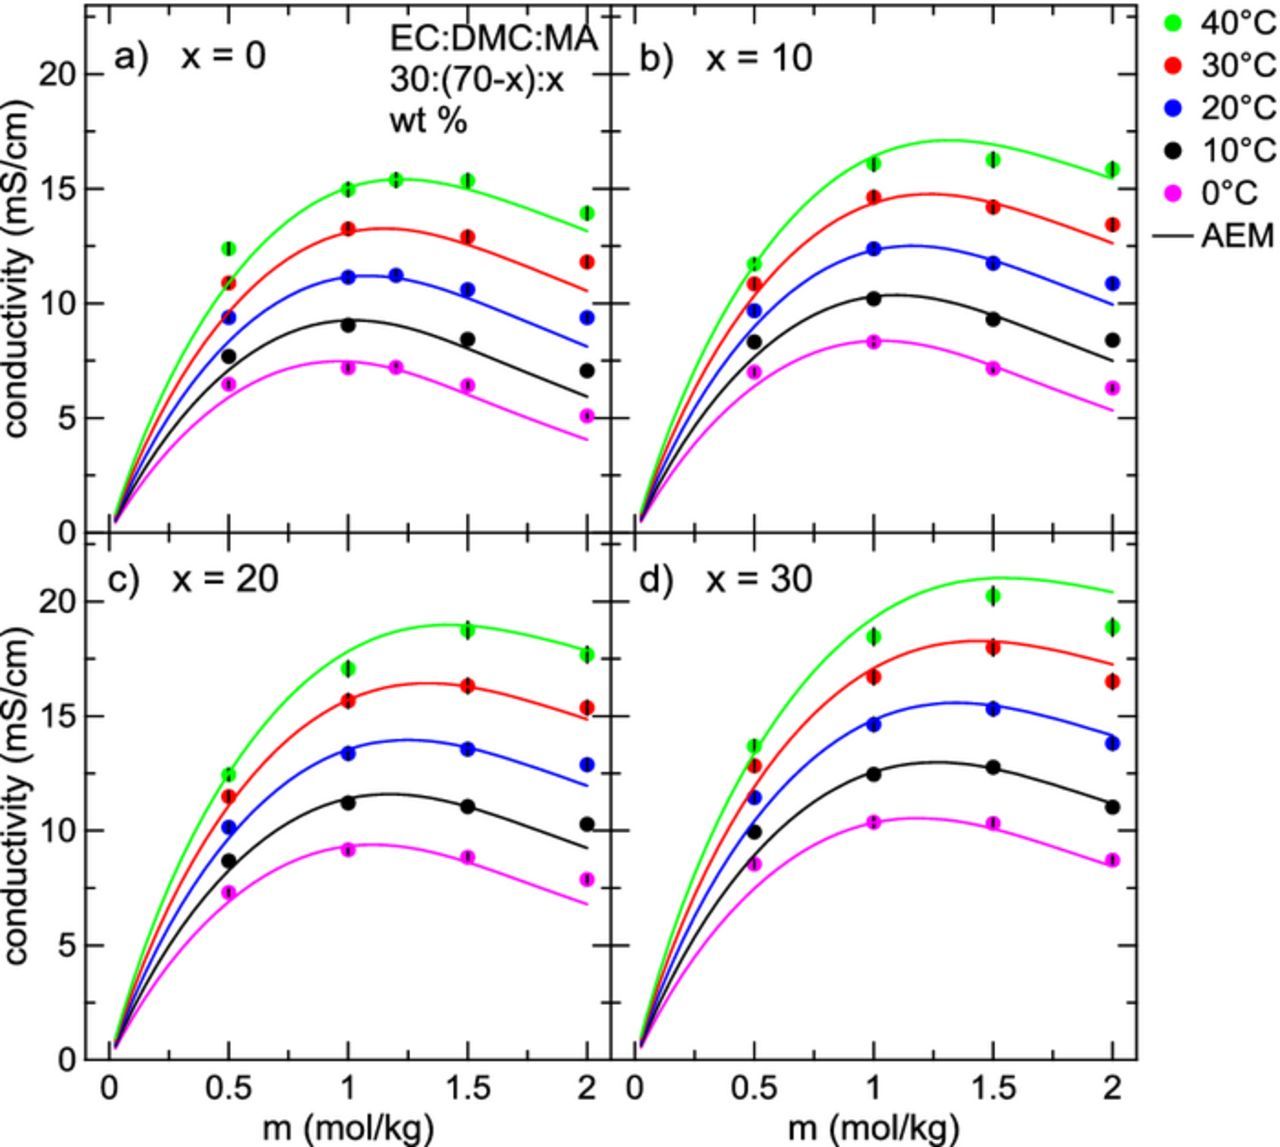
Figure 6. Conductivity versus LiPF6 concentration for electrolytes with solvent compositions EC:DMC:MA 30:(70-x):x for 0 ⩽ x ⩽ 30 for a range of temperatures between 0°C and 40°C. Solid lines are calculations from the AEM.
Table VI. Electrolytic conductivity at 0°C for the different solvent blends studied for LiPF6 concentrations between 0.5 m and 2.0 m.
| Solvents | Weight % solvent | Conductivity (mS/cm) at LiPF6 concentration (mol/kg) | |||||||
|---|---|---|---|---|---|---|---|---|---|
| 1 | 2 | 3 | 1 | 2 | 3 | 0.5 | 1.0 | 1.5 | 2.0 |
| EC | DMC | MA | 30 | 70 | 0 | 6.47 | 7.19 | 6.42 | 5.09 |
| EC | DMC | MA | 30 | 60 | 10 | 7.00 | 8.32 | 7.16 | 6.31 |
| EC | DMC | MA | 30 | 50 | 20 | 7.30 | 9.17 | 8.84 | 7.87 |
| EC | DMC | MA | 30 | 40 | 30 | 8.54 | 10.37 | 10.32 | 8.71 |
| EC | EMC | MA | 30 | 70 | 0 | 4.75 | 5.13 | 4.36 | 3.27 |
| EC | EMC | MA | 30 | 60 | 10 | 5.90 | 6.43 | 5.41 | 4.76 |
| EC | EMC | MA | 30 | 50 | 20 | 6.13 | 7.54 | 6.69 | 5.57 |
| EC | EMC | MA | 30 | 40 | 30 | 7.30 | 9.63 | 8.30 | 7.23 |
Table VII. Electrolytic conductivity at 10°C for the different solvent blends studied for LiPF6 concentrations between 0.5 m and 2.0 m.
| Solvents | Weight % solvent | Conductivity (mS/cm) at LiPF6 concentration (mol/kg) | |||||||
|---|---|---|---|---|---|---|---|---|---|
| 1 | 2 | 3 | 1 | 2 | 3 | 0.5 | 1.0 | 1.5 | 2.0 |
| EC | DMC | MA | 30 | 70 | 0 | 7.69 | 9.05 | 8.43 | 7.06 |
| EC | DMC | MA | 30 | 60 | 10 | 8.32 | 10.20 | 9.30 | 8.40 |
| EC | DMC | MA | 30 | 50 | 20 | 8.68 | 11.21 | 11.05 | 10.28 |
| EC | DMC | MA | 30 | 40 | 30 | 9.94 | 12.46 | 12.77 | 11.03 |
| EC | EMC | MA | 30 | 70 | 0 | 5.77 | 6.44 | 5.51 | 4.57 |
| EC | EMC | MA | 30 | 60 | 10 | 7.08 | 7.91 | 7.03 | 6.39 |
| EC | EMC | MA | 30 | 50 | 20 | 7.30 | 9.19 | 8.53 | 7.38 |
| EC | EMC | MA | 30 | 40 | 30 | 8.62 | 11.53 | 10.39 | 9.15 |
Table VIII. Electrolytic conductivity at 20°C for the different solvent blends studied for LiPF6 concentrations between 0.5 m and 2.0 m.
| Solvents | Weight % solvent | Conductivity (mS/cm) at LiPF6 concentration (mol/kg) | |||||||
|---|---|---|---|---|---|---|---|---|---|
| 1 | 2 | 3 | 1 | 2 | 3 | 0.5 | 1.0 | 1.5 | 2.0 |
| EC | DMC | MA | 30 | 70 | 0 | 9.38 | 11.14 | 10.60 | 9.38 |
| EC | DMC | MA | 30 | 60 | 10 | 9.68 | 12.38 | 11.75 | 10.86 |
| EC | DMC | MA | 30 | 50 | 20 | 10.15 | 13.37 | 13.55 | 12.88 |
| EC | DMC | MA | 30 | 40 | 30 | 11.45 | 14.63 | 15.31 | 13.81 |
| EC | EMC | MA | 30 | 70 | 0 | 6.84 | 7.94 | 7.10 | 6.17 |
| EC | EMC | MA | 30 | 60 | 10 | 8.31 | 9.58 | 8.87 | 8.31 |
| EC | EMC | MA | 30 | 50 | 20 | 8.70 | 11.05 | 10.64 | 9.35 |
| EC | EMC | MA | 30 | 40 | 30 | 9.97 | 13.64 | 12.66 | 11.33 |
Table IX. Electrolytic conductivity at 30°C for the different solvent blends studied for LiPF6 concentrations between 0.5 m and 2.0 m.
| Solvents | Weight % solvent | Conductivity (mS/cm) at LiPF6 concentration (mol/kg) | |||||||
|---|---|---|---|---|---|---|---|---|---|
| 1 | 2 | 3 | 1 | 2 | 3 | 0.5 | 1.0 | 1.5 | 2.0 |
| EC | DMC | MA | 30 | 70 | 0 | 10.89 | 13.25 | 12.90 | 11.80 |
| EC | DMC | MA | 30 | 60 | 10 | 10.85 | 14.63 | 14.20 | 13.43 |
| EC | DMC | MA | 30 | 50 | 20 | 11.49 | 15.66 | 16.32 | 15.36 |
| EC | DMC | MA | 30 | 40 | 30 | 12.83 | 16.71 | 17.99 | 16.51 |
| EC | EMC | MA | 30 | 70 | 0 | 7.97 | 9.57 | 8.65 | 7.95 |
| EC | EMC | MA | 30 | 60 | 10 | 9.49 | 11.24 | 10.80 | 10.29 |
| EC | EMC | MA | 30 | 50 | 20 | 9.93 | 12.49 | 12.70 | 11.38 |
| EC | EMC | MA | 30 | 40 | 30 | 11.15 | 15.41 | 15.02 | 13.35 |
Table X. Electrolytic conductivity at 40°C for the different solvent blends studied for LiPF6 concentrations between 0.5 m and 2.0 m.
| Solvents | Weight % solvent | Conductivity (mS/cm) at LiPF6 concentration (mol/kg) | |||||||
|---|---|---|---|---|---|---|---|---|---|
| 1 | 2 | 3 | 1 | 2 | 3 | 0.5 | 1.0 | 1.5 | 2.0 |
| EC | DMC | MA | 30 | 70 | 0 | 12.38 | 14.97 | 15.35 | 13.93 |
| EC | DMC | MA | 30 | 60 | 10 | 11.71 | 16.10 | 16.26 | 15.85 |
| EC | DMC | MA | 30 | 50 | 20 | 12.44 | 17.06 | 18.74 | 17.68 |
| EC | DMC | MA | 30 | 40 | 30 | 13.68 | 18.46 | 20.24 | 18.87 |
| EC | EMC | MA | 30 | 70 | 0 | 9.05 | 11.05 | 10.14 | 9.75 |
| EC | EMC | MA | 30 | 60 | 10 | 10.39 | 12.44 | 12.56 | 12.19 |
| EC | EMC | MA | 30 | 50 | 20 | 10.73 | 14.19 | 14.70 | 13.30 |
| EC | EMC | MA | 30 | 40 | 30 | 12.07 | 16.95 | 16.74 | 15.03 |
AEM calculations are compared to the experimental conductivity results in Figures 5 and 6. Again, like the viscosity results in Figures 3 and 4, the AEM does well in predicting the experimental conductivity values. AEM calculations have an average deviation from experiment of 4.9% over all temperatures and concentrations. The AEM agrees better with conductivity data at lower concentrations of LiPF6. The average deviation from experiment is 4.9% at 0.5 m, 3.2% at 1.0 m, 3.2% at 1.5 m, and 8.3% at 2.0 m LiPF6. The uncertainty of the conductivity setup is ±2% of the measured value. This is assuming the limited electrolyte/air contact in the setup of the experiment does not introduce significant contamination. Again, as was concluded for the viscosity results (Figures 3 and 4), some disagreements between experiment and model results are due to limitations of the AEM. Other disagreements could be more weighted on the experimental side or a combination of model and lab inaccuracies. As an example, the experimental conductivity data in Fig. 5 at 40°C exhibits some scatter in the trends when going from 0.5 to 2 m, and the upward shift in conductivity from 30 to 40°C data is generally not as great as expected, as for lower temperature progressions. This suggests in part that there could be temperature variance in laboratory conditions from the 40°C mark, most likely at conditions below 40°C that would manifest in lower conductivity values.
Figures 7a and 7b show the percentage conductivity increase as a function of MA content, x, in electrolytes with solvent blends EC:EMC:MA and EC:DMC:MA, respectively, at 20°C for different concentrations of LiPF6. The percentage increase is a relative increase for a given LiPF6 concentration. Figures 7c and 7d show viscosity as a function of MA content for electrolytes of the form EC:EMC:MA and EC:DMC:MA, respectively, again at 20°C for different LiPF6 concentrations. Decreasing viscosity is seen on the addition of MA at all concentrations of LiPF6. As the salt concentration in the electrolyte is increased, a greater decrease in viscosity is seen. Similarly, adding MA impacts conductivity at all salt concentrations, as seen in Figures 7a and 7b. The increase is smaller for lower salt concentrations, but even at 0.5 m, a conductivity boost above 20% is seen for EMC-containing electrolytes when only 20% MA is added to the electrolyte. The increase in conductivity at 2.0 m LiPF6 and 20% MA in Figure 7a is over 40%. The magnitude of the increase in conductivity for DMC-containing electrolytes (Fig. 7b) is lower than for EMC-containing electrolytes (Fig. 7a); at 2.0 mol/kg LiPF6 and 20% MA, the conductivity increase is about 40%.
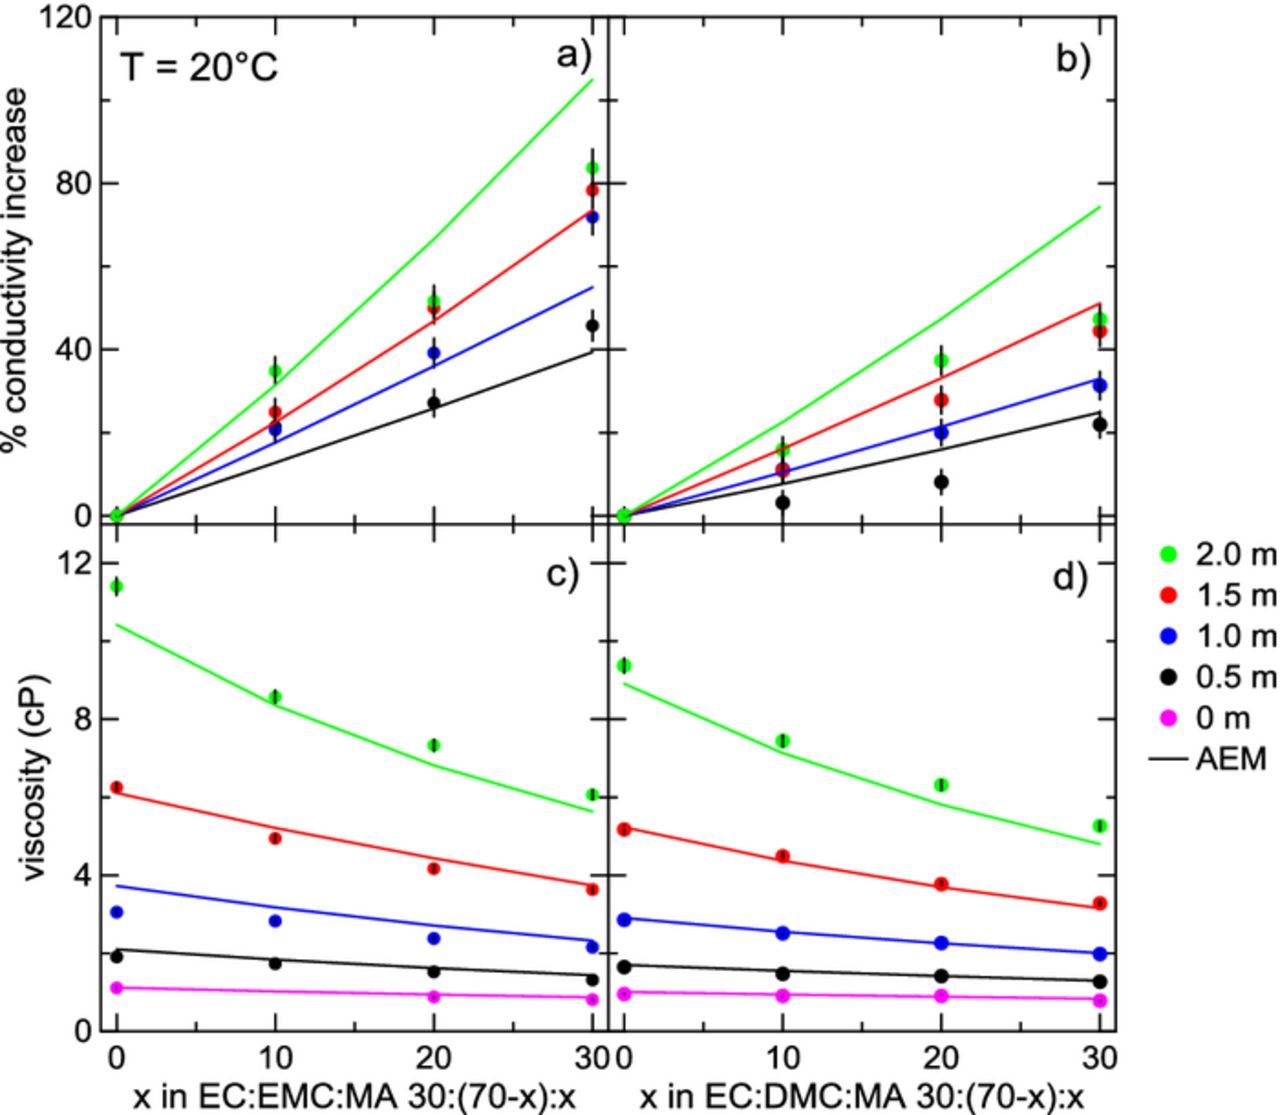
Figure 7. Percent change in conductivity at 20°C with increasing MA content for solvent blends EC:EMC:MA 30:(70-x):x and EC:DMC:MA 30:(70-x):x is shown in panels a) and b), respectively. Panels c) and d) show viscosity as a function of MA content for solvent blends EC:EMC:MA 30:(70-x):x and EC:DMC:MA 30:(70-x):x, respectively, also at 20°C. Different concentrations of LiPF6 are shown, ranging from 0 m to 2.0 m.
AEM calculations are shown for all conditions in Figure 7. The AEM agrees fairly well with the experimental data for the solvent compositions ranging from 0% to 30% MA content. Some large deviations from experiment are seen at 2.0 m LiPF6 in Figures 7a and 7b. Looking at panels (c) and (d) in Figure 7, AEM predictions for the viscosity of pure solvent blends (0 m) almost exactly match the experimental data. Agreement with experiment drifts a little as LiPF6 concentration is increased, and at 2.0 m LiPF6, the AEM slightly under-estimates the experimental viscosity for all electrolytes.
Stokes' law
The AEM is a model that uses a statistical-mechanical framework that considers molecular-scale interactions (solvent-solvent, solvent-ion, and ion-ion) in electrolyte systems, and uses these interactions to calculate a number of macroscopic electrolyte properties such as conductivity and viscosity.3,38 The expression for conductivity derived by Gering is based on an expanded expression of Stokes' Law for electrolytic conductivity that accounts for key phenomena that influence conductivity: solvent-ion interactions (ion solvation) and solvated ion sizes as f(conc., T), ion-ion interactions (ion association and electrostatic interactions), viscosity, counter-ion transport, ionic random motion effects and ionic hopping.3 In its simplest form, the conductivity is derived by assuming the drag force on migrating ionic species is given by Stokes' Law
![Equation ([1])](https://content.cld.iop.org/journals/1945-7111/165/2/A21/revision1/d0001.gif)
where η is the dynamic viscosity, r is the Stokes radius, and ν is the drift velocity. In equilibrium, this is equal to the electric force on the ionic species FE = qE = zeE. For multiple ionic species (i.e. Li+ and PF6−), the total conductivity of the electrolyte σ can be found to be:
![Equation ([2])](https://content.cld.iop.org/journals/1945-7111/165/2/A21/revision1/d0002.gif)
where zi is the charge on the ion, F is Faraday's constant, e is the elementary charge, and ci is the molar concentration of ionic species. If it is assumed that the salt is fully dissociated, the concentration of charged species is equal to the concentration of salt added. Under this simple model, σ should be inversely proportional to η for a given salt concentration if the Stokes radius is unchanged for different electrolytes. If this is true, Equation 2 can be simplified to
![Equation ([3])](https://content.cld.iop.org/journals/1945-7111/165/2/A21/revision1/d0003.gif)
where K is a constant. The simple Stokes' Law model has been previously shown to be approximately true by Dudley et al. for electrolytes containing LiAsF6 salt and sulfolane mixed with various glyme solvents.1 The AEM provides an advantage through direct calculation of ion association, making possible the determination of all populations of single (free) ions, ion pairs as contact (CIP) and solvent-shared (SShIP) species, as well as ABA+ and BAB− triple ion species. All non-neutral charged species are accounted for in conductivity through the AEM.3 In so doing, the AEM provides a path to diagnosing attributes of Walden-type plots. Figure 8 shows conductivity plotted versus inverse viscosity for the different electrolytes studied. Different solvent mixtures are given by unique plotting symbols, and different temperatures are specified by color. AEM calculations for these electrolytes are also plotted in Figure 8, using corresponding open symbols for a given solvent blend. LiPF6 concentrations of 0.5 m, 1.0 m, and 2.0 m are shown. Note that data are grouped according to molal concentration even though Equation 2 has a factor of molar concentration. It is assumed for simplicity that for a given molal concentration, the corresponding molar concentrations are approximately equal for the different solvent blends. For each concentration of salt, linear regressions were performed on the data, with the y-intercept forced to 0. All of the electrolytes roughly agree with the Stokes' law model. This shows that for a given concentration, the Stokes radius, which is a simple way of expressing the solvated ionic radius, remains approximately unchanged. In reality, the Stokes radius should change with different solvent mixtures. Indeed, there is some spread away from the ideal Stokes behavior in Figure 8. Most notably, some MA-containing electrolytes at 40°C and 0.5 m LiPF6 deviate somewhat from the fit. In these cases, solvent-ion interactions become non-negligible and the electrolyte conductivity cannot be considered to be solely viscosity driven. As example considerations, the solvated ion sizes vary with choice of solvent mixture and decrease at greater salt concentration. The AEM captures these more complicated solvation effects and is outlined in the literature.3,38 However, Figure 8 shows that the Stokes' Law model serves as a good first approximation for electrolyte conductivity in these systems, meaning that for these MA containing electrolytes the conductivity can be roughly predicted from the viscosity. Predictions from the AEM for these electrolytes in Figure 8 show that the expected deviation from the simple Stokes' behavior is small in most cases.
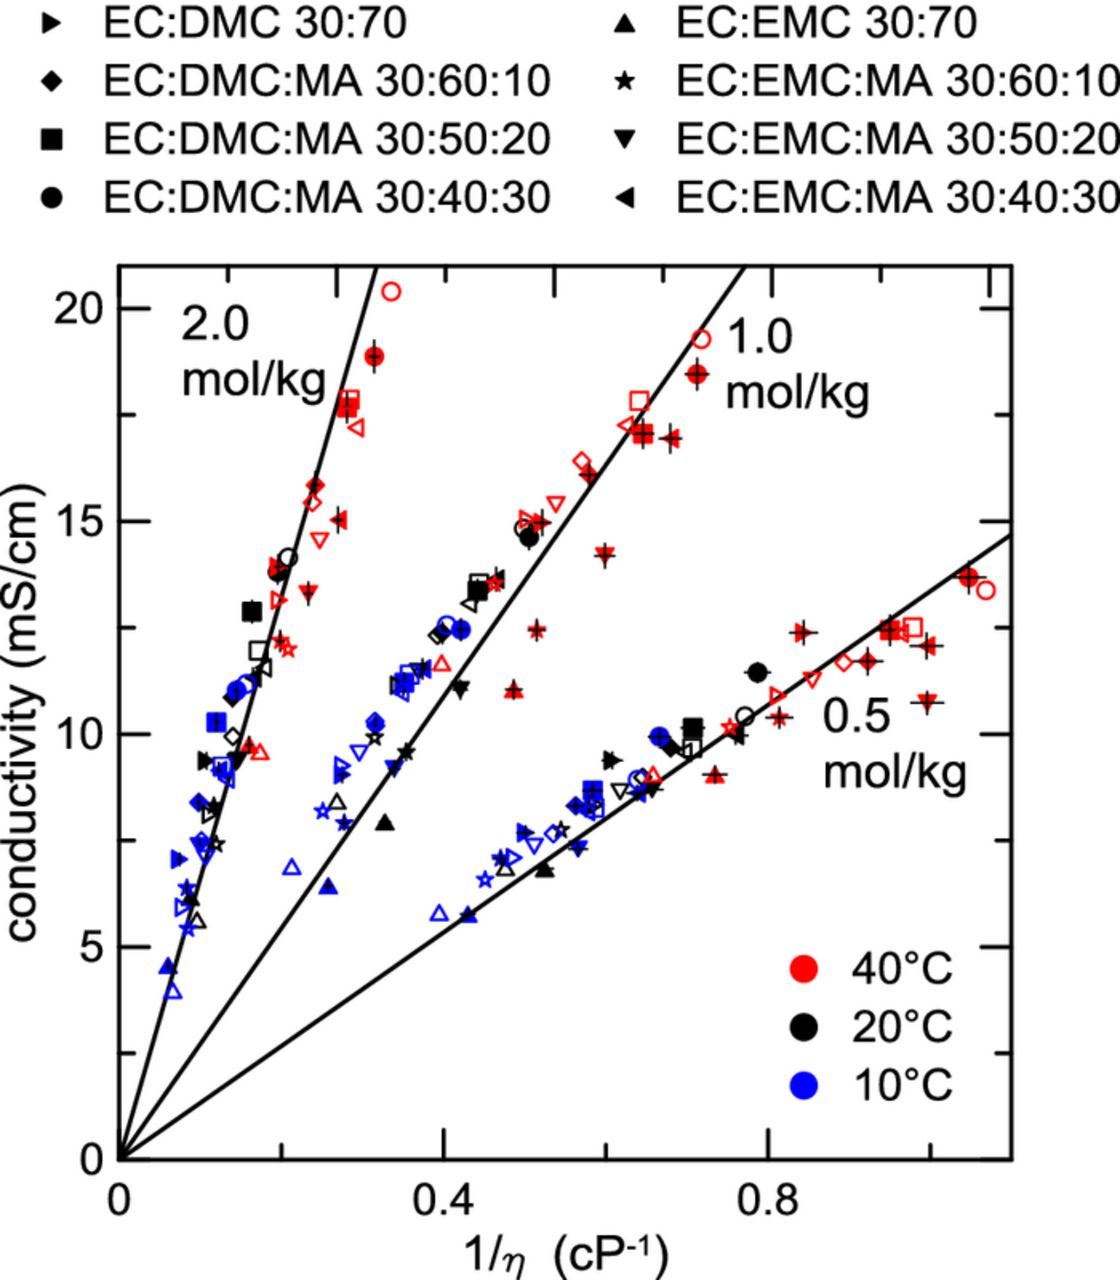
Figure 8. Conductivity versus inverse viscosity for several different electrolyte compositions at 10°C, 20°C, and 40°C. LiPF6 concentrations of 0.5 mol/kg, 1.0 mol/kg, and 2.0 mol/kg are shown. Symbol type specifies specific solvent blends. Closed symbols are for experimental data, while corresponding AEM calculations are shown as open symbols. Solid lines correspond to linear fits of each respective concentration. Fits were constrained to pass through the point (0,0) as per Equation 2.
In the simplest Stokes' law approximation, it was assumed that the Li salt is fully dissociated in solution. The high-dielectric solvent, EC, helps dissociate the Li salt, but in the systems studied, EC only makes up 30% of the electrolyte solvent by weight. A similar expression for relating electrolytic conductivity and viscosity is the empirical Walden rule
![Equation ([4])](https://content.cld.iop.org/journals/1945-7111/165/2/A21/revision1/d0004.gif)
where Λ is the molar conductivity σ/c. Walden analysis has been used recently to study the ionicity of ionic liquids,43–45 but has also been applied to non-aqueous Li electrolytes.46 A fully dissociated electrolyte should obey the expression
![Equation ([5])](https://content.cld.iop.org/journals/1945-7111/165/2/A21/revision1/d0005.gif)
obtained for dilute aqueous KCl, which is assumed to be fully dissociated in solution. The validity of the assumptions made for using KCl as an ideal reference have been put into question recently, especially when comparing with ionic liquids.47 However, the traditional interpretation states that points close to the KCl line are taken to be nearly fully dissociated, while points below the line have a lower degree of dissociation (ionicity).46 This analysis should give an indication about the ionicity of the electrolytes studied. Figure 9 shows a Walden plot for the same electrolytes presented in Figure 8. LiPF6 concentrations of 0.5 m, 1.0 m, and 2.0 m, and temperatures of 10°C, 20°C, and 40°C are shown. The data roughly follow a linear trend below the ideal KCl line, yet there is greater deviation from the KCl noted at the lower concentrations. First, this suggests that at each salt concentration there is a modest but relatively consistent amount of ion pairing present in these electrolytes across all solvent compositions. Second, note that solvated ion sizes are also part of the Stoke's Law expression, however they decrease with increasing salt concentration, whereas viscosity increases. This aspect of greater ion solvation activity at lower salt concentration, with commensurate larger Stokes radii, helps explain why the Walden plots of lower-concentration data deviate more from the ideal KCl line, which is a good baseline considering that both K+ and Cl− are minimally solvated.38 The magnitude of the solvated ionic diameters will be a predominant influence for the departure of the Walden plots from the ideal line. Adding MA does not seem to impact the ionicity of the electrolyte. This may be expected considering that the dielectric constants of EMC, DMC, and MA are on the same order of magnitude (Table I). As well, deviation from the KCl line stays approximately constant across the range of LiPF6 concentrations considered. Gering predicts ion pair population in the EC:EMC 30:70 system to increase from a molar fraction of 0.01 to about 0.08 between 0.5 m and 2.0 m LiPF6. Gering also predicts an increase in triple ion population over the same concentration range, and at 2 m LiPF6 ion pair and triple ion populations are almost equal. Figure 9 suggests that the total fraction of ionic species (single ions and triple ions) does not significantly change, even at high salt concentrations. Since the AEM calculates low ion pair populations at concentrations up to 2.0 m, its predictions are consistent with this result. Therefore, the characteristic drop in conductivity seen beyond a critical concentration (Figures 5 and 6) must be primarily due to an increase in viscosity for these electrolytes rather than significant ion pairing.
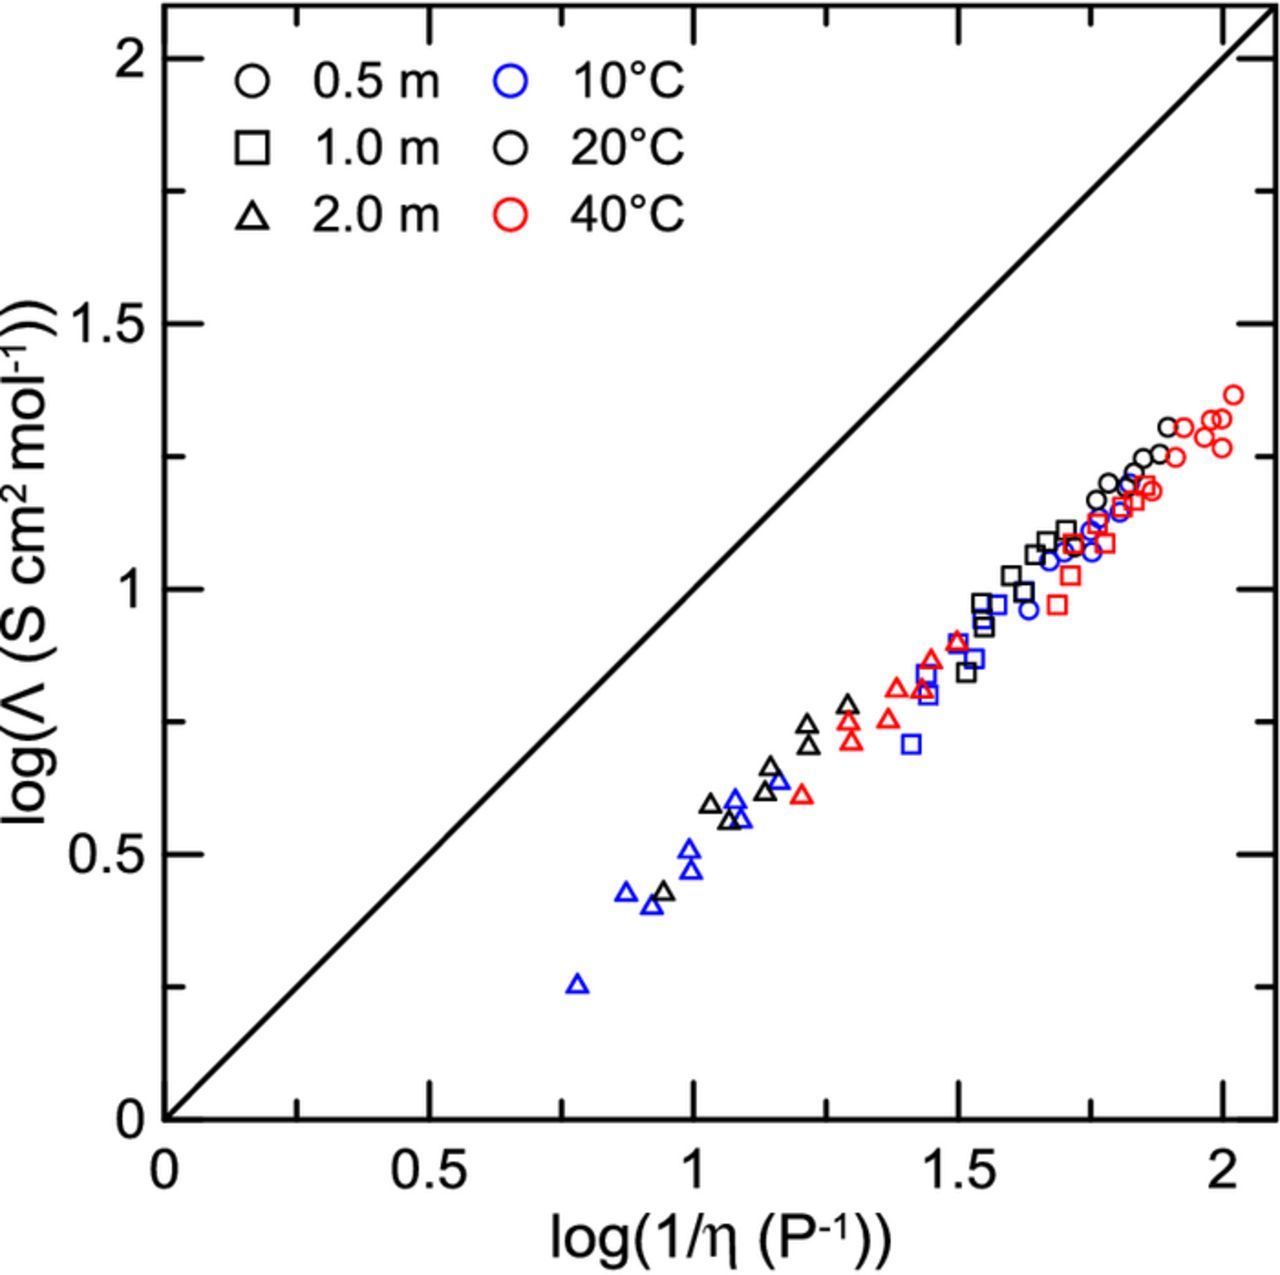
Figure 9. Walden plot for the electrolytes considered in Figure 8. LiPF6 concentrations of 0.5 m, 1.0 m, and 2.0 m are shown. Temperatures of 10°C, 20°C, and 40°C are shown as different colors. The solid line corresponds to the diluted KCl reference, which is taken to be the region of the plot where the ions are fully dissociated.
Cycling results
Figure 10 shows cycling results for cells with electrolytes (100-x)% [EC:EMC 30:70 + 2% FEC] + x% MA, for x = {0, 20, 40} (wt. %). Discharge capacity is plotted as a function of cycle number for single crystal NMC532 /AG pouch cells. Cells with 0% MA show minimal fade at 1C rate charge, but at 1.5C charge and 2C charge, dramatic capacity fade is observed due to unwanted lithium plating.48,49 Cells with 20% MA and 40% MA show virtually no fade at these high charging rates. This shows that the addition of as little as 20% MA to the electrolyte greatly improves the charge rate capability of NMC532/AG cells by eliminating unwanted lithium plating. However, there is some evidence that adding MA sacrifices some long term lifetime. Li et al. have shown from ultra-high precision charging (UHPC) experiments that MA may make the electrolyte less stable when cycling to high voltages.40 Long term cycling at low charging rate (C/3) showed that cells with MA in the electrolyte had slightly larger capacity fade over 800+ cycles than cells without MA.40 Isothermal microcalorimetry experiments showed an increase in parasitic heat flow with increasing MA content, which suggests shorter lifetimes over the long-term.40 This in part reaffirms conclusions initially made by Smart,25 which state that short-chain esters may negatively impact the lifetime of cells. However, it is clear from Figure 10 that MA-containing electrolytes are far superior at very high charge rates.
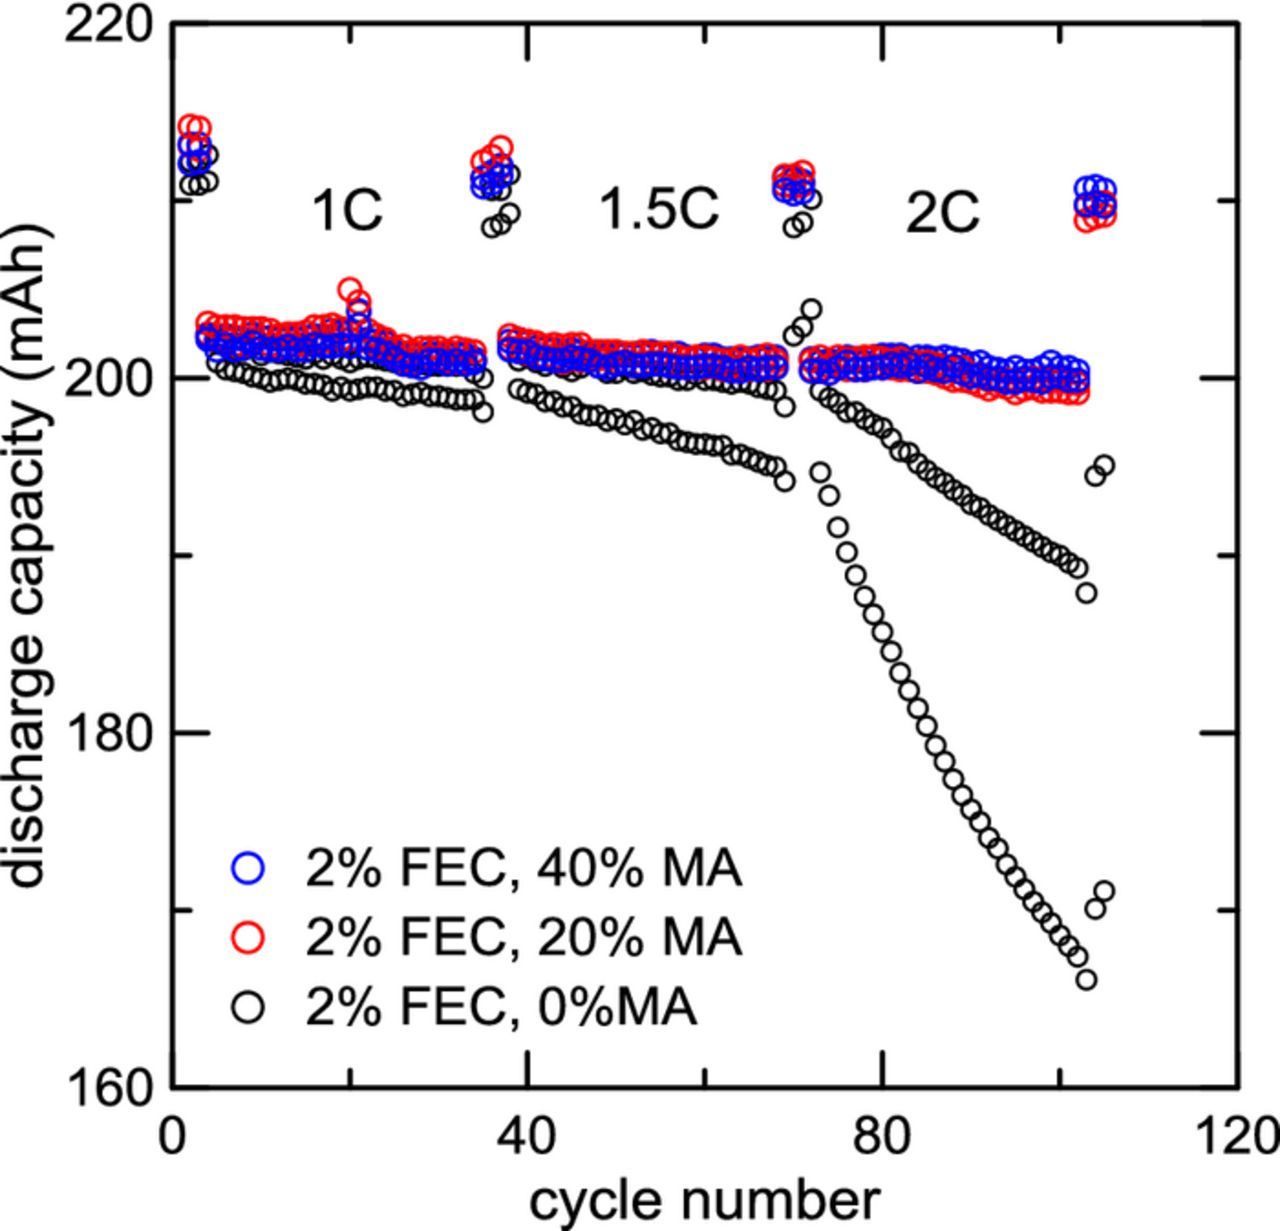
Figure 10. Discharge capacity versus cycle number for single crystal Li[Ni0.5Mn0.3Co0.2]O2 (NMC532)/ artificial graphite pouch cells charged at different rates at 20°C. All cells were discharged at a rate of 0.5C. All cells contain 2% by weight fluoroethylene carbonate (FEC) in the electrolyte. Cells containing 0%, 20% and 40% MA by weight in the electrolyte are shown. Two identical cells were made for each unique electrolyte.
Conclusions
The aim of this study was to consider the impact of ester co-solvents on key physical properties of electrolytes for Li-ion batteries. Initial temperature-dependent viscosity measurements showed that methyl acetate (MA) had the lowest viscosity in its pure form of all esters investigated in this work, and that its viscosity was much lower than either ethyl methyl carbonate (EMC) or dimethyl carbonate (DMC). This indicated that MA should be the most promising co-solvent for improving the physical properties of carbonate-based electrolytes. Further measurements of full Li electrolytes confirmed that MA gave the greatest increase in conductivity of the esters studied.
Conductivity and viscosity were then measured as a function of temperature for a wide range of electrolytes containing different concentrations of LiPF6 and MA. Two electrolyte systems were tested, EC:linear carbonate:MA 30:(70-x):x, with linear carbonate = {EMC, DMC} and x = {0, 10, 20, 30} (wt. %), with LiPF6 concentrations ranging from 0 m to 2 m. Results from these measurements showed that adding MA gave a significant increase in conductivity over a wide range of salt concentrations. Decreases in viscosity were observed across all LiPF6 concentrations when MA was added.
The Advanced Electrolyte Model (AEM) was successfully able to predict properties of electrolytes containing MA and other esters over a range of different conditions. Deviations between AEM predictions and experimental data were minor (some averages of about 5% for both viscosity and conductivity), and while they did increase in selected extreme cases they stayed within modest boundaries. The experimental data can roughly be described using a simple expression derived from Stokes' law, suggesting that the Stokes radii remain relatively unchanged over the different solvent compositions. A Walden analysis of the different electrolytes suggests that neither MA content nor LiPF6 concentration significantly impact the ionicity of the electrolyte in the ranges studied.
Cycling data for single crystal NMC532/artificial graphite cells shows that adding as little as 20% MA by weight to the electrolyte can dramatically improve capacity retention at high charge rates by eliminating unwanted lithium plating. Very little capacity fade is seen at charging rates as high as 2C. MA looks to be a promising co-solvent for high power Li-ion cells.
Acknowledgments
The authors thank NSERC and Tesla Canada for funding under the auspices of the Industrial Chairs program. E.R.L. thanks the Nova Scotia graduate scholarship program for support and E.M.T. thanks NSERC for support under the USRA program.