Abstract
The electrochemical performance of cells with a Li1.03(Ni0.5Co0.2Mn0.3)0.97O2 (NCM523) positive electrode and a blended silicon-graphite (Si-Gr) negative electrode are investigated using various electrolyte compositions and voltage cycling windows. Voltage profiles of the blended Si-Gr electrode show a superposition of graphite potential plateaus on a sloped Si profile with a large potential hysteresis. The effect of this hysteresis is seen in the cell impedance versus voltage data, which are distinctly different for the charge and discharge cycles. We confirm that the addition of compounds, such as vinylene carbonate (VC) and fluoroethylene carbonate (FEC) to the baseline 1.2 M LiPF6 in ethylene carbonate (EC): ethyl methyl carbonate (EMC) (3:7 w/w) electrolyte, improves cell capacity retention with higher retention seen at higher additive contents. We show that reducing the lower cutoff voltage (LCV) of full cells to 2.5 V increases the Si-Gr electrode potential to 1.12 V vs. Li/Li+; this relatively-high delithiation potential correlates with the lower capacity retention displayed by the cell. Furthermore, we show that raising the upper cutoff voltage (UCV) can increase cell energy density without significantly altering capacity retention over 100 charge-discharge cycles.
Export citation and abstract BibTeX RIS

This is an open access article distributed under the terms of the Creative Commons Attribution 4.0 License (CC BY, http://creativecommons.org/licenses/by/4.0/), which permits unrestricted reuse of the work in any medium, provided the original work is properly cited.
The development of new high-energy electrochemical couples is important to reducing the overall cost and weight per kWh of Li-ion batteries. Silicon and silicon-containing blended electrodes have been a focus of much recent research as an alternative to the commercial graphite-based negative electrode because of the substantially higher theoretical capacity of silicon (3579 mAh g−1, Li15Si4) compared to that of graphite (372 mAh g−1, LiC6); the higher capacity enables reduction of the negative electrode weight thereby increasing energy density of the cell. However, concerns including electrode integrity and durability related to the substantial volume expansion/contraction (∼300%) of silicon during lithiation/delithiation reactions have hampered the use of silicon as a direct substitute for graphite.
Several strategies to overcome the durability problems target design of the composite electrode and its components. For example, purposely-designed silicon particle morphologies1–3 and the use of graphene4,5 are reported to improve the cycle life of electrodes in cells with a Li-metal counter electrode (half-cells). The choice of binders also greatly influences electrode coherence;6–10 for example lithiated polyacrylic acid (LiPAA) has been shown to increase cycle life compared to e.g. polyvinylidene fluoride (PVDF).6,8,10 Direct incorporation and mixing of silicon particles into standard graphite slurries also provides a means of incrementally improving electrode capacity, while retaining the higher durability of graphite electrodes.11–13
In addition to variations in the electrode constitution, alternative electrolytes are being studied to improve cell cycling stability by tuning the electrochemical interfaces. The use of electrolyte additives is especially common as small amounts can have large impact on the interfacial chemistry of both positive and negative electrodes. Fluoroethylene carbonate (FEC) specifically, and to some extent vinylene carbonate (VC), added to Si-containing cells has been shown to improve cycle life compared to cells containing the standard carbonate mixtures of ethylene carbonate (EC), ethyl methyl carbonate (EMC), and diethyl carbonate (DEC).14–19 Additionally, alternative strategies of usage could improve longevity,20 for example by cycling the cells in a narrower voltage window thereby limiting material expansion, albeit at a cost of lower capacity per cycle.
At the Cell Analysis, Modeling, and Prototyping (CAMP) facility of Argonne National Laboratory high-quality electrodes, prepared from commercially available materials, have been developed and made available to the research community to examine factors that limit cell performance and develop solutions that improve cell durability. In the first part of this article we report the performance of half-cells with Li1.03(Ni0.5Co0.2Mn0.3)0.97O2 (NCM523), graphite (Gr), blended Si-graphite (Si-Gr) electrodes. In the latter part we report performance of full cells containing NCM523-based positive electrodes and Si-Gr based negative electrodes; such full cell studies are needed to capture crosstalk between the electrodes, and to gauge durability of the lithium-limited cells. Of particular interest is the effect of voltage hysteresis introduced by the silicon on full-cell performance benchmarks, such as DC and AC power characterization tests, which are especially important for transportation applications. We present the effect of electrolyte composition, by adding various amounts of VC and FEC to our baseline electrolyte; such reports on electrolyte composition effects on silicon-containing full cells are still relatively few.18,21–26
We also describe the effect of voltage windows on cell performance and durability. We remind the reader that the effect of voltage windows on cell cycle life is intrinsically related to the negative and positive electrode's capacity matching (n:p ratio), and to the initial coulombic efficiency, which together dictate the electrode potential limits within a cell. Consequently, the aging behavior for given cycling conditions can vary in cells with different n:p ratios, as shown in Ref. 27. In this work, the full-cell cycling study is limited to a single (matched) electrode couple. We provide electrode-potential data from a reference electrode (RE) cell that helps rationalize the aging behavior observed for the various cycling windows. Studies of this nature are only the initial steps toward increasing the performance and durability of high-energy, silicon-containing, lithium-ion cells.
Experimental
Materials
Table I lists details of the cell materials used in our experiments. Both positive and negative electrodes are from CAMP. The NCM523 electrode contains Li1.03(Ni0.5Co0.2Mn0.3)0.97O2 as the active material, C-45 carbons for enhanced electron conduction and polyvinylidene fluoride (PVDF) binder. The Gr and Si-Gr (15 wt% silicon) electrodes contains C-45 carbons and partially-lithiated polyacrylic acid (LiPAA) binder (pH ∼ 7); the silicon particles are nanosize, in the 50 to 70 nm range. Our baseline electrolyte (Gen2) contains 1.2 M LiPF6 in ethylene carbonate (EC): ethyl methyl carbonate (EMC) 3:7 by weight; FEC, VC or a mixture of FEC and VC are added to the baseline electrolyte to examine their effects on cell performance. Note that the electrolyte density and salt concentration changes because of these additions (see Table II).
Table I. Cell materials.
| Negative electrode | 92 wt% graphite (MAGE, Hitachi) |
| (Gr) | 2 wt% C-45 (Timcal) |
| 6 wt% LiPAA | |
| Cu current collector (10 μm) | |
| Coating thickness: 53 μm | |
| Porosity: 45% | |
| Total coating loading: 6.09 mg cm−2 | |
| (Si-Gr) | 73 wt% graphite |
| 15 wt% Si (50–70 nm, Nanostructured and Amorphous Materials, Inc.) | |
| 2 wt% C-45 | |
| 10 wt% LiPAA | |
| Cu current collector (10 μm) | |
| Coating thickness: 25 μm | |
| Porosity: 42.4% | |
| Total coating loading: 2.94 mg cm−2 | |
| Positive electrode | 90 wt% NCM523 (Toda) |
| 5 wt% C-45 | |
| 5 wt% PVDF (Solef 5130, Solvay) | |
| Al current collector (20 μm) | |
| Coating thickness: 42 μm | |
| Porosity: 33.5% | |
| Total coating loading: 11.3 mg cm−2 | |
| Separator | Celgard 2325 (PP/PE/PP) |
| Thickness: 25 μm | |
| Porosity: 39% | |
| Electrolyte | 1.2 M LiPF6 in 3:7 EC:EMC by weight (Gen 2) (Tomiyama, Inc.) |
| / + FEC (Solvay) | |
| / + VC (BASF) |
Table II. Measured densities and calculated molarities (at 20°C).
| Molarity (mol dm−3) | ||||
|---|---|---|---|---|
| Density (g cm−3) | LiPF6 | FEC | VC | |
| Gen 2 (Tomiyama) | 1.217 | 1.2 | ||
| +5% VC | 1.223 | 1.15 | 0.68 | |
| +2.5% VC+2.5% FEC | 1.225 | 1.15 | 0.28 | 0.34 |
| +5% FEC | 1.227 | 1.15 | 0.55 | |
| +10% VC | 1.229 | 1.10 | 1.3 | |
| +10% FEC | 1.237 | 1.11 | 1.06 | |
| +20% FEC | 1.254 | 1.03 | 1.98 | |
| VC | 1.360 | |||
| FEC | 1.501 | |||
Cell assembly and electrochemical characterization
The electrochemical tests were conducted either in 2032-format stainless steel coin cells or in three-electrode cells containing a Li-metal reference electrode (RE). All cells were assembled in a glove box under argon atmosphere (O2 < 1 ppm). Before cell assembly the electrodes were dried overnight in a vacuum oven; the NCM523 and Gr electrodes were dried at 110°C and the LiPAA containing Si-Gr electrodes at 150°C. The Celgard 2325 separators were dried for approximately three hours in a vacuum oven set at 75°C.
In a half-cell configuration the coin cells contained either NCM523, Gr, or Si-Gr electrodes (1.6 cm2 area) and a Li-metal counter electrode; the cells were cycled at a low rate (< C/10) to examine potential profiles of the active materials. In a full-cell configuration the coin cells contained NCM523 as the positive electrode and either Gr or Si-Gr as the negative electrode; a single layer of Celgard 2325 separated the 1.6 cm2 area electrodes. All coin cells were contained in a Cincinnati Sub-Zero MicroClimate Model MCH-3 temperature chamber at 30°C and cycled with a Maccor Model 2300 battery test system. Full cell cycling performance was evaluated in various voltage windows between 2.5 and 4.4 V. The cell aging protocol consisted of three slow cycles at an approximate C/20 current rate (0.05 mA cm−2), 94 faster cycles at an approximate C/3 rate (0.33 mA cm−2), and then three additional slow cycles (0.05 mA cm−2) resulting in a total of 100 cycles. To examine the effect of voltage hysteresis, DC impedance of some full cells was obtained by applying a 3 C, 10 s charge or discharge pulse at predetermined cell voltages along both the charge and discharge curves; at each voltage, the cell was allowed to equilibrate for 1 hour prior to the 10 s pulse. In separate measurements AC impedance data were also obtained at these voltages with a Solartron Analytical 1470E cell test system.
The three-electrode cells were used to examine potential profiles of the positive and negative electrodes while the cell was cycled in various voltage windows between 2.5 and 4.3 V. The experimental set-up is described in more detail elsewhere.25,28 In brief, the electrode area in this set-up is 20.3 cm2 for both positive and negative electrodes, and two Celgard 2325 separators are used. The Li-metal RE, in contact with the electrolyte at the side of the electrode sandwich, provides accurate values of the electrode potentials when the cell is at open-circuit (zero current) and reasonable values at low cycling currents (< C/20). At higher currents, geometrical edge effects due to small electrode misalignments have a larger effect and the assignment of electrode potential contributions to cell voltage becomes increasingly inaccurate, as described previously.25
Results and Discussion
Initial electrochemical performance - coin (half) cells
The first two cycles of the NCM523, Gr, and Si-Gr electrodes, in a cell with a Li-metal counter electrode and 10% FEC added to Gen2 electrolyte, are shown in Figures 1 and 2. The NCM523 potential profile (Figure 1) displays two regions with distinct slopes and a discharge capacity of 198 mAh g−1 when cycled between 3.0 and 4.5 V vs. Li. The coulombic efficiencies are 90.1 and 99.7% for the first and second cycles, respectively; values exceeding 99.9% are obtained in succeeding cycles (not shown here). Electrolyte composition has a negligible effect on the NCM523 potential profiles; i.e., similar profiles are obtained in the Gen2 electrolyte and other electrolyte variations considered in this study.
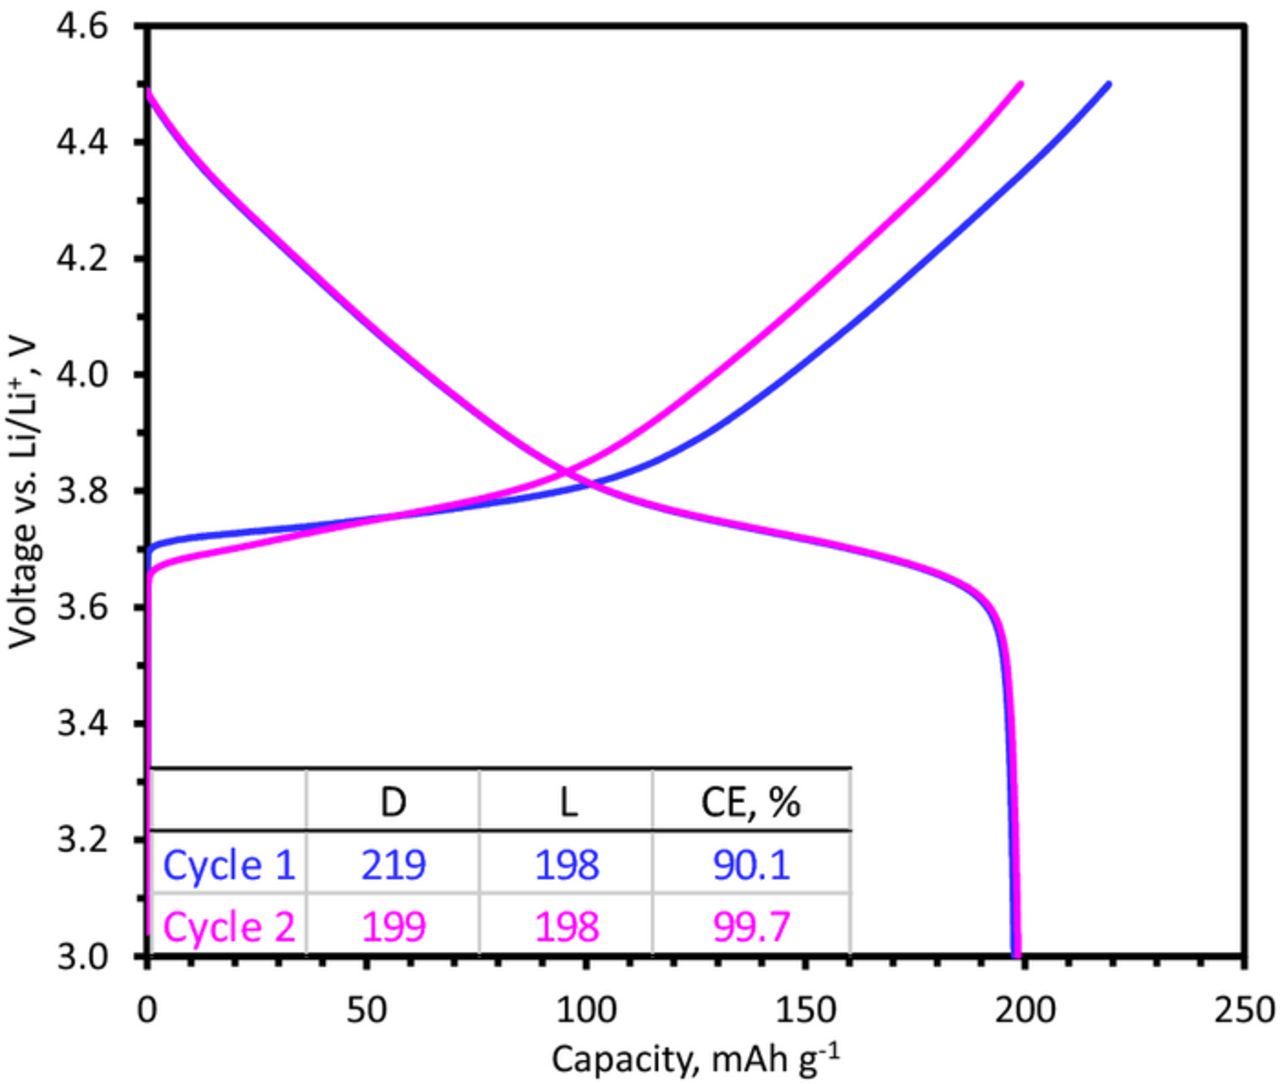
Figure 1. 1st and 2nd cycle capacity-voltage profiles from a NCM523/Li cell cycled at a ∼C/15 rate in the 3.0–4.5 V range at 30°C. The inset tables show the delithiation (D) and lithiation (L) capacities (in mAh g−1) and coulombic efficiencies (CE) of the cycles.
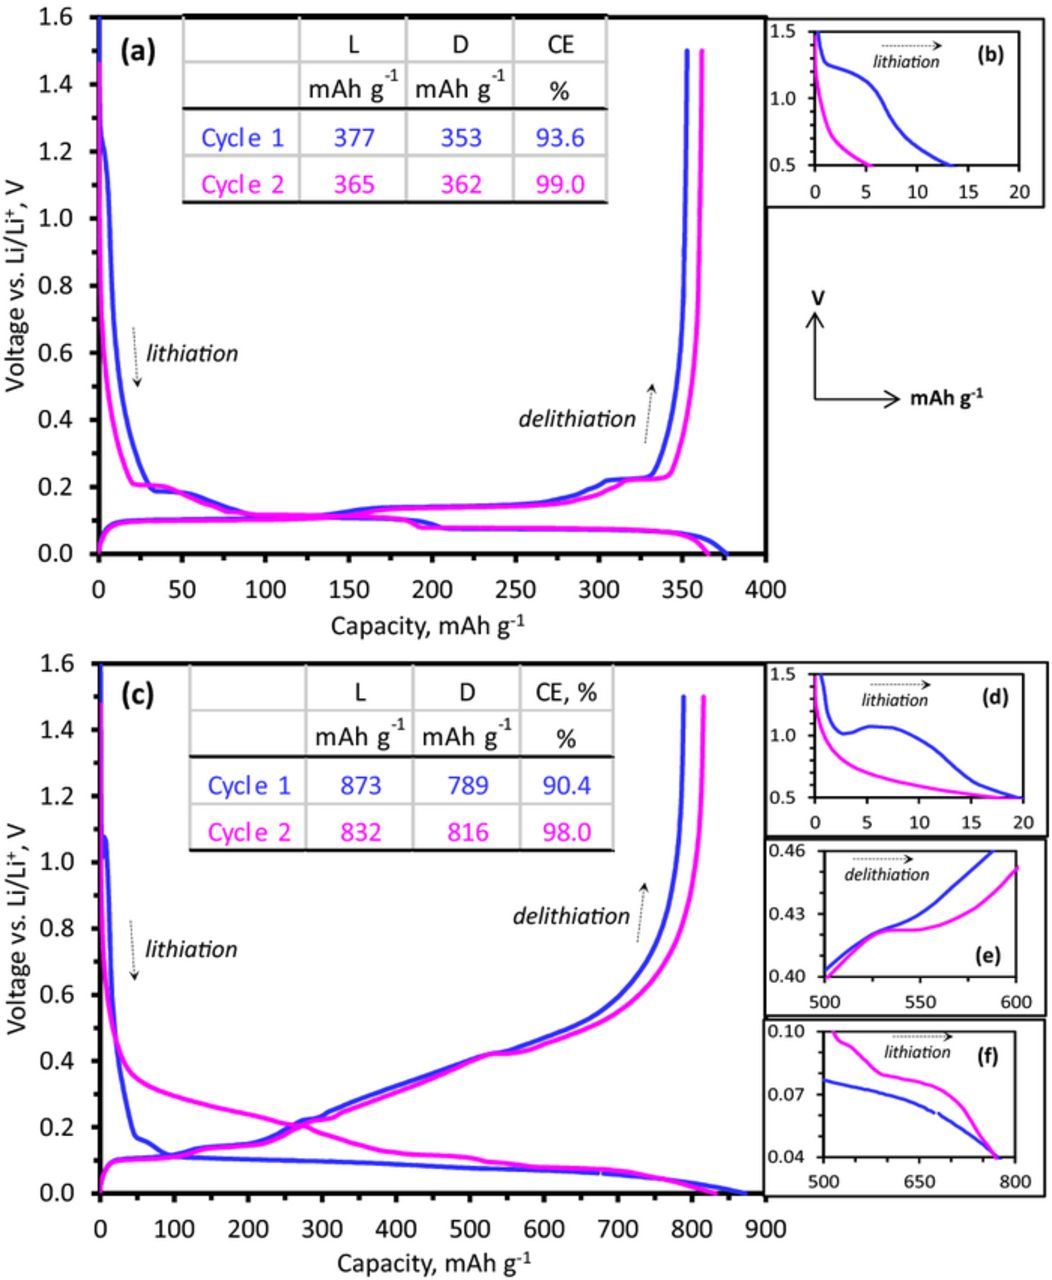
Figure 2. 1st and 2nd cycle capacity-voltage profiles from Gr/Li (a) and Si-Gr/Li cells (c) with Gen 2 + 10 wt% FEC electrolyte cycled at a ∼C/25 rate in the 1.5–0.0 V range at 30°C. The inset tables show lithiation (L) and delithiation (D) capacities and coulombic efficiencies (CE). Expanded views of specific sections are shown adjacent to the plots in (b) for Gr/Li, and (d) - (f) for Si-Gr/Li. For all figures the X and Y axes show capacity (mAh g−1) and voltages vs. Li/Li+ (V), respectively. Figures (b), (d), and (f) show lithiation cycles, whereas (e) shows delithiation cycles.
Figures 2a–2f contain capacity and voltage profiles of the Gr and Si-Gr electrodes for the first two cycles. Note that the Gr electrode profiles are similar for the two cycles, while the Si-Gr electrode lithiation profiles are distinctly different. The 15 wt% Si addition clearly increases electrode capacity, resulting in a specific (delithiation) capacity of 816 mAh g−1 compared to 362 mAh g−1 for the Gr electrode for the second 1.5–0.0 V cycle; this specific capacity is calculated based on the Si, graphite, and C45 carbon weight. The coulombic efficiencies of both first and second cycles are lower for the Si-Gr electrode; the first cycle efficiency is 90.4% compared to 93.6%, and the second cycle efficiency is 98.0% for the second cycle compared to 99.0% for the Gr electrode. Features associated with FEC reduction are seen in both the Gr/Li (Figure 2b, ∼1.2 V) and Si-Gr/Li (Figure 2d, ∼1.1 V) cells; this FEC reduction minimizes reduction of the EC component, which is typically observed at ∼0.7 V for cells with the Gen2 electrolyte. A similar behavior is observed for cells containing significant quantities (10 wt%) of VC added to the baseline electrolyte, which is not surprising because of the similarities in FEC and VC reduction characteristics.29
The Gr electrode (Figure 2a) displays distinct plateaus during the Li-ion intercalation/deintercalaction reactions; the voltage profiles are altered by silicon addition. During first lithiation of the Si-Gr electrode (Figure 2c), the first graphite lithiation plateau is still visible (∼0.16 V) before the characteristic low voltage gently-sloping plateau (around 0.1 V), associated with the initial lithiation and alloying of Si30,31 becomes dominant. The 0.16 V plateau is at a lower potential than that typically expected for graphite (0.21 V, see later). However, the plateau is not observed in the Si-only (no graphite) electrode data and must, therefore, arise from the graphite component; the lower potential may be a consequence of higher ohmic polarization (higher electrode impedance) during the first cycle. Also, no obvious plateau associated with the Li15Si4 phase is observed; this plateau may be shifted to values below our lower cutoff potential because of stresses remaining in the nanosilicon particles.32,33 Following the first lithiation, the addition of silicon increases the average voltage over the electrode capacity compared to the graphite electrode, as expected, both for lithiation and delithiation. A clear contrast between the sharp plateaus of the graphite electrode and the sloping profile of amorphous silicon is observed. Furthermore, a large voltage hysteresis between lithiation and delithiation results from Si introduction.
This hysteresis is clearly evident in Figure 3a, which compares the lithiation and delithiation curves of the Gr and the Si-Gr electrodes obtained at a very slow (<C/100) rate; the capacity values shown are normalized to graphite content in the electrodes. The corresponding differential capacity plots are shown in 3b. The data are from the fifth cycle, which provides features related to structural changes in the active material while minimizing features arising from electrolyte reduction. Two plots are shown for the Si-Gr electrodes; the lower cutoff potential (LCP) for the plots are 0.075 V (magenta) and 0.0 V (blue), respectively.
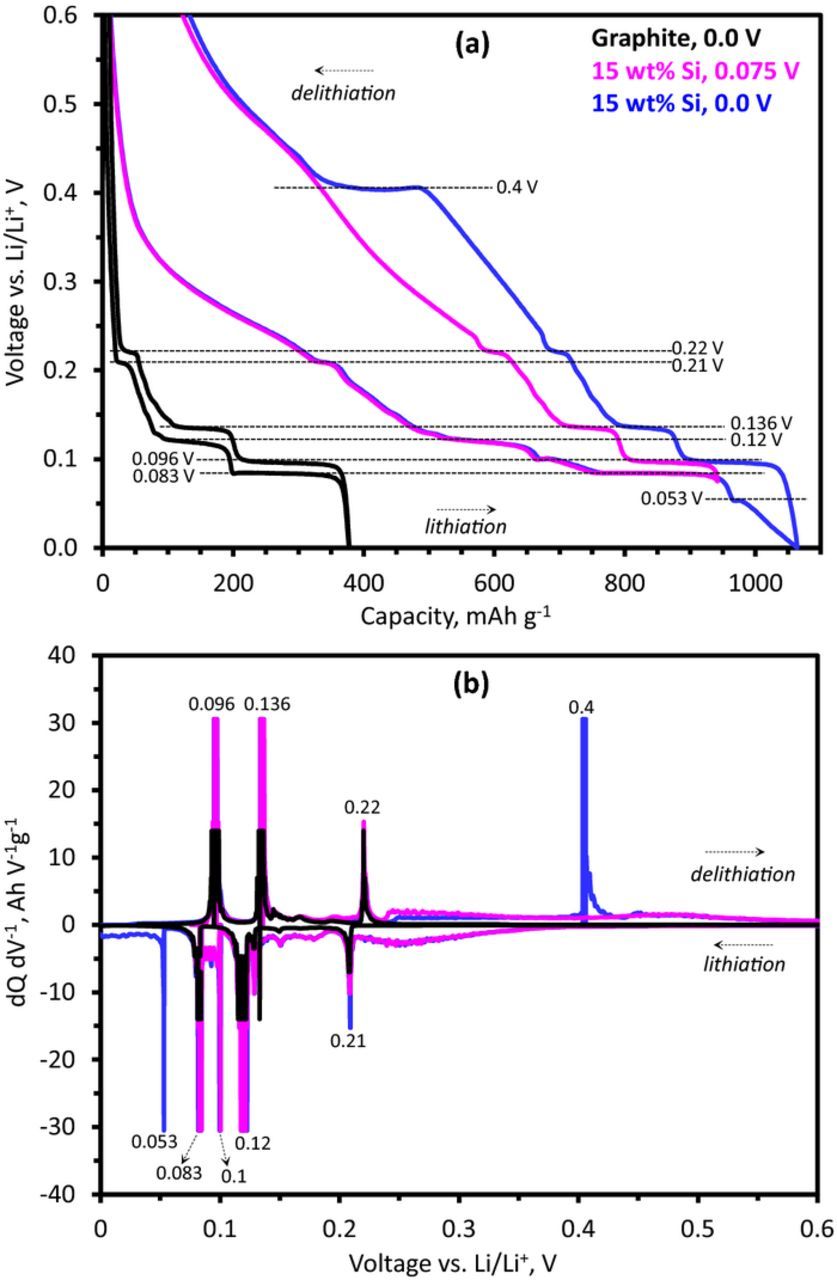
Figure 3. (a) Capacity-voltage profiles and (b) differential capacity representation of electrodes with graphite (black) and 15 wt% Si in graphite, with cutoff potentials at 0.0 V (blue) and 0.075 V (magenta). The graphite electrode was cycled at ∼C/120 rate, and the silicon-bearing electrode at ∼C/140 rate, in coin cells with a Li-metal counter electrode and 10 wt% FEC in the baseline electrolyte. The capacity data in (a) and differential capacity data in (b) are normalized to the graphite content in each electrode. The dashed lines mark plateaus and key features in the figure.
During lithiation of the Gr electrode distinct plateaus are observed at 0.21 V, 0.12 V, and 0.083 V (Figure 3a), which are seen as peaks in Figure 3b. The Si-Gr electrode lithiated to 0.075 V also contains these features, and additional capacity in broad features above 0.21 V and as a broad background to the graphite between 0.21 and 0.083 V (Figure 3b). An additional feature at 0.1 V, between the plateaus at 0.12 V and 0.083 V, arises from the lithiation of silicon that continues during the stage transitions in graphite. On delithiation the Gr electrode shows features at 0.096 V, 0.136 V, and 0.22 V; these features are also observed for the Si-Gr electrode. On lithiation down to 0.0 V, the Si-Gr electrode shows a feature at 0.053 V (blue curve, Figure 3), and another feature at approximately 0.4 V vs Li/Li+ in the subsequent delithiation cycle. These features are indicative of the crystalline Li15Si4 phase, which forms (at 0.053 V) during lithiation of amorphous α-LixSi and dissipates (at 0.4 V) on delithiation.34,35 The onset of the crystalline phase is believed to negatively impact the cycling behavior of Si electrodes,20 and limiting the capacity to avoid its formation has been suggested as a viable strategy to enhance cycle life.20 Note that the 0.4 V feature during delithiation does not appear when the lower cutoff potential is restricted to 0.075 V (magenta curve, Figure 3). However, the potential hysteresis is evident even without formation of the crystalline Li15Si4 phase. The difference in potential characteristics resulting from limiting the lower cutoff potential is known for Si electrodes, for example;34 it is simply presented here for completeness.
An important consideration when blending multiple active materials is the utilization of each material at different potentials, and the relationship between potential and electrode state-of-charge (SOC). Due to the large potential hysteresis of silicon (which is not present for graphite), and the shift of electrode capacity to higher potentials when silicon is utilized, it follows that during lithiation, much of the silicon capacity is accessed prior to graphite, i.e. >0.2 V. Below this potential both silicon and graphite (see plateaus) are active. Similarly, during the delithiation cycle, graphite is delithiated prior to silicon as the potential is increased. More notably, this is the case not only for the 0.075 V cutoff but also for the 0.0 V cutoff (magenta and blue curves in Figure 3); even with additional lithiation capacity arising from the silicon component below 0.053 V, lithium is extracted from the graphite first during the following delithiation. The large potential hysteresis of the silicon, with lithiation at <0.053 V and delithiation at ∼0.4 V for the Li15Si4 phase, means that at a given electrode potential below 0.4 V, one cannot discern state-of-charge (SOC) of the electrode components by simply monitoring the potential, without a knowledge of prior cycling conditions.
Initial electrochemical performance - RE cells
For capacity matching in full cells, the electrode loading and areal capacities (mAh cm−2) needs to be considered in addition to gravimetric capacities of the active materials. Our electrodes were designed to provide a surplus (initial) areal capacity at the negative electrode; the Si-Gr electrode delivers 2.5 mAh cm−2 in the 1.5–0.0 V voltage range, while the NCM523 electrode delivers 2.1 mAh cm−2 in the 3.0–4.5 voltage range. To determine the actual electrode capacity match after formation cycling, which causes electrode potential window shifts because of the SEI-forming side reactions, a three-electrode set-up was used. Figure 4 displays the positive and negative electrode potentials when the cell is cycled between different voltage limits; both the lower cutoff (2.5 V and 3.0 V) and the upper cutoff limits (4.1 V, 4.2 V, and 4.3 V) have been varied. The electrode potentials are monitored simultaneously with a Li-metal RE during the galvanostatic cycling while the cell voltage is varied. The experiments are conducted with low currents (<C/20) to reduce measurements errors introduced from RE placement, and whose absolute potential error depends on the size of the cycling current.25
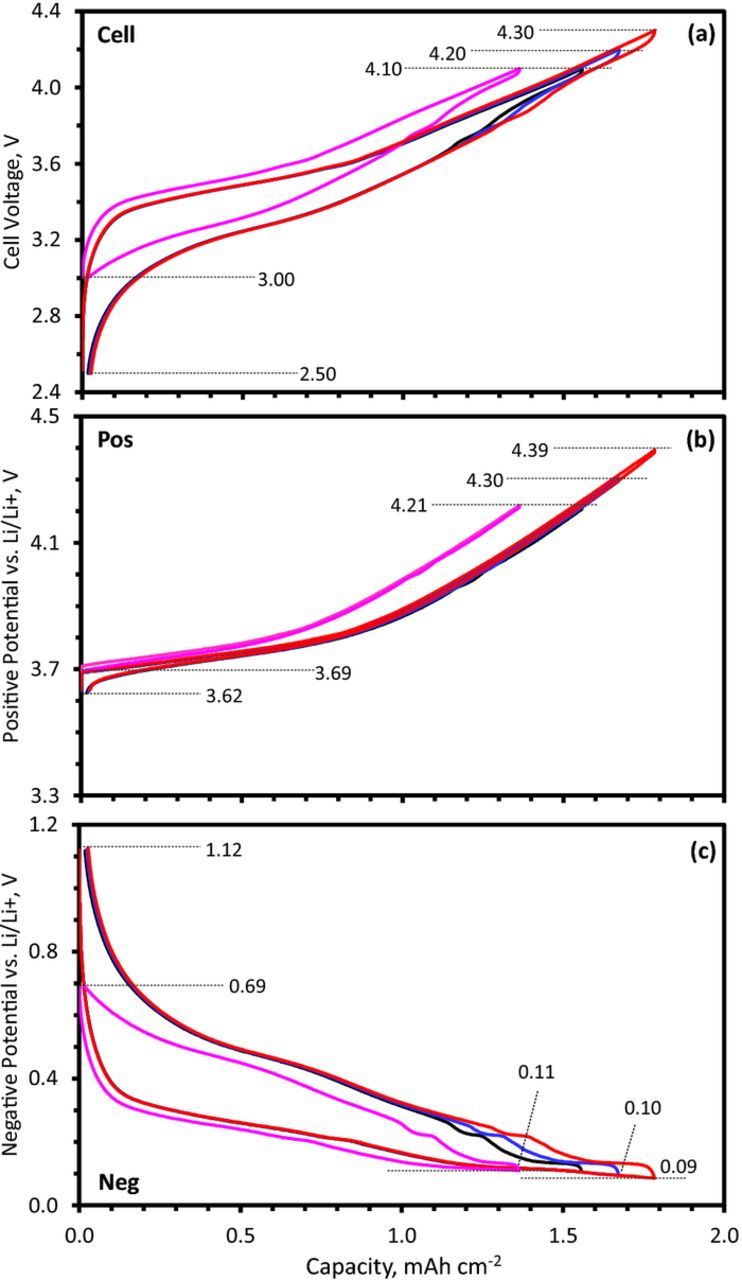
Figure 4. (a) Cell voltage, (b) positive electrode potential and (c) negative electrode potential obtained with a Li-metal reference electrode from a NCM523/SiGr cell with Gen2 + 10 wt% FEC electrolyte cycled in the 2.5–4.1 V (black), 2.5–4.2 V (blue), 2.5–4.3 V (red), and 3.0–4.1 V (magenta) ranges. The data were obtained with a 0.06 mA cm−2 current at 30°C, after the initial formation cycles.
In Figure 4 consider the cells cycled in the 2.5–4.1 V, 2.5–4.2 V and 2.5–4.3 V ranges. At the upper cutoff voltages (UCV) of 4.1, 4.2 and 4.3 V, the NCM523 electrode potentials (Figure 4b) are 4.21 V, 4.3 V and 4.39 V and the Si-Gr electrode potentials (Figure 4c) are 0.11 V, 0.10 V and 0.09 V vs. Li/Li+, respectively. In all cases, the Si-Gr electrode potential remains above 0.053 V; hence formation of the Li15Si4 crystalline phase is not expected, and accordingly not observed in the following cell discharge cycle (i.e., no 0.4 V plateau in Figure 4c). On discharge to 2.5 V, the NCM523 electrode potential is 3.62 V and the Si-Gr electrode potentials is 1.12 V, respectively. On discharge to 3.0 V the NCM523 electrode potential is 3.69 V, cell capacity is reduced by ∼10%, and the Si-Gr electrode potential reaches only 0.69 V. The likely consequences of these differing Si-Gr electrode potentials (1.12 V vs. 0.69 V) during full cell discharge will be discussed later. It is interesting to note that the potential profiles of the cell and electrodes are altered when the LCV is changed. This alteration is a consequence of the potential hysteresis inherent to the Si-Gr electrode and from the fact that the full cell voltage results from the difference between the positive and negative electrode potentials.
Initial electrochemical performance – impedance measurements in coin cells
The initial impedance (after formation cycling) as a function of cell voltage is shown in Figures 5 and 6 for full cells containing the Gen2 + 10 wt% FEC electrolyte. In Figure 5 the DC impedance data was obtained from 10 s 3C pulses during both charge and discharge cycles. Figure 5a contains data from charge pulses, during which Li+ ions are extracted from the positive and inserted into the negative electrode. Figure 5b contains data from discharge pulses, during which Li+ ions are extracted from the negative and inserted into the positive electrode.
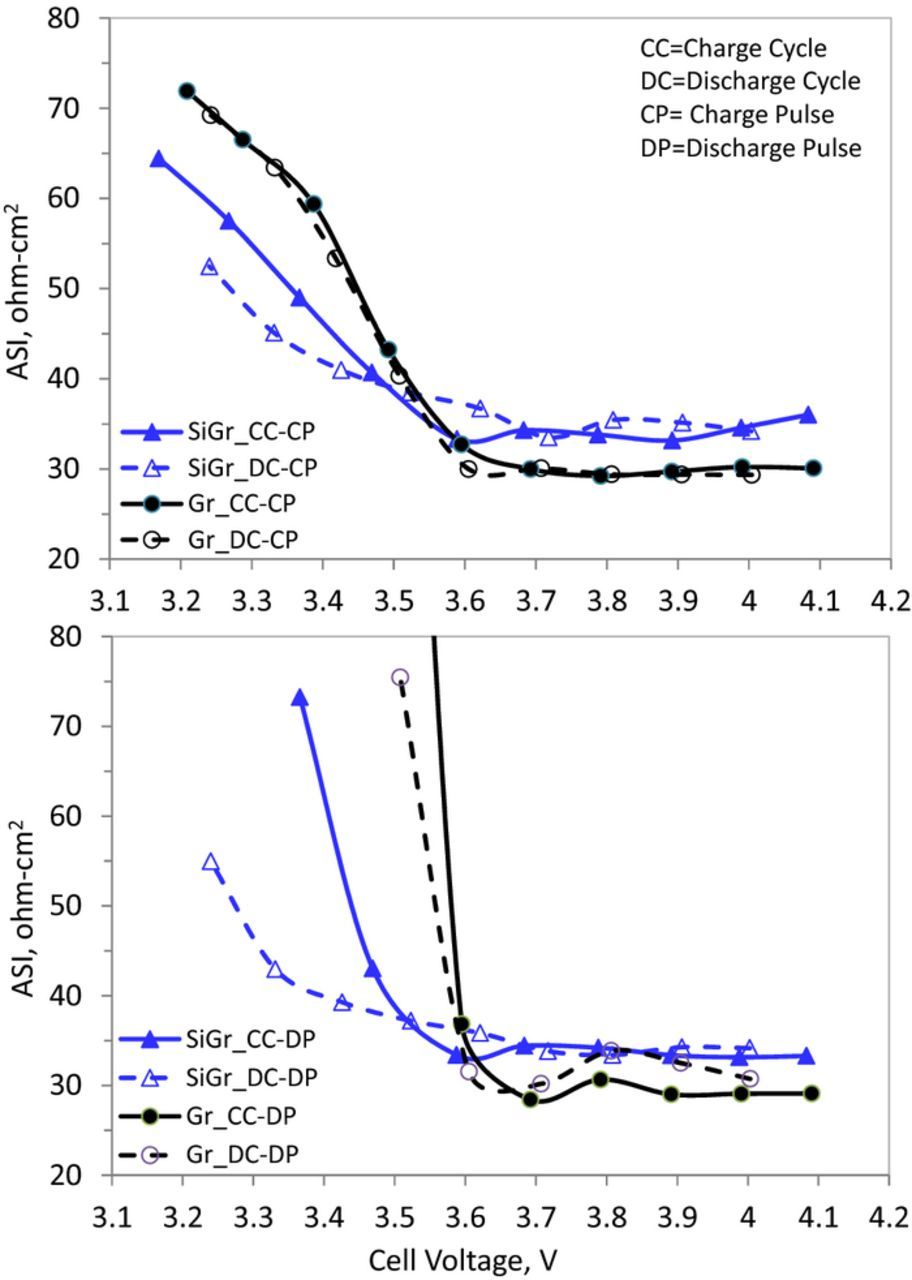
Figure 5. Area specific impedance (ASI) as a function of cell voltage for NCM523/Gr (Gr, black) and NCM523/SiGr (SiGr, blue) cells in the 2.5–4.1 V range. The data were obtained in the charge and discharge cycles with a 10s, 3C pulse, after the cells were charged to 3.2, 3.3, 3.4, 3.5, 3.6, 3.7, 3.8, 3.9, 4.0 and 4.1 V and allowed to rest (no current) for 1 h. During this rest period, the cell voltage decreases some during the charge cycle and increases some during the discharge cycle. The cells could not successfully sustain the 3C pulses beyond the data values shown.
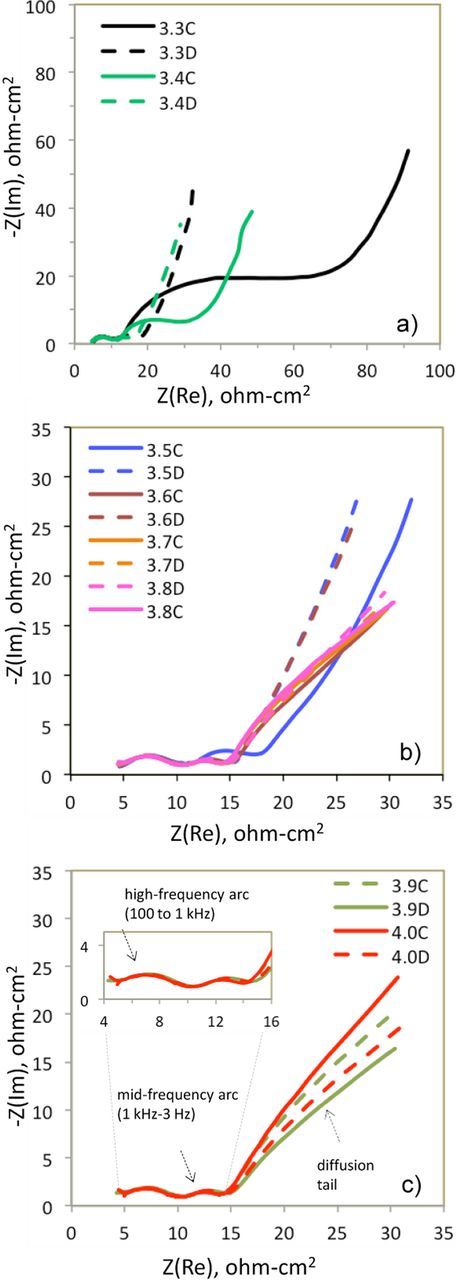
Figure 6. AC impedance data as a function of cell voltage for a NCM523/SiGr cell obtained during the charge (solid lines) and discharge (dashed lines) cycles. The data were obtained after 3h equilibration at (a) 3.3, 3.4 V; (b) 3.5, 3.6, 3.7, 3.8 V; (c) 3.9, 4.0 V. (c) also indicates the high-frequency arc (inset), mid-frequency arc and diffusion tail mentioned in the text. The data shown are in the 100 kHz – 0.01 Hz, and were obtained at 30°C with a 5 mV perturbation.
Data from a NCM523/Gr cell are compared with those obtained from a NCM523/Si-Gr cell; the addition of silicon induces hysteresis in the voltage profile, which results in impedance differences between the charge and discharge cycle at the same cell voltage. For example the charge-pulse impedance data for the NCM523/Gr cell (Figure 5a) are very similar during the full cell charge and discharge cycles. The area specific impedance (ASI) values are ∼29 Ω cm2 between 4.1 and 3.6 V, and then rise almost linearly to ∼70 Ω cm2 at around 3.2 V; the increase at low cell voltages reflects the difficulty of extracting Li+ ions from the relatively-full NCM523 oxide. The increases at the lower cell voltages is also seen for the NCM523/Si-Gr cell; however, this cell also shows bigger differences between the values during charge and discharge cycles resulting from the larger difference in electrode state-of-charge (SOC) at the lower cell voltages. The larger differences at low cell voltages for the NCM523/Si-Gr cell are also seen in Figure 5b, which contains impedance data from the discharge pulses.
The effect of voltage hysteresis is also seen when comparing AC impedance data at the same cell voltage for the charge or discharge cycles. In Figure 6, impedance spectra around the voltage loop are displayed, contrasting data from the charge and discharge cycles; for ease of comparison, the spectra are grouped to show low cell voltages (3.3, 3.4 V), intermediate cell voltages (3.5 V–3.8 V), and high cell voltages (3.9, 4.0 V) in Figures 6a, 6b, and 6c, respectively. Again, the largest difference in impedance between charge and discharge at a given voltage is seen at the lower cell voltages; for example, see the 3.3 V and 3.4 V data in Figure 6a. The difference arises because of the voltage hysteresis, as 3.3 V corresponds to a lower positive electrode SOC (higher Li content in oxide) during cell charge than at discharge.
A closer look at the AC impedance spectra reveals a high-frequency arc, a mid-frequency arc, and a diffusion tail. It is evident that the high-frequency arc is not affected by the cell voltage. The mid-frequency arc arises from NCM523 electrode; at these frequencies the Si-Gr electrode shows a minimum in the Nyquist representation.25 The higher mid-frequency impedance at 3.3 V (charge cycle) is a consequence of the higher Li content in the NCM523 oxide, because Li+ ion conductivity is lower for the fully-lithiated oxide compared to the partially-lithiated oxide (at higher potentials).36 As cell voltage is increased above 3.4 V (compare Figs. 6b to 6a) the overall difference in impedance between charge and discharge decreases for potentials 3.5–3.6 V; for 3.7–3.8 V there is only a small variation both between the voltages and between charge and discharge. The variation in the diffusion tail in the full cell spectra originates mostly from the Si-Gr electrode, which was previously shown to have small variations with SOC at high- and mid-frequencies, but a stronger dependency at low frequencies.25
Extended cycling performance – effect of electrolyte compositions
Full-cell data from NCM523/Si-Gr coin cells with different electrolyte compositions, cycled in the 2.5–4.1 V range, are presented in Figure 7. Note that the electrolytes can be grouped into three categories: Gen 2, Gen2 + 5 wt% additive (5 wt% VC, or 5 wt% FEC, or 2.5 + 2.5 wt% of VC and FEC), and Gen 2 + 10(or) 20 wt% (FEC or VC) additives. Figure 7a shows discharge capacity vs. cycle number of representative cells. The cell capacities are bunched together initially but then start diverging. The first cell to show faster capacity fade (around 15 cycles) is the one containing the Gen2 electrolyte; the cells containing the 5 wt% additives are the next to show accelerated fade (between 40 and 50 cycles). The cells with the 10 and 20 wt% additives show similar behavior up to the 100 cycles.
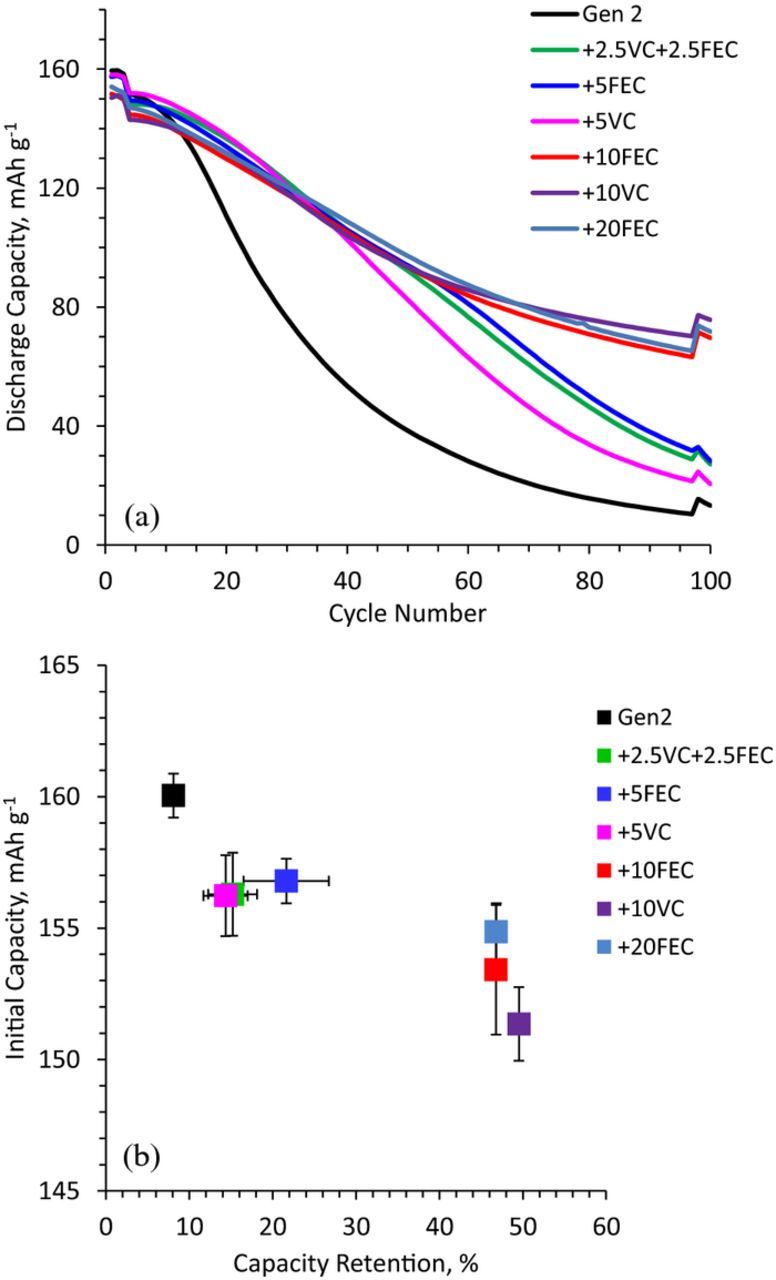
Figure 7. Effect of electrolyte composition on (a) discharge capacity over cycle life, and (b) first cycle discharge capacity correlated to capacity retention after 100 cycles. The data are from NCM523/SiGr cells cycled at 30°C in the 2.5–4.1 V range. The cycling protocol contained 3 initial ∼C/20 cycles, 94 ∼C/3 aging cycles and 3 final ∼C/20 cycles.
Another representation of the cycling data is shown in Figure 7b, which shows the initial discharge capacity (cycle 1) of cells plotted as a function of capacity retention (comparing cycles 3 and 100 capacities, obtained at low rates); the data point and error bars represent the average and 2 standard deviations (2σ) from 2–5 cells. Ideally, for each cell, the initial discharge capacity and capacity retention should be as high as possible. However, Figure 7b shows that the initial discharge capacity decreases when the additive content is increased. For example, the initial discharge capacity is lower (than that of the Gen2 cell) by ∼3 mAh g−1 at 5 wt% additive content, and ∼5–9 mAh g−1 at 10 and 20 wt% additive contents. Note that g (grams) refers to oxide content in the positive electrode, here and henceforth for full cell capacity (or current) data. The lower initial capacity suggests that Li+ ions are trapped in the SEI formation products and hence unavailable for further cycling. On the other hand, capacity retention is enhanced by the additives: the retention improves from 8% for Gen2 to ∼15–20% at 5 wt% additive content and further to ∼46–50% at 10 and 20 wt% additive contents.
Both Figures 7a and 7b suggest that cell capacity retention depends on additive content – higher the additive content, better the retention. However, capacity retention does not improve when the FEC content is increased from 10 to 20 wt%. This result may indicate that the 10% FEC is not depleted from the electrolyte during the 100 cycles; further cycling may deplete the FEC and accelerate capacity fade. This observation was made by Jung et al.37 for silicon-carbon electrodes cycled vs lithium metal, who noted that cell cycle life relates to the FEC content and that the capacity drops rapidly as the additive is consumed.26,37 Therefore, cycling differences between our 10 to 20 wt% FEC electrolytes could become prominent on extended cycling. If FEC is indeed consumed then even higher amounts could further delay capacity fade, though without fully suppressing the problems associated with side reactions at the dynamic silicon surface. Furthermore, for pure FEC, we noted a tendency toward the formation, aggregation, and phase separation of Li+ coordination polymers when the LiPF6 concentration exceeds ∼0.8 M in the electrolyte.38 However, we have shown previously that VC and FEC have other benefits; the compounds improve electrode cohesion thereby preventing loss and isolation of electrochemically active silicon in the composite electrode.25
A comparison of the 10 wt% VC and 10 wt% FEC data (Figure 7b) reveals a slightly better capacity retention for the VC-bearing cell. A similar result was observed during the cycling of NCM523/Si-Gr cells with an LiFSI-electrolyte containing either 10 wt% FEC or VC.18 This result may simply be a consequence of the difference in molecular weights; VC has lower molecular weight than FEC and hence will have a higher molarity in the electrolyte (see Table II). Alternatively, the better performance of VC could be related to the large amount of graphite in the Si-Gr electrode. In a study of pure silicon electrodes, VC induced no improvement in cycle performance while increasing amounts of FEC substantially reduced capacity fade.16 However, VC rather than FEC has been shown to improve capacity retention in graphite-containing cells.14,39
Extended cycling performance – effect of cycling windows
The effect of electrochemical cycling windows were examined in NCM523/Si-Gr coin cells containing the Gen2 + 10 wt% FEC electrolyte; the data are presented in Figure 8. Figure 8a shows the initial discharge capacity vs. capacity retention plot; the costs and gains of varying the cycling voltage limits are evident from this plot. For example, compare data for the 2.5–4.1, 2.8–4.1 and 3.0–4.1 V cycles. It is clear that the initial discharge capacity decreases from ∼154 mAh g−1 to ∼142 mAh g−1 when the LCV is increased from 2.5 V to 3.0 V; however, the capacity retention improves from 47% to 57%. That is, the narrower voltage window provides less capacity (smaller ΔSOC), but leads to improved capacity retention over the 100 cycles.
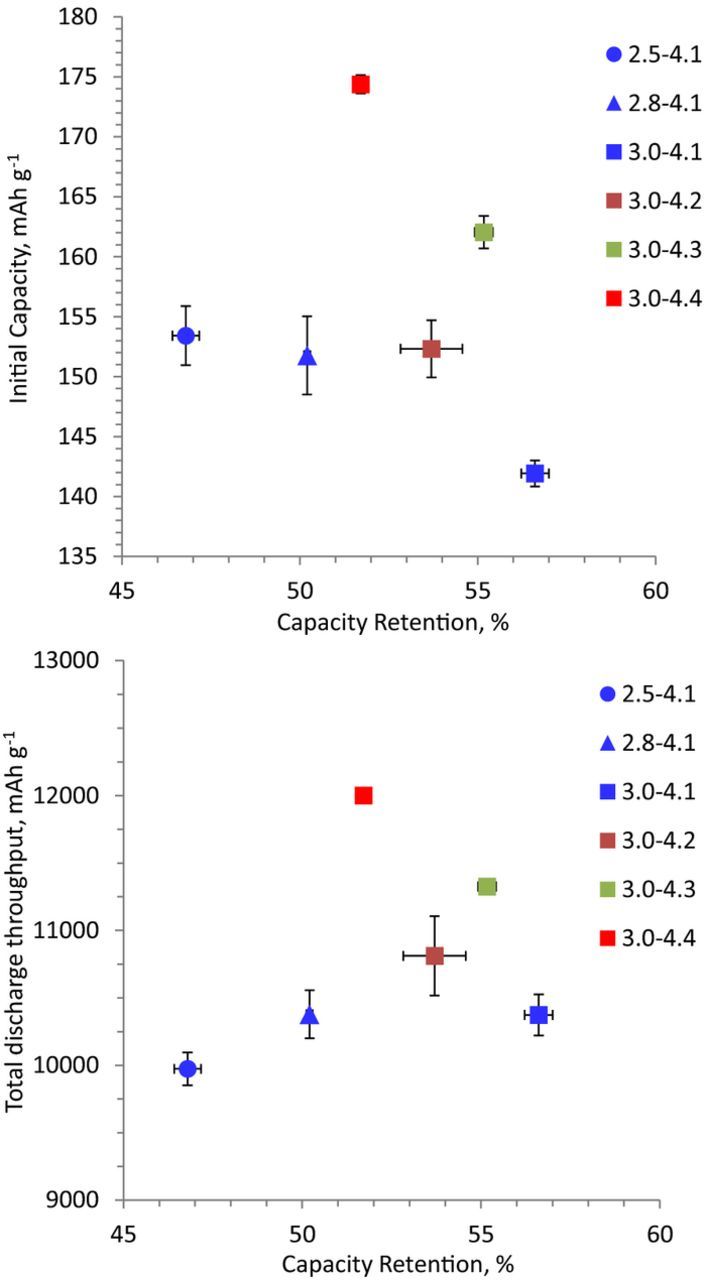
Figure 8. Effect of voltage window on (a) first cycle discharge capacity versus capacity retention after 100 cycles, and (b) total discharge capacity throughput over 100 cycles correlated to capacity retention after 100 cycles. The data are from NCM523/SiGr cells cycled at 30°C in the 2.5–4.1 V range. The cycling protocol contained 3 initial ∼C/20 cycles, 94 ∼C/3 aging cycles and 3 final ∼C/20 cycles.
On the other hand, cell capacity (and energy density) can be increased by raising the UCV. For example, compare data for the 3.0–4.1, 3.0–4.2, 3.0–4.3 and 3.0–4.4 V cycles in Figure 8a. The initial discharge capacity of the 3.0–4.2 V cell (∼152 mAh g−1) is similar to that of the 2.5–4.1 V cell. Raising the UCV further to 4.3 V and 4.4 V increases the capacity to ∼162 mAh g−1 to ∼174 mAh g−1, respectively; that is, a gain of 32 mAh g−1 is seen when the UCV is raised from 4.1 V to 4.4 V. The corresponding capacity retention values over the 100 cycles are ∼57%, ∼54%, ∼55%, and ∼52% for UCV's of 4.1, 4.2, 4.3 and 4.4 V, respectively. That is, the increased cycled capacity (wider ΔSOC) in the direction of higher cell voltages has less impact on capacity retention than a wider ΔSOC toward lower cell potentials.
As indicated above raising the UCV to 4.4 V has less impact on capacity retention than lowering the LCV to 2.5 V. Earlier, from the RE study (Initial electrochemical performance - RE cells section), we showed that lowering the full cell LCV from 3.0 V to 2.5 V raises the Si-Gr electrode potential from 0.69 V to 1.12 V. The consequences of this potential rise could include (i) enhanced fracture of the nanosilicon as the particles contract further during delithiation, and (ii) SEI decomposition at high Si-Gr electrode potentials, requiring lithium-consuming side-reactions during the following cycle to form a passivation layer, which increases cell capacity loss.
To further explore these possibilities we plot Figure 8b, which shows total discharge capacity throughput (summed over the 100 cycles) as a function of capacity retention. If particle fracture due to contraction/expansion is the dominant phenomenon then we would expect the cells with a lower discharge capacity throughput (less volume expansion/contraction) to have higher capacity retention. Figure 8b shows that the 2.5–4.1 V cells have a lower capacity throughput but also a lower capacity retention than the 3.0–4.1 V cells. That is, the lower volume expansion/contraction does not correlate to improved capacity retention. Furthermore, the likelihood of particle fracture, during delithiation (contraction) of our nanosize amorphous silicon (50–70 nm), is small due to the small particle size.40 Hence, we posit that SEI breakdown at high Si-Gr electrode potentials during cell discharge accelerates capacity loss; additional experiments are underway to confirm this hypothesis.
Summary and Concluding Remarks
In this article we have examined the electrochemical performance of cells containing NCM523 oxide, graphite, and graphite-15 wt% silicon based electrodes, which are of interest for developing high-energy lithium-ion batteries. The cells were evaluated in terms of initial cycling characteristics (in half- and full-cell configurations), initial impedance, and cycling performance with specific attention to electrolyte compositions and cycling (voltage) windows. The effect of voltage hysteresis on benchmarking performance measurements, such as pulse charge and discharge tests, are also explored.
The blending of silicon with graphite increases the average potential of the negative electrode; the electrode potential characteristics are a superposition of the Si and graphite materials. The addition of silicon also introduces a large potential hysteresis between the charge and discharge cycles, which is seen both in the presence and absence of the crystalline Li15Si4 phase. This voltage hysteresis affects the area ASI measurements, specifically at low cell voltages, leading to a large difference in measured impedance at a given voltage between charge and discharge.
Cycling of cells using various electrolyte compositions containing VC and FEC compounds shows that the additive amount has a significant effect on capacity retention. After 100 cycles, capacity retention increases from 8% for the Gen2 cell, up to 20% for cells with 5 wt% additives, and up to 50% for cells with 10 and 20 wt% additives. Our results suggest that depletion of additives in the electrolyte during extended cycling leads to rapid capacity decline. The data also indicate that cell capacity retention is slightly better for 10 wt% VC than for 10 wt% FEC addition; this result may be a consequence of the higher VC molarity in the electrolyte. Alternatively, the better performance of VC-cells could be related to the large amount of graphite, as VC is known to enhance cycle-life of cells with graphite electrodes.
Electrochemical performance and capacity retention was also examined in various cycling windows within the 2.5–4.4 V voltage range. We note that lowering the LCV from 3.0 V to 2.5 V increases the initial discharge capacity by 12 mAh g−1 but lowers cell capacity retention by 10%. The capacity reduction can be correlated to the relatively high potential (1.12 V vs. Li/Li+) experienced by the Si-Gr negative electrode during full cell discharge to 2.5 V. Raising the UCV from 4.1 to 4.4 V (keeping LCV at 3.0) increases the initial discharge capacity by 32 mAh g−1 but lowers cell capacity retention by only 5%. These results indicate that the cycling windows of NCM523/Si-Gr cells can be optimized to yield the required capacity and capacity retention values.
Impedance data after extended cycling, for the various cells examined, are not shown in this manuscript but the trends are very similar to those discussed in an earlier article.25 In brief, the impedance rise on cycling mainly arises at the positive electrode. The contribution of the Gr or Si-Gr negative electrode to the impedance rise is small. We also noted previously18 that it is difficult to obtain high-current pulse DC impedance data on the 100 cycle Gen2 electrolyte cell, because of its low capacity.
For vehicular applications lithium-ion cells need to retain at least 80% of their initial capacity after 1000 C/3 cycles. It is evident that the highest capacity retention of our NCM523/Si-Gr cells is only around 50% after 100 cycles. That is, significant increases in cell lifetimes are needed to enhance the commercial viability of cells with high silicon contents. Long cell lifetimes may be achieved through the use of alternative cell ingredients that include different active materials (silicon and/or graphite), advanced binders, and improved electrolyte systems; these alternatives are being pursued at Argonne and at various institutions around the world. Research is also underway to delineate mechanisms that cause the deterioration in cell performance; results from these experiments will be detailed in future articles on this subject.
Acknowledgments
M. K. acknowledges the generous grants from The Gålö Foundation and The Royal Swedish Academy of Engineering Sciences (IVA) that enabled her research at Argonne National Laboratory. The work was also supported by the Office of Vehicle Technologies at the U. S. Department of Energy; we are especially grateful to Peter Faguy and Dave Howell for their programmatic support. The electrodes and cells used in this article were fabricated at Argonne's Cell Analysis, Modeling and Prototyping (CAMP) Facility; we are grateful to A. Jansen and B. Polzin for their inputs to this work. The electrolytes were prepared at Argonne's Materials Engineering Research Facility (MERF); we are grateful to G. Krumdick and T. Dzwiniel for their support. Both the CAMP and MERF facilities are supported within the core funding of the Applied Battery Research (ABR) for Transportation Program. We acknowledge our many colleagues at Argonne and elsewhere for their assistance during the course of this study.
This manuscript has been created by UChicago Argonne, LLC, Operator of Argonne National Laboratory ("Argonne"). Argonne, a U. S. Department of Energy Office of Science laboratory, is operated under Contract No. DE-AC02-06CH11357. The U. S. Government retains for itself, and others acting on its behalf, a paid-up nonexclusive, irrevocable worldwide license in said article to reproduce, prepare derivative works, distribute copies to the public, and perform publicly and display publicly, by or on behalf of the Government.