Abstract
The field of enzymatic biosensors applied to brain electrochemistry has rapidly expanded over the last few years, thanks in part to their excellent selectivity to specific target species. Much current research is therefore focused on enhancing the electrochemical signal, which often involves the detection of stoichiometric amounts of H2O2 formed as part of the enzyme mechanism. This opens the possibility of enhancing a biosensor's performance by facilitating the H2O2 oxidation signal through surface modification. Here, we investigate the impact of the roughness of the platinum surface on the biosensor response, where rougher platinum surfaces show greater activity for H2O2 oxidation, and therefore enhanced biosensor sensitivity. Through careful manipulation of the electrode surface roughness, we are able to show a significant improvement to the LOD when using a rougher electrode surface. Additionally, we have shown that this enhanced surface roughness has no detrimental effects toward the electrode response time. This suggests that surface roughness could be a simple and easy to implement means of enhancing the sensitivity of electrode-based enzymatic biosensors, and is an important factor to consider when studying other aspects of biosensor fabrication.
Export citation and abstract BibTeX RIS

This is an open access article distributed under the terms of the Creative Commons Attribution 4.0 License (CC BY, http://creativecommons.org/licenses/by/4.0/), which permits unrestricted reuse of the work in any medium, provided the original work is properly cited.
Biosensor research has experienced a significant growth in recent years, thanks to the application of biosensors to a wide range of fields, such as medical,1–4 food safety5–7 and environmental detection.8,9 The functionality of biosensors is based around the conversion of a biological response, usually a binding event, into an electrical signal. This gives biosensors an inherently high selectivity, as target sites at the sensor/analyte interface can be specifically chosen to preferentially bind to the target molecule.10
In the case of enzymatic biosensors, the binding event is between the target molecule and the active site. The electrical signal then produced either from the consumption or generation of electroactive species in stoichiometric amounts. Generation type assemblies have been built with enzymes such as l-lactate oxidase (l-LOD) and d-amino acid oxidase (DAAO), which generate stoichiometric amounts of H2O2 on reaction with l-lactate11 and d-serine,12 respectively, which can be easily oxidized at an electrode (Scheme 1A). Other enzymes such as lactate dehydrogenase (LDH) function in the presence of a coenzyme such as NAD+ or NADP+, which acts as a mediator, carrying electrons between the electrode and the enzyme (Scheme 1B). The associated redox signal from the nicotinamide cofactor therefore provides information regarding the activity of the enzyme.11
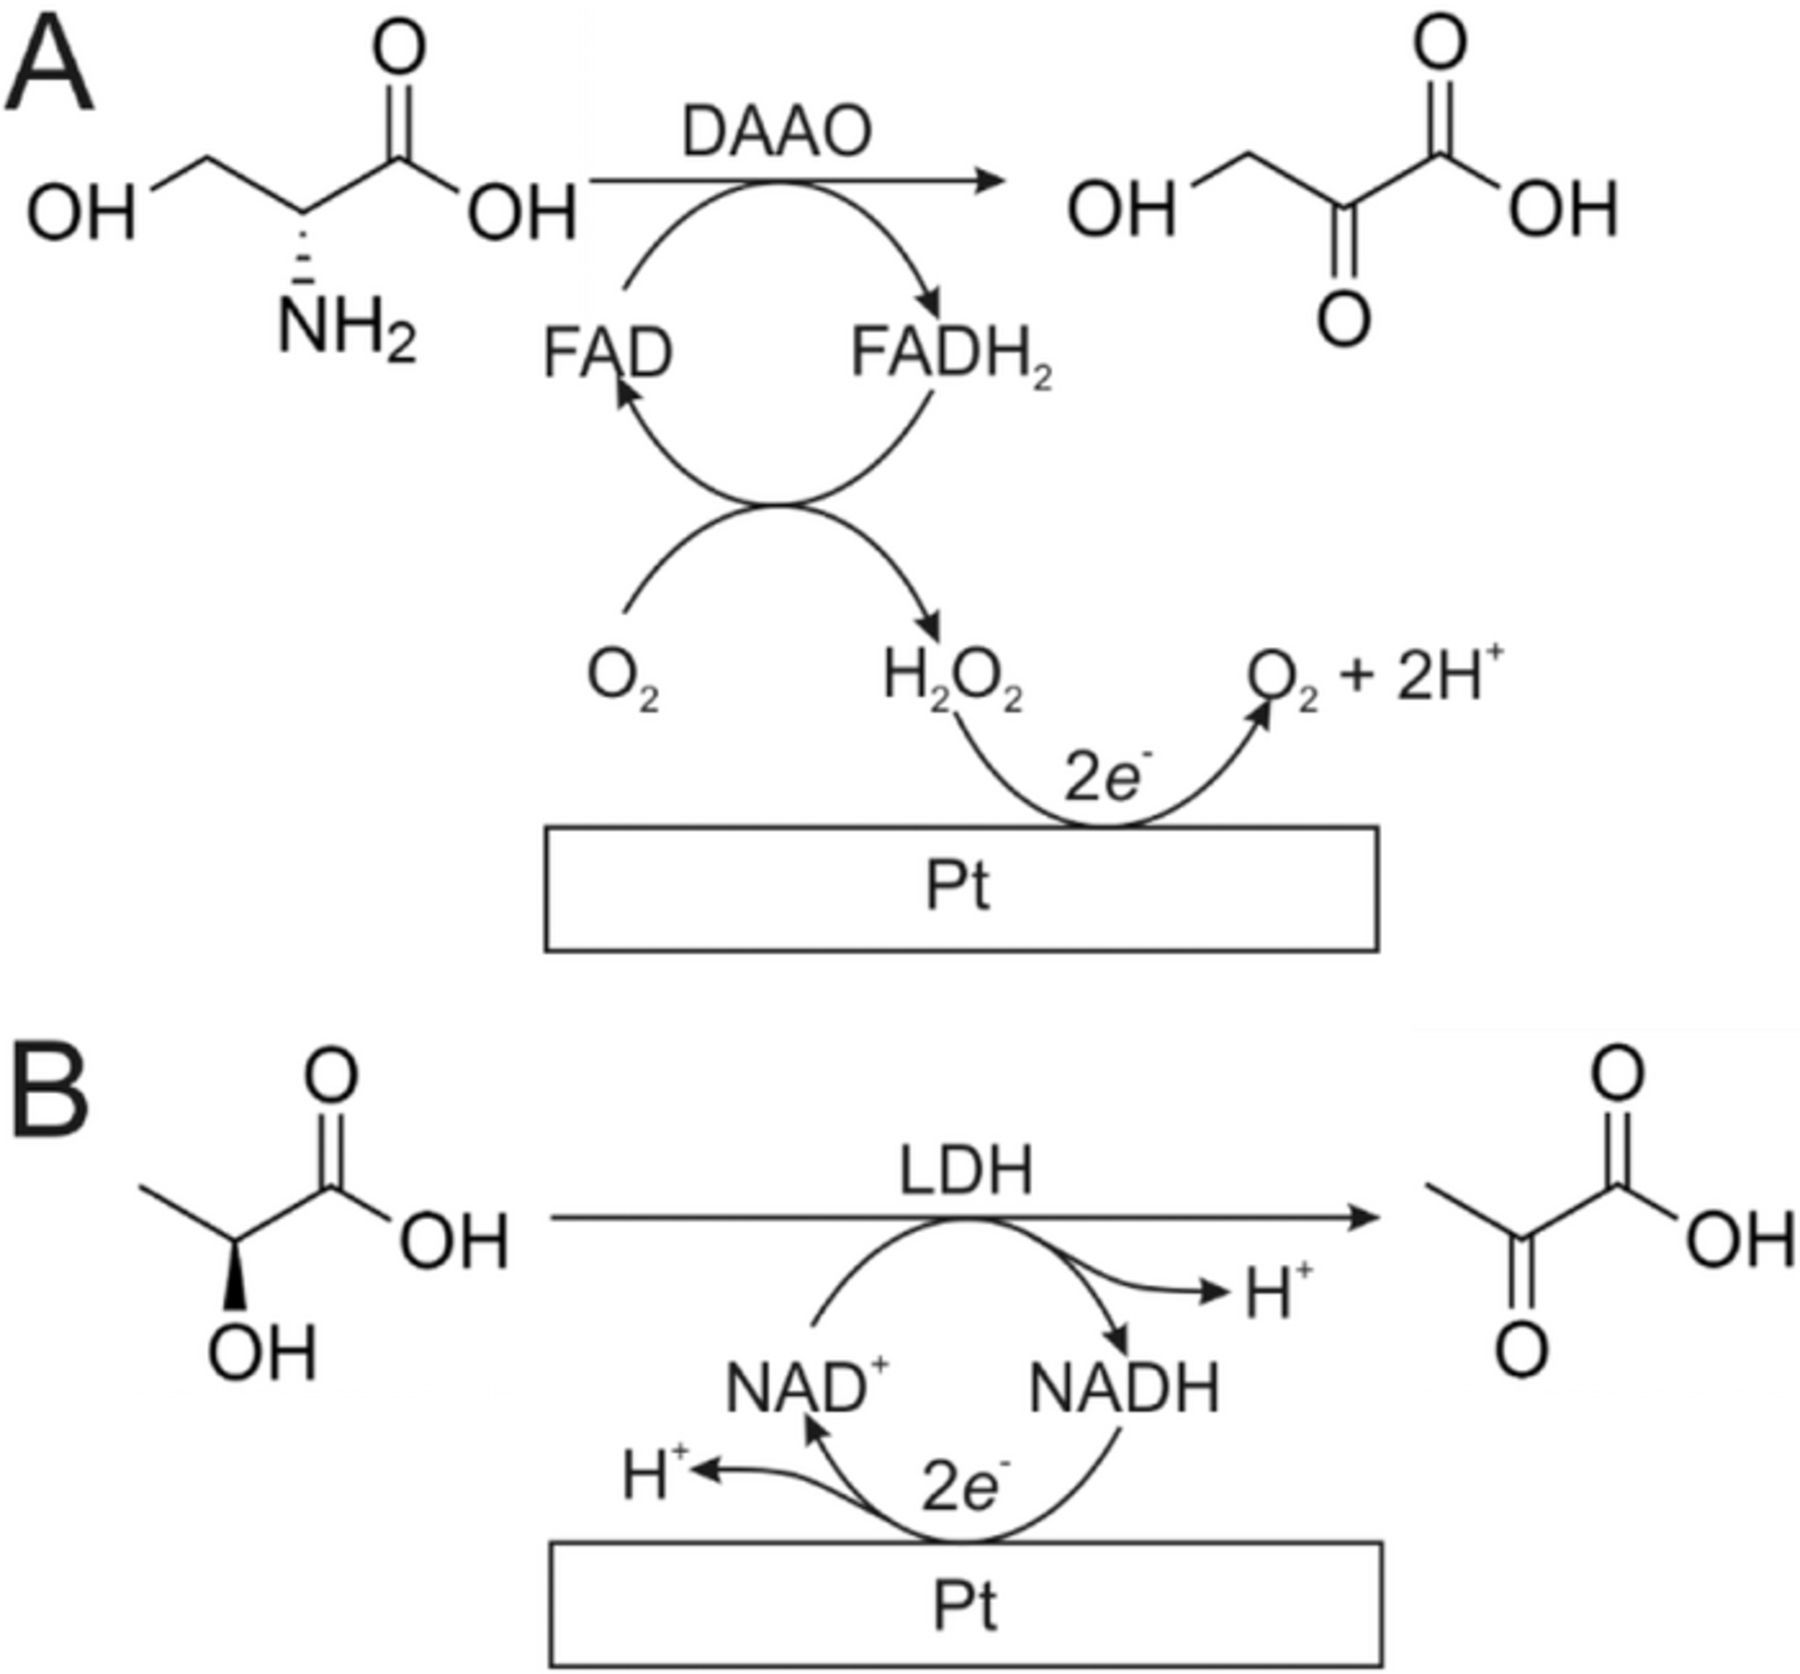
Scheme 1. Enzymatic degradation of A) d-serine using DAAO, and subsequent detection of H2O2 at a platinum electrode and B) l-lactate using LDH, and subsequent electrochemical detection of NADH at a platinum electrode.
The desire to detect d-serine stems from its action as an endogenous co-agonist for N-methyl-d-aspartate receptors (NMDAR) at synapses in the brain.13,14 These receptors function through concurrent binding of the neurotransmitter glutamate along with either glycine or d-serine at the glycine binding site.15 With such a key role in the function of synapses, it is perhaps not surprising that variance is d-serine concentrations within the brain have been associated with psychiatric conditions such as schizophrenia and depression,16,17 neurodegenerative disorders including Huntington's disease18 and amyotrophic lateral sclerosis (ALS).19,20 Despite this, the mechanism of release of d-serine from astrocytes has not yet been conclusively identified,1 which represents a substantial knowledge gap in identifying the role of d-serine in these conditions.
The detection of variances in d-serine concentration between patients with these conditions and healthy controls is only possible with highly precise methodologies, requiring micromolar resolution; mean differences between patients with an without schizophrenia was only 22.4 μmol L−1.17 Current methods of d-serine detection are mostly focused on local sampling by microdialysis,21,22 high performance liquid chromatography (HPLC)23,24 or fluorescence based capillary electrophoresis (CE).25,26 Although these methods offer excellent detection limits, significant improvements in spatial and temporal resolution can be achieved by moving to enzymatic biosensors.4,27 By reducing the active size of the probe to a few micrometers in diameter, it is possible to get resolution on the cellular level,2,28 although reducing the active area of the probe comes with a corresponding loss of signal, which may have a negative impact on the probe's limit of detection (LOD). In order to bring the functionality of enzymatic sensors up to the detection limits of HPLC and CE, changes must be made to maximize the detection signal recorded, whilst maintaining a low background. One way to do this is to focus on enhancing the electrochemical signal recorded at the electrode surface.
For oxidase based biosensors, the electrochemical signal comes from the oxidation of H2O2. This is a highly surface dependent process due to the need for H2O2 to strongly adsorb onto the electrode surface before the electron transfer can take place.29,30 If this binding is not favorable, it is possible for signal to be lost from the biosensor: weak binding would result in the diffusion of H2O2 into bulk solution, rather than toward the electrode surface, whilst strong binding results in the product not being released, which poisons the electrode surface.31 Just as the fuel cell community are able to design oxygen reduction catalysts based on the interactions between H2O2 and the surface to maximize the catalytic efficiency,32–34 it is possible to maximize an enzymatic biosensor's response by tuning the electrode surface to favor H2O2 oxidation. It's therefore not surprising that a significant amount of biosensor literature involves the generation of complex electrode surface structures, such as the use of platinum or gold nanoparticles,35,36 carbon nanotubes,37,38 metal nanowires,39 or metal oxides,40,41 to name just a few. However, increasing the electrochemical signal from H2O2 oxidation does not necessarily require the use of expensive nanostructures. The binding of H2O2 to the electrode can be enhanced through the artificial roughening of the metal surface. This has previously been achieved through the electrochemical deposition of aqueous platinum onto platinum working electrodes, to give high surface area platinized platinum electrodes.42–47 This increases the electrode surface area, providing additional binding sites, as well as providing a greater number of step and edge sites, which provide kinetically faster rates of H2O2 redox relative to the smooth crystal faces.48–52
In this work, we look into the impact of roughening the surface of a platinum microelectrode through a simple polishing procedure before using it as a DAAO enzymatic biosensor for the detection of d-serine. By making a series of biosensors with varying platinum roughness under the enzyme layer, we aim to optimize the platinum roughness in order to enhance the electrochemical response to H2O2 whilst maintaining the characteristic low background signal recorded at a microelectrode. The surface condition providing the best compromise between high signal and low background will provide the lowest LOD and therefore the greatest sensitivity. The design of this higher sensitivity microelectrode probe will allow us to advance the development of enzymatic biosensors toward the sensitivities required for detecting variances in d-serine on the order of those currently detected by HPLC and EC, but with the added benefit of spatial and temporal resolution. Additionally, we need to simultaneously measure the response time of our fabricated biosensor, to ensure that the roughened surface does not significantly increase the response time due to the extra charging current that results from a larger electrochemically active surface area.53 Through this, we aim to propose an optimum surface roughness for electrochemical biosensors in order to maximize both sensitivity and response time without expensive surface modifications.
Experimental
Chemicals
All experiments in this work were performed using d-serine (98%, Sigma Aldrich), hydrogen peroxide (30% w/w Sigma Aldrich), sulfuric acid (95-98%, Sigma Aldrich), m-phenylene diamine (99%, Fisher), sodium chloride (99%, Sigma Aldrich), potassium chloride (99%, Sigma Aldrich), sodium phosphate dibasic (99%, Sigma Aldrich), potassium phosphate monobasic (99% Sigma Aldrich), ferrocene methanol (97%, Sigma Aldrich), glutaraldehyde solution (50% v/v in H2O, Fisher), argon (99.5-100%, Praxair) and deionized water (18.2 MΩ cm, Millipore).
Enzyme preparation
Recombinant Rhodotorula gracilis DAAO was overexpressed in Escherichia coli cells and purified to homogeneity as previously reported.54 The final enzyme solution was concentrated to 50 mg mL−1 protein in 0.01 M phosphate-buffered saline (PBS, pH 7.4) containing 1% glycerol and 25 mg mL−1 bovine serum albumin; pure DAAO had a specific activity of 75 ± 7 U mg−1 protein on d-serine as substrate based on amperometric assay.14
Microelectrode preparation
All biosensors were constructed using a platinum microelectrode as the main structure. These were fabricated based on a previously established procedure.55 Briefly, a soda-lime glass capillary was pulled and a Pt wire (25 μm diameter) was inserted into the capillary. The assembly was then sealed under vacuum and then electrically connected to a gold pin via a copper wire using silver epoxy. The microelectrode tip was polished using a TegraPol-25 polishing wheel (Struers, Canada) using 1200 grit SiC foils (Struers) until a flat surface was achieved. This was verified by optical microscopy using a customized Axio Vert.A1 inverted microscope (Zeiss, Oberkochen, Germany). The electrode tip was then further polished until the desired surface roughness was achieved using 320, 500 and 1200 grit SiC foils (Stuers) and 1 and 0.3 μm Al2O3 lapping films (3 M). For all samples, the rotation speed was 1700 rpm and downward pressure was kept consistent by lowering the electrode with a micropositioner until a quiet scratch against the paper was heard.
Determination of Pt surface roughness
The roughness factor (Rf) of the platinum electrodes was calculated using an established procedure.33,34,56 Briefly, the electroactive area (Aechem) was found from the area under the hydride adsorption region of a 20 mV s−1 CV, recorded in degassed 1 M H2SO4.
![Equation ([1])](https://content.cld.iop.org/journals/1945-7111/165/12/G3074/revision1/d0001.gif)
where 0.77 is the number of monolayers of hydride adsorbed in this region, and 210 μC cm−2 corresponds to the charge associated with one complete monolayer of adsorbed hydride. Rf is then simply defined as
![Equation ([2])](https://content.cld.iop.org/journals/1945-7111/165/12/G3074/revision1/d0002.gif)
where a is the radius of the electroactive area. The factor of 0.77 is necessary due to the potential dependence of hydrogen adsorption and evolution in this potential region. When sweeping to more positive potentials than 0.02 V vs. RHE, there is less than a monolayer of hydrogen adsorbed, but at the more negative potentials the evolution of gaseous hydrogen contributes to the current. 0.77 monolayers is therefore used as a known number of monolayers over the given potential range to give the optimum precision of this method.
To aid in our presentation of the varying surface roughnesses achieved, non-contact profilometry images are provided in the supplementary information (Figures S3–S9), which were recorded using a white light interferometric profiler (Zygo Nexview) at 100x magnification.
Biosensor fabrication
A permselective poly-m-phenylene diamine (PPD) polymer layer was electrodeposited onto the electrode surface by immersing the electrode tip in a solution of 100 mM m-phenylene diamine in 0.01 M phosphate-buffered saline (PBS, pH 7.4) and sweeping the potential 5 times between 0 and 1 V vs. Ag/AgCl at 100 mV s−1, as was optimized in previous works.1,2 The PPD-modified microelectrode was then immersed in 0.5 mL DAAO solution for 5 s and then removed and allowed to dry for 5 min. This was repeated five times to adsorb a small quantity of the enzyme at the electrode tip. The polymer and enzyme layers were crosslinked by placing the biosensor assembly inside a sealed glass chamber containing 10 mL of a glutaraldehyde solution (50% v/v in H2O) as a source of vapor. In order to use the same electrode for another biosensor, the electrode tip was immersed in bleach for 30 mins to remove the enzyme, before being well rinsed with distilled water, and then polished to reveal the platinum electrode surface.
Electrochemical measurements
All electrochemical measurements were recorded using an Electrochemical Probe Scanner 3 (Heka Elektronik, Lambrecht, Germany). Potentials in chloride based solutions were recorded against a Ag/AgCl reference electrode, which was fabricated in house by chloridizing a silver wire. Potentials in sulfate based solutions were recorded against a commercial saturated mercury - mercurous sulfate (SMSE) reference electrode (CH Instruments, USA). All data were analyzed using Python 2.7 and then exported into Origin 9.1 for figure fabrication.
Results and Discussion
All data presented here were collected using a biosensor fabricated according to a standardized procedure, where the biosensor is built upon a 25 μm diameter platinum microelectrode with a size exclusion polymer layer and DAAO enzyme layer. A schematic diagram of the fabricated biosensor is given in Figure 1. The size exclusion polymer layer functions as a physical barrier to other electroactive species that may be present in real biological samples, while allowing H2O2 to diffuse through to reach the electrode surface. This is not necessary for these experiments, however as the final functional biosensor should include this layer, it has been included in this work. The benefits and refinement of the size exclusion polymer layer have been described in previous works and so shall not be discussed here.1,2
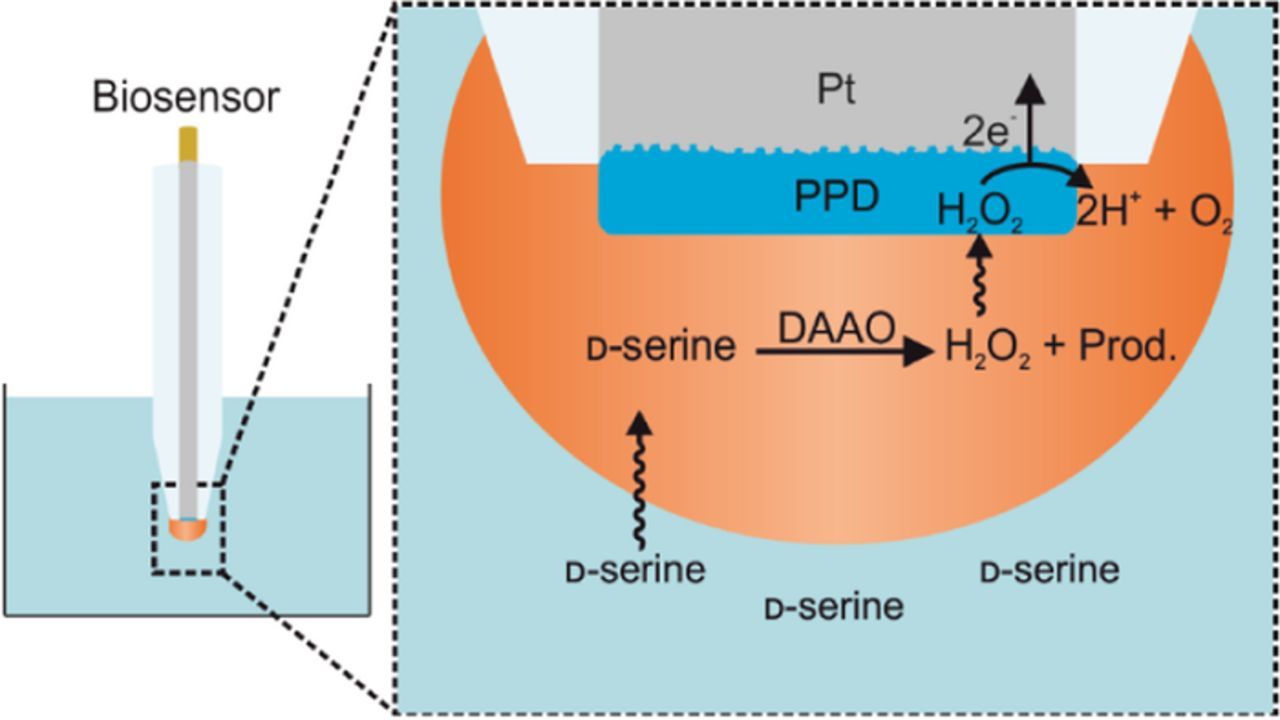
Figure 1. Diagram of the fully fabricated biosensor. Inset focuses on the tip of the biosensor, showing the enzyme layer (orange), size exclusion polymer layer (blue) and platinum surface of the microelectrode (gray). The displayed roughness of the platinum surface shall be manipulated through the electrode polishing regime.
Varying surface roughness was achieved through varying polishing regimes. The exact same microelectrode has been used in all experiments in order to minimize any competing effects, such as the exact radius of the electroactive area, or the absolute geometry of the biosensor tip. To minimize the impact of polishing on the overall tip size, experiments started with the smoothest electrode surface, moving to rougher surfaces with only short periods polishing, in order to roughen the surface whilst removing minimal material from the electrode. After polishing, the roughness of the electrode surface was checked using cyclic voltammetry in 1 M H2SO4 using the charge under the hydrogen adsorption peaks, where the integral between peaks has been shown to give 0.77 monolayers of adsorbed hydrogen, and the charge from a complete monolayer is 210 μC cm−2.56 The surface is then characterized by the roughness factor (Rf), which is defined as the ratio of electroactive area to geometric area, so that a larger Rf corresponds to a rougher electrode surface. All used roughness values and their associated polishing conditions are given in Table 1.
Table I. Polishing steps used in this work, showing the used polishing material, polishing time (tpol), resultant charge (Q), electroactive area (Aechem) and roughness factor (Rf).
| Polishing Material | tpol/s | Q/nC | Aechem/cm2 | Rf |
|---|---|---|---|---|
| 320 SiC | 120 | 21.6 | 7.9 × 10⁻⁵ | 16.1 |
| 320 SiC | 30 | 18.3 | 6.7 × 10⁻⁵ | 13.7 |
| 500 SiC | 30 | 14.7 | 5.4 × 10⁻⁵ | 11.0 |
| 1200 SiC | 30 | 9.8 | 3.6 × 10⁻⁵ | 7.3 |
| 1 μm Al2O3 | 30 | 7.8 | 2.8 × 10⁻⁵ | 5.8 |
| 0.3 μm Al2O3 | 30 | 6.0 | 2.2 × 10⁻⁵ | 4.5 |
The polished electrode was then used to fabricate a biosensor, where the electrode surface was electrodeposited with the size exclusion polymer layer, layered with the enzyme, and cross linked with glutaraldehyde vapor. A complete methodology is given in the Experimental section Enzyme preparation.
After fabrication, the biosensor was equilibrated for 1 hour in PBS solution, and then biased at the working potential (0.5 V vs. Ag/AgCl) for a further hour before any experiments were performed. Whilst this extended use gave an overall reduction in electrochemical signal compared to a biosensor used immediately after fabrication, this pre-conditioning step has been found to greatly improve the reproducibility of the electrochemical signal when comparing separately recorded data sets using the same electrode. The electrochemical response was measured using the dipping method,2 where the microelectrode was biased at 0.5 V vs. Ag/AgCl and was then repeatedly immersed into a solution containing a known concentration of d-serine. These successive dips were performed using the z axis motor of the SECM stage, with the total distance moved being 300 μm. This allowed for a series of chronoamperograms to be sequentially recorded in the same working solution with minimal rest time between repetitions, and no change in the potential at the electrode surface. This potential was chosen as a compromise between achieving a mass transport limited current without further enhancing the oxidation of the platinum electrode surface, which would provide an extra source of current and occurs in the same potential region, and can affect the kinetics of H2O2 oxidation.33,57 The mass transport limited current was then taken as the mean of the plateaued region of the current response.
Calibration curves for biosensors with varying Rf
Calibration curves were constructed for d-serine detection at biosensors with varying Rf (Figure 2). All data sets were recorded using the same electrode, which had been exposed to a varied polishing regime. In all cases, the electrode was immersed nine times so that a mean and standard deviation could be determined.
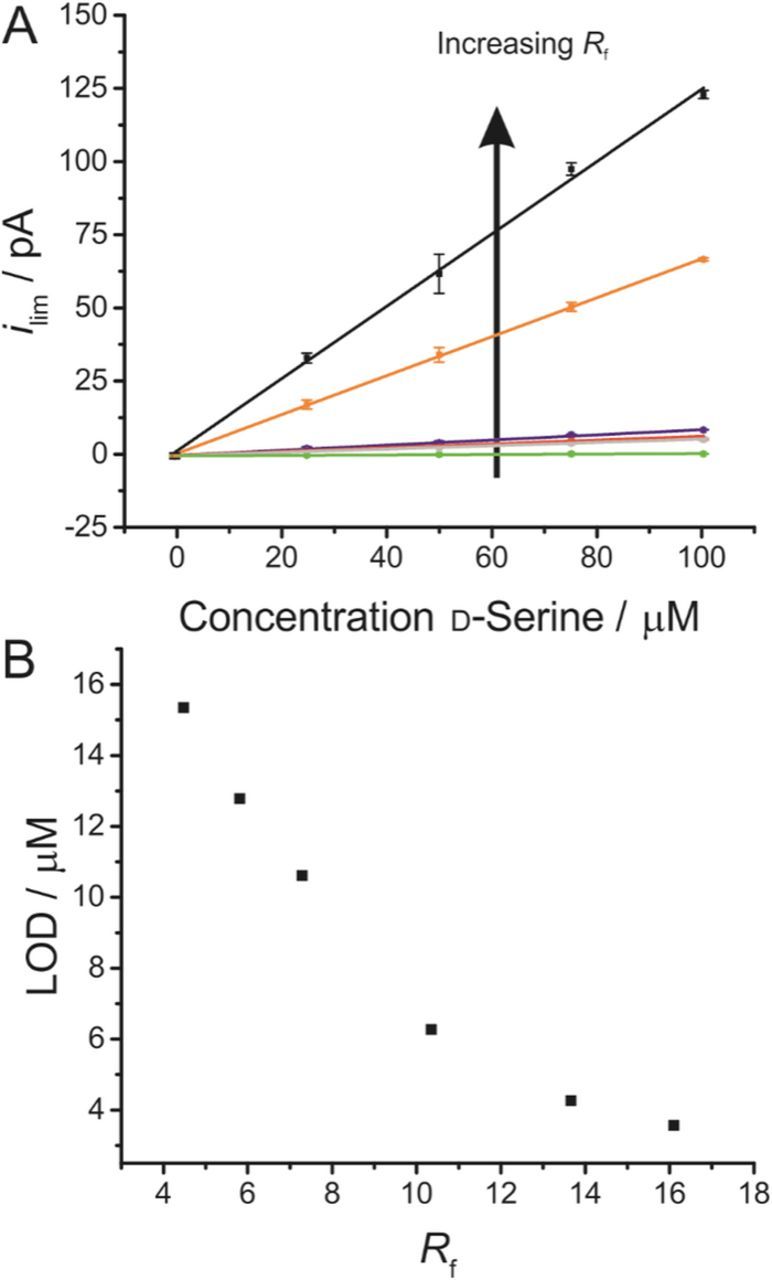
Figure 2. A) Recorded mass transport limited currents (ilim) at DAAO d-serine biosensors with varying Rf for different concentrations of d-serine. All biosensors were fabricated starting from the same microelectrode, using the same thickness of size exclusion polymer layer and enzyme deposition technique. Biosensors were fabricated from electrodes where Rf was 4.5 (green), 5.8 (gray), 7.3 (red), 10.3 (blue), 13.6 (orange) and 16.1 (black). Error bars represent the 95% confidence interval (n = 9). Oxidation currents are presented as blank corrected currents. B) Calculated LOD for each roughness biosensor, taking LOD as three times the standard deviation of the blank, divided by the gradient of the calibration curve in A.
The clear increase in the slope of the calibration curves as Rf increases highlights the significant surface dependence of the H2O2 oxidation mechanism. The limit of detection (LOD) is defined as three times the standard deviation of the blank divided by the slope of the regression line, so a steeper calibration slop will result in a lower LOD. Rf therefore has a direct impact on the sensitivity of the biosensor, with the LOD being reduced from 15.3 μM to 3.7 μM for biosensors as Rf was increased from 4.5 to 16.1. Of course, these LODs are relatively high compared to a number of existing biosensors, including ones previously fabricated in this lab.1,2 As previously mentioned, this is due to the fabrication methodology being designed to favor reproducibility across multiple fabrications rather than sensitivity. Importantly, the benefits of the steeper slope for the calibration curve outweigh any potential negative impacts of the increased roughness, such as the impact of charging currents or electrode fouling, suggesting the surface roughening may be a simple and practical means of enhancing the electrochemical signal of an enzymatic biosensor.
Of course, since the reduction of LOD is achieved through favoring H2O2 kinetics, this same effect could have been achieved by constructing a calibration curves for varying concentrations of H2O2 in solution at a platinum microelectrode without the need for biosensor fabrication. However, by showing this clear reduction in LOD with the fully functioning biosensor where all other parameters are kept the same, we are able to demonstrate that surface roughening has a sufficiently positive impact to be observed in a system that is also dependent on enzyme kinetics and the diffusion of d-serine through the enzyme drop.
Response time for biosensors with varying Rf
As well as the magnitude of the electrochemical signal, and subsequently the LOD, another key parameter for enzymatic biosensors is the response time (tres), defined as the time taken to reach 90% of the maximum biosensor response when in contact with the analyte.58 Since the enzyme used has been shown to have an excellent turnover rate (turnover number kcat = 350 s−1)12,59 and H2O2 oxidation is known to be sluggish,29,60 the slowest single step in the biosensor's function is likely to be the oxidation of H2O2 at the electrode surface. The key factor in determining tres will therefore be the oxidation of H2O2. Although the analyte is d-serine, the key factor in determining tres will be the oxidation of H2O2, as this is the reaction that will be occurring at the electrode surface. Before encouraging the roughening of platinum surface for use in enzymatic biosensors, it is important to ensure that electrodes with higher Rf do not experience a significant increase in tres that may render them unsuitable for practical applications.
It can be seen from Figure 3 that an increase in Rf does not have a negative impact on tres. In fact, an improvement in tres is seen when increasing Rf from 4.5 to 16.1, an observation which is seen both for a platinum microelectrode oxidizing H2O2 and for the full biosensor detecting d-serine. The increase in tres between the bare and polymerized electrode surface can likely be explained by the hindering of H2O2 diffusion to the electrode surface by the size exclusion polymer layer. Values of tres for polymerized platinum electrode seem to closely mirror tres for the full biosensor, which validates our assumption that it is the reaction at the electrode surface, rather than reactions or diffusion within the enzyme layer, that determine the absolute value for tres of the biosensor. The linear fits shown in Figure 3 are intended to highlight the overall downward trend in tres with increasing Rf, although the trends for all data sets are not precisely linear. This likely comes from subtle differences in the amount of enzyme attached to the biosensor that are inevitable when hand-making biosensors across multiple experiments.
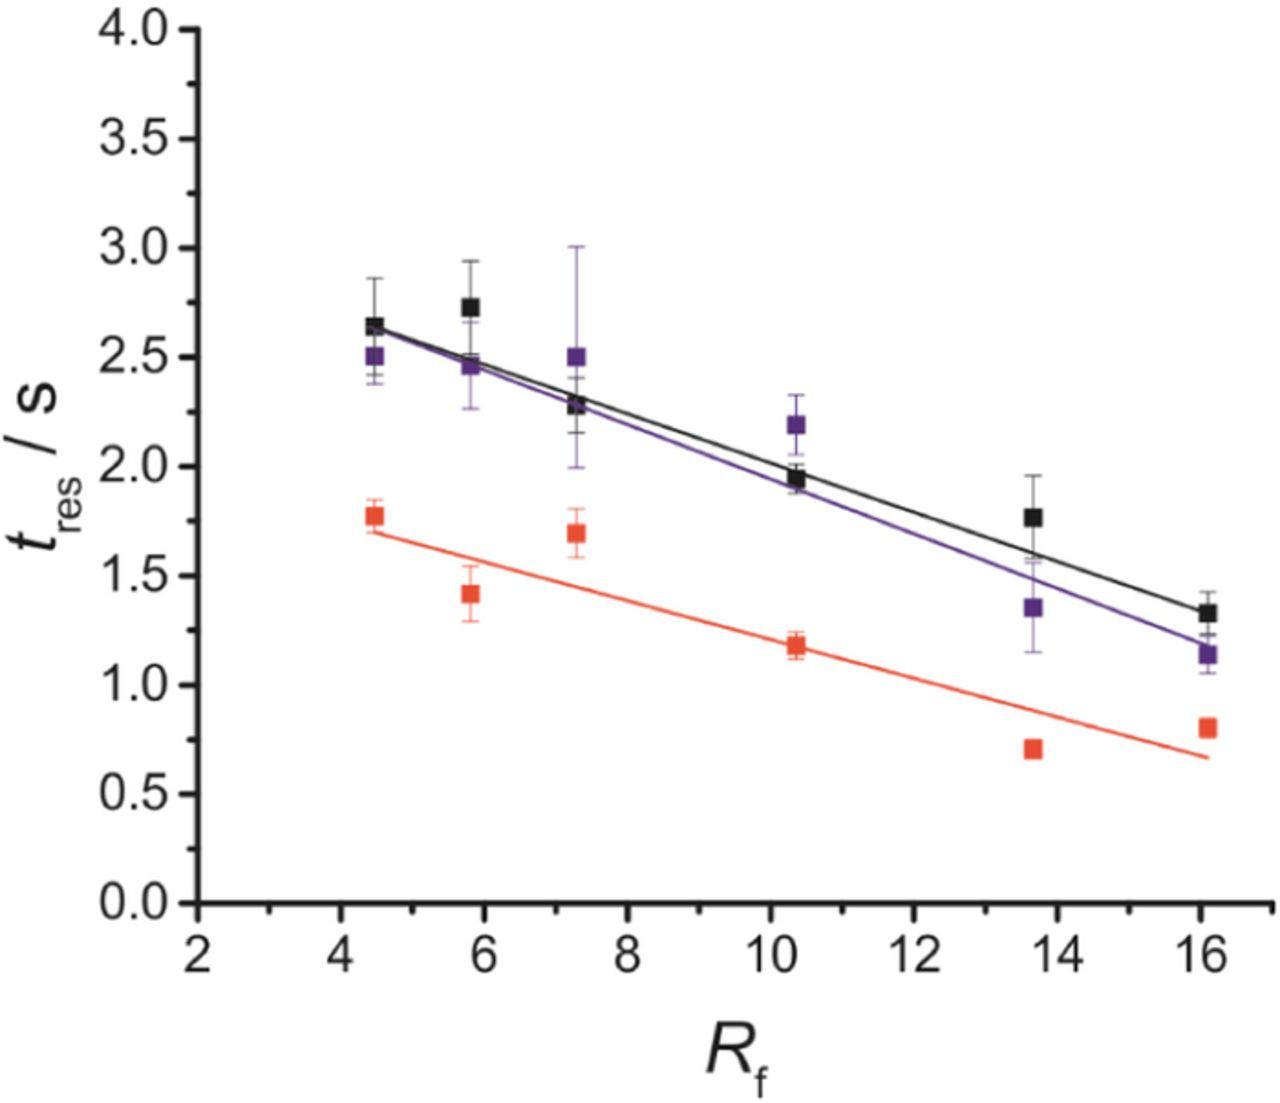
Figure 3. Response time (tres) for H2O2 oxidation at a bare platinum surface (red) and at platinum surface in the presence of a size exclusion polymer layer (blue), and for d-serine detection at an enzymatic biosensor (black). Error bars represent the 95% confidence interval (n = 9). In all cases, response times shown were calculated at the same 25 μm diameter electrode, which was subsequently electrodeposited with polymer to obtain the blue points, and then made into a full biosensor to obtain the black points. All tres were recorded in 25 μM analyte solution in PBS.
Discussion
Somewhat counterintuitively, increasing Rf for the electrode surface reduced the response time both for the oxidation of H2O2 at the platinum surface and for the detection of d-serine by the biosensor. This can be rationalized by considering the contributions to the observed tres, and how they are affected by Rf. At a microelectrode, the response time is affected by two main components. The first is the time taken to resolve the charging current at the electrode surface. This defined by the characteristic time (τc)
![Equation ([3])](https://content.cld.iop.org/journals/1945-7111/165/12/G3074/revision1/d0003.gif)
where a is the electrode radius, C is the electrode capacitance and κ is the solution conductivity. The total charging current at the start of an electrochemical step (t = 0 s) is large, before rapidly decreasing as long as the applied potential is kept constant. The total remaining charging current at t = 3τc is 5% of the charging current at t = 0 s, and so the measured current can be assumed to be free from contributions from charging current.53 Equation 3, taking the conductivity of PBS as 0.016 S cm−161 and the capacitance of the platinum surface to be 30 μF cm−2,62 shows that the charging current should be resolved after just 0.3 ms even for the roughest electrode studied in this work.t1
The other factor in determining tres is the time taken to establish a hemispherical diffusion field, which is required for the recording of a mass transport limited current at the microelectrode tip. For a rapid heterogeneous redox reaction, the current at the microelectrode tip (itip) is given by
![Equation ([4])](https://content.cld.iop.org/journals/1945-7111/165/12/G3074/revision1/d0004.gif)
where n is the number of electrons transferred, F is Faraday's constant, A is the electrode area, D is the diffusion coefficient, c is the concentration, t is the time after the potential step, and a is the electrode radius. Equation 4 is comprised of two expressions, where the first fraction describes the short time response, and the second fraction defines the mass transport limited current. The time taken where itip is defined by the mass transport limited current is therefore the time where the denominator for the first fraction becomes sufficiently large to make the first term negligible compared to the second term.
The complex development of the hemispherical diffusion layer makes it difficult to give a precise expression for the time taken to establish the mass transport limited current, though it can be seen to be predominantly dependent on t, D and a, where larger t and D or smaller a will give a larger second term with respect to the first. In the case of the impact of Rf, the electroactive area of the electrode is featured in the numerator of both terms, so it might be expected that Rf should have no impact on the time at which the first term becomes negligible. What is important to note is that Equation 4 assumes that the all analyte at the electrode surface is immediately reacted, which requires rapid kinetics for the electron transfer. For H2O2 oxidation, this is not the case, since adsorption and chemical steps are required to occur as part of the overall mechanism.29,30 This makes the rate of electron transfer to the H2O2 a limiting factor in the establishment of the hemispherical diffusion layer, and therefore in tres. This may go some way to explaining the improvement in tres at larger Rf, as the presence of step and edge sites at the rougher surface will enhance the kinetics of the oxidation reaction.
As well as the structure of the metal surface, the rate of H2O2 oxidation is also dependent on the nature of that metal surface, specifically whether it is in a reduced or oxidized state. A number of studies have shown H2O2 oxidation to be favored on pre-oxidized platinum surfaces.57,63 In the case of polycrystalline platinum, the rate of oxidation of the platinum surface will not be uniform, with enhanced surface oxidation being expected at step and edge sites.64–66 As roughening surfaces provide additional steps and edges at the electrodes surface, it is possible that high Rf would exhibit a greater degree of surface oxidation, which would also contribute to the enhanced H2O2 oxidation signal, and therefore to the LOD and tres for the biosensor.
The focus of this work has been on the behavior of the electrode toward the oxidation of H2O2. However, the overall response of the biosensor is comprised not only of the oxidation kinetics, but also of the diffusion of d-serine toward the biosensor, the reaction of d-serine at the active site of DAAO to produce H2O2, this diffusion of H2O2 through the enzyme layer toward the electrode surface, and then finally the oxidation of H2O2 (Figure 1). The strong dependence of our biosensor's response to the manipulations of surface roughness suggest that, of all these steps, it is the oxidation of H2O2 that is rate limiting. This provides further evidence that the development of the next generation of enzymatic biosensors should focus on providing enhanced oxidation kinetics at the electrode in order to maximize sensitivity and response time.
As well as providing a simple and cost effective means of enhancing tres and LOD, it is worth considering the implications of this work toward the development of other parts of the enzymatic biosensor fabrication, such as the means of cross linking the enzyme to the electrode surface, the nature of the size exclusion polymer layer, or the source of the enzyme being used. It is common to investigate these by fabricating a series of biosensors each with a slightly varied fabrication technique, and then using the best performing biosensor as a metric for which fabrication methodology should be used or further developed. Here, we have shown a significant dependence of both LOD and tres on the surface roughness that has the potential to mask any variance caused by other variances in the fabrication procedure. It therefore seems essential to start use electrodes with almost identical Rf when comparing the impact of other fabrication techniques on biosensor quality.
It is worth noting that, should this work be replicated, we would expect similar polishing regimes to result in differing roughness values due to the use of different polishing apparatus, electrode materials, downward pressure etc. Whilst it is possible to calibrate exact roughnesses using AFM or profilometry, we would not recommend this for widespread use due to the costs involved and the difficulty in completing such measurements for microelectrodes without damaging the fragile electrode tip. In order to make this technique both time and cost efficient, we prefer to use CVs in 1 M H2SO4 to simply calibrate the polishing procedure with respect to surface roughness. After equipment set-up and solution degassing, the full CV and calculation of Rf can be done in just a few minutes. His allows for a rapid calibration of the polishing regime, simply by polishing for a short time, analyzing the roughness via the area under the hydride adsorption peaks, and repeating if necessary.
Conclusions
In this work we have presented the impact of electrode surface roughness on two key parameters for an enzymatic electrochemical biosensor: the response time and the limit of detection. By fabricating a series of biosensors with identical properties except for a varying Rf, we can display a sequential improvement in both LOD and tres. The improvements in tres are mirrored in H2O2 detection at platinum electrodes with varying Rf, suggesting that it is the interaction of H2O2, rather than reactions or diffusion within the enzyme layer, that defines the magnitude of tres. This clear improvement in both LOD and tres opens up the possibility for surface roughening as a quick, simple and low cost means of enhancing biosensor properties. Additionally, this work raises the need for an awareness of Rf in the development of enzymatic biosensors when varying other factors, such as enzyme source or crosslinking methods, as an identical Rf is clearly essential to ensure that observed changes are due to the parameter being changed, rather than an artefact of varying Rf.
Acknowledgments
This work was financially supported by the Natural Sciences and Engineering Research Council of Canada (NSERC).
ORCID
Samuel C. Perry 0000-0002-6263-6114
Janine Mauzeroll 0000-0003-4752-7507