Abstract
High-capacity anode materials (such as, silicon) are of critical importance for lithium-ion batteries aimed at achieving longer drive range for electric vehicles. Large lithium retention in these alloying materials is, however, accompanied by high volume expansion, which results in severe mechanical degradation and capacity decay. The inherently coupled mechano-electrochemical stochastics is elucidated in this work. A stochastic computational methodology has been developed to capture the large deformation and mechanical degradation in high-capacity anode materials. Lithiation and delithiation in such active particles follow a two-phase diffusive interface formation and propagation. Mechano-electrochemical interactions lead to different tensile forces acting on the active particle that may lead to microcrack formation. In this study, we have demonstrated that: (a) concentration gradient induced stress at the two-phase interface does not lead to severe mechanical degradation; and (b) large volume expansion induced tensile force at the particle surface actually gives rise to multiple spanning crack formation and further propagation during delithiation. Anode materials with higher partial molar volume of the lithiated phase can lead to enhanced mechanical degradation. Functionally graded materials, with reduced elastic modulus near the surface, hold potential for significant reduction in crack formation.
Export citation and abstract BibTeX RIS

This is an open access article distributed under the terms of the Creative Commons Attribution Non-Commercial No Derivatives 4.0 License (CC BY-NC-ND, http://creativecommons.org/licenses/by-nc-nd/4.0/), which permits non-commercial reuse, distribution, and reproduction in any medium, provided the original work is not changed in any way and is properly cited. For permission for commercial reuse, please email: oa@electrochem.org.
Lithium-ion batteries (LIBs) are poised to play a major role in the advancement toward wide-spread vehicle electrification.1–3 Significant effort is being invested to make use of lithium ion chemistry in commercial aircrafts (see4,5) as well as large-scale grid energy storage systems (see6,7). Increasing the specific energy of both cathode (see8,9) and anode (see10,11) electrode active material will effectively result in enhanced energy density of the LIB. Commercial batteries use lithium cobalt oxide (LiCoO2) or nickel-manganese-cobalt (LiNi1/3Mn1/3Co1/3O2) as the cathode material, which shows around 170mAh/g as the effective specific energy.12 Graphite is used regularly as anode active material within commercial batteries, which shows a maximum of 372mAh/g specific capacity.12
Next generation lithium ion batteries are supposed to use high capacity cathode as well as anode materials.11 Layered-layered composite cathode structures, represented as xLi2MnO3·(1-x)LiMO2 (M = Mn, Ni, Co), has received attention due to high rechargeable capacity of 250mAh/g when cycled between 4.6 V and 2.0 V (see13–15). Gas generation due to oxygen release is one of the major modes of degradation in these composite cathode materials. These high-capacity layered composite cathodes do not experience severe volume expansion during lithiation process.16 High capacity anode materials can show almost ten times higher theoretical specific energy than graphite (such as, silicon (Si), tin (Sn) and germanium (Ge)) (see17–20). The theoretical capacity of silicon is 4200mAh/g and the same for tin is 994mAh/g.12 Significant research work has been conducted to construct silicon based anode electrodes for lithium ion battery. Some studies focused on Si-nanowires (see18,21) and others developed silicon based composite anodes (see22–26). From the perspective of commercial applications, Panasonic Corporation announced the development of high-capacity lithium-ion battery with Si-alloy anodes.27 When used inside a realistic lithium-ion battery electrode, the effective capacity of Si and Sn decrease, but still displays almost three times the capacity of graphite based anodes (see28). However, usage of high-capacity anode materials within LIB suffers from significant loss of capacity with charge-discharge cycles.25 Most of the novel Si architectures tested in a laboratory experienced more than 20% capacity-fade within the first 50 cycles (see29,30).
The reason behind this severe capacity fade in high-capacity anode materials is the fact that they experience severe volume expansion and contraction during the lithiation and delithiation process, respectively.24 Si and Sn anode active particles expand around 300% when it is fully lithiated.31,32 This gives rise to significant amount of microcrack formation, nucleation and propagation in the active particles. Experimentally observed SEM images of mechanical degradation in silicon (Si) active particle after the lithiation process are available in the existing literature.33 Propagation of crack fronts from the particle surface brings fresh active particles in contact with the electrolyte where solid electrolyte interface (SEI) layer can form leading to loss of cyclable lithium.34,35 Severe mechanical degradation and subsequent pulverization of the active particles has the potential to completely isolate some portion of the active particles.36,37 As active particles get detached from the electron carrying conductive additives, it becomes incapable of hosting lithium ions. This gets reflected as severe capacity fade, which is also known as site loss. Computational research has been conducted to elucidate the reason behind large stress generation and pulverization of high capacity anode materials (see38,39).
Transport of lithium ions though the Si and Sn based high capacity anode materials occur via the two-phase diffusion mechanism. During lithiation the crystalline Si changes into amorphous LixSi compound, which is usually separated by a moving two-phase front.40 It can be assumed that after the first lithiation process, the entire Si behaves like an amorphous material and transport of Li happens via single phase diffusion process.41 Hence, in some earlier studies, the governing equation for single phase diffusion has been adopted to characterize the transport of lithium within silicon active particles.38,42 However, experimentally obtained SEM images show that significant amount of mechanical degradation occur within the first lithiation process.33,38,43 Because of the conversion from crystalline Si to amorphous LixSi compound, the first lithiation process must be modeled using a two-phase diffusion technique. To analyze the magnitude of stress generation within Si active particles, Huang et al. adopted a two-phase concentration profile for transport of silicon.44 The effects of high or low rates of reaction were not captured successfully. A Cahn-Hilliard equation based two phase transport model was adopted by Chen et al. to model the combined kinetics of diffusion and movement of the two-phase front.39 The effects of particle size and rate of lithiation-delithiation in silicon were appropriately captured. A similar governing equation that is capable of predicting the phase separation and diffusion within Si active particles has been adopted in the present study.
Several computational studies have been conducted to investigate the large volume expansion and subsequent stress generation within Si anodes during the lithiation process (see38,42,45). In silicon thin films and nanowires, possibility of pre-existing cracks to propagate during the lithiation-delithiation process has been studied (see46,47). The effect of surface energy in nano-sized Si particles and wires to eliminate the microcrack formation has also been investigated.48 Elasto-plastic deformation of the silicon active material was taken into consideration in some of the computational analysis (see11,39,42). Effect of mechanical stress generation on the electrochemical potential of thin film silicon electrode has also been investigated.41,49 However, there exist no detailed numerical analyses that can predict the nucleation and propagation of microcracks and pulverization of high capacity anode materials during the lithiation-delithiation process.
There exist two main reasons behind this major mechanical degradation observed within high capacity anode active materials:49
- (a)Transport of lithium occurs via a two-phase diffusion process, which gives rise to very large concentration gradient induced load at the two-phase interface boundary.
- (b)Large volume expansion during lithiation causes the lithium rich phase to move outward along the radial direction resulting in generation of tensile stress at the particle surface.
Prevention of these major forms of capacity deterioration in Si and Sn based anode materials is necessary to successfully implement them in commercial lithium ion battery systems.11,12 In the present article, a computational methodology has been developed that can capture the transport of lithium in high-capacity anode materials through a two-phase diffusion process. To capture the large volume expansion and subsequent mechanical degradation observed in high-capacity anodes, a modified lattice spring based computational methodology has also been implemented here. A comparative analysis has been conducted to understand whether the concentration gradient induced load or the large volume expansion gives rise to enhanced microcrack formation. Different techniques that are capable of minimizing the overall mechanical degradation of high capacity anode materials will also be investigated.
Methodology
In the present work, transport of lithium in high-capacity anodes, volume expansion due to large amount of lithium insertion and finally, microcrack formation due to concentration gradient and large volume expansion have been modeled. In accordance with the available literature, transport of lithium inside the anode active material has been assumed to occur via a two-phase diffusion process.39 Fick's law of diffusion is only applicable to single-phase diffusion process. In high-capacity anode materials, two-phase diffusion is modeled by solving the Cahn-Hilliard equation, which is provided below:39,50
![Equation ([1a])](https://content.cld.iop.org/journals/1945-7111/163/6/A1120/revision1/d0001.gif)
![Equation ([1b])](https://content.cld.iop.org/journals/1945-7111/163/6/A1120/revision1/d0002.gif)
![Equation ([1c])](https://content.cld.iop.org/journals/1945-7111/163/6/A1120/revision1/d0003.gif)
Here,  is the non-dimensional concentration variable that is defined as,
  , where cs signifies the molar concentration of lithium in the active material and cs, max corresponds to the maximum amount of lithium that can be stored within the active particles. MLi is the concentration dependent mobility of lithium in the solid phase that is defined as,
  , where, DLi corresponds to the diffusivity of lithium, R is the universal gas constant and T signifies the temperature in Kelvin. Also, ω is a non-dimensional parameter, which physically signifies the enthalpy of mixing, and mathematically produces the double well in the free energy functional. The parameter κ takes into account the contribution to the free energy at the phase boundary due to large concentration gradient at the two-phase interface. From Eq. 1a, it is clear that the equation is a fourth order equation. To simplify the problem, Eq. 1a has been converted into two second order equations, and both the equations are solved in a fully coupled fashion.50 Since the particles are assumed to be spherical in shape, lithium concentration only along the radial direction is solved. From the boundary condition given in Eq. 1b, at the center of the active particle, symmetry boundary condition is applied. Constant flux boundary condition is applied at the particle surface, magnitude of which depends on the applied current (also shown in Eq. 1c). Details of how this fourth order transient differential equation is solved have been provided in the Appendix A.
The main purpose of this article is to capture the evolution of mechanical degradation within high capacity anode active materials during lithiation-delithiation process. In the present model, the diffusion of lithium has been solved in the reference configuration.43 This inherently simplifies the problem by relaxing the requirement of solving the problem on a deforming domain. In other words, the effect of volume expansion on the two-phase diffusion process need not be taken into account. The main aim here is to capture the mechanical degradation in terms of crack formation and propagation under concentration gradient and large volume expansion induced load. Effect of hydrostatic stress shows a relatively minor impact on the transport of lithium.51 Volume expansion and large stress generation can affect the overall cell potential, but to a very minor extent.52 However, change in cell voltage due to large volume expansion is not the main focus in the present work. Hence, neglecting the effect of mechanical deformation on lithium diffusion is justified. It should be noted that during crack formation and propagation, both shape and size of the active particle change, thereby losing its spherical symmetry. The computational methodology to solve the transport of lithium for two-phase diffusion process coupled with large volume expansion will be reported as a future work.
A lattice spring based computational methodology was developed by the authors earlier to capture the formation of microcracks in low volume expansion anode materials (such as, graphite).50,53,54 A new lattice spring based methodology has been developed to incorporate the effect of large volume expansion observed in high capacity anode materials (such as, Si and Sn). The previous lattice-spring methodology was used for modeling small amount of volume expansion is active particles. Hence a linear strain-displacement relation was sufficient.53 In the new lattice spring technique, the complete nonlinear strain-displacement relation has been used to estimate the large volume expansion experienced by high energy density anode materials. During lithium transport, two types of load act on the anode material:49 a) large concentration gradient at the two-phase interface, and, b) excessive volume expansion due to severe lithium insertion. A combination of these diffusion induced stresses result in formation and propagation of spanning cracks within Si and Sn anode active particles. While solving this problem, large displacement and large strain of the active particle has been assumed.55 An updated lagrangian based lattice spring methodology has been developed that can predict the large volume expansion and fracture, simultaneously. The governing differential equation adopted to solve this problem is:55
![Equation ([2])](https://content.cld.iop.org/journals/1945-7111/163/6/A1120/revision1/d0004.gif)
Here, tV and tA corresponds to the volume and area at the previous equilibrium configuration, t + ΔttSij is the 2nd Piola-Kirchhoff stress tensor, t + Δttεij is the Green-Lagrange strain tensor, t + ΔttFi is the externally applied force, t + Δttui is the displacement and t + ΔtR is the residual. On the LHS, the first term indicates the internal energy and the second term signifies the energy due to externally applied forces. In the present problem, there is no externally applied force (t + ΔttFi) and the entire load comes from concentration gradient induced body force. We try to minimize the residual term under any externally applied loading conditions. Minimizing the residual indicates that all the external forces should be balanced by internal forces. The Green-Lagrange strain tensor is written in the indicial notation as:56
![Equation ([3])](https://content.cld.iop.org/journals/1945-7111/163/6/A1120/revision1/d0005.gif)
Here, summation over repeated indices is implied. tui signifies the incremental displacement from time step t to t + Δt and xj corresponds to the spatial location. For the updated lagrangian lattice spring model being investigated here, the strain-displacement kinematic relations and stress-strain constitutive relations should be modified such that they are applicable to one-dimensional spring elements. To constraint the rotational rigid body mode, shear resistance has also been added to each of the springs. However, only small strain assumption is used along the transverse direction. Large strain is allowed to occur only along the axial direction. Details of how to incorporate the strain-displacement and stress-strain relations into the governing differential equation and construct the stiffness matrix, has been discussed in Appendix B.
The constitutive relation plays an important role in determining the amount of mechanical deformation as well as degradation of the active particles. Material specific properties should be taken into consideration while developing constitutive relations applicable to different high capacity anode materials. For example, silicon (Si) deforms elastically till rupture for both the non-lithiated crystalline as well as lithiated amorphous phases.57 However, deformation of tin (Sn) in the non-lithiated crystalline phase occurs as a ductile process, whereas, brittle deformation is observed for the lithiated amorphous phase.57 In the present article, results of two-phase diffusion and successive mechanical degradation will be demonstrated for a Si anode active particle. Hence, only linear elastic relation between second Piola-Kirchhoff stress and Green-Lagrange strain along the axial direction is taken into consideration:55,56
![Equation ([4])](https://content.cld.iop.org/journals/1945-7111/163/6/A1120/revision1/d0006.gif)
Here, ''11'' corresponds to the local ''xx'' or axial direction and E signifies Young's modulus along the axial direction, which display different magnitude for the crystalline and amorphous phase.
Depending on the free energy functional and the magnitude of the enthalpy of mixing term (ω), which is already incorporated within Eq. 1a, there exist two levels of concentration where minimum energy is observed.39 The lower concentration level  signifies lithium-poor phase, whereas, the higher magnitude of concentration
  corresponds to lithium-rich phase. Since each of the lithium poor and rich phases belong to equilibrium configurations, as soon as lithium poor or lithium rich phase gets generated, it can be assumed to be a stress free configuration. Initially the entire active particle is assumed to be in the lithium poor phase, which is free from internal stresses. Lithiation occurs as constant influx of lithium ions through the surface of the spherical active particle. As soon as the surface of the active particle reaches the lithium rich phase, it becomes free from any internal stresses (because the lithium rich phase is an equilibrium configuration). Under subsequent lithiation, the two-phase front moves inward and pushes the lithium rich phase along the outside direction.39 Inward traversal of the two-phase front results in high volume expansion, and subsequent outward movement of the lithiated phase generates tensile stress near the surface.49 The lithium poor phase adjacent to the lithium rich phase experiences severe tension due to large concentration gradient associated with the two-phase boundary.58
Another important aspect that should be discussed is the incorporation of concentration induced stress and subsequent deformation. In the present context, transport of lithium and mechanical deformation has been solved in an incremental fashion.55 The equilibrium concentration of the lithium-poor phase and the lithium-rich phase are assumed to be the stress free configurations. Insertion of lithium results in additional concentration induced strain.39,49 Under a small time increment, at a particular point the change in concentration can be given as  . If the volume expansion coefficient is defined as Ω and lelastic is the length of the spring element only due to elastic deformation, then the total length can be described as:56
![Equation ([5a])](https://content.cld.iop.org/journals/1945-7111/163/6/A1120/revision1/d0007.gif)
![Equation ([5b])](https://content.cld.iop.org/journals/1945-7111/163/6/A1120/revision1/d0008.gif)
For small deformation problems, the elastic length lelastic for the second term in the left hand side of Eq. 5a can be assumed to be equal to the initial length. However, for the case where large volume expansion is involved, the elastic length becomes significantly different from the initial one. A schematic representation of the different configurations is provided in Figure 1a. A methodology to calculate the elastic length is derived in Eq. 5b. The axial deformation which gives rise to internal stress can be estimated as:55
![Equation ([6])](https://content.cld.iop.org/journals/1945-7111/163/6/A1120/revision1/d0009.gif)
Here, Δl signifies the change in length and L corresponds to the spring length at the previous equilibrium configuration. Diffusion of lithium ion inside the active particle is a transient process. Thus, a time dependent equation has been solved in Eq. 1a. The propagation of mechanical stress waves is much faster than the transport of lithium via diffusion process. Hence the mechanical equilibrium can be achieved as soon as slight change in lithium concentration occurs.51 Thus, solving the quasistatic mechanical equilibrium equation is sufficient and any dependence on the time variable can be neglected.
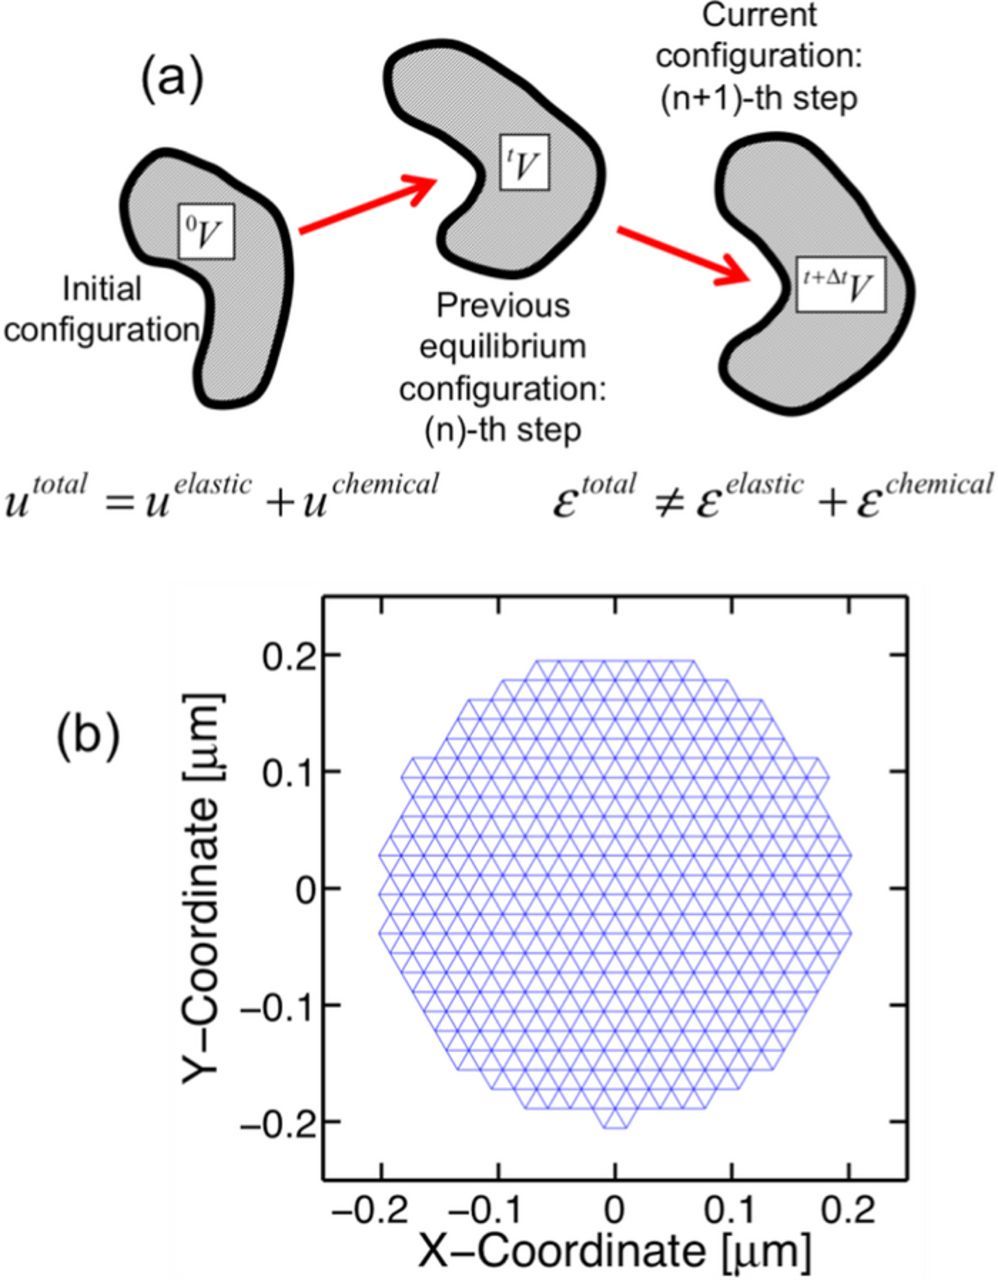
Figure 1. (a) Schematic diagram of the updated lagrangian framework adopted in this study to incorporate the large volume expansion within the lattice spring network. Instead of strain, additive decomposition of the displacements has been adopted here. (b) Lattice spring mesh of a Si active particle with diameter 400 nm. The particle has been discretized using a 30×30 lattice spring network (for the purpose of demonstration only). The simulations were run using a finer mesh.
Evolution of microcrack within the active particle is another important aspect of this article. A lattice spring based methodology was developed by the authors to capture the damage propagation in low volume expansion anode materials.53,59 In the present context, similar energy based criterion has been developed to capture the formation and propagation of microcracks within high capacity anode active particles. Since the concentration gradient and high volume expansion induced load is applied in an incremental sense, the energy in each lattice spring element is also calculated in an additive fashion. If the strain energy for a particular spring element (''e'') at the present time step (n + 1) is denoted as ψn + 1e, it can be written in terms of the strain energy after the previous equilibrium step (ψne) as:53
![Equation ([7])](https://content.cld.iop.org/journals/1945-7111/163/6/A1120/revision1/d0010.gif)
Here,  and
and  corresponds to the incremental internal force and displacement of the lattice spring element, respectively. If the energy in a particular spring exceeds its fracture threshold (ψn + 1e > ψe, t), the spring is assumed broken and irreversibly removed from the lattice spring network. For the subsequent load increments, the effect of the broken element is entirely removed from the stiffness matrix. The load that was being carried by the broken element gets distributed among the neighboring lattice springs, which eventually gives rise to the stress concentration effect around the tip of a spanning crack. Subsequent rupture of elements from the lattice spring network gives rise to the evolution of microcrack and eventually nucleation of these microcracks results in the formation of spanning cracks.50,54
A schematic diagram of the lattice spring network has been provided in Figure 1b. A Si active particle of diameter 400 nm has been discretized using a 30×30 lattice spring network. The initial length of each element depends on the mesh resolution and size of the active particle. All the spring elements are assumed to have the same length at the beginning of simulation. During the lithiation process, volume expansion of the active particle results in elongation of the lattice spring elements. Analysis of mesh resolution for both computational as well as scientific accuracy has been provided in the Appendix C. The adopted triangular lattice spring network shows a coordination number of six, and they are oriented in an ordered fashion (see Figure 1b for more details about the distribution of springs).
Demonstration of crack formation and propagation during the lithiation process will be provided later in the Results and discussion section. Comparison with experimentally observed results will also be discussed there.
Results and Discussion
The computational methodology developed above has been applied to analyze the two-phase transport of lithium ions within Si active particles (from Eq. 1a). Subsequent mechanical degradation during lithiation-delithiation phenomena has also been investigated (from Eqs. 2–7). The mechanical and transport properties of silicon (Si) adopted for the present analysis is provided in Table I. All the properties have been inherited from existing articles that analyzed the mechanical properties,57 fracture strength60 and transport phenomena within silicon active particles.39,61
Table I. List of parameters used in the computational analysis to capture the mechanical deformation and degradation during the lithiation-delithiation cycles in silicon active particles.
| Name of the parameter | Symbol | Units | Value | References |
|---|---|---|---|---|
| Diffusivity | DLi | m2/s | 2 × 10− 12 | 61 |
| Maximum lithium concentration | cs, max | mol/m3 | 29.52 × 10⁴ | 39 |
| Temperature | T | K | 300 | – |
| Non-dimensional enthalpy of mixing | ω | – | 2.6 | 39 |
| Gradient energy coefficient | κ | J/m | 2.0 × 10− 9 | 39 |
| Applied current | Iapplied | A/m2 | 44.183 | – |
| Electrochemically active surface area | S | m2 | 1.0 | – |
| Young's modulus of the amorphous LixSi | Ea | GPa | 45.0 | 57 |
| Young's modulus of the crystalline Si | Ec | GPa | 90.0 | 57 |
| Shear modulus | G | GPa | 20.0 | 57 |
| Fracture threshold energy of amorphous LixSi | ψt, a | J/m2 | 5.0 | 60 |
| Fracture threshold energy of crystalline Si | ψt, c | J/m2 | 10.0 | 60 |
In these particular simulations, transport of lithium happens within the active particles in a two-phase diffusion process. The concentration gradient at the two-phase interface applies some diffusion-induced load on the active particles, but that load is not sufficient for creating significant amount of mechanical degradation in Si anodes.33 As lithiation continues, the two-phase interface moves inward and due to extremely high volume expansion, pushes the lithium rich surface of the active particle along the radially outward direction. Outward movement of the lithium rich phase induces tensile stress on the particle surface, which leads to initiation of crack fronts.49 Hence, evolution of concentration gradient followed by large volume expansion acts as the loading factor and mechanical degradation is the effect. To correctly understand the microcrack formation, it is necessary to properly realize how the concentration of lithium changes within the Si active particle.
Figure 2 shows the variation in lithium concentration within spherical silicon active particle during lithiation and successive delithiation process. The results have been reported based on nondimensionalized time and current parameters defined as t0 = R2p/DLi and  , respectively. Here, Rp indicates the particle radius and
  is a scaling factor which is set to 0.2 in the present context. Figures 2a and 2b demonstrates the evolution of lithium concentration under a relatively slow (0.1I0) rate of externally applied current. Within a time interval of t0, under constant current lithiation at 0.1I0, Li ions of amount approximately 6.05% of cs, max enters the Si active particle. Radius of the active particle considered in this simulation is around 100 nm. Under constant flux prescribed boundary condition, the concentration at the particle surface increases from lithium poor phase to lithium rich phase. The two phase front that gets generated moves inward along the radial direction during subsequent lithiation process. Figure 2a depicts that from time 0.0 · t0 to 13.0 · t0, the lithiation phenomenon occurs. From time 13.0 · t0 to 26.0 · t0, the delithiation process takes place. Under low rates of current, a single two-phase front develops, which moves inward during the lithiation process and comes out at the time of delithiation. A more detailed description of what happens close to the time 13.0 · t0 where transition from lithiation to delithiation occurs is portrayed in Figure 2b. The time range between 12.48 · t0 and 15.6 · t0 have been emphasized here. As shown in Figure 2b, even though the lithiation process stops at 13.0 · t0 (black dashed line in Figure 2b), the two-phase front moves inward till 13.52 · t0 (red solid line in Figure 2b). It should be noted that delithiation occurs during the time interval of 13.0 · t0 and 13.52 · t0 from the surface of the active particle. Then at 14.04 · t0 (red dashed line), the two-phase front changes its direction of movement and starts to traverse outward. Subsequent delithiation from the surface of the active particle causes the two-phase front to move along the radially outward direction. The lithium concentration at the particle surface can deplete significantly with respect to the equilibrium concentration of the lithium rich phase (solid blue line that corresponds to 15.6 · t0) during the delithiation process. However, the particle surface still remains in the lithium rich phase.
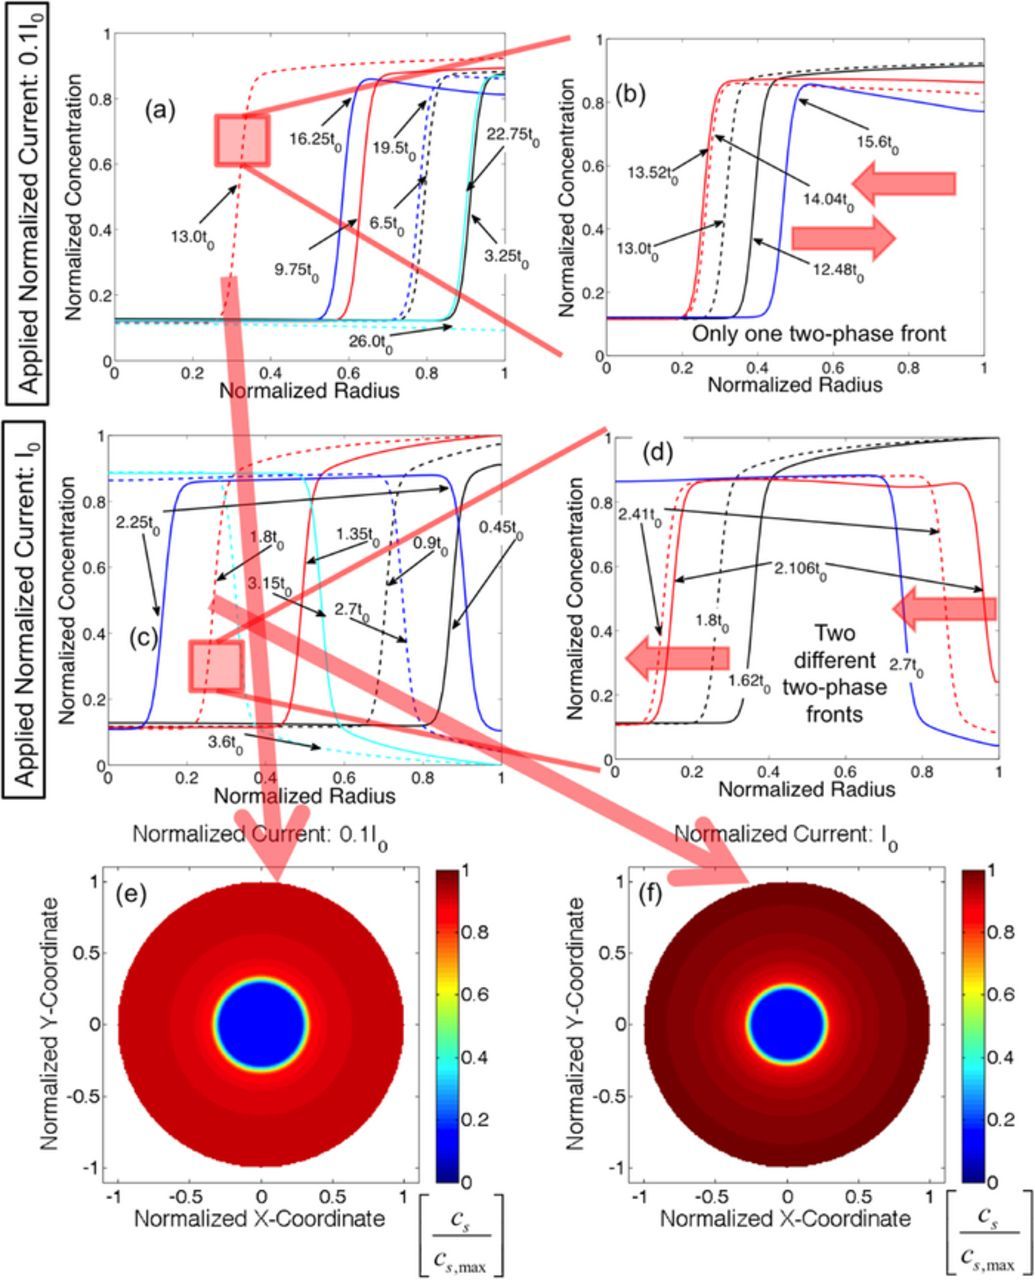
Figure 2. Evolution of concentration profile within silicon (Si) active particles. Lithiation happens between normalized time 0.0 to 13.0t0 and 1.8t0 at lower and higher rates of lithiation, respectively. t0 is the normalized time denoted as R2p/DLi. Delithiation occurs immediately after the lithiation process. (a) Evolution of concentration profile and the two-phase front under low rates of current. (b) A zoomed in view of the movement of phase front close to 13.0t0 under low rates of current. (c) Evolution of concentration profile and the two-phase front under high rates of current. (d) A zoomed in view of the movement of the phase front close to 1.8t0 under high rates of current. (e) Contour plot of concentration profile under low rates of current at the end of lithiation process. (f) Contour plot of concentration profile under high rates of current at the end of lithiation process.
Figures 2c and 2d demonstrates how the lithium ion concentration changes inside a spherical silicon active particle of radius 100 nm during fast lithiation and delithiation phenomena. The magnitude of applied normalized current is I0 for the fast charge-discharge process. Under this high rate of lithiation (I0), within the time interval t0, Li ions of amount approximately 60.77% of cs, max enter the Si active particle. Because of the concentration dependence of the Li mobility term  that appears in the boundary condition (given in Eq. 1c), the amount of Li that enters under I0 is not exactly ten times of the amount that enters at 0.1I0. However, the order of magnitude difference is well maintained. Similar to Figure 2a, in Figure 2c lithiation occurs till a normalized time of 1.8 · t0 (red dashed line), and after that delithiation occurs till 3.6 · t0 (cyan dashed line). Under constant influx of lithium ions, surface concentration increases quickly and becomes equal to the lithium rich phase. Because of fast influx of lithium ions, and relatively slower movement of the two-phase front along the radial direction, the surface concentration eventually reaches the maximum concentration (red solid line in Figure 2c that corresponds to time 1.35 · t0). Similarly, at the end of delithiation, the concentration at the surface of the active particle is the minimum concentration, which is smaller than the concentration of the lithium poor phase (see cyan dashed line in Figure 2c). Figure 2d demonstrates the generation of two different two-phase fronts that move along the same direction when lithiation ends and delithiation begins. At the end of lithiation process (black dashed line in Figure 2d), there exist only one two-phase front. With the initiation of fast delithiation process, the surface concentration drops very quickly and becomes equal to the lithium poor phase at around 2.106 · t0 (solid red line in Figure 2d). As a result, two different two-phase fronts get developed (at time 2.41 · t0): one close to the center, and the other close to the surface of the active particle (see red dashed line in Figure 2d). The two-phase front close to the center reaches the center of the active particle and vanishes. The two-phase front near the surface of the active particle moves inward with subsequent delithiation process (blue solid line).
It should be noted that during lithiation the crystalline-Si converts into amorphous-LixSi through the two-phase diffusion process,62 which has been captured here using the Cahn-Hilliard equation. Subsequent delithiation in Si thin films result in single-phase transport of lithium, which gives rise to amorphous-Si close to the surface.44 In the present analysis, size of the Si active particles has been assumed to range between 100 nm and 1 μm, which is significantly smaller than that analyzed in the thin film experiments (the Si-thin films were more than 100 μm in thickness). It has been reported by other experimentalists that, micrometer sized crystalline-Si active particles convert into amorphous-Si after multiple lithiation-delithiation cycles.24,63 Whether the amorphous-Si is observed during the first delithiation process has not been clarified for micrometer sized active particles. For nanometer sized Si active particles, the crystallinity of Si is preserved even after multiple lithiation-delithiation cycles.10,64 Hence conversion from crystalline-Si to amorphous-Si during the delithiation process can be associated with the length scale of the particle under consideration. In the present context, micrometer sized active particles are lithiated and delithiated, which definitely converts into amorphous-Si after multiple lithiation-delithiation operations (around five cycles). Hence, the assumption that first delithiation produces some amount of crystalline-Si close to the surface can be justified. However, appearance of the crystalline form of Si for 10 consecutive cycles (reported later while comparing the evolution of damage with experimental observations) may not be close to the realistic scenario.
Figures 2e and 2f shows the contour plots of normalized lithium concentration under low and high rates of current, respectively. The displayed concentration profile corresponds to the time at the end of the lithiation process (t = 1.8 · t0/13.0 · t0). The color bar signifies magnitude of normalized lithium concentration. Since the contour plots are generated at the end of the lithiation process, significant portion of the active particle close to the surface is in lithium rich phase. A small amount of active particle close to the center is still in lithium poor phase at the end of the lithiation process. For lithiation-delithiation at lower rates of current, the two-phase front never reaches the center of the active particle. Hence, the center of the active particle always remains in the lithium poor phase at the time of delithiation (also depicted in Figure 2a). However, for lithiation-delithiation at higher rates of current, the two-phase front indeed reaches the center of the active particle. Hence, the lithium poor phase at the end of the lithiation process (blue region in Figure 2f) eventually becomes lithium rich sometime during the delithiation phenomena (also shown in Figure 2c). The existence of a sharp two-phase interface is also evident from Figures 2e and 2f.
For materials where lithiation-delithiation occurs through a two-phase diffusion process, the total amount of mechanical degradation depends mostly on the location of the two-phase front.49 Fracture evolution does not significantly depend on the total amount of lithium that entered the active particle during constant current lithiation process. Hence, end of lithiation for both high and low rates of current (I0 and 0.1I0) has been determined based on the location of the two-phase interface. As the sharp lithium interface traverses approximately 0.7Rp from the surface of the active particle, it has been assumed that the lithiation process stops there. For lithiation at lower rates (0.1I0), this happens at around 13.0 · t0; whereas, for lithiation at higher rates (I0), the two-phase interface traverses 70% of the entire radius at 1.8 · t0. Hence, lithiation ended at 13.0 · t0 and 1.8 · t0 for slow and fast rates of lithiation, respectively. Total amount of lithium that enters the active particle is different in these two cases. During slower rates of reaction at 0.1I0, lithium ions are allowed to enter for 13.0 · t0, which enables 1.3I0t0 amount of lithium to enter the active particle. For the faster reaction at I0, lithium ions enter for 1.8 · t0, which leads to a total 1.8I0t0 unit of lithium to penetrate inside the Si particle. However, at this point of time the two-phase interface lies at a location 0.7Rp far from the surface for both the cases. Since there are more lithium ions within the particle during the faster rate of lithiation, the two-phase front can easily penetrate into the center of the active particle. However, delithiation for the lower rate results in outward movement of the two-phase lithium interface.
The two different types of lithiation-delithiation mechanism described in Figures 2a and 2c leads to completely different amount of mechanical degradation within the active particles. Inward and outward movement of the same two-phase front demonstrated in Figures 2a and 2b induces mechanical degradation only during the lithiation process. Since no new concentration gradient develops or extra volume expansion occurs during the delithiation process, chances of further mechanical degradation are minimal.49 However, under fast lithiation-delithiation phenomena, two different two-phase fronts develop, which has the potential to produce severe mechanical degradation during delithiation process as well (shown in Figures 2c and 2d). Formation of the second two-phase front at the time of delithiation close to the surface of the active particle induces severe concentration gradient induced load. This causes the crack fronts to propagate significantly that opened up during the lithiation process.62 Since severe mechanical degradation can occur during the fast lithiation-delithiation process (shown in Figures 2c and 2d), microcrack formation will be investigated under these types of concentration gradient in the subsequent sections.
In the present context, for both slow and fast rates of operation, the lithiation process has been stopped once the two-phase front penetrates within the active particle till a depth of 0.7Rp. Instead of restricting the lithiation process, if the two-phase front were allowed to penetrate till the center of the active particle, subsequent delithiation would have resulted in formation of crystalline-Si from the surface. For completely lithiated active particles, formation of crystalline-Si during delithiation is observed at all currents, irrespective of the rate of operation. Since mechanical degradation depends mostly on the location of the two-phase front, complete lithiation would result in similar amount of microcrack formation for both slow and high rate of operation.
The concentration profile and operating condition that applies the maximum amount of load has been identified. Next, it will be applied on a Si active particle to estimate the amount of mechanical degradation under diffusion-induced stress. Amount of mechanical degradation during lithiation under different magnitudes of partial molar volume of the lithiated phase has been investigated in Figure 3. By multiplying the partial molar volume of the lithiated phase with the maximum lithium concentration (Ω · cmax), a non-dimensional number has been developed. In Figure 3c, the microcrack density, also known as the fraction of broken elements (fbb), has been plotted with respect to the non-dimensional partial molar volume of the lithiated phase. The dependent variable, microcrack density (or fraction of broken elements), has been defined as the ratio of number of broken springs over the total number of spring elements within the network.53 It is evident form Figure 3c that with increasing magnitude of the partial molar volume, the total amount of microcrack density during lithiation increases. Figures 3a and 3b demonstrates the fracture profile after the lithiation process for non-dimensional partial molar volume of magnitude 0.6 and 0.9, respectively. As discussed earlier, transport of lithium inside silicon active particles happen via two-phase diffusion process. Large magnitude of partial molar volume of the lithiated phase applies two different types of loads: a) Concentration gradient induced load at the two-phase interface, and b) High volume expansion induced tensile load at the particle surface, which increases as the two-phase front moves inward (see49). The concentration gradient induced load at the two-phase interface is relatively smaller in magnitude, and gives rise to minor generation of microcracks. None of this microscopic damage nucleates into spanning cracks. However, the magnitude of tensile load at the particle surface due to large volume expansion has the potential to create spanning cracks. Higher the magnitude of partial molar volume, the outer lithium rich phase moves more toward the radially outer direction. Tensile stress on the particle surface gets generated solely by the outward movement of the lithium rich phase. Hence, higher magnitude of partial molar volume produces enhanced tension followed by crack formation and propagation at the surface of the active particle. Figure 3b clearly demonstrates that for Ω · cmax = 0.9, significantly higher radially propagating cracks are developed as compared to Ω · cmax = 0.6, as shown in Figure 3a. For silicon, the magnitude of non-dimensional partial molar volume lies around 0.7 or 0.8 (shown using a blue circle in Figure 3c), which leads to severe mechanical degradation after the first lithiation process. The error bar shown in Figure 3c has been obtained by averaging over ten different samples.
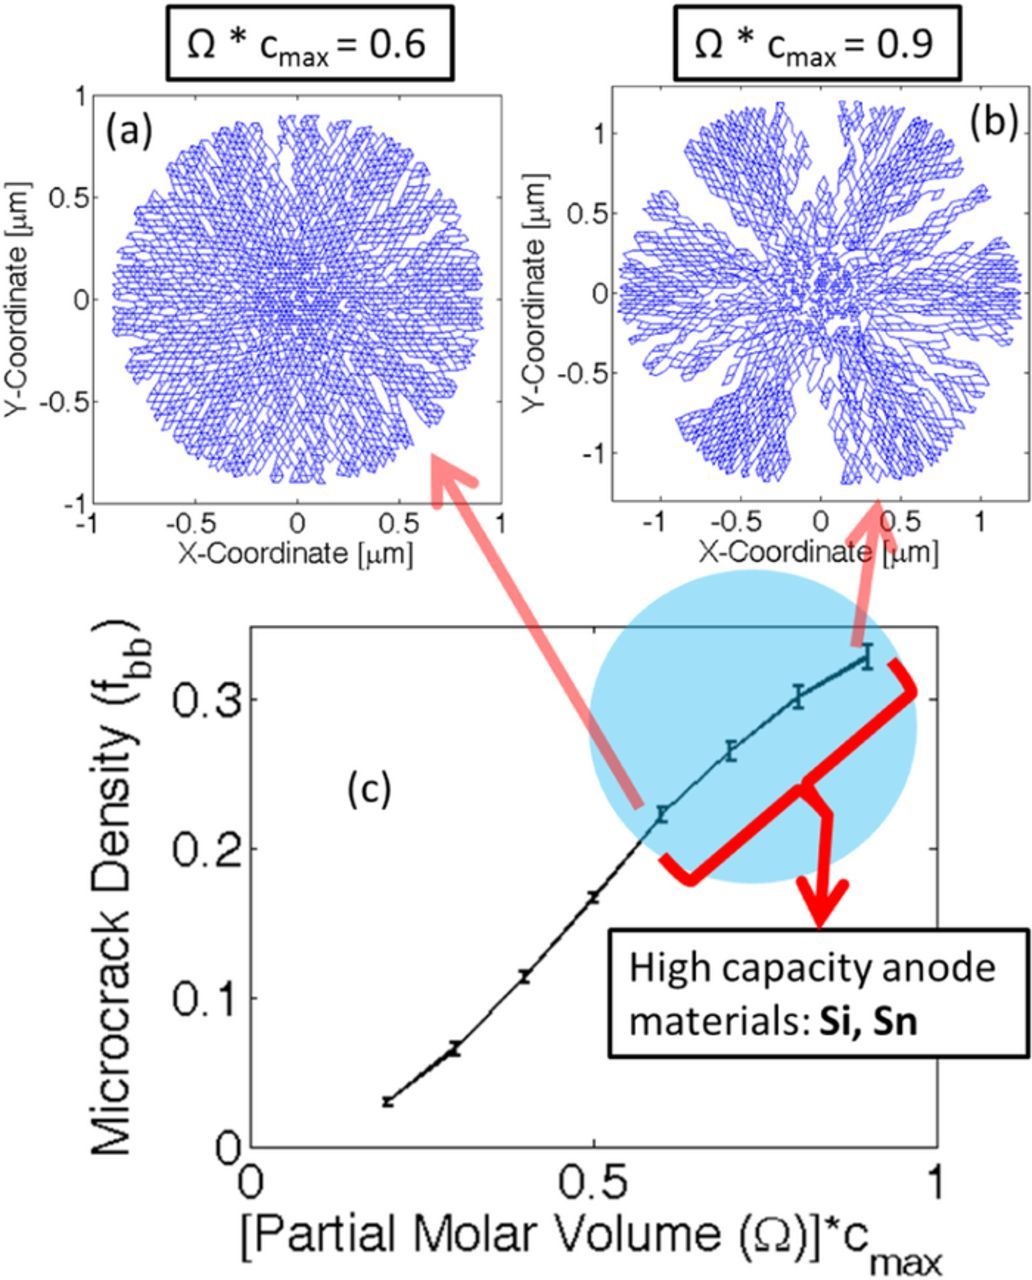
Figure 3. Evolution of microcracks under different magnitude of partial molar volume of the lithiated phase. Initial particle size has been assumed to be 1 μm. (a) Expansion and damage evolution within an active particle where Ω · cmax = 0.6. (b) Expansion and damage evolution inside active particles with Ω · cmax = 0.9. (c) Amount of mechanical degradation during lithiation under different values of partial molar volume. Higher magnitude of Ω · cmax leads to large amounts of microcrack density. Silicon (Si) and Tin (Sn) type high capacity anode materials lie within the blue circular region. However, the simulations have been conducted for Si only. Si and Sn have different concentration dependence for mechanical properties. Ten samples have been considered to generate the error-bar within the figure.
It has already been discussed in the last paragraph that there exist two different mechanisms of microcrack formation: a) Concentration gradient induced load, and b) Large volume expansion induced load (also see24). Since it is established that larger magnitude of partial molar volume lead to enhanced mechanical degradation,39 it is important to understand which mechanism produces more microcracks. Concentration gradient induced mechanical degradation occurs within the lithium poor phase. Whereas, large volume expansion induced damage is observed in the lithium rich phase. Hence, given the coordinates of a broken bond and the location of the two-phase interface, it is possible to determine the amount of microcrack formation due to each of the loading mechanisms. A comparative analysis of mechanical degradation due to both the mechanisms has been demonstrated in Figure 4a. With increasing partial molar volume of the lithiated phase, damage due to each of the mechanisms increase monotonically. But the overall magnitude of degradation due to concentration gradient (red line) is significantly smaller than the mechanical damage because of large volume expansion (black line). The ratio of concentration gradient induced microcrack over large volume expansion driven microcrack remains almost constant for all the values of the partial molar volume. Similar to Figure 3c, ten different samples have been considered to generate the error bars shown in Figure 4a.
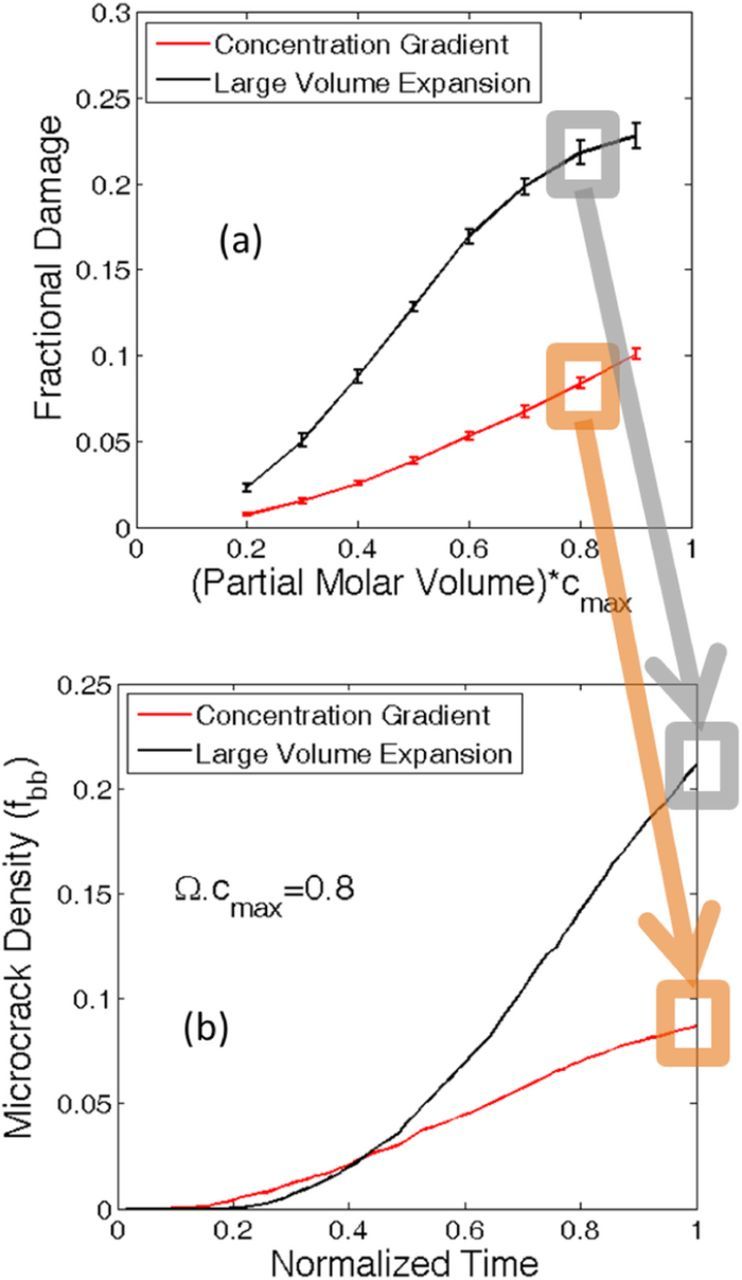
Figure 4. Comparison between microcrack evolution due to concentration gradient effect and large volume expansion effect. The entire analysis conducted here corresponds to initial particle diameter of Dinitial = 1.0 μm. (a) Mechanical degradation at the end of lithiation process due to different mechanisms. Red line shows concentration gradient induced damage evolution. Black line denotes mechanical degradation occurring because of large volume expansion. (b) Comparison between time evolutions of both the degradation mechanisms for a particle with (Ω · cmax ) = 0.8. Towards the end of lithiation, mechanical degradation due to large volume expansion is significantly greater than microcrack evolution from concentration gradient.
Time evolution of mechanical degradation during lithiation from both the mechanisms has been depicted in Figure 4b. The initial diameter of the active particle considered in this simulation is 1 μm, and the non-dimensional partial molar volume is Ω · cmax = 0.8. The lithiation process is assumed to end at normalized time 1.0. Initially the entire active particle exists in a lithium poor phase. During lithiation, concentration of the particle surface increases and becomes equivalent to the lithium rich phase. Negligible mechanical degradation is observed during this time interval when the two-phase front gets developed. With subsequent lithiation, the two-phase front starts to propagate inward, which induces severe concentration gradient induced tensile load on the lithium poor phase. Hence, the concentration gradient induced mechanical damage evolution starts earlier during the lithiation process. This is well reflected in Figure 4b, where at normalized time 0.2, microcrack formation from concentration gradient (red line) is larger in magnitude than volume expansion induced damage (black line). As lithiation progresses, the lithium rich phase is pushed outward along the radial direction. Magnitude of this tensile stress due to outward expansion is significantly larger than its concentration gradient induced counterpart, and it increases very quickly as more lithiation occurs. As a result, severe mechanical degradation near the particle surface starts to occur from normalized time 0.25. Around normalized time of 0.45, mechanical degradation due to large volume expansion becomes larger in magnitude than concentration gradient induced damage. Significantly higher tensile stress at the particle surface leads to rapid increase in volume expansion induced damage evolution. At the end of lithiation process, the ratio of volume expansion induced damage over concentration gradient induced degradation approximately equals to 2.5. Thus it can be concluded that for phase separating and high capacity anode materials, majority of the mechanical degradation happens due to large volume expansion of the active particles.
All the simulation results shown till now correspond to only the lithiation process. Delithiation after the lithiation phenomena indeed applies some amount of concentration gradient induced load. As shown in Figures 2c and 2d, a new two-phase front develops close to the surface at the time of delithiation, where the lithium poor phase resides close to the particle surface. As delithiation continues, this new two-phase front moves inward which gives rise to tension within the lithium poor phase located close to the surface of the particle. Tension induced by concentration gradient is smaller in magnitude than the tensile stresses due to large volume expansion. As a result, during delithiation, new crack fronts do not develop. However, the surface cracks that developed during the lithiation process propagate radially during the delithiation phenomena. Figures 5a and 5b shows the damage profiles for an active particle of size 1 μm after the lithiation and successive delithiation process, respectively. The partial molar volume considered in this simulation has a magnitude of Ω · cmax = 0.7. It is clear from Figure 5b that after the delithiation process, the particle gets fragmented into multiple smaller particles. The smaller interconnection at the center of the particle vanishes after few more lithiation-delithiation processes. Figure 5c depicts the total amount of mechanical degradation after the first lithiation (blue circles) and successive delithiation (black squares) process. Only single sample has been considered to generate these plots. By comparing Figures 5a and 5b, it looks like severe damage occurred during the delithiation phenomenon. However, from Figure 5c it is very clear that significantly more microcrack evolution occurs during the lithiation process. Delithiation experiences more crack propagation and particle fragmentation. Since during the delithiation process, some of the crack fronts open-up significantly, it gives a false impression of enhanced mechanical degradation.
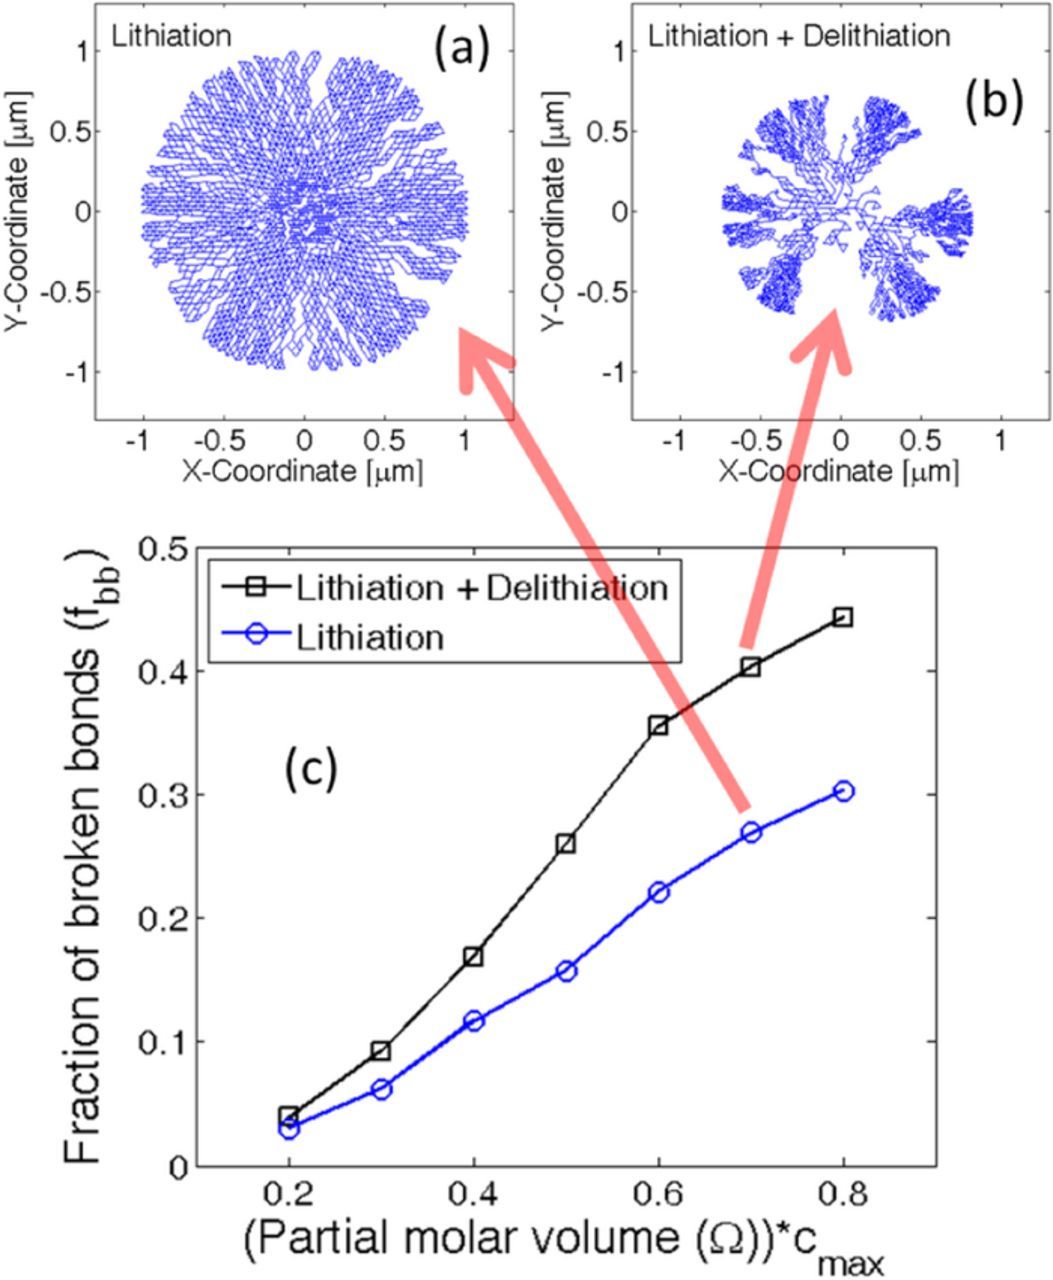
Figure 5. Microcrack evolution at the end of lithiation and delithiation process. The entire analysis has been conducted for a particle of initial diameter Dinitial = 1 μm. (a) Damage profile observed within an active particle after lithiation for which Ω · cmax = 0.7. (b) Damage profile inside the same active particle where Ω · cmax = 0.7 after successive lithiation and delithiation process. Only one cycle has been conducted here. (c) Microcrack density observed within active particles with different magnitudes of partial molar volume (Ω · cmax ). In this particular analysis subsequent lithiation and delithiation occurred. A comparative observation clearly states that majority of the microcrack evolution occurs during the lithiation process.
Time evolution of concentration gradient induced and high volume expansion driven mechanical degradation is demonstrated in Figure 6a. Successive lithiation and delithiation occurred within an active particle of initial diameter 1 μm. The magnitude of non-dimensional partial molar volume is assumed to be Ω · cmax = 0.8. Lithiation occurs between normalized time 0 to 1 and delithiation occurs within 1 and 2. The blue vertical line in both Figures 6a and 6b differentiates between the lithiation and delithiation process. During the delithiation process, concentration gradient induced load controls the formation of microcracks.62 At the beginning of the delithiation process, significant amount of mechanical degradation due to large volume expansion is definitely counter-intuitive (see Figure 6a). This particular phenomenon can be explained from Figure 2d. Even after the end of lithiation, the two-phase front corresponding to the lithiation process keeps on moving inward and vanishes at the center of the active particle. A separate two-phase front corresponding to the delithiation process initiates at the particle surface and moves inward. The lithium rich phase arrives at the center of the active particle at around normalized time 1.25. Due to this inward movement of the lithium rich phase, the outer layer gets pushed along radially outward direction. This results in generation of tensile stress within the lithium rich phase, and subsequently mechanical degradation due to high volume expansion. Once the lithium rich phase reaches the center, volume expansion induced damage almost saturates (black line). Concentration gradient induced degradation keeps on increasing due to inward movement of the two-phase front that belongs to the delithiation process (red line).
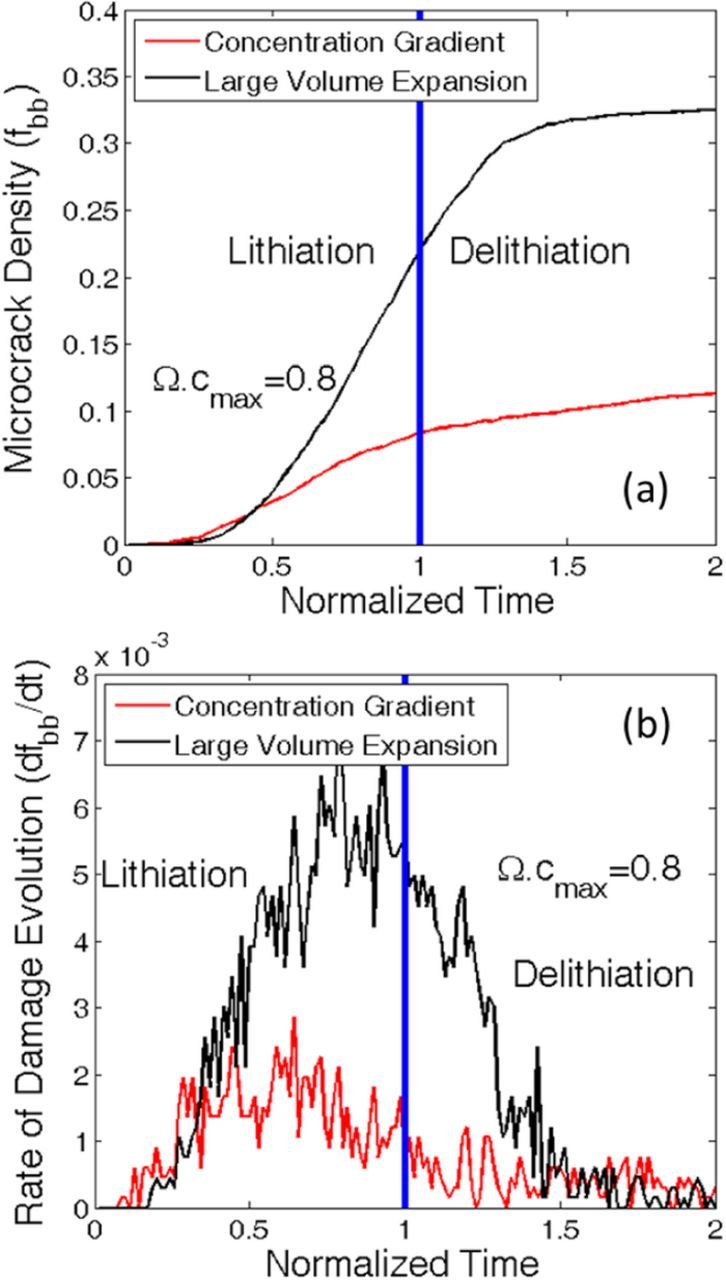
Figure 6. Comparison between damage evolution due to two different mechanisms. For this analysis a particle diameter of D0 = 1 μm has been assumed. In the normalized time scale, time from 0 to 1 corresponds to the lithiation process. Whereas delithiation occurs between time 1 to 2 in the normalized scale. For this particular analysis, the particle displays Ω · cmax = 0.8. (a) Comparison between damage evolution due to concentration gradient effect and microcrack formation because of high volume expansion. (b) Rate of damage evolution due to each of the two mechanisms. From both the figures, it is evident that microcrack evolution within high capacity materials is mostly governed by the volume expansion phenomenon.
Figure 6b depicts the rate of microcrack formation by the two different mechanisms during lithiation and successive delithiation process. Rate of mechanical degradation due to large volume expansion is at a maximum at the end of the lithiation process. At the beginning of the lithiation process, till normalized time 0.3, rate of concentration gradient induced damage (red line) is larger than volume expansion induced degradation (black line). The overall rate of concentration gradient induced degradation is much smaller than that observed due to volume expansion. The same trend is observed even at the beginning of the delithiation process. However, the rate of volume expansion induced degradation decreases as the delithiation proceeds. During delithiation, formation of the lithium poor phase close to the particle surface leads to contraction. This eventually reduces the possibility of microcrack formation due to high volume expansion. Towards the end of the delithiation process, almost negligible mechanical degradation occurs due to high volume expansion. However, a small magnitude of concentration gradient induced damage can still be observed even toward the end of delithiation phenomenon. Hence, from Figures 6a and 6b it can be concluded that concentration gradient induced damage can be observed throughout the lithiation-delithiation process, but the magnitude is extremely small. Whereas, large volume expansion induced degradation occurs at the second half of lithiation and beginning of delithiation process, but in a significantly larger amount.
Till now it has been well established that variation in partial molar volume of the lithiated phase induces different amounts of mechanical degradation within the active particles. Similarly, variation in particle size should also give rise to different magnitude of microcrack density for a particular value of the partial molar volume. In this manuscript, all the analysis of particle size dependence has been conducted for Ω · cmax = 0.8. Figure 7 explains the evolution of mechanical degradation during lithiation for different particle sizes. Damage profiles at the end of lithiation process for two different particles of initial diameter 400 nm and 800 nm are shown in Figures 7a and 7b, respectively. At the end of lithiation process, larger particles experience enhanced mechanical degradation. Several spanning cracks can be observed in the 800 nm sized active particle that travels along the radial direction. Relatively fewer cracks generate inside the 400 nm sized particle at the end of lithiation. More rigorous analysis of how microcrack density changes with particle size is demonstrated in Figure 7c. Increase in particle size leads to more severe mechanical degradation of the active materials. The blue dashed line in Figure 7c corresponds to the total amount of mechanical degradation. The black solid line signifies microcrack formation due to large volume expansion. Whereas the red solid line corresponds to damage evolution under concentration gradient induced load. As observed in Figure 7c, concentration gradient induced damage for active particles with different diameter are significantly smaller than volume expansion induced degradation. For each representative data point, the error bars are generated averaging over ten different samples.
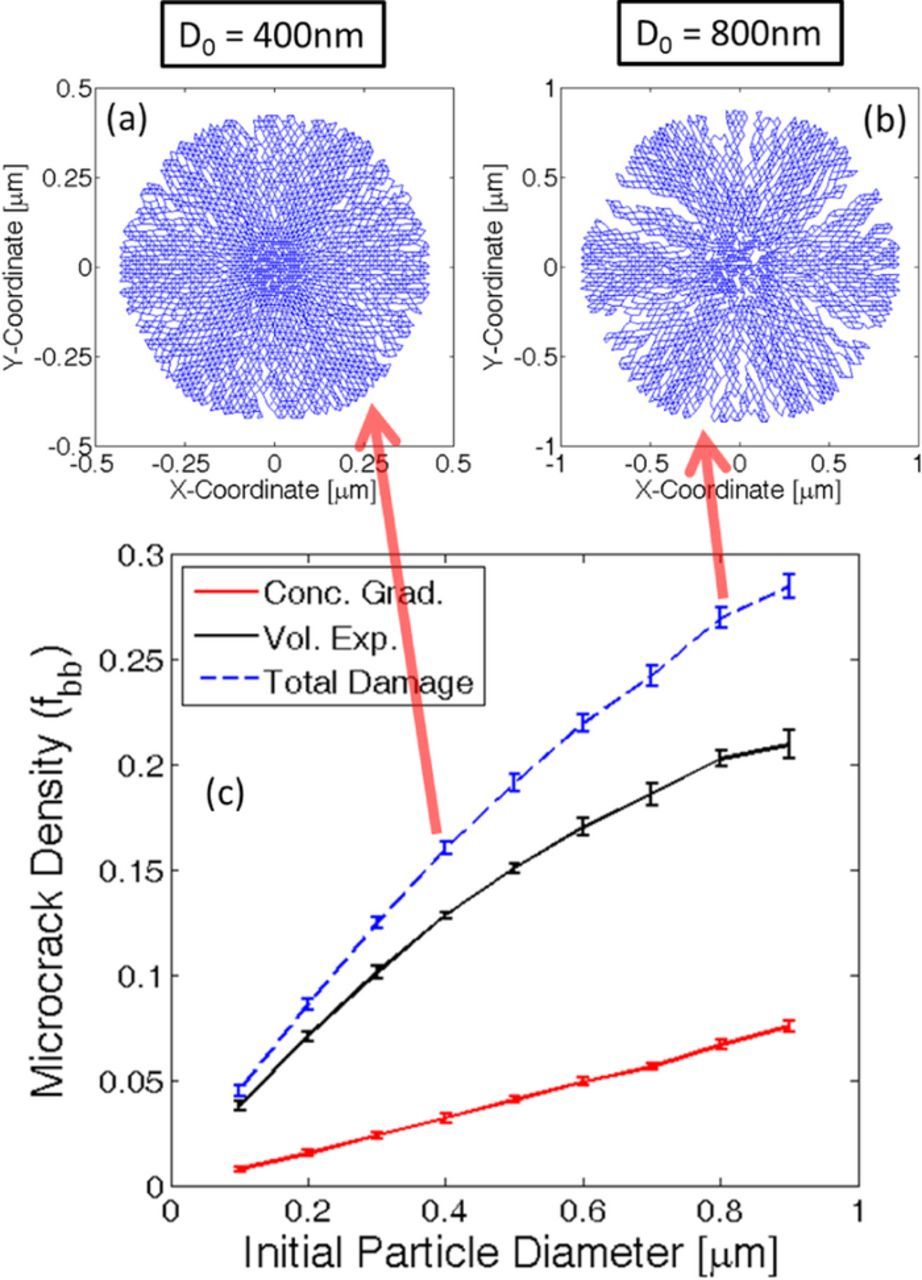
Figure 7. Microcrack density at the end of first lithiation process for different particle sizes. The material under consideration displays Ω · cmax = 0.8. (a) Damage profile observed within an active particle of initial diameter Dinitial = 400nm. (b) Damage profile observed within a larger active particle of diameter Dinitial = 800nm. (c) Total amount of microcrack density after the first lithiation process for different particle sizes (denoted by blue dashed line). Damage evolution due to large volume expansion (black line) and concentration gradient induced load (red line) have also been displayed. The error-bars have been generated by averaging over ten samples.
Damage due to large volume expansion occurs because of the outward movement of lithium-rich phase. For large particles, the lithium rich phase close to the surface moves along the radial direction by a larger extent. This eventually produces enhanced tensile stress and subsequently more mechanical degradation close to the surface of the larger active particles. Concentration gradient induced load is not significant and cannot give rise to severe spanning cracks during the lithiation process. With decreasing particle size the concentration gradient induced tensile load also reduces, which eventually leads to reduction in microcrack formation. Hence, damage due to both large volume expansion and concentration gradient induced load decreases with reduction in particle size.
During operation, lithium ion batteries are subjected to multiple charge discharge cycles. Hence, the active materials located within the electrode experiences several lithiation-delithiation cycles. Mechanical degradation due to only the lithiation process has been investigated till now. If a battery is discharged after the first charge process, the anode active materials experience delithiation right after the completion of lithiation process. Variation in concentration gradient can be assumed to follow the pattern provided in Figure 2c. Evolution of microcrack during delithiation must be investigated to correctly determine the particle size below which mechanical degradation can be neglected even under multiple lithiation-delithiation cycles. Figure 8 demonstrates the microcrack density after lithiation (black square) and successive delithiation (red circle) process. Particle sizes ranging from 100 nm to 500 nm has been analyzed here. After only the lithiation process, even particles as large as 300 nm experiences only 12% mechanical degradation. However, successive delithiation process significantly increases the total amount of microcrack formation. From Figure 8 it can be concluded that even particles of size 200 nm experiences around 15% mechanical degradation after successive lithiation-delithiation process. Whereas, 300 nm sized active particles experience around 22% mechanical degradation after the delithiation process. Microcrack density within particles of initial diameter 100 nm only remains well below 10% even after the delithiation process. Which magnitude of microcrack density is safe and what should be considered as mechanically degraded has not been analyzed yet. A rough estimate will be provided in the next paragraph along with the images of damage profile for different particle sizes.
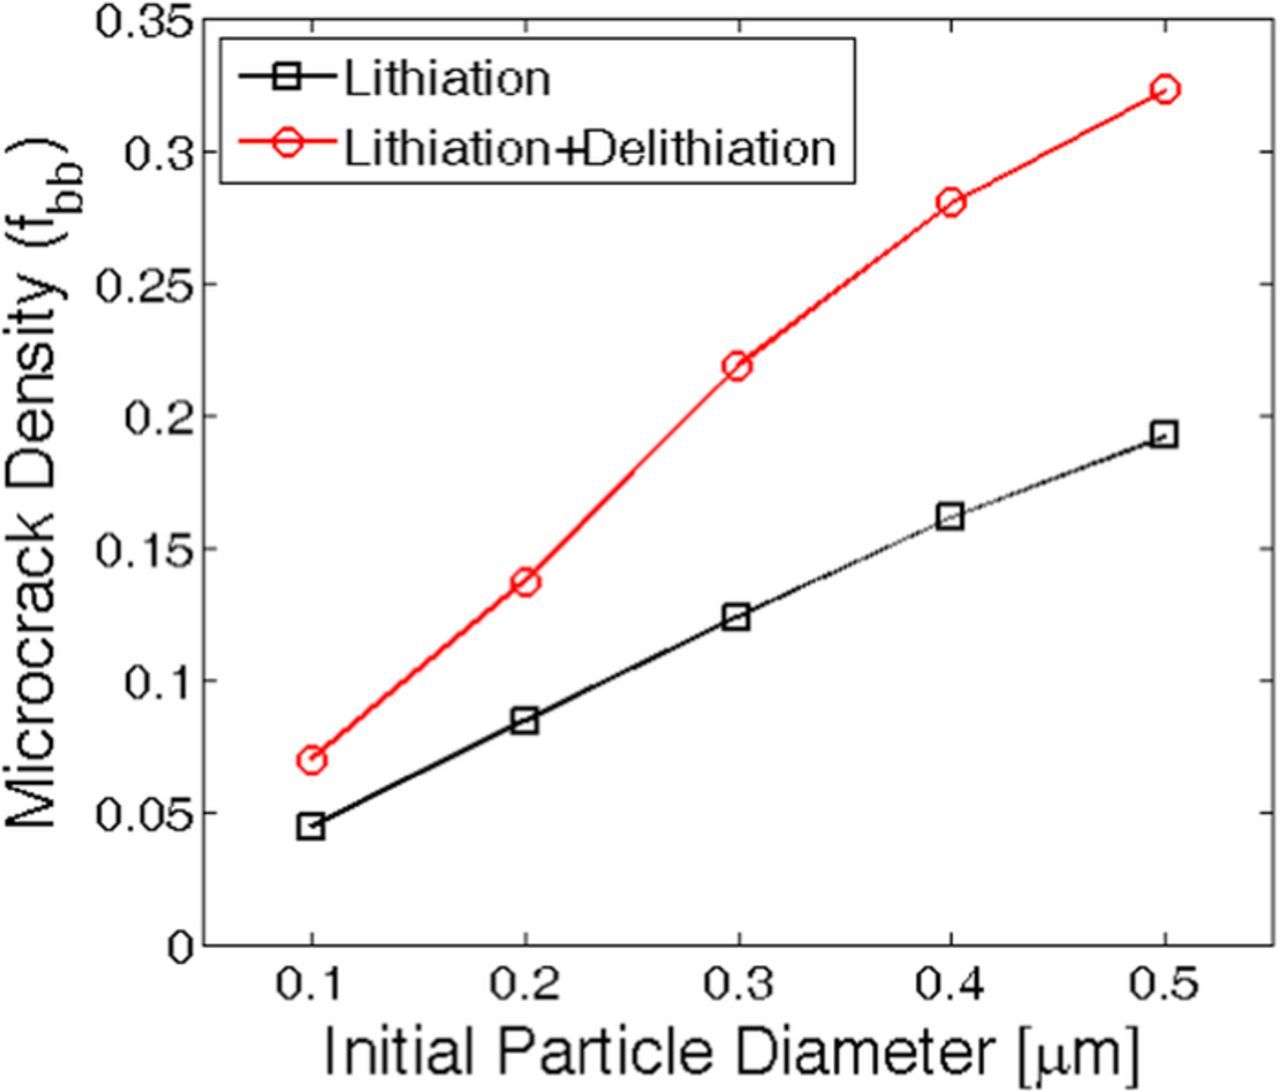
Figure 8. Total amount of microcrack density for active particles of different size under lithiation and successive delithiation process. Smaller active particles of initial diameter 200 or 300 nm, which experience very little mechanical degradation during the lithiation process, can undergo severe crack opening and propagation during the delithiation process.
While analyzing the mechanical degradation, it is assumed that lithiation-delithiation occurs only from the surface of the active particles. If a crack front connected to the surface opens up, electrolyte can flow through the opening, which would allow influx or outflux of lithium to occur form regions other than the particle surface. Hence the computational analysis being conducted here would no longer be valid. Hence, an active particle can be characterized as damaged if one or multiple crack fronts open up during the entire lithiation-delithiation process. For certain intermediate particle sizes, no significant crack fronts develop during the lithiation process. But, during the first half of the delithiation process, some crack propagation and opening is observed. Again, toward the end of the delithiation process these crack fronts close because of contraction. This type of particle fracture can be characterized as minor degradation. Figure 9 demonstrates the damage profile as observed in four different particle sizes of initial diameter D0 = [100; 200; 300; 400]nm during successive lithiation and delithiation process. Damage profiles at four different time instance have been plotted for each of the particle sizes: a) Time t = 0.5t0 which corresponds to midway during lithiation, b) Time t = 1.0t0 that signifies end of lithiation, c) Time t = 1.5t0 which is halfway during the delithiation process, and finally, d) Time t = 2.0t0 that corresponds to the end of delithiation process. The active particles of initial diameter D0 = 300 nm experiences almost negligible degradation at the end of lithiation (see Figure 9j), which approximately equals 12% microcrack density (from Figure 8). But several crack fronts open up during the delithiation process (see Figure 9l), which renders Si active particles of size 300 nm unsuitable for lithiation-delithiation cycles. This corresponds to around 22% microcrack density (as reported in Figure 8). Active particles of initial diameter 200 nm are also not a good choice because minor degradation can be observed halfway into the delithiation process where some crack fronts open up (see Figure 9g). However, these crack fronts eventually close at the end of delithiation process (Figure 9h). But, they have the potential to grow during subsequent lithiation-delithiation cycles. Comparing with Figure 8, 200 nm sized active particles experience around 14% microcrack density at the end of delithiation process. Only 100 nm sized active particles did not experience any damage nucleation. A similar size dependence was also observed experimentally (see24). Hence, it can be concluded that microcrack density below 12% can be characterized as free from mechanical degradation. Minor fracture occurs when microcrack density lies within 12% and 18%. Anything above 18%–20% can be characterized as severe mechanical degradation, which leads to propagation and opening of multiple crack fronts.
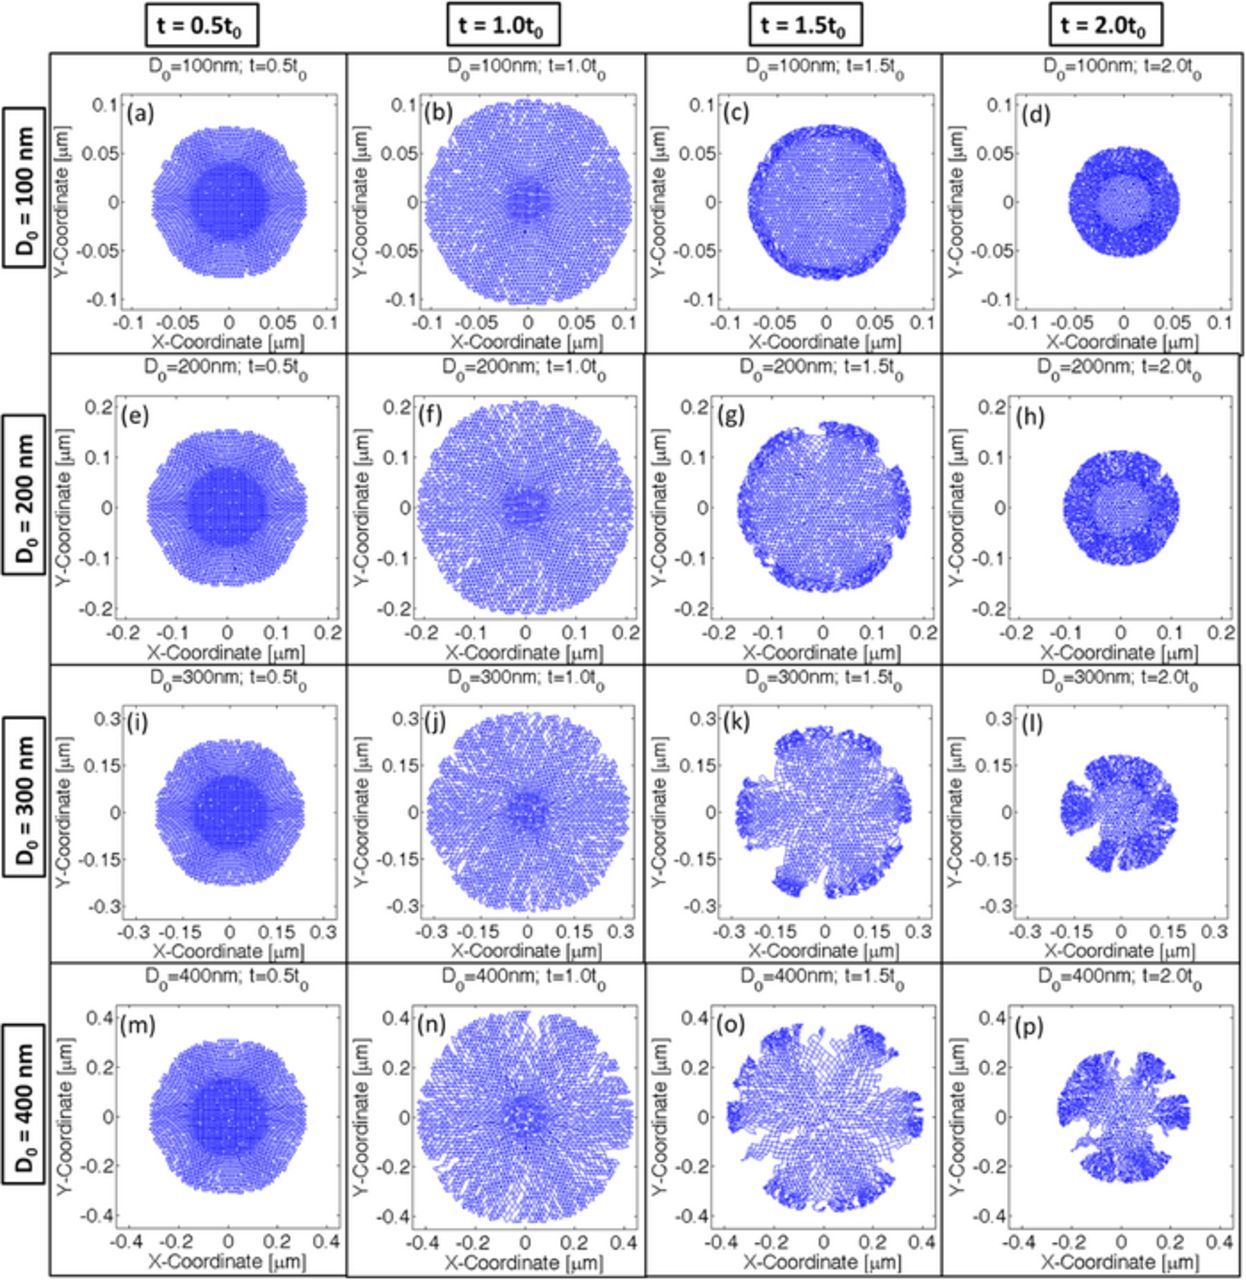
Figure 9. Crack formation within active particles of different size (D0 = [100; 200; 300; 400]nm). Time t = 1.0t0 corresponds to the end of lithiation process, and time t = 2.0t0 corresponds to the end of delithiation process that occurred after lithiation, for all the four different particle sizes analyzed here. Microcrack profiles at four different time instances have been plotted here: half way into the lithiation process, end of lithiation process, halfway into delithiation process and end of delithiation process. (a–d) 100 nm particle size, (e–h) 200 nm particle size, (i–l) 300 nm particle size and (m-p) 400 nm sized particle have been plotted.
The correlation between microcrack density and the amount of fracture propagation has been established in the previous paragraph. Next, it is important to understand how accurately the developed computational model can capture the experimentally observed damage evolution. In Figure 10, a visual comparison of experimentally observed and computationally predicted crack propagation, during the lithiation process is reported (see33). Figure 10b demonstrates the initiation of crack fronts close to the particle surface during the lithiation of a 430 nm diameter silicon active particle. There exist significant amount of similarity between the experimentally observed features (shown in Figure 10a) and the computational predictions (in Figure 10b) in a qualitative sense. Such as, there exists a lithium rich amorphous phase near the surface and a lithium poor crystalline phase at the center of the active particle. Also, the cracks initiate close to the surface of the active particles during the lithiation process. This demonstrates the effectiveness of the developed scheme to capture the microcrack formation within high capacity anode materials. However, there still exist some discrepancies between the experiments and the computational predictions. Even though the initiation of the surface cracks during lithiation is equivalent to the experimental results, the computationally predicted cracks do not open up as much as that observed in SEM images (see Figure 10a). Also, the computational analysis predicts the generation of multiple small crack fronts close to the particle surface. However, the experimental SEM image indicates the formation of a few crack fronts, which tend to propagate along the radial direction. This discrepancy can be attributed to the distribution of the fracture threshold energy adopted in the present study. A uniform distribution of the threshold energy over a wide range has been taken into consideration here. This results in generation of small microcracks throughout the system. Thus significant amount of strain energy release occurs without the formation of large spanning cracks. Detailed analysis of the distribution of the threshold energy is out of the scope of this article, and will be considered as part of a future study.
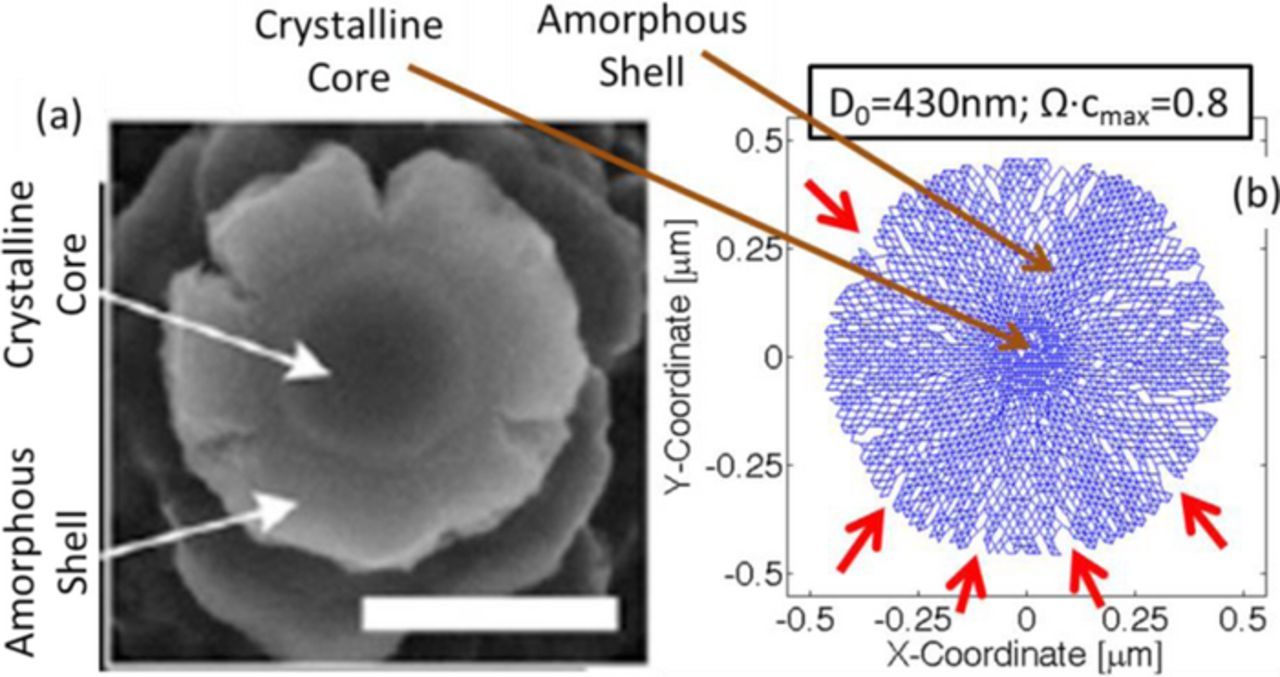
Figure 10. (a) SEM image of the cross-section of a Si nano-pillar which experienced mechanical degradation during lithiation (adopted from Lee et al., PNAS, (2012) 4080). Presence of surface cracks is evident from this image. (b) Crack formation on the surface of active particles as predicted by the developed lattice-spring based numerical technique. The red arrows show crack fronts that develop on the particle surface.
Evolution of mechanical degradation within solid materials can be experimentally characterized by acoustic emission based techniques. Experimental characterization of fracture evolution within Si active particles during lithiation-delithiation cycles, have been reported in several research articles.65,66 The essence of acoustic emission based techniques lie behind the fact that during microcrack formation, some strain energy gets released. It propagates through the media as a stress wave and reaches the surface.59 This stress wave is detected by actuators located on the surface as hits. Multiple hits in a very short period of time correspond to formation and propagation of spanning cracks. Total amount of mechanical degradation can be characterized by the cumulative summation of strain energy detected by the actuator. A similar acoustic emission based experimental procedure have been adopted by Trancot et al. to characterize the evolution of mechanical degradation within a 2 μm sized Si active particle over 10 lithiation-delithiation cycles.66 In the present study, similar lithiation-delithiation simulations have been conducted on a spherical active particle of initial diameter 2 μm over 10 cycles. Figure 11 demonstrates the comparison between evolution of mechanical degradation extracted from simulations (black solid line) and the experimentally observed cumulative damage (blue circles). The cumulative acoustic activity is represented by the units of energy and microcrack density from simulations is characterized as a fraction. Hence, proper normalization of amount of damage should be conducted to achieve a successful qualitative comparison between computation and experiments. In the present context, damage evolution at the end of first lithiation process is assumed to have a magnitude of 1.0. Extremely good qualitative correlations between the computational and experimental results demonstrate the robustness of the developed lattice-spring based methodology.

Figure 11. Qualitative comparison of mechanical degradation predicted by the developed model with experimentally observed acoustic emission response. Amount of mechanical degradation due to high volume expansion (black dashed line) and concentration gradient (red dashed line) induced loading has also been reported. Concentration gradient induced damage evolution almost saturates after the first cycle. However, mechanical degradation due to high volume expansion increases till the fifth or sixth cycle (though the increment is negligible as compared to the first cycle).
It has already been discussed that the evolution of microcrack within phase separating high capacity Si anode active particles occurs through two different mechanisms: a) concentration gradient induced loading, and b) tensile stress caused by high volume expansion. Figure 11 demonstrates the amount of damage evolution over 10 cycles due to each of the two mechanisms. Red dashed line indicates microcrack due to concentration gradient, and black dashed line corresponds to microcrack under high volume expansion. From Figure 11 it can be concluded that concentration gradient induced degradation occurs only in the first lithiation-delithiation cycle and saturates after that from the second cycle. However, damage evolution due to high volume expansion does not saturate after the first cycle. Majority of the mechanical degradation under large volume expansion occurs during the lithiation process (see66). Maximum amount of fracture formation due to volume expansion occurs in the first cycle (also reported in65). Significant amount of microcrack evolution can still be observed in the second, third and fourth lithiation process. Eventually from the fifth cycle onwards, large volume expansion induced microcrack formation also tends to saturate. This saturation in mechanical degradation is explained from the perspective of strain energy release requirement to sustain a certain amount of externally applied load. During each lithiation-delithiation cycles, the same amount of diffusion induced load is applied on the system. The total amount of strain energy release required to sustain that amount of load, occurs within the first four to five cycles. Strain energy release happens through the formation of microcracks. Since, after four-five cycles, no more strain energy release is required to withstand the external load, the total amount of microcrack also saturates (also provided in53).
After validating the developed computational procedure, it is important to investigate and propose some modifications that can reduce the overall microcrack formation. Mechanical degradation usually occurs to release the excessive strain energy stored within the system.53 If it is somehow possible to reduce the total amount of strain energy stored within the system, overall mechanical degradation can be minimized. Two different procedures to reduce the overall stored strain energy have been elaborated in Figure 12. Since majority of the cracks initiate at the particle surface, reducing the elastic modulus close to the outer surface can result in smaller magnitude of strain energy. Based on this strategy, a new functionally graded material has been suggested in Figure 12a. The elastic modulus decreases close to the particle surface according to the profile shown. From the center to a radius of 0.7R, the stiffness remains equal to the pristine material. From 0.7R to R, the elastic modulus decreases linearly from the pristine amount to a value that is one-fourth in magnitude of the actual modulus. The second technique takes into consideration that pre-existing cracks help in reducing the total amount of stored strain energy.67 The circular cross section of a spherical active particle that contains a pre-existing crack is shown in Figure 12b. Depending on the length of the pre-existing crack, different magnitude of strain energy gets released. Effectiveness of these two mechanisms in terms of decreasing the total magnitude of microcrack formation during lithiation-delithiation cycles, will be discussed next.
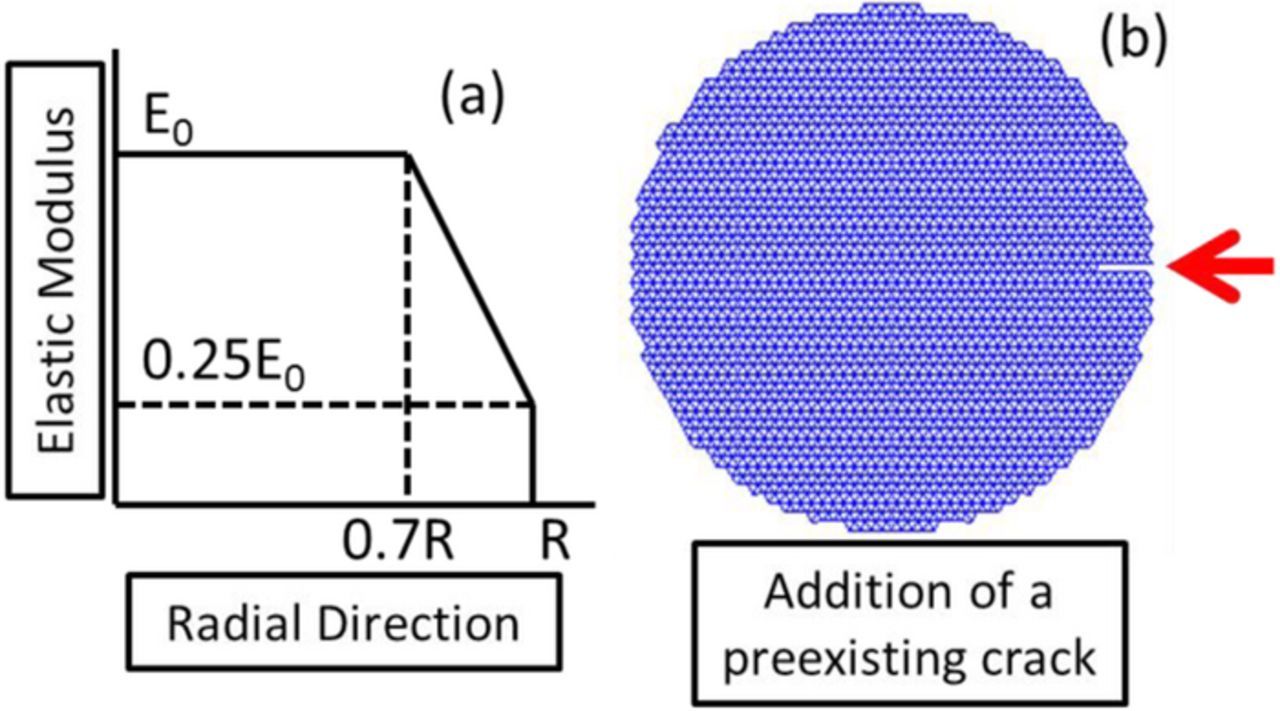
Figure 12. Two different methods have been proposed here that can be used to minimize the total amount of microcrack formation. (a) A novel "graded-by-elastic-modulus" design. Reduced elastic modulus of the active particle close to the surface is the main feature of this technique. (b) Addition of a thin pre-existing crack inside the particle. Length of the crack is supposed to impact the amount of strain energy release.
Fractional microcrack density has been reported in Figure 13 for different length of pre-existing cracks = [ 0.0, 0.05, 0.1, 0.15, 0.2, 0.25, 0.3, 0.35, 0.4, 0.45, 0.5 ] ) within the solid active particle. Here a denotes the pre-existing crack length and D0 signifies the initial diameter of the active particle. For this particular analysis, D0 = 300 nm and normalized partial molar volume Ω · cmax = 0.8, has been assumed. It is expected that increasing length of the pre-existing crack should help in reducing the stored strain energy. Eventually this should result in decreased microcrack formation. Figures 13a and 13b shows the microcrack profile after successive lithiation-delithiation process for normalized pre-existing crack lengths of 0.2 and 0.4, respectively. For
  = 0.2, the pre-existing crack does not propagate significantly. However, for normalized crack length of 0.4, the pre crack opens up and propagates significantly during the lithiation-delithiation process. For relatively small cracks, the stress concentration at the crack tip is not sufficient to make them propagate along the radial direction.
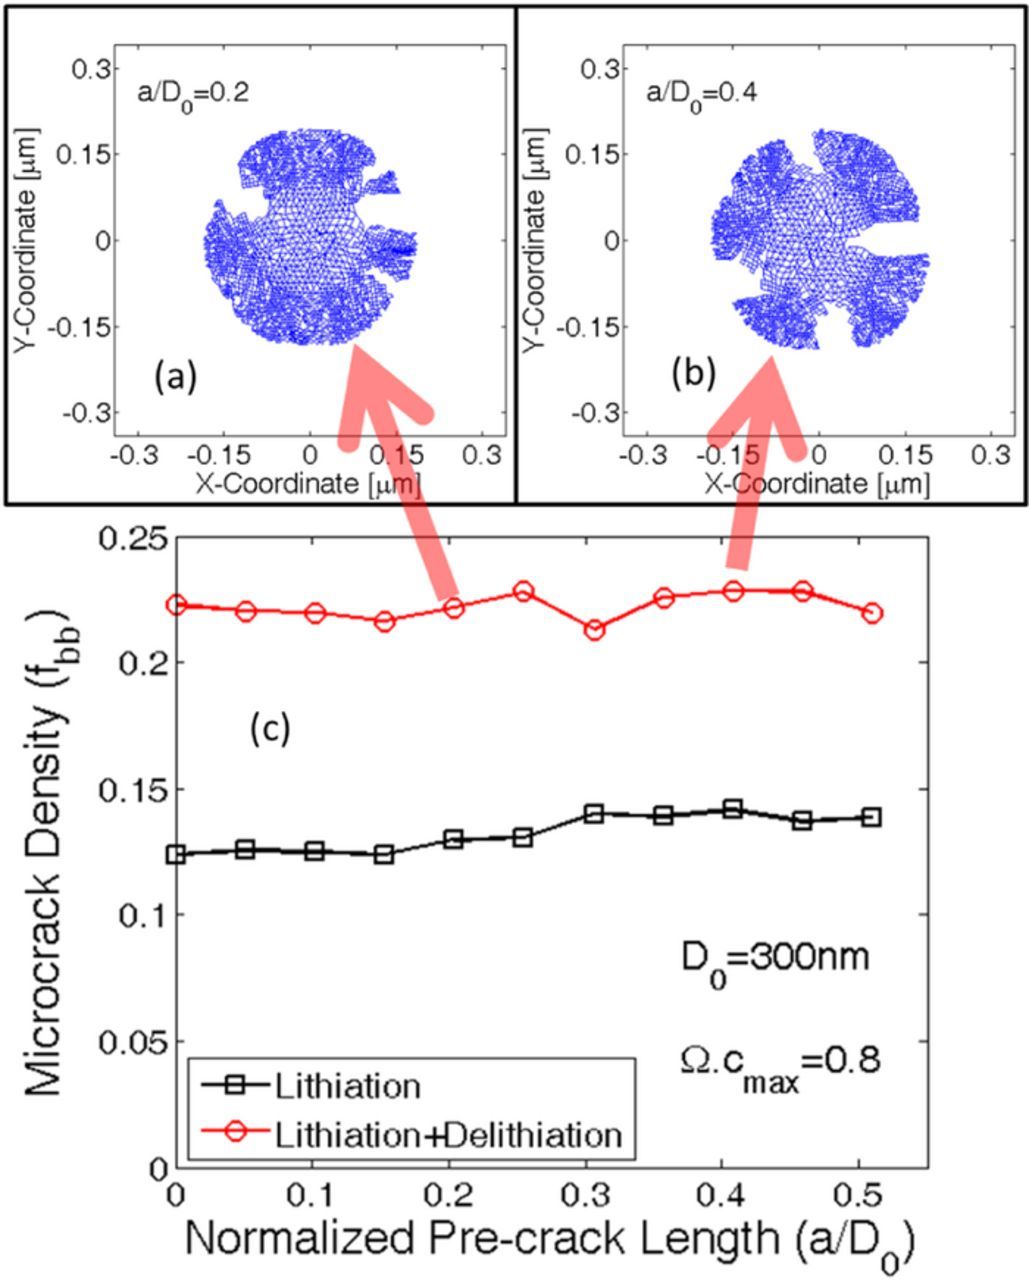
Figure 13. Analysis of how the presence of a preexisting crack impacts the microcrack formation in an active particle of initial diameter 300 nm has been reported here. (a) For a normalized preexisting crack length of 0.2, none of the spanning crack fronts initiate from the initial imperfection. (b) For very large preexisting cracks of normalized length 0.4 or higher, stress concentration at the crack tip may overcome the disorder effect resulting in propagation of the initial imperfection. (c) Microcrack density at the end of lithiation and successive delithiation process inside various active particles containing different length of initial imperfections. Presence of preexisting crack does not have a significant impact on the overall microcrack formation.
It is also important to properly estimate the magnitude of microcrack density in order to determine the effectiveness of adding pre-cracks. Figure 13c demonstrates the magnitude of mechanical degradation experienced by active particles containing different size of the initial imperfection. The black square signifies fracture evolution till the end of lithiation process. The red circles correspond to damage formation at the end of delithiation process, which occurred after the initial lithiation. It is evident from Figure 13c that incorporation of initial imperfection does not help in reducing the total amount of microcrack formation. To understand why incorporation of pre-existing cracks does not help in reduction of microcrack evolution, it should be properly realized that the distribution of fracture threshold is conducted in a random fashion. A pre-existing crack is assigned without taking into consideration the distribution of fracture threshold. During formation of the initial-imperfection, the lattice-spring elements that are removed from the network may not belong to the group of weak springs. Under externally applied diffusion induced load, the relatively weak lattice-spring elements experience rupture irrespective of their location. Unless the pre-existing crack is capable of removing some of the weak lattice-springs, introduction of an initial imperfection does not help in reducing the overall mechanical degradation.
Effectiveness of functionally graded materials in mitigating the problem of mechanical degradation will be investigated next. The type of functionally graded material considered here shows reduced elastic modulus close to the surface of the particle (also depicted in Figure 12a). A comparative demonstration of the amount of microcrack density for functionally graded and regular silicon material has been provided in Figure 14. Five different active particle sizes of initial diameter 100 nm, 200 nm, 300 nm, 400 nm and 500 nm have been taken into consideration. All the particles are subjected to successive lithiation-delithiation procedure. In Figure 14, the blue dashed and solid lines with triangular symbols signify the magnitude of mechanical degradation after the lithiation-delithiation procedure within the functionally graded Si and regular Si material, respectively. The dashed blue line lies well below the solid blue one. It is evident from Figure 14 that functionally graded materials are effective in reducing the mechanical degradation to some extent. Under externally applied load evolution of microcrack occurs to release the extra strain energy stored within the material. Total amount of strain energy depends on the elastic modulus of the system. Under a fixed amount of external load, reduction in elastic stiffness results in smaller magnitude of strain energy generation. Hence, the functionally graded material needs to release less strain energy than the regular silicon material. As a result smaller magnitude of microcrack evolution happens for the material with reduced elastic modulus.
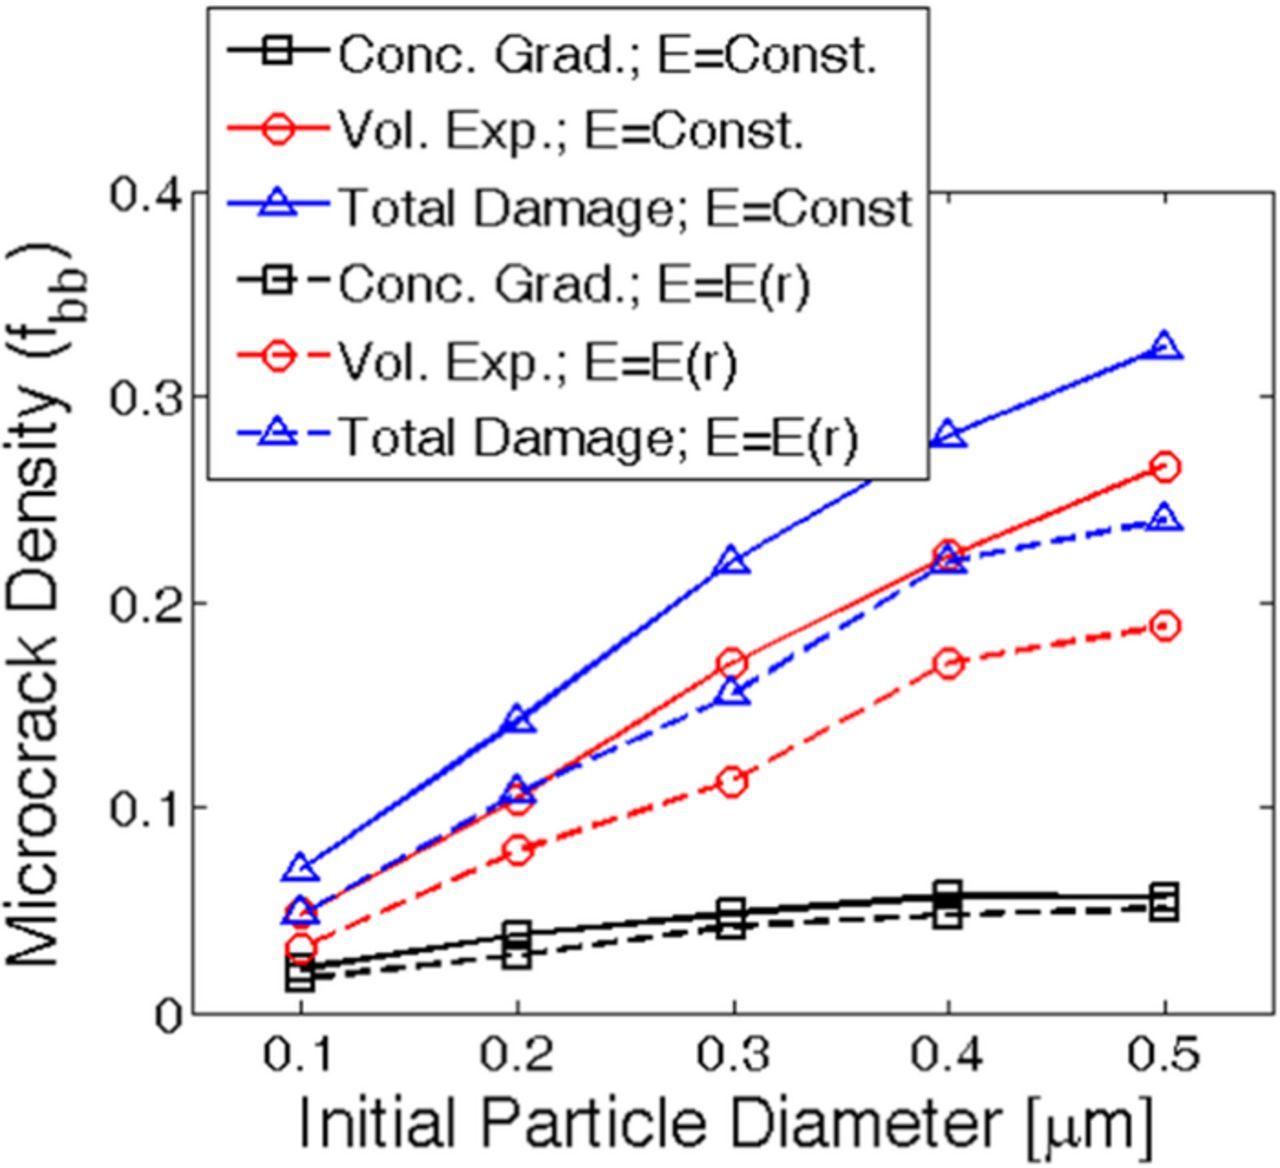
Figure 14. Comparison between the amount of mechanical degradation due to concentration gradient (square symbol) and volume expansion (circular symbol) induced load. The total damage is denoted by triangular symbols. The solid lines signify mechanical degradation under constant Young's modulus, whereas the dashed lines correspond to microcrack formation with reduced elasticity parameters. A comparative analysis shows that reduction in elastic modulus significantly decreases the volume expansion induced mechanical degradation (compare between the red solid and red dashed lines). As a result, the overall microcrack formation gets diminished significantly with graded elastic parameters (compare between the blue solid and the blue dashed line).
It is clearly demonstrated in the previous paragraphs that the usage of functionally graded silicon active materials significantly reduces the overall mechanical degradation. There exist two different mechanisms of microcrack formation: a) Concentration gradient induced, and b) High volume expansion induced. It is worth to investigate which mechanism is affected more due to the reduction in elastic modulus close to the surface of the active particle. Figure 14 demonstrates a comparative analysis of mechanical degradation due to both the mechanisms within regular (solid line) and functionally graded (dashed line) silicon active particles. The red circles signify damage due to large volume expansion and black squares correspond to damage under concentration gradient induced load. It is evident that reduction in elastic modulus close to the surface of the active particle decreases microcrack evolution due to both the mechanisms. For an active particle of initial diameter 300 nm, rupture due to high volume expansion gets mitigated by approximately 7%. However, rupture under concentration gradient induced load decreases by only 1%. During expansion of the lithium rich phase, outer-most surface of the active particle experiences maximum amount of tensile load. Hence, large volume expansion induced fracture initiates at the particle surface and propagates along the radially inward direction. Whereas, concentration gradient induced load evolves throughout the particle. In the functionally graded Si, minimum elastic modulus occurs at the particle surface. Hence, reduction in strain energy reaches maximum near the surface of the functionally graded silicon active particle. Fracture happens to release the excessive strain energy stored within the system. Since less strain energy gets developed within functionally graded materials near particle surface, smaller amount of it needs to be released. Hence, lesser magnitude of microcrack evolves near the particle surface. As a result, mechanical degradation under large volume expansion induced load decreases significantly. Since concentration gradient induced degradation develops uniformly throughout the particle, reduction in elastic modulus close to the surface marginally mitigates damage evolution under this mechanism. Hence, it can be concluded that, usage of functionally graded silicon active particles significantly reduces the large volume expansion induced mechanical degradation.
The next important thing is to characterize whether the reduction in mechanical degradation experienced by functionally graded silicon active particles are sufficient from a practical perspective. It was concluded from Figures 8 and 9 that regular silicon active particles of size 100 nm and less do not experience any fracture. Silicon active particles of size 200 nm and higher goes through some amount of rupture and spanning crack propagation. Using functionally graded silicon, it will be investigated whether it is possible to increase the maximum particle size limit of zero fracture. Figure 15 shows the damage profile experienced by 200 nm and 300 nm sized functionally graded silicon active particles during successive lithiation-delithiation procedure. The four snapshots of damage profiles are obtained at midway into the lithiation (t = 0.5t0), end of lithiation (t = 1.0t0), halfway into delithiation (t = 1.5t0) and end of delithiation process (t = 2.0t0). From Figure 15 and comparing it with the values obtained from Figure 14, particles of initial diameter 200 nm show around 11% microcrack density at the end of delithiation. This corresponds to zero formation of spanning cracks with functionally graded silicon materials. Whereas 300 nm sized particles that used to observe severe fracture with regular silicon material, experiences around 16% microcrack density with the functionally graded material. It is evident that 300 nm sized particles show some crack opening during the first half of the delithiation process (see Figure 15g), but most of them close at the end of delithiation (Figure 15h). The lithiation process is almost free from spanning cracks for the 300 nm sized active particles (Figure 15f). According to our definition (elaborated while explaining Figure 9), 300 nm sized functionally graded silicon active particles belong to the range of minor fracture. This is also evident from 16% microcrack density. Hence, it can be concluded that using functionally graded silicon material, active particles of size 200 nm and smaller can be characterized as zero damage materials during lithiation-delithiation cycles.
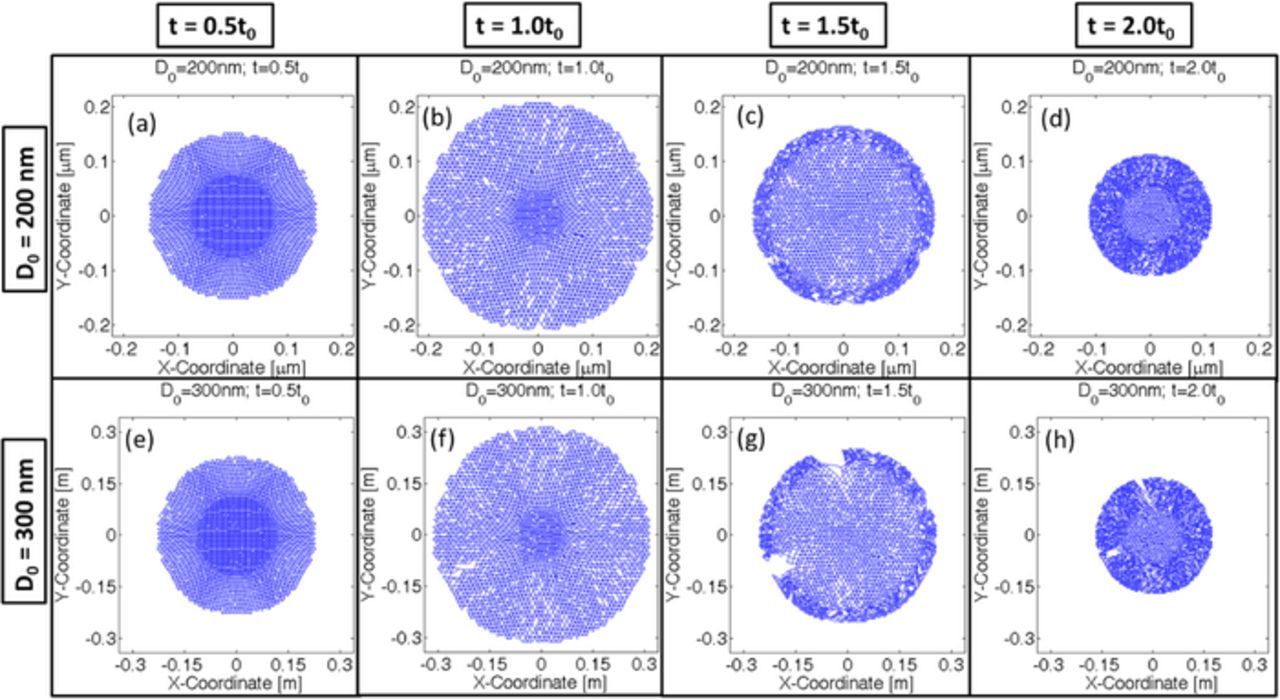
Figure 15. By applying the gradient in elastic modulus, reduction in mechanical degradation can be achieved. Time t = 1.0t0 corresponds to end of lithiation process. Delithiation occurs between time 1.0t0 and 2.0t0. (a-d) Damage evolution within an active particle of initial diameter 200 nm during lithiation and delithiation. (e-h) Damage evolution inside a 300 nm diameter active particle during lithiation and delithiation. Application of gradient in elastic modulus almost mitigates spanning crack formation within 200 nm sized active particles. Damage evolution in 300 nm sized particles reduces significantly (compare with Figure. 9(i-l)).
Finally, a phase map is provided in Figure 16 to demonstrate the different combinations of particle diameter and the partial molar volume that gives rise to different amounts of mechanical degradation. This study has been conducted for regular silicon active particles with constant elastic modulus along the radial direction. The color bar signifies the microcrack density at the end of successive lithiation-delithiation procedure. Smaller sized particles (around 100 nm) experience very little mechanical degradation even for very high partial molar volumes Ω · cmax = 0.9. Whereas, the large sized particles, which has a diameter greater than 1 μm, experiences severe fracture with partial molar volume as low as Ω · cmax = 0.5. From Figure 16 it is evident that even for extremely large sized particles (around 5–10 μm in diameter), there exists a certain magnitude of partial molar volume, around Ω · cmax = 0.3, below which almost zero fracture is observed. However, the high capacity anode materials (such as, Si and Sn) shows partial molar volumes of magnitude 0.7 or 0.8 for the lithiated phase. Hence, the region of interest for the present analysis is highlighted in Figure 16 using the red oval shaped object. Particles of size 100 nm or 150 nm will be free from mechanical degradation (also supported experimentally24). Anything larger than that will experience fracture (demonstrated in Figures 8 and 9). This eventually leads to capacity fade due to the formation of solid electrolyte interface at the cracked surface. Hence, improved cyclic performance can be obtained for Si and Sn active particles of size 100 nm or smaller. Usage of functionally graded materials (see Figure 12a) can increase the maximum particle size of zero fracture from 100 nm to 200 nm (demonstrated in Figures 14 and 15).
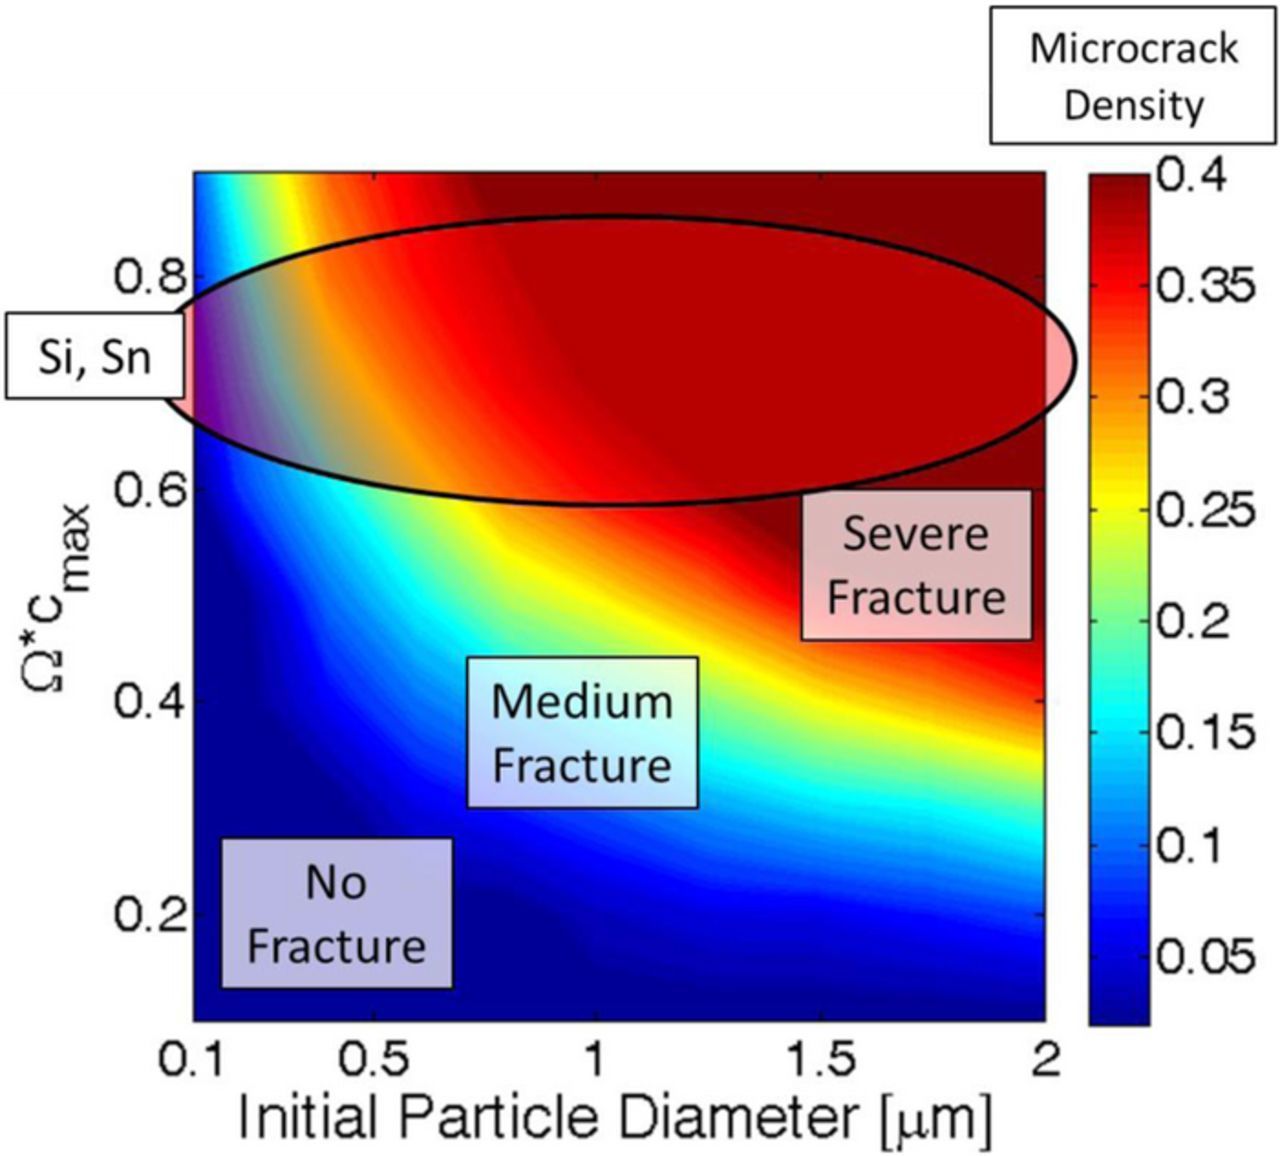
Figure 16. A phase map between particle size and partial molar volume to explain the amount of mechanical degradation observed during a single lithiation-delithiation cycle. The "colorbar" indicates amount of microcrack density. Three regions can be separately identified: a) If the amount of microcrack formation is less than 0.12, it can be characterized as "no fracture" region. b) If the total mechanical degradation is within 0.12 and 0.18, it can be categorized as medium fracture zone. Here, cracks open up during the lithiation process, but after complete delithiation, those crack fronts tries to close. c) Finally, if the microcrack density is greater than 0.18, severe mechanical degradation occurs, and spanning cracks are observable that also propagates. The portion where Si and Sn based anode active materials lie are shown using the red oval shaped object.
Conclusions
High-capacity anode materials, such as, silicon (Si) and tin (Sn) are promising candidates that can replace graphite in the next generation lithium-ion batteries. The penalty for achieving high-capacity in Si and Sn, however, comes in the form of large volume expansion that leads to severe mechanical degradation, and resultant capacity fade. Particle isolation can also lead to loss of active sites because of detachment from the conductive additives. In this work, a computational methodology has been developed which is capable of capturing the phase front formation and movement during the lithiation and delithiation process. In the present study, lithiation-delithiation under high C-rate operation or in large sized particle is specifically considered, where the development of phase front shows distinct characteristics. Variation in the lithium transport due to changes in volume of the active particle has not been taken into account in the present study, and will be investigated as part of a future article. It is worth highlighting that the key question arising from the role of the concentration gradient at the phase front and the effect of high volume expansion on the mechanical degradation in high-capacity, alloying electrodes has been elucidated in this study.
Figure A1. Evaluation of the system size dependence for the triangular mesh adopted in this study under large deformation conditions. Ω · cmax = 0.6 and initial particle radius Rinitial = 1.0 μm have been adopted for this analysis. It is evident that deformation experienced by a particle tends to converge to a particular value with increasing system size. To keep the computational expense within reasonable limits, L = 70 has been considered for all the simulations reported in this article.
To capture the mechanical degradation due to the two-phase transport of lithium in active particles, an updated lagrangian based lattice-spring methodology has been developed, which includes a nonlinear strain displacement relation. Along with axial stiffness, shear resistance of the spring elements has also been taken into account. Larger magnitude of partial molar volume of the lithiated phase gives rise to not only higher concentration gradient induced load, but also larger tensile force under high volume expansion. Hence, increased partial molar volume of the lithiated phase generates enhanced mechanical degradation. Large active particles also experience higher magnitude of volume expansion induced load. Hence, reducing the particle size significantly decreases the amount of microcrack density at the end of lithiation-delithiation process. Silicon active particles of initial diameter 100 nm and smaller, experience negligible fracture during operation. A phase map has also been generated to demonstrate the amount of mechanical degradation that evolves during one lithiation-delithiation cycle. Different initial particle diameters and partial molar volume values of the lithiated phase has been considered for the construction of the phase diagram.
Microcrack formation and evolution reduces the excessive strain energy stored in the material under externally applied loads. If the material can be modified in such a way that less strain energy is generated, reduced mechanical degradation may be observed. In this regard, two different techniques have been investigated that are capable of reducing the overall microcrack formation in silicon active particles. The first one involves the introduction of a microcrack at the surface of the particle. The second technique considers a functionally graded silicon active particle, which shows reduced elastic modulus close to the particle surface. It has been deduced that introduction of an external crack is not quite effective in reducing the overall microcrack density. However, functionally graded silicon particles with reduced elastic modulus close to the surface can be truly effective in reducing the evolution of mechanical degradation. Usage of functionally graded silicon can also allow larger sized Si active particles; for example increasing the maximum active particle size, from 100 nm to 200 nm, shows negligible fracture.
List of Symbols
| cs | space and time dependent lithium ion concentration within the solid phase |
| cs, max | maximum lithium concentration that can be stored in silicon |
 |
non-dimensional concentration variable |
| t | normalized time variable |
| MLi | mobility of lithium within the solid phase |
| R | universal gas constant |
| T | cell temperature, reference temperature |
| r | normalized radial direction within the solid phase (varies between 0 and 1) |
| Iapplied | total current applied to the system |
| S | electrochemically active surface area of the entire electrode |
| F | Faraday's constant |
| DLi | intrinsic diffusivity of lithium within the solid phase |
| t + ΔttSij | the 2nd Piola-Kirchhoff stress tensor which is unknown |
| t + ΔtR | the unknown residual |
| tui | the incremental displacement which is being solved for |
| xj | the spatial coordinates |
| E | Young's modulus |
| ltotal | total length of the lattice spring elements under the effect of concentration profile |
| lelastic | elastic length of the lattice springs to sustain the mechanical equilibrium |
 |
normalized increment in concentration gradient |
| L | initial length of the spring elements (equilibrium length without any external load) |
| Δl | change in length that causes mechanical force generation |
 |
global force vector in each spring |
 |
global displacement vector in each spring |
| t0 | corresponds to a normalized time when the lithiation process ends |
| tu | axial displacement |
| tv | transverse displacement |
| tu1 | axial displacement of node 1 |
| tu2 | axial displacement of node 2 |
| tv1 | transverse displacement of node 1 |
| tv2 | transverse displacement of node 2 |
| l | present length of the lattice spring element |
| [T] | transformation matrix |
| ua | axial displacement of the spring element |
| ut | transverse displacement of the spring element |
| Rinitial | initial outer radius of the active particle |
| Rfinal | final outer radius of the active particle |
Greek
| ∇ | the gradient operator |
| ∇2 | the Laplacian operator |
| μ | chemical potential of the active particle |
| ω | enthalpy of mixing |
| κ | energy associated with concentration gradient |
| t + Δttεij | the Green-Lagrange strain tensor which is unknown |
| δ | the variation symbol |
| Ω | partial molar volume of the lithiated phase |
| ψn + 1e | strain energy of a spring after the (n+1)-th step |
| ψne | strain energy of a spring after the n-th step |
| ψe, t | threshold energy for each spring |
| θ | angle the lattice spring element makes with the global x-direction |
Acknowledgments
Financial support from NSF, grant no. 1438431, is gratefully acknowledged. PB also acknowledges support from the Texas A&M University Ph.D. Dissertation Fellowship and the Texas A&M Energy Institute's ConocoPhillips Graduate Fellowship.
: Appendix A
While solving for the diffusion of lithium within solid spherical active particles, variation in concentration only along the radial direction is taken into consideration.50 Lithium concentration along the azimuthal directions is assumed to be symmetric. Thus the fourth order governing differential equation can be simplified into two-second order governing differential equations along the radial direction:50
![Equation ([A1])](https://content.cld.iop.org/journals/1945-7111/163/6/A1120/revision1/d0011.gif)
![Equation ([A2])](https://content.cld.iop.org/journals/1945-7111/163/6/A1120/revision1/d0012.gif)
The second boundary condition on the surface of the particle also simplifies to:
![Equation ([A3])](https://content.cld.iop.org/journals/1945-7111/163/6/A1120/revision1/d0013.gif)
Backward Euler time integration is implemented for integrating Eq. A1 over time.39 The governing differential equation is solved using finite difference scheme. The second order terms are discretized using central differencing scheme because of higher accuracy. In the discretization process, n signifies the time step, k stands for the iteration number and i corresponds to the spatial steps. n-th time step is the previous known time step and (n + 1)-th time step is the unknown that we are solving for. The previous iteration is denoted as k-th iteration and the present iteration is represented by (k + 1)-th. The final discretized expression for both Eq. A1 and A2 are written as:
![Equation ([A4])](https://content.cld.iop.org/journals/1945-7111/163/6/A1120/revision1/d0014.gif)
![Equation ([A5])](https://content.cld.iop.org/journals/1945-7111/163/6/A1120/revision1/d0015.gif)
Implementation of the boundary condition is conducted as follows:
![Equation ([A6])](https://content.cld.iop.org/journals/1945-7111/163/6/A1120/revision1/d0016.gif)
![Equation ([A7])](https://content.cld.iop.org/journals/1945-7111/163/6/A1120/revision1/d0017.gif)
Here, the mobility term is defined as:
![Equation ([A8])](https://content.cld.iop.org/journals/1945-7111/163/6/A1120/revision1/d0018.gif)
Both the discretized Eq. A4 and A5 along with the boundary conditions A6 and A7 are solved in a fully coupled fashion to obtain the evolution of lithium concentration along the radial direction.
: Appendix B
In this article mechanical degradation along the cross section of a spherical particle has been investigated. Hence, mechanical deformation occurs in a 2 D plane. Displacement in both "x" and "y" direction should be taken into consideration. The lattice springs are 1D element, but they can be oriented in any direction to take into consideration the effect of 2D geometry. Displacement of these elements along both "x" and "y" directions will be taken into account. In a local coordinate frame, suppose "x" signifies the local axial direction and "y" signifies the local transverse direction, which is also perpendicular to the local axis. Since the aim of the solution process is to minimize the residual, or make the residual zero, the governing equation can be modified for the lattice spring elements and written as:55
![Equation ([B1])](https://content.cld.iop.org/journals/1945-7111/163/6/A1120/revision1/d0019.gif)
The equation given above only takes into account the axial stress (t + ΔttSxx) and shear stress (t + ΔttSxy) due to the transverse displacements. Here, x denotes the local axial direction, tu signifies the axial displacement and tv corresponds to the displacement along the transverse direction. All the displacements are incremental in nature. Applying the variation over all the displacement terms:
![Equation ([B2])](https://content.cld.iop.org/journals/1945-7111/163/6/A1120/revision1/d0020.gif)
Separating out the linear and the nonlinear components, the equation mentioned above can be written in a vector/matrix form as:
![Equation ([B3])](https://content.cld.iop.org/journals/1945-7111/163/6/A1120/revision1/d0021.gif)
The first integral on the left hand side gives rise to the linear stiffness matrix and the second integral forms the nonlinear component of the stiffness matrix. Derivatives of the axial displacement (u) and the transverse displacement (v) along the axial direction can be written as:56
![Equation ([B4])](https://content.cld.iop.org/journals/1945-7111/163/6/A1120/revision1/d0022.gif)
Here, tu1 and tu2 are the axial displacement of node 1 and 2, tv1 and tv2 are the transverse displacement of node 1 and 2, and l is the current length of the lattice spring element. The local displacements can be written in terms of global displacement components using the coordinate transformation matrix:
![Equation ([B5])](https://content.cld.iop.org/journals/1945-7111/163/6/A1120/revision1/d0023.gif)
Here,  is the local displacement vector and
  corresponds to the global displacement vector. The rotation matrix ([T]) mentioned in the previous equation can be written in terms of the angle (θ) the element makes with the x-axis of the global reference frame:
![Equation ([B6])](https://content.cld.iop.org/journals/1945-7111/163/6/A1120/revision1/d0024.gif)
Since the rotation matrix [T] is orthogonal in nature, multiplication of [T] with its transpose gives rise to an identity matrix. Hence, the nonlinear term in Eq. B3 does not show any dependence on the rotational configuration of the spring element.
The axial and shear strains are written in terms of the axial displacement (ua = Δl) and shear displacement (ut = tv2 − tv1) as:
![Equation ([B7])](https://content.cld.iop.org/journals/1945-7111/163/6/A1120/revision1/d0025.gif)
Here, the magnitude of Δl is obtained from Eq. 6 given in the main text. However, in Eq. 6, while calculating the total length, the most updated x and y coordinates are used. In Eq. 4, to obtain the normal component of the 2nd Piola-Kirchhoff stress, the axial strain is multiplied with the Young's modulus. In that expression, complete nonlinear form of the axial strain is taken into consideration. However, in Eq. B3, to maintain linearity of the first integral in the left hand side (which also gives rise to the linear component of the stiffness matrix), the nonlinear components in the axial strain term is neglected. This does not affect the overall solution because during the residual calculation, correct expression of the normal strain is being used.55 Minor modification in the stiffness matrix makes the convergence of the final solution slightly slower.
: Appendix C
After calculating the concentration profile, it is applied on top of a Si active particle. Response of the particle against the diffusion induced load is analyzed. The Si active particles are modeled using the modified lattice spring elements. It successfully takes into account the large deformation experienced by high capacity anode materials. The size of the lattice spring network used to model a single active particle should be large enough to successfully capture the continuum behavior of the material. Extremely small size of the lattice spring network renders wrong results. Increasing the size of the network will indeed produce more accurate results. But the computational time required to conduct the analysis will increase significantly for very large lattice-spring systems. Thus an optimum size of the lattice spring network must be identified that will give a reasonably accurate result under acceptable amount of computational time. Figure A1 demonstrates an analysis showing the effect of increasing lattice-spring system size on the ratio of final particle radius over initial particle radius at the end of lithiation process. The partial molar volume assumed in this particular analysis is Ω · cs, max = 0.6. The initial particle radius considered for this study is Rinitial = 0.5 μm. No mechanical degradation has been considered in this analysis of system size independence. It is evident from Figure 5 that with increasing system size, the ratio  converges to a particular value. However, for lattice spring systems of size L = 90 or greater, the computational expense to construct and solve the stiffness matrix for a single particle becomes excessively large. Thus L ⩾ 90 is not suitable for simulation of mechanical degradation within active particles. The ratio of final over initial radius for L = 70 resides close to the final converged solution, which is highlighted using a red box in Figure 5. The computational time requirement is also not excessively large for a 70 × 70 lattice-spring network. Hence, all the computational analysis of mechanical degradation that has been conducted in the subsequent sections of this article used L = 70 as the size of the lattice-spring network.