Abstract
The morphology and ionomer distribution in the polymer electrolyte membrane fuel cell (PEMFC) cathode electrode (used in Toyota Mirai) are quantified with nano-scale resolution X-ray computed tomography (nano-CT). Using the nano-CT data, different shapes, sizes and compositions of agglomerates are extracted. Statistical information from multiple techniques, including transmission electron microscopy (TEM), ultra-small angle X-ray scattering (USAXS), and Brunauer-Emmett-Teller (BET) gas adsorption porosimetry are combined to reconstruct the high surface-area porous carbon (HSC) support, exterior (on the surface of carbon) and interior (inside carbon pores) catalysts, ionomer, and primary pores in the extracted agglomerates. Application of capillary condensation theory to the reconstructed agglomerate structure is shown to accurately represent the experimentally-observed relative humidity (RH) dependence of the electrochemically-active surface area (ECA). Direct numerical simulations (DNS) show that the high local O2 transport resistance ( ) under dry conditions is mainly associated with the reduced ECA. We demonstrate that the agglomerate shape and size affect
  only if the primary pores are poorly accessible (i.e., capillary-condensed water filled primary pores result in lower
  for lower aspect ratio agglomerates). We also estimate
  associated with the location of catalyst (whether inside or on the surface of HSC).
Export citation and abstract BibTeX RIS

This is an open access article distributed under the terms of the Creative Commons Attribution 4.0 License (CC BY, http://creativecommons.org/licenses/by/4.0/), which permits unrestricted reuse of the work in any medium, provided the original work is properly cited.
Improvements in the mass activity of oxygen reduction reaction (ORR) catalysts (e.g., dealloyed catalysts1–3) have allowed reduction in the expensive platinum group metal (PGM) loadings in PEMFC electrodes. However, voltage losses at high current densities (>1 A.cm−2) are found to inversely scale with Pt loading, limiting the benefits of the high activity catalysts.1 A major contributor to these losses has been identified as the mass transport resistance localized to Pt particles.1,4–8 Addressing such local transport requires good understanding of the catalyst accessibility (i.e., reactant and proton transport to active sites) which is determined by the carbon support morphology9,10 and microstructures formed by agglomeration of carbon bound by ionomer.11–18
Two different types of carbon supports are commonly used in PEMFC electrodes: low-porosity, low surface-area solid carbon, such as Vulcan, and high-porosity, high surface-area carbon (HSC), such as KetjenBlack. In solid carbon electrodes, catalyst particles reside on the surface of the support with direct exposure to ionomer19 while in HSC electrodes, a significant portion of the catalyst is found in the interior carbon pores.10,19,20 Electrochemical measurements on HSC electrodes indicate limited ionomer contact with the catalyst embedded in carbon pores;19,21–23 the interior catalyst has been demonstrated to be active under conditions where water is present in the pores.21,24–27 In comparison to solid carbon support, HSC electrodes show improved ORR mass activity (higher performance at low current densities).19,21,28 Some researchers have explained this difference on the basis of better catalyst dispersion in HSC (higher ECA)10,21 while others have suggested possible poisoning of catalysts in solid carbon supports due to their direct contact with ionomer.29 In contrast, solid carbon electrodes at high current densities show smaller voltage losses10,21 due to easier access of oxygen to the catalysts on carbon surface compared to catalysts in interior carbon pores. While there are no direct measurement methods, comparison of polarization data for different carbon supports may not be adequate for evaluation of the relationship between local O2 transport resistance ( ) and porous carbon morphology.
Scanning electron microscopy (SEM)11 and nano-scale resolution computed tomography (nano-CT) images13,17 of PEMFC electrodes show agglomerates of electrode constituents separated by connected network of pores (secondary pores). Agglomerates consist of primary pores (< 30-nm), carbon supported catalysts and ionomer as visualized by high resolution transmission electron microscopy (TEM).30,31 Agglomerate-scale transport has been investigated with idealized homogenous reactive core-ionomer shell structures.11–14 While useful, the core-shell idealization cannot resolve the local transport phenomena determined by the complex transport paths to catalyst in agglomerates. For instance, challenging the homogenous reactive core assumption, it was demonstrated that the location of the catalyst particles in agglomerate play a significant role in determining the high current-density performance.15 Recently, we showed that the ionomer and primary pore morphology in agglomerates determines  17,18
17,18
The purpose of this work is to provide further insight into  with regard to the porous carbon morphology, agglomerate microstructure and RH. Here, we quantify the agglomerates in electrode (used in the Toyota Mirai) in terms of the size, shape and ionomer distribution observed using nano-CT. The detailed three-dimensional (3D) morphology of the HSC support, exterior and interior catalyst particles, ionomer, and primary pores are reconstructed into agglomerates employing the hybrid methodology.32 Direct numerical simulations are performed on these structures to determine
  at limiting current conditions for different RH, and morphologies of agglomerates and carbon support.
Methodology
Nano scale resolution X-ray computed tomography
X-ray radiographs of a state-of-the-art alloy catalyst electrode (extracted from the cathode of a membrane-electrode assembly from a Toyota Mirai stack which was subjected to 300 h of use in on-road driving, refer to Ref. 30 for more details) were acquired using the Xradia nano XCT-S100 TXM at beam line 32-ID-C of the Advanced Photon Source (APS) at Argonne National Laboratory (ANL). Employing a fly-scan technique, 1080 projection images were acquired over 180° rotations. The projection images were reconstructed into a 3D image sequence with ∼20-nm voxel size using Tomopy and Astra.33,34
Following the procedure in Refs. 35, 36 the Cs+ exchanged sample was scanned in both absorption and Zernike phase contrast modes. The phase contrast mode resolves the overall morphology of the solid material (a mixture of C, Pt, ionomer and primary pores below resolution) while the absorption contrast images provide an intensity map of the high electron-density materials within the sample (i.e., Cs+ indicating the ion exchanged ionomer) as illustrated in Figs. 1a and 1b. The raw data in Fig. 1 shows a 5–6 μm thick electrode with some variations in thickness which might be associated with sample preparation. Absorption image shows high intensity spots (over 2-μm sizes) distributed throughout the electrode as highlighted by the green circles in Fig. 1b. These bright spots indicate the presence of large ionomer agglomerates in the electrode. It should be noted that the intensity map in Fig. 1b also includes the contribution from the catalyst particles (especially the large catalyst particles observed as small bright dots) but due to the small volume of the catalyst in comparison to ionomer, the signal from the catalyst particles are ignored.
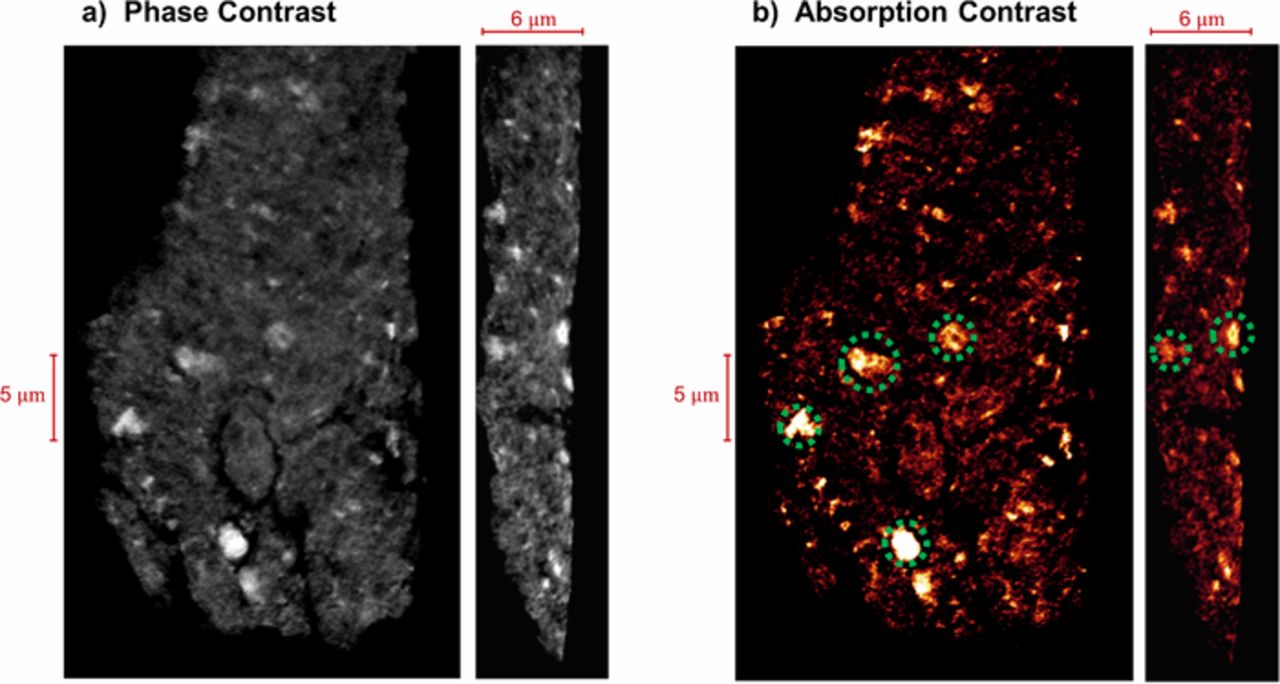
Figure 1. Nano-CT data for the Cs+ exchanged low-PGM electrode in; (a) phase contrast mode; (b) absorption contrast mode and ionomer agglomerates highlighted with green circles.
Figure 2a shows the in-plane (X, Y) and the through-thickness (Z) distribution of ionomer volume fraction (for 20 nm slices of data) which is correlated with the intensity in the absorption contrast images as described in Refs. 35, 36. The oscillations in all directions indicate the structural heterogeneity of the electrode. The high amplitude fluctuations can be attributed to the ionomer agglomerates illustrated in Fig. 1b. The ionomer volume fraction has a mean value of 0.26 and standard deviations of 0.015, 0.018 and 0.035 in X, Y and Z directions respectively. Overall, Fig. 2a indicates a graded ionomer distribution with more ionomer closer to the membrane and less ionomer closer to the diffusion media while there is no obvious trend in the in-plane directions. Nano-CT data is further quantified by segmenting the phase contrast image using open source Fiji software.37 One can refer to Ref. 17 for more details of the segmentation procedure. Figure 2b presents the calculated solid size distribution based on the diameter of the largest sphere that can be inscribed in each solid voxel in the segmented phase contrast image. Such distributions calculated from nano-CT data were previously referred to sizes of agglomerates in Refs. 13, 17 by making analogy to the spherical agglomerate models.11–14 Here, this quantity is referred as the solid size while the agglomerates are extracted with a different method which is discussed in the next section. The mean solid size for this electrode sample is 320 nm with a standard deviation of 166.5 nm. Figure 2c presents the so called shortest path tortuosity which is a mass transport related structural property. Shortest pathways in the pore phase between opposing surfaces of a 6 μm × 10 μm × 15 μm size sub-volume extracted from electrode are calculated in X, Y, Z directions using the algorithm described in17,38 (see Fig. 2c). Shortest path tortuosity is obtained as a distribution by dividing the calculated path lengths with the actual distance between the start and target surfaces. Figure 2c shows that the pores are more tortuous in the through-thickness direction (Z direction) than in the in-plane directions (X-Y), thus highlighting the anisotropic electrode structure and transport properties.
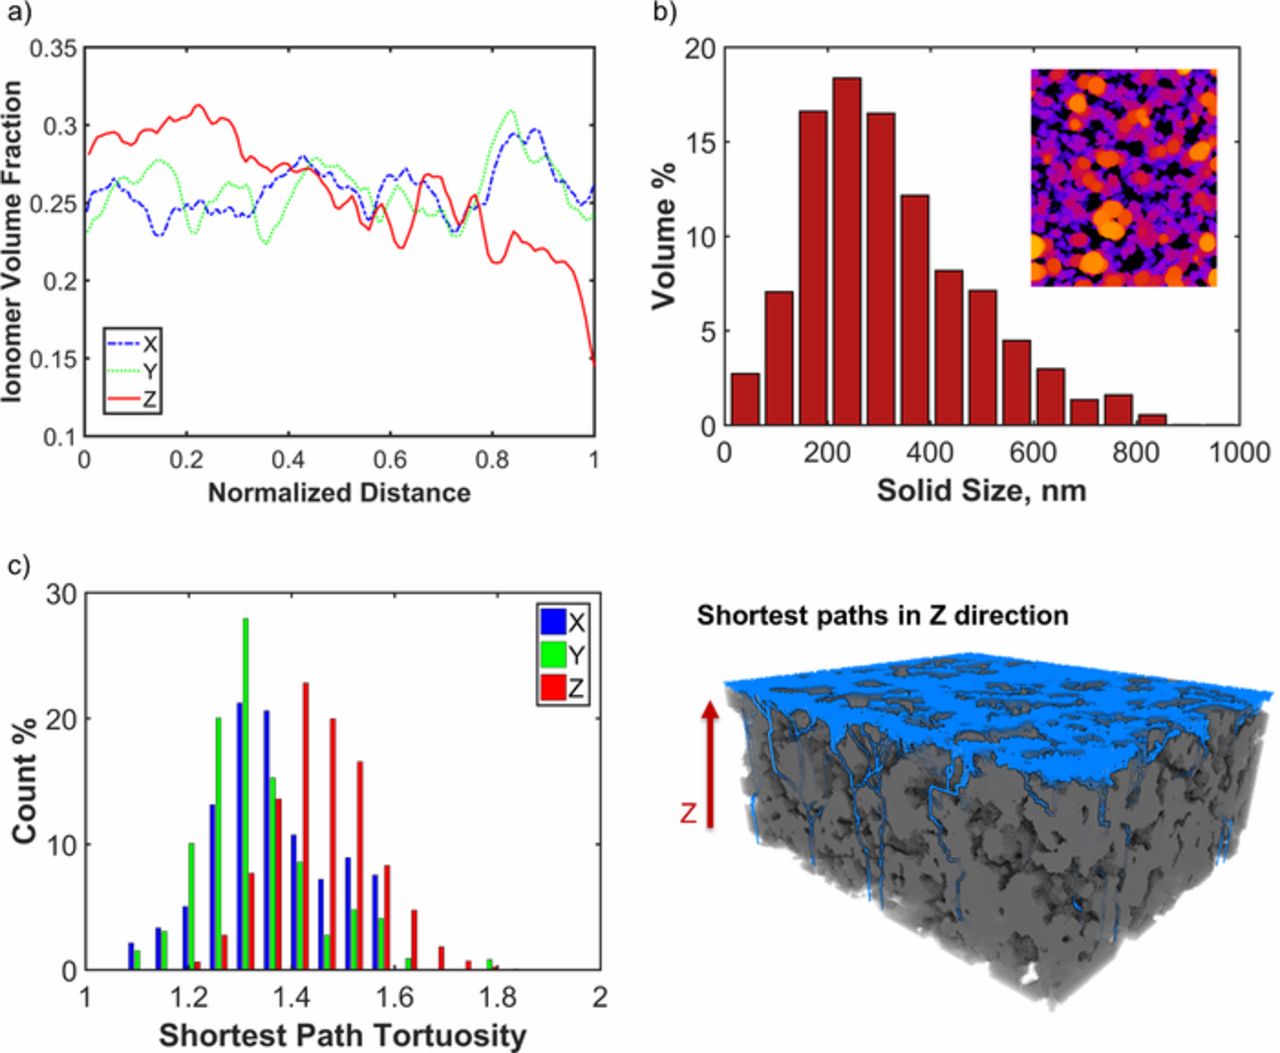
Figure 2. Structural characterization of electrode using nano-CT data; (a) ionomer volume fraction distribution in X, Y, Z directions; (b) solid size distribution extracted from segmented phase contrast data; (c) shortest path tortuosity distributions in X, Y, Z directions and shortest paths calculated in Z direction.
Porous carbon agglomerate reconstruction
Recently, electron tomography has been used to quantify the 3D structures of porous carbon supports as well as the distribution of catalyst particles on the surface and in the interior pores of HSC.20,39 This technique is quite powerful, however the analyzed structures are limited in integrity (i.e. it is not possible to visualize an agglomerate as it is situated inside the electrode) due to the destructive nature of sample preparation (e.g., cross-sectioning, microtoming, focused ion beam milling). While nondestructive nano-CT protects the integrity of the sample, it suffers from insufficient resolution. Previously, we demonstrated a numerical approach combining nano-CT images with statistical information from TEM, X-ray scattering and porosimetry techniques to generate detailed structures of electrode32 and 3D agglomerates of solid carbon17 defined as spheres inscribed to segmented nano-CT images (as described above). Here, we further extend this approach to study agglomerates of HSC support extracted from the connectivity of solid the phase in the segmented phase contrast image.
In order to identify the agglomerates within the nano-CT images, we employ a technique called watershed separation of binary image (available in Fiji37), which is commonly used to separate touching objects. This technique finds centers of objects to be separated by repeatedly applying morphological erode operations. A map is constructed from the calculated distance between the center points and the edges of the objects. Using the distance map, objects are successively filled with the so-called water phase (starting from the center points) and identifying the borders of touching objects where water phases of different objects meet. Applying this technique to the segmented phase contrast data, 24359 different agglomerates of various shapes, sizes and compositions are extracted and labeled as different colors in Fig. 3a.
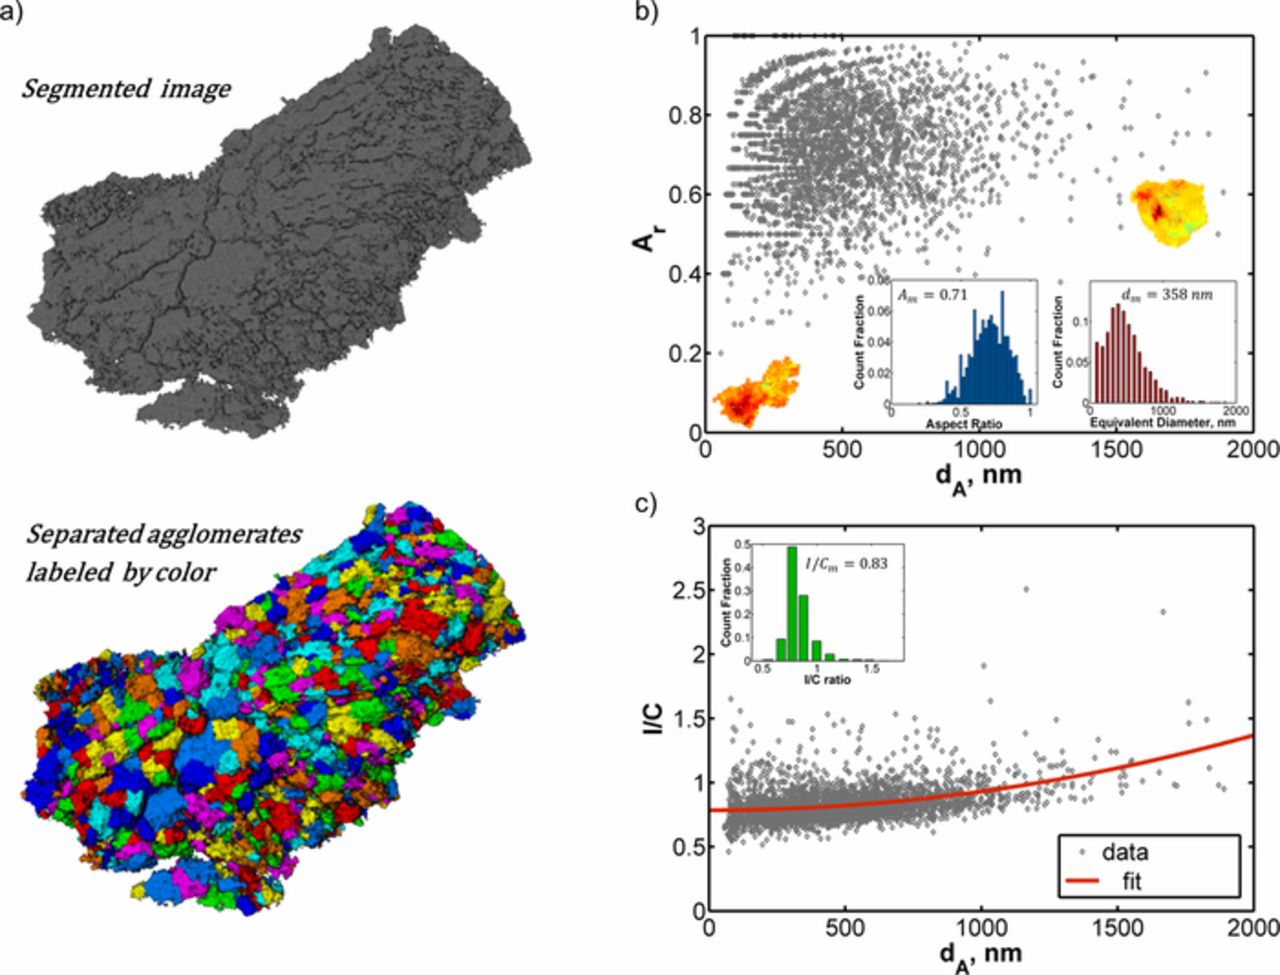
Figure 3. (a) Segmented phase contrast image and extracted agglomerates labeled with different colors; (b) aspect ratio of agglomerates against equivalent diameter with the inset showing equivalent diameter distribution, aspect ratio distribution and 2 different shape agglomerates; (c) I/C of agglomerates against equivalent diameter with the inset showing I/C distribution.
The volume to surface area ratio was used to define an effective diameter for such random shapes in Ref. 36 but here we quantify agglomerate size by defining an equivalent diameter (dA) of sphere that has the same volume as the non-spherical object. The average equivalent diameter is calculated as 358 nm (see the inset in Fig. 3b) while the average effective diameter is 86 nm. In agreement with our observations, the two-dimensional TEM images of the same electrode show large (∼1-μm length scale) and densely packed agglomerates isolated by secondary pores.30 The aspect ratio (Ar) distribution in Fig. 3b illustrates that there is a wide variety of agglomerate shapes, ranging from long chain like structures (low Ar) to sphere like structures (high Ar) as illustrated in Fig. 3b. Most of these agglomerates are below 1000 nm equivalent diameter (see the inset in Fig. 3b) and exhibit a wider distribution of aspect ratios in comparison to large agglomerates (dA > 1000 nm). In addition, majority of the agglomerates have aspect ratio exceeding 0.5 as shown in the inset in Fig. 3b.
The composition of these agglomerates (i.e., carbon volume fraction (εC)) is estimated from the ionomer volume fraction (εN) determined from the absorption contrast data following the procedure in Ref. 17. It is important to note that we assumed constant Pt/C weight ratio (f = 0.30) and primary pore volume fraction (εA = 0.08) for all agglomerates.
![Equation ([1])](https://content.cld.iop.org/journals/1945-7111/167/1/013508/revision1/d0001.gif)
![Equation ([2])](https://content.cld.iop.org/journals/1945-7111/167/1/013508/revision1/d0002.gif)
![Equation ([3])](https://content.cld.iop.org/journals/1945-7111/167/1/013508/revision1/d0003.gif)
where VA is the agglomerate volume, I is the intensity from absorption contrast data, and Imax is the intensity of the brightest voxel in the absorption image. Figure 3c presents the variation of agglomerate composition in the sample in terms of I/C. The mean I/C and standard deviation are calculated as 0.83 and 0.12 respectively (see the inset in Fig. 3c). The distribution of the agglomerate I/C shows a positive correlation with the equivalent agglomerate diameter as shown in Fig. 3c, highlighting the role played by ionomer in binding carbon and forming larger agglomerates.
The agglomerate shape and Cs+ intensity distribution extracted from 20-nm voxel size nano-CT images are mapped into 1-nm voxel size domains. The features missing in nano-CT images because of insufficient resolution (such as HSC clusters, catalyst particles and ionomer) are numerically reconstructed with 1-nm voxel resolution by using supplementary data. Initially, the body of the agglomerate is filled by clustering various size solid carbon particles (primary particle sizes from TEM and X-ray scattering data in Ref. 32) following the 2-step procedure in Refs. 17, 32 as illustrated in Fig. 4b. Unlike our previous works,17,32 the interior pores of HSC supports are taken into account in this study by using the carbon pore size distribution and volume of pores per gram carbon as obtained from BET data by Park et al.10 Pores below 10-nm are assumed to be inside the support particles and the BET data is discretized into 2-nm bins. Looping over each solid carbon particle, pore seeds of different diameter are initiated on the surface and are grown toward the center of each support particle until the measured porosity is reached as shown in Fig. 3c. For simplicity in physical modelling, non-overlapping carbon pores are assumed which results in pores of different length and shape (see the details of HSC pores in Fig 3c). Based on the microscopy data from Refs. 10, 20, 75% of the Pt particles are distributed within the pores of HSC. We assume that the interior Pt particles are of the same size as the HSC pores and 20% of the Pt particle volume overlaps with the carbon wall base (so that the particle doesn't block transport inside the HSC pore). Searching the availability of the HSC pore wall voxels (i.e., interior Pt cannot overlap with each other and pores outside carbon), Pt particles are placed until the desired volume fraction is satisfied as shown in Fig. 4d (interior Pt shown in red color). The remaining 25% of the catalyst particles are distributed on the surface of carbon by using the size distribution data obtained from TEM analysis in Ref. 30 as illustrated by gold color in Fig. 4e. In the last step, ionomer is generated using Cs+ intensity (from the absorption contrast image) as ionomer distribution probability. Following the findings of electrochemical measurements,19,21–23 ionomer is not allowed to intrude into the HSC pores. Ionomer seeds (single voxel ionomer) are placed on the exterior Pt and HSC surfaces and agglomerate outer boundary using a random number generator and a constant distribution probability (i.e., if generated random number is smaller than the ionomer distribution probability then voxel is assigned as ionomer). Searching the neighborhood of the existing ionomer voxels, ionomer is grown by comparing a random number generator with the ionomer distribution probability of the available neighborhood voxel. The ionomer growth step is successively repeated until the target volume fraction is reached as shown in Fig. 4f. It should be noted that primary pores are naturally formed in the agglomerates as a result of the reconstruction process.
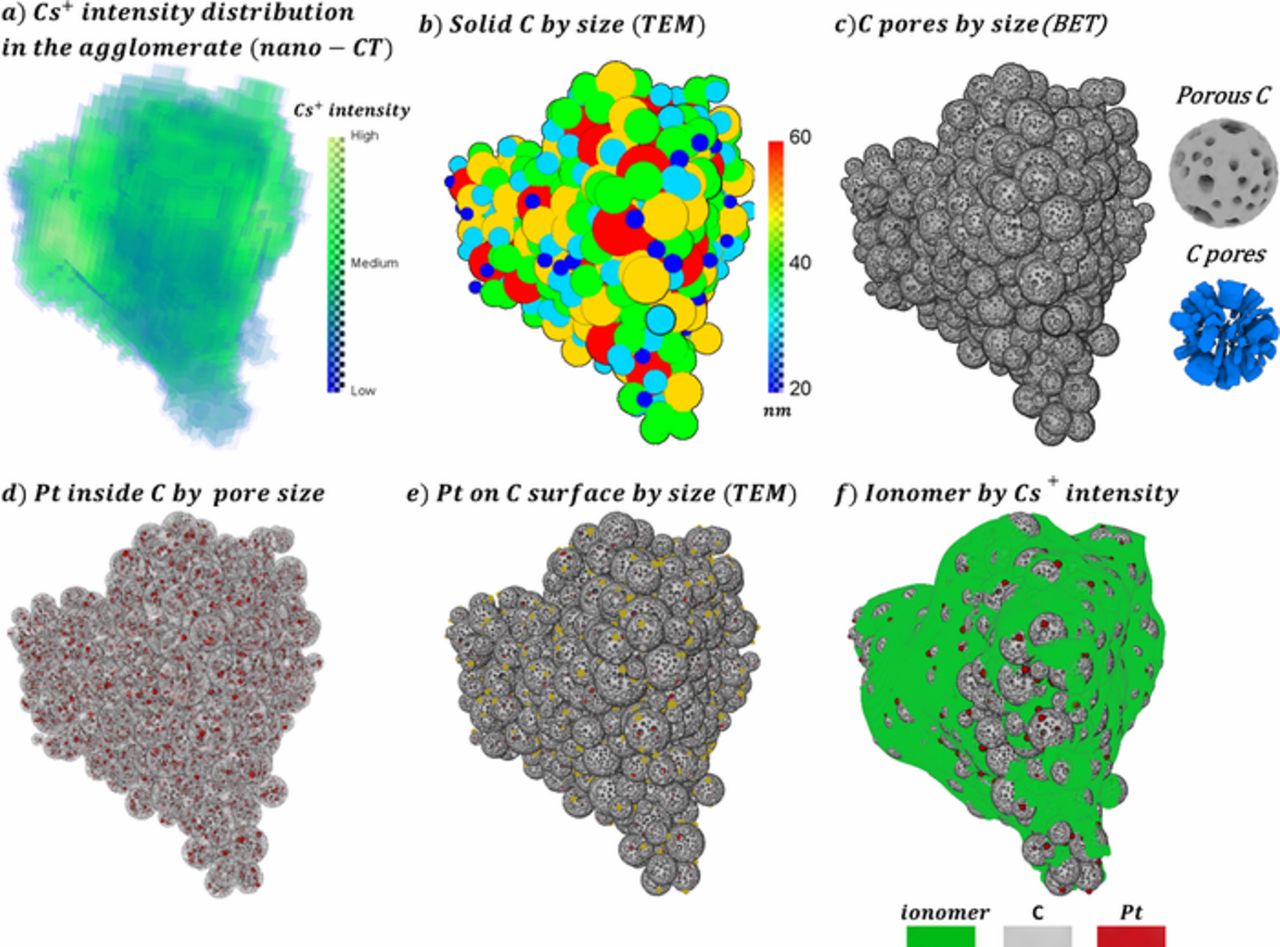
Figure 4. Description of algorithm; (a) Cs+ intensity distribution in the agglomerate from absorption contrast image; (b) solid C cluster in the agglomerate distributed using TEM size data; (c) interior C pores distributed in support using BET data with the details of single C and corresponding pores; (d) interior Pt particles in red color together with porous C cluster in gray color; (e) outer Pt in gold color together with interior Pt in red color and porous C cluster in gray color; (f) completely reconstructed agglomerate including the ionomer phase in green color.
Transport model
To study O2 transport to the catalyst surfaces in agglomerates at different RH, we employ a pore scale model that accounts for mass transfer across multiple phases (i.e., gas, liquid, solid) which we described in Ref. 18 in more detail. The governing equation for the multiple-phase medium in terms of scaled O2 concentration ( ) and scaled diffusivity (
 ) is derived as following in Ref. 18:
![Equation ([4])](https://content.cld.iop.org/journals/1945-7111/167/1/013508/revision1/d0004.gif)
![Equation ([5])](https://content.cld.iop.org/journals/1945-7111/167/1/013508/revision1/d0005.gif)
![Equation ([6])](https://content.cld.iop.org/journals/1945-7111/167/1/013508/revision1/d0006.gif)
where Cj is the O2 concentration in medium j (i.e., primary pore, liquid water, ionomer), Dj is the diffusion coefficient of O2 in medium j, and Hj is the Henry's law constant defined as the ratio of O2 concentration in any medium j to O2 concentration in gas phase18 (i.e., for primary pores Hg is unity). In this model, Pt and HSC in the agglomerates are regarded as impervious while transport is allowed in primary pore, liquid water and ionomer. Considering the primary pore length scale in agglomerates, both molecule-molecule (bulk diffusion, Db) and molecule-wall (Knudsen diffusion, DKn) collisions are taken into consideration for calculation of O2 diffusion coefficient in the gas phase.
![Equation ([7])](https://content.cld.iop.org/journals/1945-7111/167/1/013508/revision1/d0007.gif)
![Equation ([8])](https://content.cld.iop.org/journals/1945-7111/167/1/013508/revision1/d0008.gif)
where dp is the pore diameter, and M is molecular weight. Liquid water is introduced in the system using the capillary condensation theory which states that the smaller the pore size, the lower the RH at which the condensation occurs.31,40 In addition to perfect wetting surface assumption, RH is considered to be constant inside the agglomerates (small length scale). Accordingly the primary pores inclusive of the pores inside HSC are filled with liquid water if the following condition is satisfied:
![Equation ([9])](https://content.cld.iop.org/journals/1945-7111/167/1/013508/revision1/d0009.gif)
where γ is the liquid-vapor surface tension, and Vm is the liquid water molar volume. All Pt surfaces in contact with liquid water or ionomer are assumed active. Thus water condensation plays a role in determining ECA and altering the transport properties (higher resistance in water filled pores). Transport associated parameters used in the model are tabulated in Table I.
Table I. Transport Parameters.
| Temperature | T = 353 K |
| Pressure | P = 1 atm |
| O2 bulk diffusion coefficient in air | Db = 2.94 x 10− 5 m2.s− 1 |
| O2 diffusion coefficient in ionomer 100% RH41 |  |
| Henry' law constant for O2 in ionomer8 | Hi = 0.09269 |
| O2 diffusion coefficient in water | Dw = 2.04 x 10− 9 m2.s− 1 |
| Henry' law constant for O2 in water42 | Hw = 0.01760 |
For all the simulations performed in this study, we considered a limiting current scenario in which the active catalyst surfaces are assigned zero O2 concentration (CS = 0). Concentration at the agglomerate-secondary pore space boundary (CA) is calculated from the experimentally measured limiting current (iL) in units of A.m2-Pt.
![Equation ([10])](https://content.cld.iop.org/journals/1945-7111/167/1/013508/revision1/d0010.gif)
where  is the experimentally measured local O2 transport resistance associated with nano-scale transport inside agglomerate. One can refer to Ref. 25 for experimental estimation of
 . In this study, the values of
  (presented in the next section) are determined based on our analysis of an extensive limiting current data set (not presented in this study).
Using the boundary conditions and transport scenario described above, we seek direct numerical solution of Eq. 4 on the 3D structured grid defining the connectivity of transport cells (7-point stencil) in the agglomerates. The computational domains include up to ∼ 250 million cells. To handle such large system of equations we used high performance computers at Laboratory Computer Resource Center (LCRC) of Argonne National Laboratory. The equations are discretized using second-order central difference scheme and arranged in a sparse form coefficient matrix. Equation systems are solved using 'hypre' preconditioner in PETSc43 until residual (L2 norm of numerical solution) drops below 10−14.
Results
In this section, we examine the catalyst particle scale transport phenomena in HSC agglomerates based on the microstructures presented above.
Model vs. experimental data
It is hypothesized that capillary condensation allows liquid water to form in pores below the saturation pressure and this water provides ion conducting paths to Pt particles in HSC pores. In support of this hypothesis, employing electrochemical characterization techniques such as CO stripping,24,25 studies have demonstrated a strong dependence of catalyst utilization on RH. Figure 5a presents normalized electrochemically active area (NECA) at different RH as measured in Refs. 24, 25 and compares with the numerical result from porous HSC agglomerate reconstruction. The model predictions in Fig. 5a show similar trends as the experimental observations indicating that the reconstructed structure accurately reproduces the NECA-RH relationship. The inset in Fig. 5a shows the fraction of active catalyst particles at 100% RH depending on location (i.e., ∼25% of the active area is on the surface of the HSC support).
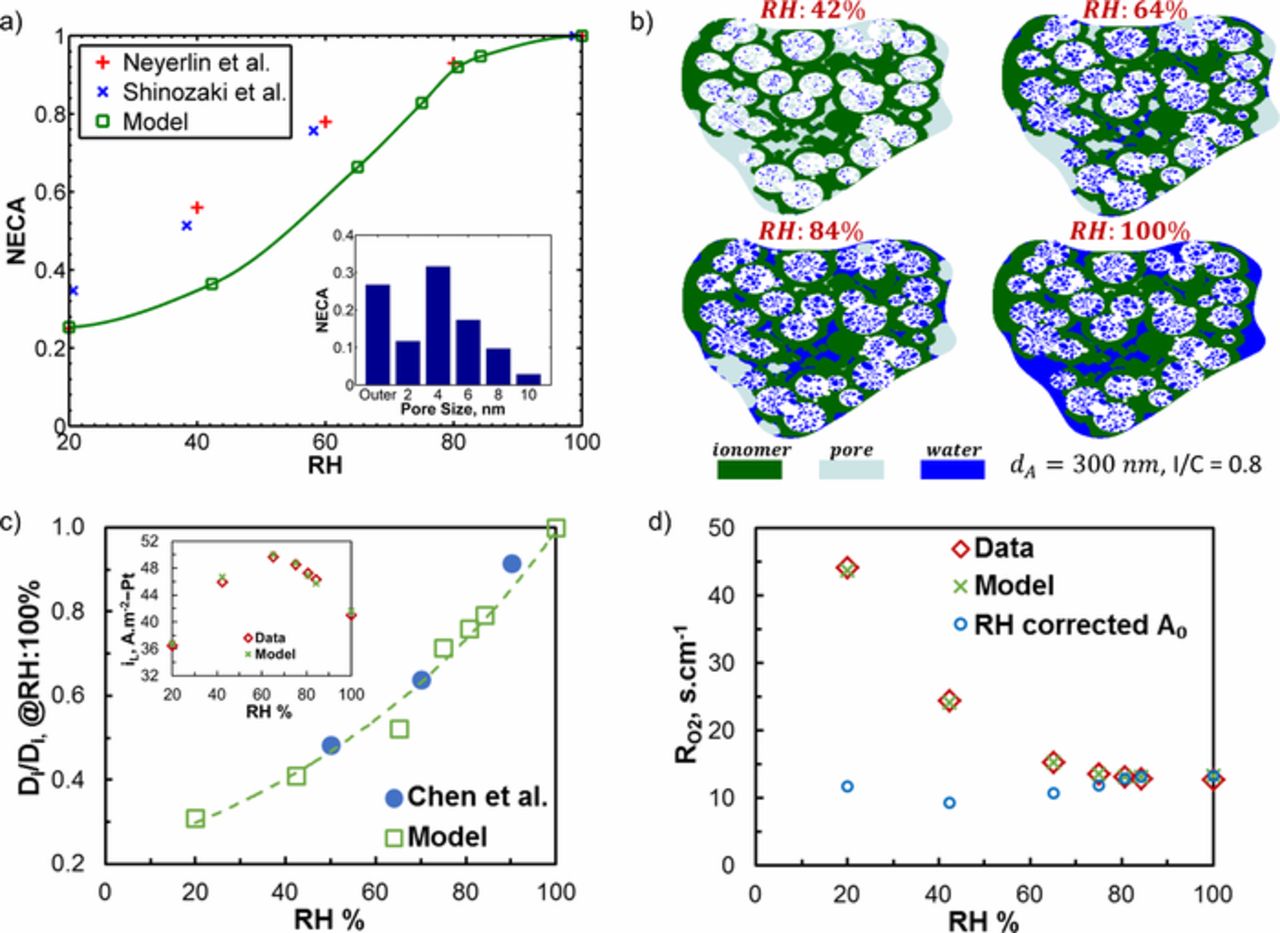
Figure 5. (a) Normalized electrochemically active area (NECA) against RH as predicted by the model and experimental observations with inset showing NECA for corresponding C pore size; (b) section view of the agglomerate used in transport simulations at different RH levels showing capillary condensation effect; (c) calculated diffusivity of O2 in ionomer to match the experimental limiting current density shown in the inset; (d) local O2 transport resistance at different RH levels as predicted by the model against experimental data.
The length scales of primary pores in between support particles are close to the HSC pore sizes. Transport restrictions due to condensation in HSC pores were discussed in literature26,27 but possible limitations of capillary-condensed water in the primary pores (between support particles) were not taken into account in any studies to the best of authors' knowledge. Here, we consider condensation both in primary and C pores following the rule in Eq. 9. Figure 5b shows section view of an agglomerate (dA = 300 nm, I/C = 0.8) indicating the degree of capillary condensation at different RH levels. At low RH (42%) capillary-condensed water is observed only in limited number of tiny pores inside HSC as shown in Fig. 5b. As RH increases most of the HSC pores become proton accessible (with water) and significant amount of primary pores get filled with condensed water leading to the flooded agglomerate at 100% RH.
We used experimental limiting current measurements to determine the RH dependence of O2 diffusivity in ionomer (Di). Accounting for capillary condensation effects, direct transport simulations were performed on the agglomerate shown in Fig. 5b and Di was tuned to match the measured limiting current shown in the inset of Fig. 5c. Figure 5c compares the inferred RH dependence of Di with the experimental data of Chen et al.44 for 1000-nm ionomer films on SiO2 substrate. The model shows a similar trend with data indicating that inferred RH dependence of Di is realistic.
Figure 5d compares the modeled O2 transport resistance ( ) in the agglomerate with the values derived from the limiting current data. In the agglomerate,
  is calculated as follows:
![Equation ([11])](https://content.cld.iop.org/journals/1945-7111/167/1/013508/revision1/d0011.gif)
where iPt is the current generated at each Pt surface, and A0 is the total surface area of all Pt particles in the agglomerate at 100% RH (similarly the roughness factor at 100% RH was used for  derived from the limiting current data). Additionally Fig. 5d presents
  calculated based on RH corrected A0 which cancels the NECA-RH effect on
  . Under dry conditions (< 42% RH), the RH corrected
  is significantly different than
  indicating that low NECA (i.e., ∼25% NECA at 20% RH) is mainly responsible for extremely high resistance. Respectively minor contribution of reduced Di (see Fig. 5c) to the elevated
  under dry conditions can be assessed by comparing the RH corrected
  between 42% and 20% RH (i.e., 10% reduction in Di results in 2.4 s.cm−1 higher RH corrected
 ). Figure 5d shows that
  rapidly decreases until 64% RH and converges to ∼13 s.cm−1 at 100% RH. Despite the ∼60% improvement in Di (see Fig. 5c) from 42% RH to 100% RH, the RH corrected
  increases ∼40% due to transport limitations in the condensed water filled primary pores in agglomerate (see Fig. 5b).
Agglomerate shape and size
In the previous sections, we demonstrated structural heterogeneity of the agglomerates in the electrode in terms of size (equivalent diameter) and shape (aspect ratio). Size and shape of ideal core-shell agglomerates (such as spherical or cylindrical) were shown to have significant impact on transport.13,45,46 However, none of these studies account for porous structure of HSC, primary pores and catalyst particles which play critical role in local O2 transport losses.18 Furthermore, the capillary condensation-RH effects were not considered in any of these agglomerate models. Depending on the realistic agglomerates and the transport model described above, here we examine the agglomerate size and shape effect on  at limiting current conditions for different RH.
The O2 transport model (calibrated with experimental data for 300-nm agglomerate) is applied to different size agglomerates (having Ar in range 0.77–0.83 and I/C of 0.8). Figure 6a presents  at 42% and 100% RH. Under dry conditions (42% RH) the agglomerates show significantly higher
  than at 100% RH consistent with the observations in the previous section. Figure 6a highlights that
  strongly correlates with agglomerate size at 100% RH (primary pores are flooded as in Fig. 5b); the resistance increases approximately 52% from 200-nm to 500-nm agglomerate. As intuitively expected the larger the agglomerate diameter the longer the diffusion distance and the higher is the transport resistance. On the other hand, under dry conditions (42% RH) Fig. 6a shows similar
  for different size agglomerates. At 42% RH,
  becomes independent of agglomerate size because the primary pores in agglomerates remain dry (see Fig. 5b) and the majority of the transport resistance originates from the ionomer film over the outer Pt particles. Figure 6b shows the corresponding ionomer film thickness distribution over the outer catalyst particles which is calculated employing the shortest distance method explained in.17 Due to heterogeneity of the agglomerate composition (i.e. Cs+ intensity distribution) calculated film thicknesses range 2–35 nm in agglomerates. Thickness distribution appears to be very similar for different size agglomerates and does not indicate any correlation to agglomerate size. The average ionomer thickness for different agglomerates (see the inset Fig. 6b) correlates well with
  calculated at 42% RH pointing out that the agglomerate size–
 relation strongly relies on the accessibility of the primary pores in the agglomerates.
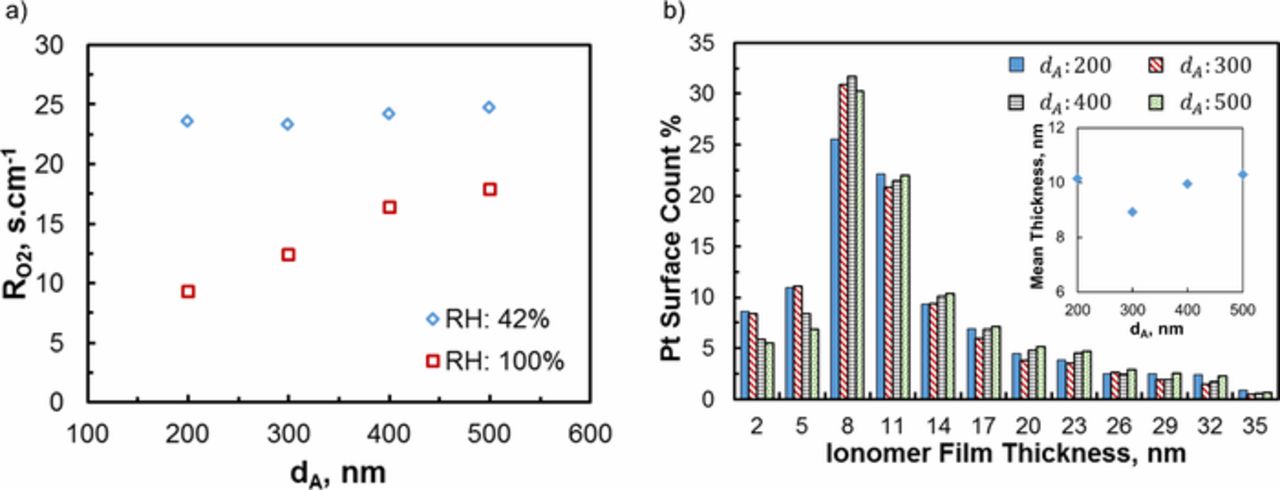
Figure 6. (a) Local O2 transport resistance calculated for different size agglomerates at 2 different RH levels; (b) ionomer film thickness distribution over the outer Pt particles.
Figure 7a shows two distinctive shapes of same volume agglomerates (dA = 250 nm and I/C = 0.8). The low aspect ratio (Ar = 36) agglomerate resembles a long chain like structure whereas the high aspect ratio (Ar = 78) agglomerate looks closer to a sphere. Figure 7b presents the corresponding  calculated for limiting current conditions at 42% and 100% RH. Agglomerate shape does not seem to play any roles in local O2 transport losses at dry conditions (42% RH) as shown in Fig. 7b. Because
  correlates only with the ionomer film thickness at dry conditions due to accessible (low resistance) primary pores as explained above. On the other hand, agglomerate shape comes into play when the primary pores get filled with water at higher RH. Figure 7b shows approximately 30% rise in
  of the sphere like agglomerate at 100% RH in comparison to the low aspect ratio agglomerate. Figure 7c shows that reactant cannot reach the inner sections of the high Ar agglomerate whereas the core region of the low Ar agglomerate appears to be more accessible due to shorter diffusion length. Consequently, the catalyst particles located away from the agglomerate surface get utilized more in low Ar agglomerate which results in lower
 (in comparison to high Ar agglomerate).
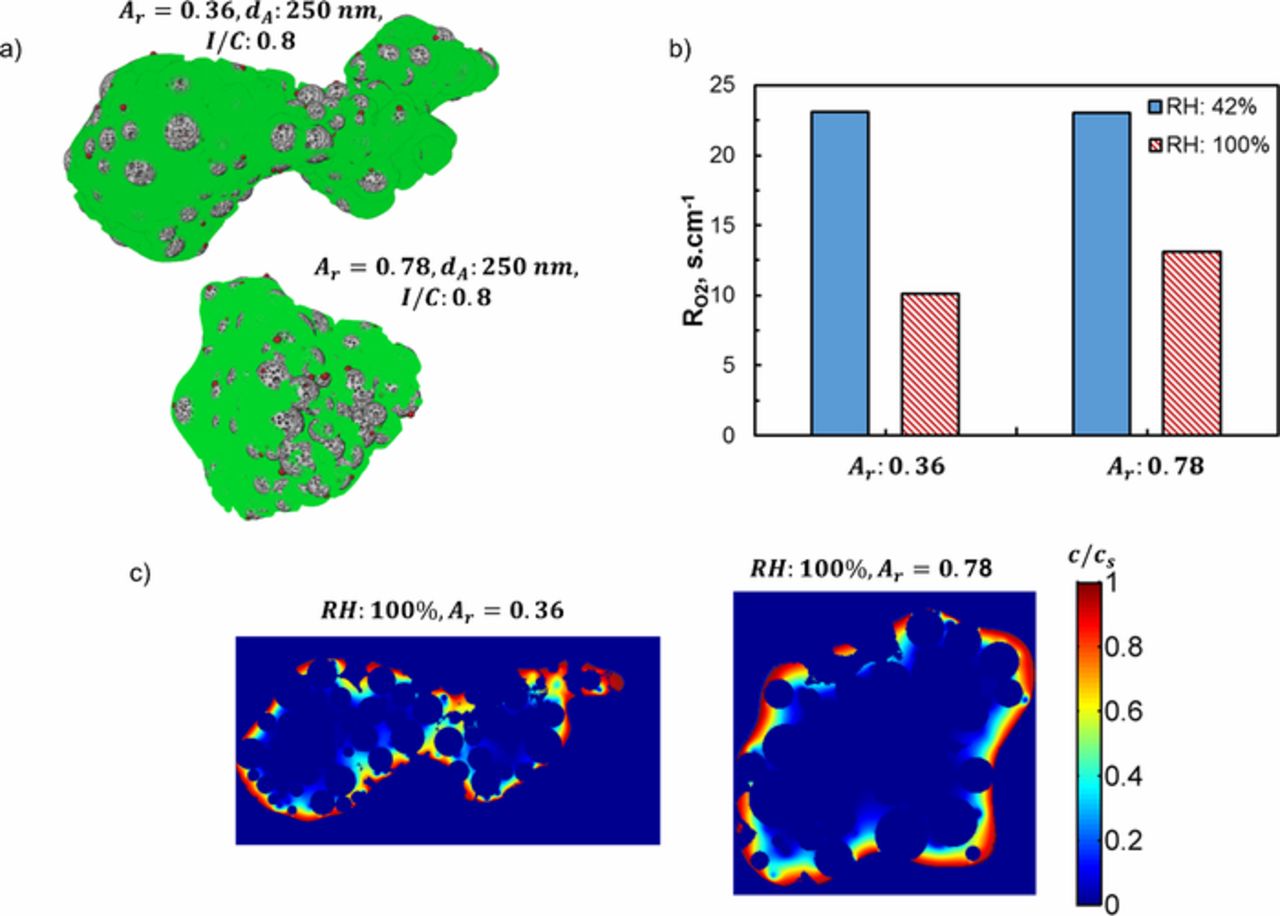
Figure 7. (a) Reconstructed agglomerates at two different aspect ratios to show the shape effect; (b) corresponding local transport resistance calculated at 2 different RH levels; (c) section view showing normalized O2 concentration contour in the ionomer phase at 100% RH.
Porous vs. solid carbon
It is important to understand the transport to interior (inside HSC support pores) and exterior (on the surface of HSC) catalyst particles for more effective use of precious metal. For identical locations of carbon support, we performed a parametric study by changing the number fraction of the outer Pt particles (fo) to evaluate the catalyst location effect on  . Figure 8a shows the section views of two agglomerates with fo = 0.25 (corresponding to HSC) and fo = 1.00 (corresponding to solid carbon). Due to random distribution of Pt particles there are negligible differences between different fo structures but the overall morphologies are quite similar as shown in Fig. 8a. Figure 8b presents calculated
  at 42% and 100% RH. As intuitively expected, higher fo results in lower
 both for dry and flooded conditions. At 100% RH the difference between
  for fo = 0.25 and fo = 1.00 (∼ 4 s.cm−1) approximately quantifies the effect of transport to interior catalyst particles (in water filled C pores) on
  . Figure 8b also shows the diminishing impact of RH on
  with increasing fo.
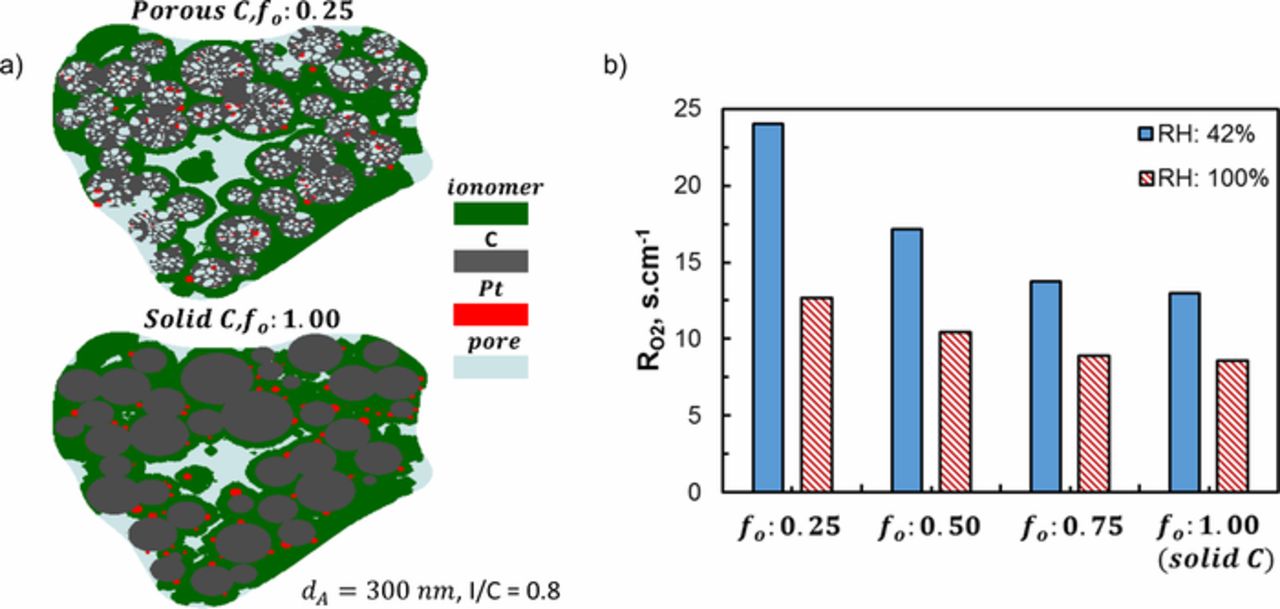
Figure 8. (a) Section view of reconstructed agglomerates of porous and solid C with same C locations; (b) local O2 transport resistances for different number fraction of outer Pt particles (fo) and for solid C.
Conclusions
Structural morphology of a state-of-the-art electrode (used in Toyota Mirai) is evaluated using nano-CT. Some salient features are highlighted below:
- Ionomer distribution is graded in the thickness direction with more ionomer closer to the membrane and less ionomer closer to the diffusion media. Large ionomer agglomerates are observed.
- Shortest path analysis points out anisotropic electrode structure with more tortuous pores in the through-thickness direction.
- I/C of agglomerates (extracted based on connectivity of electrode material) shows positive correlation with agglomerate size pointing out the role played by the ionomer in binding carbon and forming large agglomerates.
We performed direct numerical simulations on the HSC agglomerates, reconstructed using the hybrid methodology,32 at different RH accounting for capillary condensation. Following are the main conclusions of the transport simulations:
- Application of capillary condensation theory to the reconstructed agglomerate accurately captures RH dependence of ECA compared to experimental data.
- Low NECA is mainly responsible for extremely high
 at dry conditions.
 - Agglomerate shape and size affect only if the primary pores provide limited access (i.e., filled with capillary condensed water at high RH), otherwise is determined by ionomer film. At high RH, smaller size or lower aspect ratio agglomerates facilitate better O2 transport to catalyst surfaces (resulting in lower ).
- Impact of RH on reduces with increasing number of outer catalyst particles. At 100% RH, RO2 is ∼30% larger (∼4 s.cm−1) if the Pt particles are inside the HSC pores (fo = 0.25) rather than on the outer surface (fo = 1).


Acknowledgments
The authors wish to thank the U.S. Department of Energy's Fuel Cell Technologies Office (DOE-FCTO) for support. This work was performed as part of the DOE-FCTO's Fuel Cell Performance and Durability consortium. This research used resources of the Advanced Photon Source (APS), a U.S. Department of Energy (DOE) Office of Science User Facility operated for the DOE Office of Science by Argonne National Laboratory under Contract No. DE-AC02-06CH11357. Argonne National Laboratory is managed for the U.S Department of Energy by the University of Chicago Argonne, LLC, also under contract DE-AC-02-06CH11357. We gratefully acknowledge the computing resources provided on Blues (and/or Bebop), a high-performance computing cluster operated by the Laboratory Computing Resource Center at Argonne National Laboratory. The views and opinions of the authors expressed herein do not necessarily state or reflect those of the United States Government or any agency thereof. Neither the United States Government nor any agency thereof, nor any of their employees, makes any warranty, expressed or implied, or assumes any legal liability or responsibility for the accuracy, completeness, or usefulness of any information, apparatus, product, or process disclosed, or represents that its use would not infringe privately owned rights.
ORCID
Firat C. Cetinbas 0000-0001-8592-4816
Rajesh K. Ahluwalia 0000-0002-9031-1907
Deborah J. Myers 0000-0001-9299-3916