Abstract
For manufacturing copper interconnects by the damscence technique, electrochemical deposition of copper on patterned sustrates requires several additives to achieve compact filling of trenches and vias, where chloride ions play a crucial role. In the highly acidic electrolyte, adsorption of chloride ions on copper is expected to compete with the adsorption of hydrogen, depending on the copper electrode potential. We propose a general phenomenological model of the coadsorption of two ion species which is supported by DFT calculations and show how the adsorption of one species can be described by the common Langmuir model with rescaled parameters depending on the concentration of the second species. Regarding the Cl−-H+-system, corresponding model parameters are estimated by fitting radio tracer measurements of the chloride adsorption on copper reported in the literature. The data suggest that in a highly acidic solution (pH ≈ 0) the saturation surface density of chloride depends strongly on the electrode potential. With variation of the potential ESHE from −0.4 to +0.2 V, the saturation density changes by a factor of four. Within our model, such a potential dependence of the saturation density is explained by the presence of adsorbed hydrogen.
Export citation and abstract BibTeX RIS

This is an open access article distributed under the terms of the Creative Commons Attribution 4.0 License (CC BY, http://creativecommons.org/licenses/by/4.0/), which permits unrestricted reuse of the work in any medium, provided the original work is properly cited.
Electrochemical deposition is the state-of-art technique for manufacturing copper interconnects in integrated circuits.1,2 To achieve compact filling (super-filling) of trenches and vias on patterned wafers, additives are commonly used to appropriately tune the copper deposition rate at different surface positions of the wafer (e.g. higher rate at the trench bottom). In this connection, chloride ions in synergy with other additives play a crucial role in controlling the deposition rate.1–6 The working mechanism of chloride ions has been extensively studied both experimentally and theoretically.7–17 Commonly, the electrolytes used for the electrochemical copper deposition are highly acidic.1,2 Thus, it seems likely that the adsorption of hydrogen ions competes with the adsorption of chloride ions at certain potentials of the copper electrode. To our knowledge, previous modeling of the electrochemical copper deposition has not been focused on this competing adsorption of hydrogen and chloride ions.
In the present work, we propose first a general phenomenological model to describe the competitive adsorption of two ion species. Based on this approach, we are able to express the equilibrium adsorption isotherm of one species in the form of the common Langmuir model of a single species with rescaled kinetic parameters. The scaled parameters depend on the concentration of the other ion species as well as on the electrode potential. Predictions of our coadsorption model are compared with experimental findings by Horanyi et al.18 on the adsorption of chloride ions on copper in an acidic aqueous solution. In this case, the equilibrium surface coverage of chloride can approximately be expressed in the form of the standard Langmuir isotherm for a single species, where the kinetic parameters depend on the concentration of hydrogen ions. We think that previously reported models of copper deposition, which include chloride adsorption, could easily be amended to take into account the chloride-hydrogen-coadsorption effect by properly adjusting the corresponding parameters.
Coadsorption Model
Coadsorption kinetics
In the following, we present a Langmuir-like model for the coadsorption of two species on a common surface, where additional interaction parameters are introduced, by which the mutual influence of the two species on their adsorption is taken into account in a phenomenological manner. The kinetics for the coadsorption of two species, A and B, is modeled by the following coupled equations for the temporal evolution of the surface densities
![Equation ([1])](https://content.cld.iop.org/journals/1945-7111/166/1/D3042/revision1/d0001.gif)
![Equation ([2])](https://content.cld.iop.org/journals/1945-7111/166/1/D3042/revision1/d0002.gif)
where  , Γi with i = {A, B} is the surface density of the i-th ion species, Γ0i is the maximal surface density in the absence of the other species, ci is the ion density in the solution, and kai and kdi are the adsorption and desorption coefficients, respectively. Further, θfreei is the free surface for the adsorption of the corresponding ion species normalized by the total substrate surface, which is expressed as
![Equation ([3])](https://content.cld.iop.org/journals/1945-7111/166/1/D3042/revision1/d0003.gif)
![Equation ([4])](https://content.cld.iop.org/journals/1945-7111/166/1/D3042/revision1/d0004.gif)
where the last term on the rhs of the equations represents the hindering of the adsorption of one species by the adsorbed molecules of the other species. The corresponding factors α and β determine the degree of the hindering. The values of these factors are related to the special kind of the interaction of the two species on the surface. In the following, we consider different cases of this interaction.
(A) Within a simple mechanistic view, the adsorbed species can be considered as rigid bodies covering a species-dependent area ai on the surface. As the only interaction between the adsorbed molecules, area exclusion between the molecules leads to the following equation
![Equation ([5])](https://content.cld.iop.org/journals/1945-7111/166/1/D3042/revision1/d0005.gif)
where Ni are the total numbers of the adsorbed species on the total surface A. In the second equation, the relations Γi = Ni/A and ai = 1/Γ0i were used. The same expression results for species B, i. e. θfreeA = θBfree. Comparison with Eqs. 3 and 4 shows that it corresponds to the limiting case α = β = 1.
In general, the interaction between the molecules is more complex. Within an atomistic view, different species may have different preferred adsorption sites on the substrate surface (for example fcc or hcp hollow sites, bridge sites, or on top of substrate atoms).
(B) As a more complex example, one may imagine that the surface area NBaB, covered by adsorbed species B, is not completely forbidden for adsorption of species A. Only within a certain surface part αNBaB (α < 1) species A cannot be adsorbed. Analogously, only the surface part βNAaA (β < 1) is considered to be unavailable for adsorption of species B. Then, the normalized free surfaces for the two species are given by
![Equation ([6])](https://content.cld.iop.org/journals/1945-7111/166/1/D3042/revision1/d0006.gif)
![Equation ([7])](https://content.cld.iop.org/journals/1945-7111/166/1/D3042/revision1/d0007.gif)
from which Eqs. 3 and 4 follow.
(C) A further example, which demonstrates the meaning of the coefficients α and β, is a system where each species has its own set of adsorption sites (Γ0A and Γ0B). These sites could be disjunct, e.g. species A on hollow sites and species B on top sites. However, we consider here a more general case where the two species share also some common sites with surface density Γ0AB = ΓA0∩Γ0B. Assuming species to be evenly distributed over common and non-common sites, the surface density of free sites for each species reads
![Equation ([8])](https://content.cld.iop.org/journals/1945-7111/166/1/D3042/revision1/d0008.gif)
![Equation ([9])](https://content.cld.iop.org/journals/1945-7111/166/1/D3042/revision1/d0009.gif)
where in the second equations the quantities α = Γ0AB/ΓA0 and β = Γ0AB/ΓB0 have been introduced. Using the relations θfreei = Γifree/Γ0i, we obtain again Equations 3 and 4.
(D) For certain systems, replacement processes of an adsorbed species by the other species can be relevant. For instance, adsorbed chloride ions on a copper surface could be replaced by hydrogen ions in solution (compare the results of DFT calculations below). For a system of species A and B, where species B in solution are able to replace adatoms of species A, but not vice versa, those replacement processes are taken into account by the following kinetic equations
![Equation ([10])](https://content.cld.iop.org/journals/1945-7111/166/1/D3042/revision1/d0010.gif)
![Equation ([11])](https://content.cld.iop.org/journals/1945-7111/166/1/D3042/revision1/d0011.gif)
where kr is the kinetic coefficient for the replacement of species A by species B. With the simple approximation 5, i. e. θfree = 1 − ΓA/Γ0A − ΓB/Γ0B, Eqs. 10 and 11 can be rewritten in a form similar to Eqs. 1 and 2
![Equation ([12])](https://content.cld.iop.org/journals/1945-7111/166/1/D3042/revision1/d0012.gif)
![Equation ([13])](https://content.cld.iop.org/journals/1945-7111/166/1/D3042/revision1/d0013.gif)
By comparing with Eqs. 1 to 4, one finds that θfreeA = θfree and θfreeB = θfree + krΓA/(kaBΓB0). Thus, in the case of an additional replacement mechanism, the kinetic equations can be reformulated in a manner as in Eqs. 3 and 4 where the parameters α and β take the values α = 1 and β = 1 − krΓ0A/(kBaΓ0B).
Generally, the interactions between the absorbents and with the substrate are very complex. The different scenarios listed above, represent limiting cases and are not mutually exclusive. One example corresponding to case (A) would be the adsorption of inert gases. Strongly different repelling interactions between adsorbed species could lead to a situation considered in case (B). For case (C), it is important that the two species occupy different surface sites of the substrate as for example top and hollow sites. As an example of the replacement scenario (D), we consider below the chlorine-hydrogen-system.
Equilibrium surface densities
The equilibrium surface densities of the two species in the coadsorbed state are given by the stationary limit  of Eqs. 1 and 2. By inserting into those equations formulas 3 and 4 for the normalized free surfaces θfreeA and θfreeB, one finds the equilibrium densities
![Equation ([14])](https://content.cld.iop.org/journals/1945-7111/166/1/D3042/revision1/d0014.gif)
![Equation ([15])](https://content.cld.iop.org/journals/1945-7111/166/1/D3042/revision1/d0015.gif)
where the abbreviations κi = kai/kdi have been introduced. If one of the two species is absent, these formulas reduce to the common Langmuir isotherm for a single species. For example for cB = 0, one obtains ΓeqA = ΓA0/(1 + 1/(κAcA)).
An interesting question is the value of the surface densities in the limit of very high bulk concentration of one species, e.g. for cA → ∞. In this limiting case, one finds for the saturation surface densities
![Equation ([16])](https://content.cld.iop.org/journals/1945-7111/166/1/D3042/revision1/d0016.gif)
![Equation ([17])](https://content.cld.iop.org/journals/1945-7111/166/1/D3042/revision1/d0017.gif)
Thus, we get the remarkable prediction that the saturation surface density ΓSA of species A is generally less than Γ0A and depends on the concentration of species B in the solution. Species A reach full coverage ΓSA = ΓA0 only if coefficient β = 1, or for the trivial case cB = 0.
In the following, we show how the derived expressions for the coadsorption of two species can be reformulated as the common Langmuir model for the adsorption of one species only. The kinetic equation for the adsorption of a single species, say A, reads
![Equation ([18])](https://content.cld.iop.org/journals/1945-7111/166/1/D3042/revision1/d0018.gif)
We have labeled the quantities in the last equation with a tilde to distinguish them from those introduced above. The corresponding equilibrium surface density can be expressed in the following way
![Equation ([19])](https://content.cld.iop.org/journals/1945-7111/166/1/D3042/revision1/d0019.gif)
where  . Our result for ΓeqA in the case of the coadsorption of two species, Eq. 14, can be rewritten in a form similar to Eq. 19. By using the expression 16 for the saturation density ΓSA, one finds
![Equation ([20])](https://content.cld.iop.org/journals/1945-7111/166/1/D3042/revision1/d0020.gif)
Comparison of Equations 19 and 20 reveals how the parameters in the common Langmuir model for the description of the adsorption isotherm of only one species are affected by the presence of a second species. The corresponding parameters are rescaled in the following way
![Equation ([21])](https://content.cld.iop.org/journals/1945-7111/166/1/D3042/revision1/d0021.gif)
![Equation ([22])](https://content.cld.iop.org/journals/1945-7111/166/1/D3042/revision1/d0022.gif)
Equations 21 and 22 show how the concentration cB of species B in the bulk solution influences the adsorption of species A.
Potential dependence of kinetic coefficients
The temperature dependence of the adsorption and desorption rate constants are commonly written as an Arrhenius equation
![Equation ([23])](https://content.cld.iop.org/journals/1945-7111/166/1/D3042/revision1/d0023.gif)
where k0 is a prefactor and Ea the activation energy. The adsorption or desorption of charged species (e. g. H+ and Cl− ) represent a charge transfer process.18,19 Thus, the activation energy will have a contribution due to the bias potential E
![Equation ([24])](https://content.cld.iop.org/journals/1945-7111/166/1/D3042/revision1/d0024.gif)
where eΔz = e(zb − z) is the charge transfer between the barrier state with charge ezb and the corresponding adsorption or desorption state with charge eza or ezd, respectively. This leads to the following potential dependence of the adsorption and desorption rate constants of species i
![Equation ([25])](https://content.cld.iop.org/journals/1945-7111/166/1/D3042/revision1/d0025.gif)
![Equation ([26])](https://content.cld.iop.org/journals/1945-7111/166/1/D3042/revision1/d0026.gif)
Using these expressions, we finally find the potential dependence of the characteristic variables κi in Equations 14 and 15 for the equilibrium coverages θeqi
![Equation ([27])](https://content.cld.iop.org/journals/1945-7111/166/1/D3042/revision1/d0027.gif)
where Ki = (ka0i/kd0i)exp ((E0id − Ea0i)/(kBT)) and Bi = e(zdi − zai)/(kBT) have been introduced. Here e(zdi − zia) is the charge transfer due to ion adsorption. A similar exponential dependence of the adsorption and desorption rate constants on the bias potential has been proposed in Refs. 9–11,18–20. In the following, we will apply the proposed model equations for the description of the coadsorption of two ion species in the presence of a bias potential to the Cl−-H+-system.
Cl-H-Coadsorption on Copper
DFT calculations
The adsorption of halides on different metal surfaces has been extensively analyzed in the literature within the framework of the spin polarized density functional theory (DFT). These works concern mainly the adsorption of one species in vacuum (e.g. adsorption on Cu(111)).21,22,24 Only a few works consider the coadsorption of hydrogen and halides. Coadsorption of hydrogen and chloride ions on Pt(111) has been analyzed for example in Ref. 25. To our knowledge, coadsorption of hydrogen and chlorine on copper has not yet studied by DFT. In order to gain insight into the tendencies of the adsorption for this system, we have performed spin polarized DFT calculations of the Cl-H-coadsorption on the Cu(111) surface. The calculations were done by means of the Vienna ab initio simulation package (VASP),26,27 using the PBE generalized gradient approximation (GGA) for the exchange-correlation functional28 and the PAW method.29,30 The wave functions were expanded in plane waves up to a kinetic energy cutoff of 400 eV. The size of the super cell was 3 × 3 or 6 × 6 depending on the chlorine coverage. The Brillouin zone was sampled by 4 × 4 × 1 (2 × 2 × 1) k-points using the Monkhorst-Pack scheme31 for small (large) super cell size. Periodic boundary conditions were applied for all calculations with a gap between the surfaces of 25 Å. Dispersion corrections were included by the standard D2 Grimme parametrization.32
As an important issue of the coadsorption, we analyzed whether the replacement of adsorbed chlorine atoms by hydrogen atoms is energetically favorable. To this end, the energy difference between the two states in Figs. 1a and 1b, where one Cl atom is replaced by H, was calculated. The initial Cl coverage was  . Here, the coverage is defined as the number of adsorbed species divided by the number of copper atoms in the topmost (111) surface layer. For the considered atom configurations, we found that the state, where hydrogen replaced chlorine, is energetically unfavorable by 0.6 eV. To be closer to the real electrochemical system, we repeated the calculations for the same set up with initial coverage
  , but with explicit consideration of the presence of water molecules. In this case, the replacement of chlorine by hydrogen was found to be energetically favorable with an energy gain of 0.9 eV. In order to quantify the stability of coadsorbed states on Cu(111), we calculated a mean adsorption energy for different surface coverages of chlorine and hydrogen. The corresponding adsorption energy was defined by
![Equation ([28])](https://content.cld.iop.org/journals/1945-7111/166/1/D3042/revision1/d0028.gif)
where ECl/H/Slab is the total energy of the whole system and ESlab is the total energy of the copper slab without adsorbate. EH2 and ECl2 are the energies of the isolated dimers, and NH and NCl are the numbers of adsorbed atoms on the surface. Fig. 2 shows examples of the most stable configurations of coadsorbed states for different coverages with  . The preferred adsorption sites of both chlorine and hydrogen are fcc and hcp hollow sites on the surface. The calculated adsorption energies vary between −1 eV for
  up to −0.5 eV for for
  . Configurations with
  were found to be unstable. Obviously, a repelling interaction between the adsorbed atoms leads to a weakening of the adsorption strength. According to a Bader charge analysis,33 adsorbed chlorine as well as hydrogen are negatively charged. The calculated adsorption energies of individual species have been found to be −0.23 eV and −1.79 eV for H and Cl, respectively. These energy values are in good agreement with previous DFT calculations.23,24 The mean adsorption energy of the coadsorbed state at a coverage of 2/9 (cf. diagram in Fig. 2) results practically as average of the individual adsorption energies.
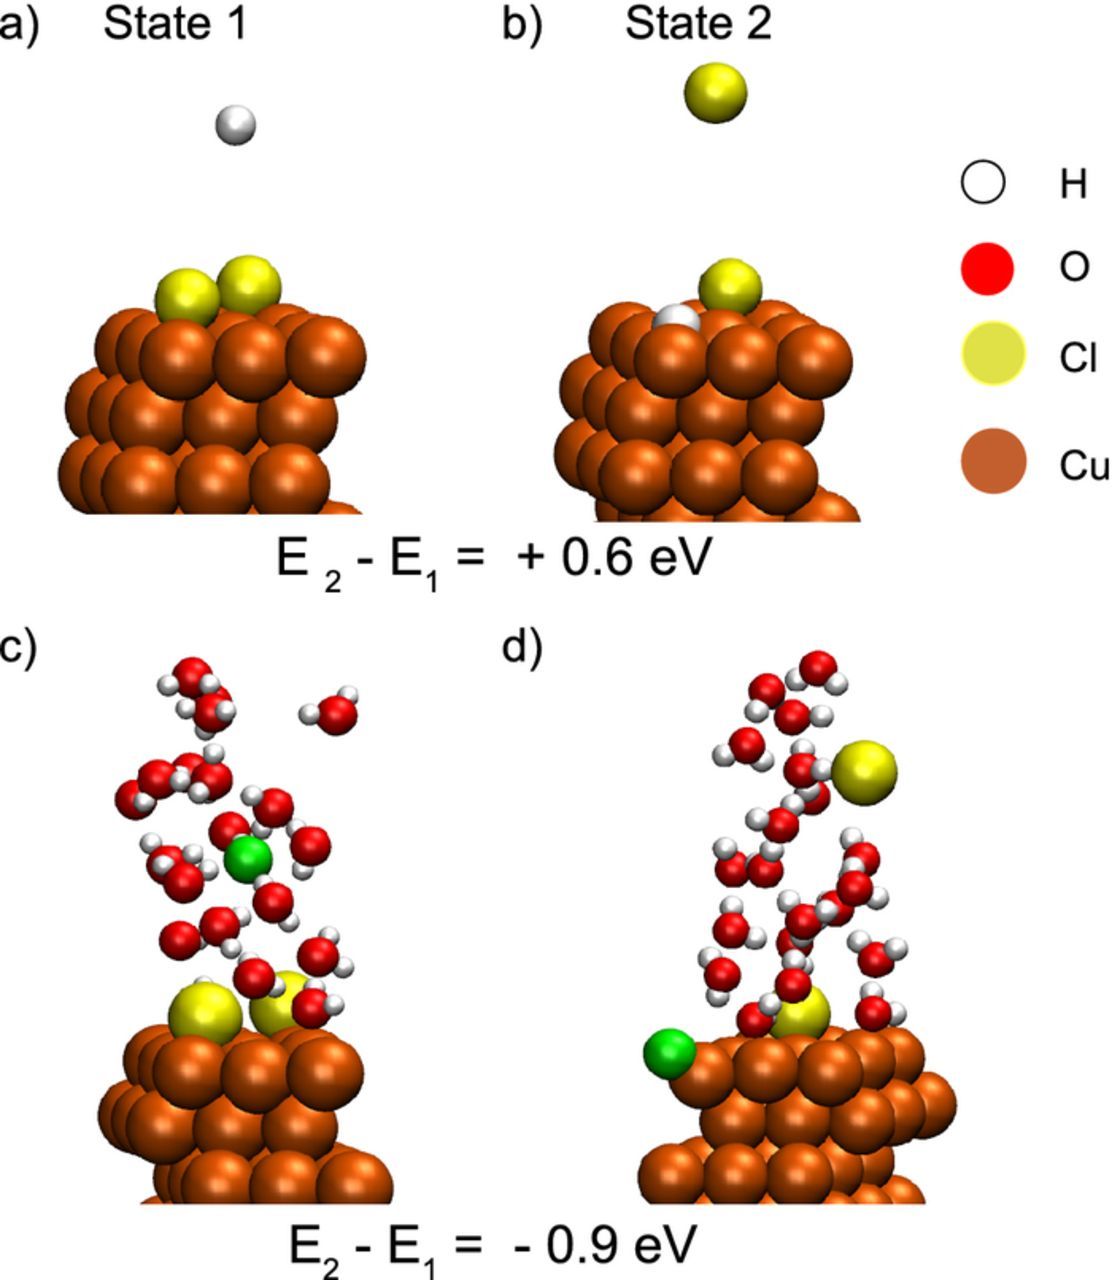
Figure 1. Different atom configurations (a) and (b) where one adsorbed chlorine atom has been replaced by hydrogen. The calculated energy difference between the two states shows that state (b) is not favored. However, in the presence of water the calculations of states (c) and (d) reveal that the replacement is favorable. Adsorbed (desorbed) H atoms are presented with green color.
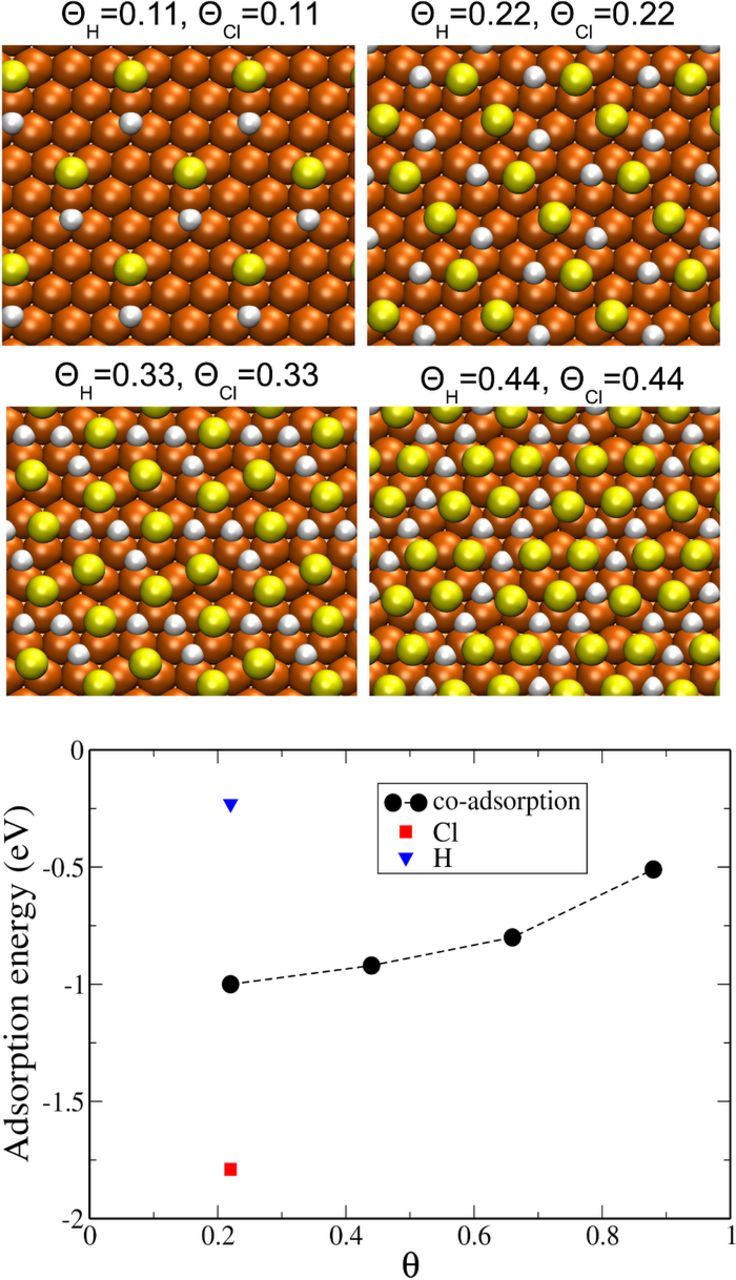
Figure 2. Top views of stable atom configurations of different coadsorption states with equal coverages of chlorine and hydrogen (atom colors as in Fig. 1). The diagram shows the corresponding mean adsorption energy as a function of the total coverage  . Additionally the adsorption energy of the individual species at a coverage of 2/9 is shown.
Comparison with experiments
On the basis of our coadsorption model introduced above, we have shown that the adsorption of the ions can be described by the standard Langmuir model with rescaled parameters. In this section, we will apply the proposed reduced model to the adsorption of chloride ions on copper in a highly acidic solution. As mentioned in the Introduction, this problem is of great importance for the electrochemical deposition of copper interconnects within the framework of the damascence technique. The adsorption of Cl and H on copper has been investigated in many studies, both experimentally and theoretically, see e.g.35–39 To our knowledge, there are only few experiments concerning the quantitative determination of the Cl coverage on copper. Here, we employ experimental findings obtained by Horanyi et al., using the radio-active method.18 As shown in Fig. 3a, the surface density of chloride on copper depends on the bias potential as well as on the chloride concentration in the bulk solution. In this work, the potential is referred to the standard hydrogen electrode (SHE). In the literature, the adsorption of chloride ions in an acidic solution is often described by the common Langmuir model for a single species without explicit consideration of the presence of hydrogen ions. The corresponding equilibrium surface density is given by formula 19 with A → Cl
![Equation ([29])](https://content.cld.iop.org/journals/1945-7111/166/1/D3042/revision1/d0029.gif)
This equation reveals the linear dependence of 1/ΓeqCl on 1/cCl. The measurement data in Fig. 3a roughly show such a linear dependence as can be seen from the plots in Fig. 3b with the bias potential as curve parameter. By fitting the data in Fig. 3b to a linear function  , the saturated surface density
  has been determined. As a remarkable result, we find from Fig. 3b how the value of
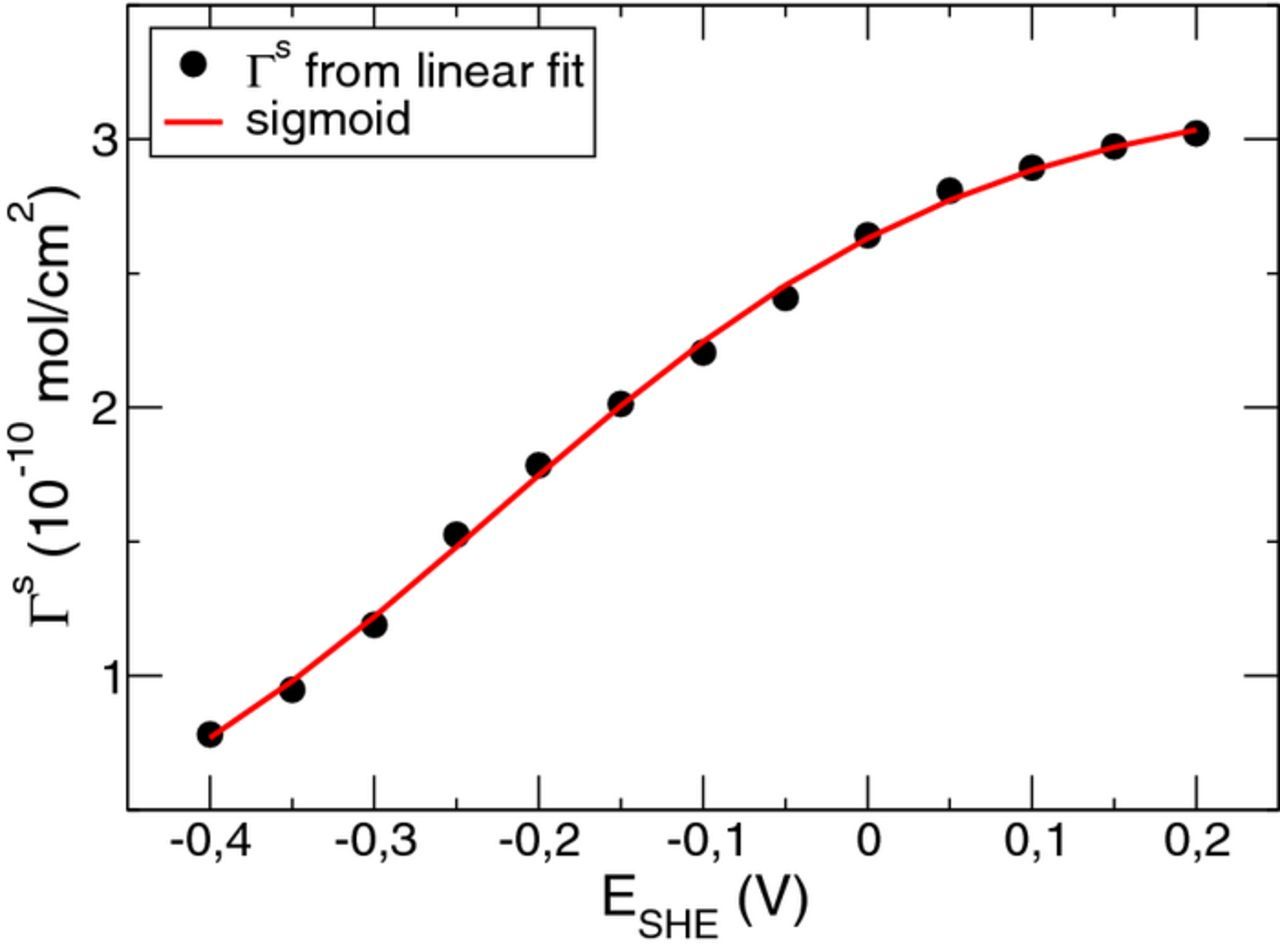
  changes with the bias potential. The symbols in Fig. 4 show
  as a function of the electrode potential. It can be seen that the saturation surface density
  decreases with decreasing potential. From our general formula 21 for the coadsorption of two species, with A → Cl and B → H, we find
![Equation ([30])](https://content.cld.iop.org/journals/1945-7111/166/1/D3042/revision1/d0030.gif)
Determination of all unknown parameters in Eq. 30 at once by fitting the potential dependence of the data in Fig. 4 was not unique. However, in all cases we found that the value of α was almost one. With α = 1, Eq. 30 simplifies to
![Equation ([31])](https://content.cld.iop.org/journals/1945-7111/166/1/D3042/revision1/d0031.gif)
Using the general formula 27, we obtain the following potential dependence of 
![Equation ([32])](https://content.cld.iop.org/journals/1945-7111/166/1/D3042/revision1/d0032.gif)
Since for positive bias potential E, chloride adsorption is more favorable than hydrogen adsorption, we expect BH > 0. Then, the saturation surface density as a function of the bias potential represents a sigmoid function with  for E → +∞ and
  for E → −∞. By introducing a critical bias potential Ec via the equation (1 − β)KHcH = exp (BHEc), the chloride saturation density can be expressed as
![Equation ([33])](https://content.cld.iop.org/journals/1945-7111/166/1/D3042/revision1/d0033.gif)
Fit of the data points in Fig. 4 to Eq. 33 yields the solid curve in Fig. 4. The corresponding parameter values are Γ0Cl = 3.21 × 10− 10 mol/cm2, BH = 6.66 V− 1 and Ec = −0.226 V.
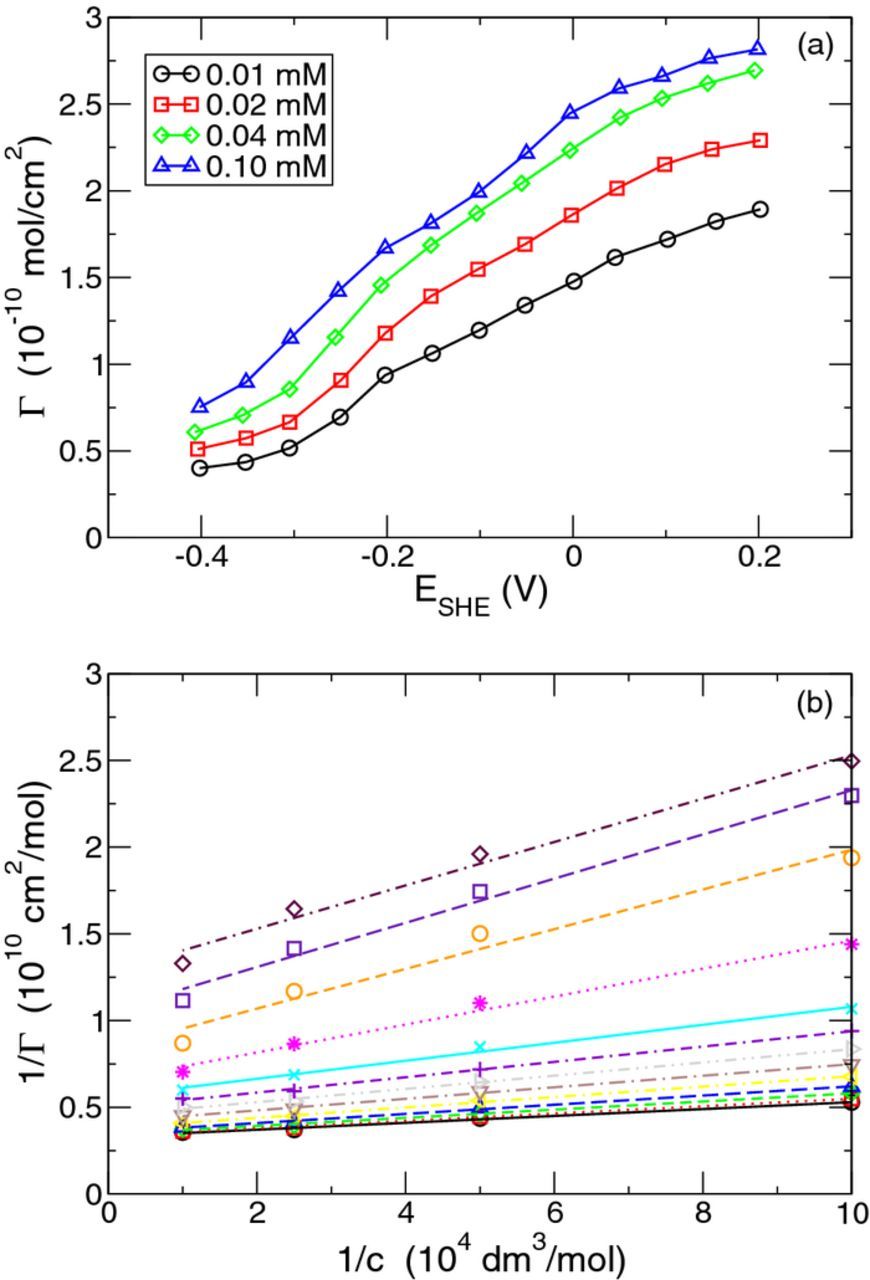
Figure 3. (a) Surface density ΓeqCl of chloride ions on copper as a function of the bias potential of the copper electrode for different chloride concentrations cCl in the bulk solution. Reproduced from data in Fig. 2 of Ref. 18 (b) Repesentation of the linear dependence of 1/ΓeqCl on 1/cCl for the data in (a) for bias potentials ESHE = −0.4 up to 0.2 V (from top to bottom).

In the linear relationship  between 1/ΓeqCl and 1/cCl, we have introduced the parameter
  (compare Eq. 29). The fit of this parameter is presented in Fig. 5a as a function of
  . Together with the derived dependence of the saturation surface density on the bias potential in Fig. 4, it is possible to derive the value of
  as a function of the potential. The corresponding data points are shown in Fig. 5b. According to the general formula 22 derived above and considering the fit result α = 1, the ratio
  is given by
![Equation ([34])](https://content.cld.iop.org/journals/1945-7111/166/1/D3042/revision1/d0034.gif)
By inserting the potential dependence introduced in Eq. 27, we find
![Equation ([35])](https://content.cld.iop.org/journals/1945-7111/166/1/D3042/revision1/d0035.gif)
Because of a considerable scatter of the data points in Fig. 5b, a general fit of all unknown parameters in Eq. 35 is unreliable. Thus, in a rough manner, we approximated the prefactor in front of KClexp ( − BClE) by one. This corresponds to the limiting case β = 0 in Eq. 35 and yields a lower estimate of the parameter BCl. As a consequence the dependence of  on the hydrogen bulk concentration cancels. The fit results read then BCl = −1.4 V− 1 and KCl = 125 m3/mol. The corresponding value of the charge transfer for chloride adsorption is eΔz = 0.036 e. For comparison, Foresti et al. studied the adsorption of chloride ions on the Ag(111) surface and found a partial charge transfer of 0.07 e (see Tab. 1 of Ref. 34). As a tendency, with increasing value of β, our fit suggests a weaker exponential potential dependence of the parameter
  since then the magnitude |BCl| decreases.
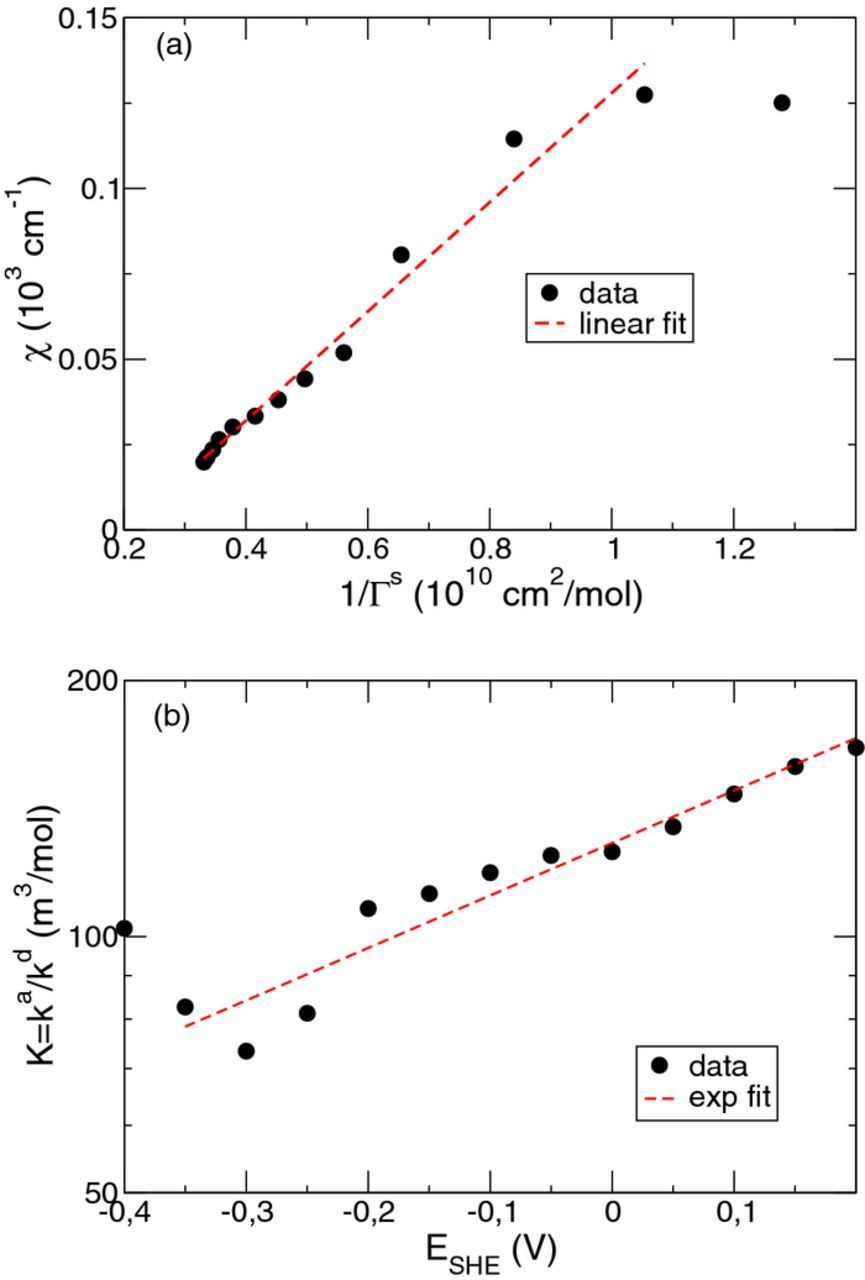
Figure 5. Parameter values of the linear fit  for the data in Fig. 3a. (a) χ as a function of
  , and (b)
  as a function of the bias potential E. The dashed lines represent a linear fit in (a) and an exponential fit in (b). Note the logarithimic scale of the ordinate in (b). The data points corresponding to ESHE = −0.4 V were excluded from the fits in (a) and (b).
In summary, the above analysis of the measurements of the adsorbed chloride surface density by Horanyi et al.18 provides us with the following basic data to predict the chloride equilibrium coverage. The potential dependence of the saturated surface concentration  is given by Eq. 33 and that of the ratio of the adsorption and desorption rate by
  . The corresponding parameter values KCl, BCl, Δz, Γ0Cl, BH, and Ec are listed in Table I. With these data, the chloride equilibrium surface density was calculated according to model Equation 29 as a function of the electrode potential for different chloride concentrations in the bulk solution. As can be seen in Fig. 6a, the simulation results agree very well with the measurements. We calculated the equilibrium surface densities also for bulk concentrations higher than in the experiments. For cCl = 1 mM and 10 mM, the equilibrium surface density ΓeqCl is very close to the saturation value
  . Increasing the chloride bulk concentration beyond 1 mM practically has no influence on the equilibrium surface density of chloride in the studied potential regime.
Table I. Model parameters for chloride adsorption in Fig. 6.
| KCl | BCl | Δz | Γ0Cl | BH | Ec | |
|---|---|---|---|---|---|---|
| Unit | m3mol− 1 | V− 1 | - | mol/cm2 | V− 1 | V |
| Fig. 6a | 125 | 1.4 | 0.036 | 3.21 × 10− 10 | 6.66 | −0.226 |
| Fig. 6b | 125 | 5.5 | 0.13 | 3.21 × 10− 10 | 0 | – |
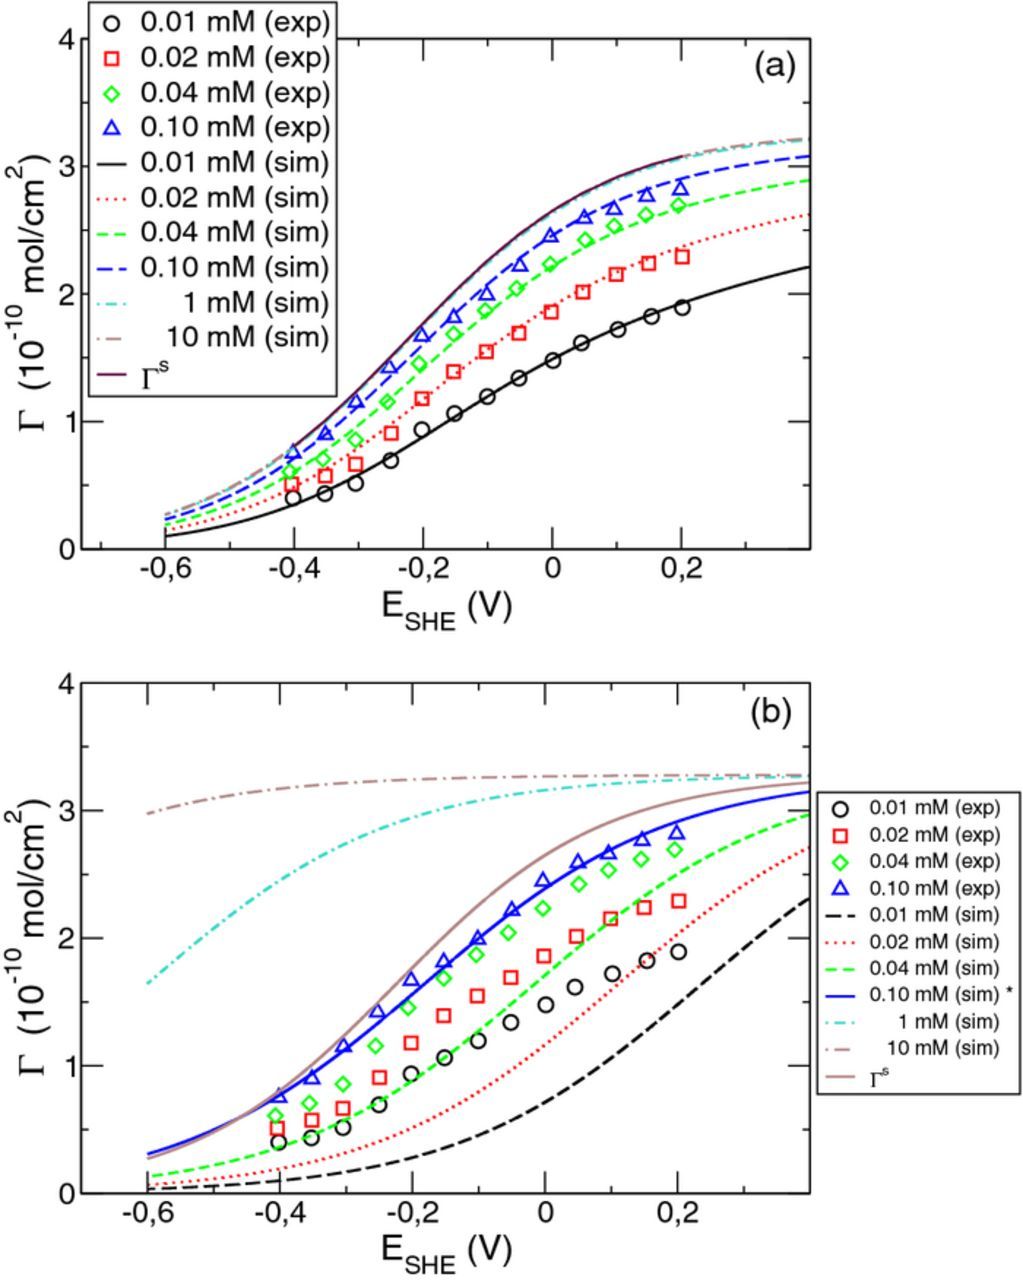
Figure 6. Simulation results for the chloride surface density as a function of the electrode potential compared to the measurements obtained in Ref. 18. (a) Calculation using the model proposed in the present work. (b) Comparative calculation assuming the absence of adsorbed hydrogen, which corresponds to a potential independent ΓSCl. See Table I for parameter values.
For comparison, we also studied a simplified adsorption model without consideration of a potential dependence of the saturation value of the surface density  , similar to approaches in Refs. 9–11,18–20. Because of our approximation β = 0 in Eq. 35, this corresponds to the limiting case of complete absence of adsorbed hydrogen. Fit of the measurements in Fig. 6a for a special bulk concentration, say c = 0.1 mM, yields the parameters
  mol/cm2 and BCl = 5.5 V− 1. The corresponding charge transfer during the adsorption process becomes 0.14 e. With these parameter values, the surface density of adsorbed chloride can be calculated for other bulk concentrations. As shown in Fig. 6b, there is a considerable disagreement between simulation and measurements. This clearly demonstrates the importance of including the potential dependence of the saturation surface density
  in the model description of chloride adsorption in an acidic solution.
Conclusions and Discussion
We proposed a simple mechanistic model of the coadsorption of two ion species in aqueous solution on an electrode surface, where the mutual interaction of the adsorbed species was phenomenologically expressed by two model parameters α and β. The meaning of these parameters was illustrated for special cases. Determination of the equilibrium surface densities of the two ion species in the coadsorbed state revealed that the the equilibrium density of one species can be expressed in form of the common Langmuir isotherm with modified model parameters depending on the concentration of the second species and the electrode potential. As one result, we found how the saturation surface density of one species in the limiting case of high bulk concentration of this species depends on the electrode potential.
Our model approach was applied to the Cl−-H+-coadsorption on copper because of its importance for the electrochemical deposition of copper. DFT calculations for this system showed that hydrogen is able to replace adsorbed chlorine atoms of a pure chloride adlayer. Calculated mean adsorption energies for several surface structures of coadsorbed chloride and hydrogen were in the range from −1 to −0.5 eV, depending on the total coverage of both species. These DFT results suggest that the presence of hydrogen should considerably affect the adsorption of chloride.
Model parameters of our phenomenological coadsorption model were estimated by comparing with radiotracer measurements of the chloride adsorption on a porous copper electrode in an acidic medium reported in Ref. 18. Those measurements suggest a potential dependence of the saturation surface density of chloride in the limit of large chloride bulk concentration as also predicted by our model. The corresponding model parameters describing this potential dependence could be fitted. A fit of the potential dependence of the kinetic parameter  was only approximately possible because of the scatter of data. To improve the parameter fit, further measurements of the chloride adsorption on copper in an acidic medium with different pH values are desirable. Furthermore, we note that the absorption of hydrogen in subsurface sites could significantly influence coadsorption (cf. for example37,39). The present model of the Cl−-H+-coadsorption together with a refined fitting of the model parameters could be helpful in the modeling of the complex process of electrochemical copper deposition in the presence of additives.
Acknowledgments
This work was funded by the EFRE fund of the European Community and by funding of the State of Saxony of the Federal Republic of Germany, project EVOLVE (project number 100218333), and is supported by the Dresden Center for Computational Materials Science (DCCMS). We also acknowledge the support by the German Research Foundation (DFG) within the Cluster of Excellence "Center for Advancing Electronics Dresden" (cfAED). We acknowledge the Center for Information Services and High Performance Computing (ZIH) at TU Dresden for computational resources. The authors thank R. Liske, R. Krause, A. Preusse, and further partners of the project EVOLVE for helpful discussions.
ORCID
Hongliu Yang 0000-0002-6021-0187