
Abstract
The regenerative free radical scavenging activity of cerium oxide (CeO2) nanoparticles was improved by tuning its microstructure via nitrogen doping (N-doping). Commercially available CeO2 (60 m2/g) and high-surface-area CeO2 (synthesized in-house; 220 m2/g) were doped with nitrogen by annealing in a nitrogen rich atmosphere. The evolution of CeO2 microstructure in Nitrogen doped (N-doped) commercial CeO2 (20 m2/g) and N-doped high-surface-area CeO2 (90 m2/g) was studied. XPS and Raman measurements revealed that N-doping of CeO2 enhanced Ce3+ surface concentration and concomitantly increased surface non-stoichiometry (surface oxygen vacancy concentration). XRD analysis of the doped samples confirmed that the nitrogen atom replaced the oxygen atom in the CeO2 lattice, yielding a lower electron density region around the N-doped sites. The high-surface-area CeO2 and its N-doped version had significantly larger lattice parameters than that of commercial CeO2 and its doped version. XAS studies revealed that the N-doped high-surface-area CeO2 had more Ce3+ active clusters than its counterparts, and effectively retained its active Ce3+ active clusters upon exposure to reactive oxygen species (ROS). To confirm, the regenerative ROS (hydroxyl radical) scavenging ability of N-doped CeO2 nanoparticles within the polymer electrolyte membrane (PEM) of an operating polymer electrolyte fuel cell (PEFC) was evaluated using in-situ fluorescence spectroscopy. The N-doped high-surface-area CeO2 showed at least 100 hours of efficient and quantitative ROS scavenging under harsh conditions - a 15-fold improvement over previous reports. This study unequivocally demonstrates that N-doping increases both the number of Ce3+ active clusters in the lattice and the Ce-O bond distance; these structural attributes enhance regenerative ROS scavenging activity of CeO2.
Export citation and abstract BibTeX RIS
The intrinsic ability of the cerium ion in CeO2 to serve as a regenerative redox couple (transitioning between Ce3+ and Ce4+) in conjunction with the high oxygen mobility within the CeO2 lattice imparts CeO2 with many outstanding properties.1 CeO2 has been widely employed in several technological domains, such as (i) as a catalyst material in automotive catalytic converters,2,3 steam reformers,4 water shift reactors5 (ii) as an electrode material in photosensitive glass sensors6,7 (iii) as an electrolyte material in solid oxide fuel cells8,9 and in polymer electrolyte fuel cells (PEFCs)10–13 (iv) as corrosion resistant materials14 and (v) in semiconductor devices.15–17 The remarkable properties of CeO2 mainly arise from the creation of oxygen vacancies in the lattice via the removal of an oxygen atom and the resultant electronic localization over the 4f states to form a single oxygen vacancy.1,18,19 This electronic localization further leads to formation of catalytically active hotspots comprising Ce3+ active clusters and multiple oxygen vacancies, which stabilize the thermodynamically unstable Ce3+ oxidation state in CeO2.1,18 The presence of active Ce3+ active clusters and oxygen vacancies in the CeO2 lattice are the primary reasons for one of its more interesting properties, namely the effective scavenging of reactive oxygen species (ROS) such as hydroxyl (·OH) and hydroperoxyl (·OOH) radicals. The regenerative ROS scavenging ability of CeO2 has been previously explored and CeO2 has been used as an antioxidant both in biological applications1 and in mitigating oxidative degradation of the polymer electrolyte membrane (PEM) in a PEFC.10,11,20–23
As we have discussed previously,24,25 the PEFC is an electrochemical device that directly converts chemical energy to electrical energy. Hydrogen/air PEFCs possesses high efficiency and modularity.26–28 However, significant technical advances are required to facilitate their commercialization and widespread use in targeted applications in the automotive, portable power, and military sectors.26–33 Component durability under an array of adverse operating conditions remains a key issue. The PEM in a PEFC is one of the components whose long-term durability is of concern, since it undergoes mechanical, thermal, and chemical degradation during fuel cell operation.24,29,34–36 The chemical degradation processes that take place in a H2/air PEFC are attributed to ROS that are generated in-situ through both chemical and electrochemical pathways. Hydrogen peroxide (H2O2) is often an intermediate formed in both pathways, and it is known to form free radical ROS in the presence of transition metal ions (Fenton mechanism).30,31 These ROS, which are hydroxyl and hydroperoxyl free radicals (at low pH), are amongst the strongest oxidizing agents known,20,37 and they initiate the oxidative degradation of both the PEM backbone and the side chains that contain ionic groups.12,36,38,39 The ultimate consequence of this degradation sequence is cell and stack failure over time.
There have been numerous approaches adopted to minimize PEM degradation.11,12,29,40–42 These include: i) lowering the number of reactive end groups or eliminating those reactive end groups in polymer membranes; ii) reducing the gas crossover across the membrane, thereby minimizing H2O2 and ROS generation; iii) optimizing fuel cell operating conditions; and iv) using free radical scavengers embedded within the membrane electrode assembly (MEA).10,43–45 By carefully tuning these approaches one can minimize, but never eliminate ROS-assisted PEM degradation. Only the complete and quantitative scavenging of the ROS generated in-situ during PEFC operation can mitigate PEM degradation with high efficacy. CeO2 has been previously used as a free radical scavenger to mitigate the ROS-induced chemical degradation of PEMs.11,20,46–49 Though CeO2 has been shown to scavenge ROS generated in-situ, its scavenging efficacy declines with time and is not truly regenerative (as desired).50–52 In our immediate past work, the ROS scavenging efficacy of commercially obtained CeO2 particles within the PEM of an operating PEFC was precisely measured for the very first time using in-situ fluorescence spectroscopy.24 While the CeO2 effectively scavenged radicals for the first 7 hours, its scavenging efficacy subsequently declined and 100% capture of ROS was not achieved after this point in time. The diminished scavenging ability of CeO2 with time on stream was attributed to the inability to maintain an adequate Ce3+ surface concentration. In other words, the non-stoichiometric CeO2 lattice was not stable. There have been many studies that have attempted to address this issue and to stabilize the Ce3+ concentration in the lattice by doping CeO2 with multivalent cations (Zr4+, Al3+, Si4+) and different metals.4,40,53–55
In this study, we report a remarkable (∼15-fold) improvement in the regenerative ROS scavenging efficacy of CeO2, achieved by carefully tuning the lattice structure of CeO2 to introduce highly stable Ce3+ active clusters that facilitated long-term retention of oxygen vacancies. The CeO2 lattice was tuned by doping it with nitrogen atoms to modify the surface composition (concentration of Ce3+).56–59 Since this doping process required a high-temperature annealing step, the resultant nitrogen-doped (N-doped) CeO2 samples had much lower surface areas and exhibited poor microstructure stability, leading to loss of active Ce3+ active clusters upon exposure to ROS. To overcome this deficiency, high-surface-area CeO2 nanoparticles were synthesized in-house and subsequently N-doped to yield samples with high surface area and excellent microstructure stability.
In this study, four different CeO2 samples were evaluated: (i) commercial CeO2 – 60 m2/g (ii) high-surface-area CeO2 – 220 m2/g (iii) N-doped commercial CeO2-20 m2/g and (iv) N-doped high-surface-area CeO2 – 90 m2/g. The evolution of CeO2 microstructure upon nitrogen doping (N-doping) and the concentration/stability of Ce3+ active clusters in the CeO2 lattice were probed using X-ray diffraction (XRD), X-ray photoelectron spectroscopy (XPS), Raman spectroscopy, transmission electron microscopy (TEM) and X-ray absorption spectroscopy (XAS). Analysis revealed that the nitrogen atom substituted the oxygen atom within the CeO2 lattice and that the N-doping induced lattice expansion in CeO2, leading to a reduction in electron density around the N-doped sites (See Figure 1). N-doping of the CeO2 favored the formation of highly stable Ce3+ active clusters and increased the surface oxygen vacancy concentration.
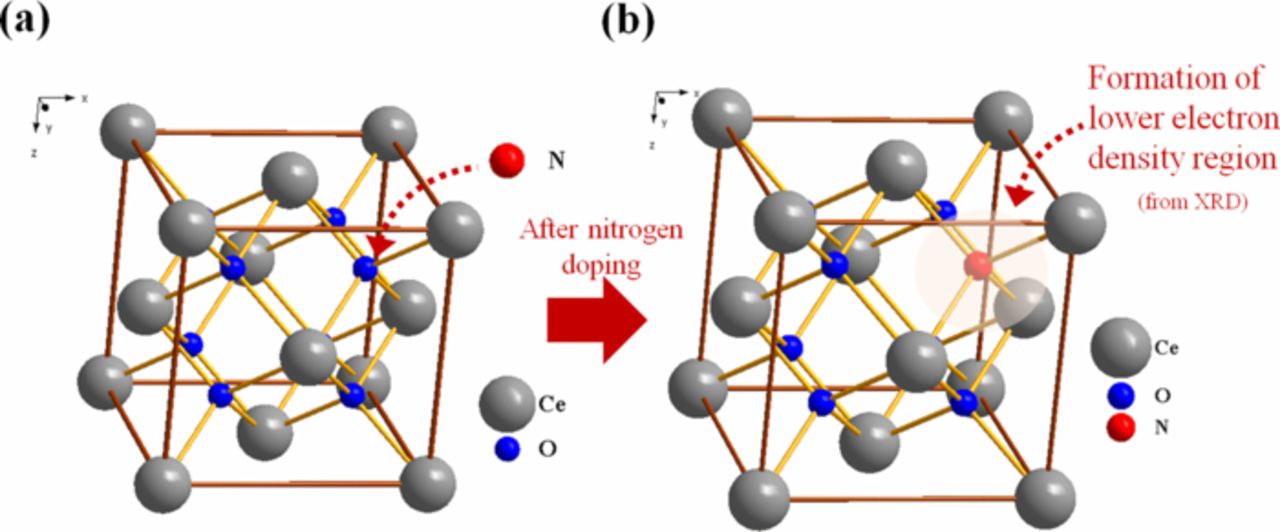
Figure 1. Representation of the crystal structure of (a) undoped CeO2 (b) N-doped CeO2. Lattice expansion and formation of regions of lower electron density was observed in/deduced from TEM and XRD analysis. All CeO2 samples exhibited a cubic FCC structure with space group of Fm3m (number 225).
Methods
Synthesis of CeO2 and N-doped CeO2 samples
Four different CeO2 samples were employed in this study: (i) commercial CeO2 (ii) high-surface-area CeO2 (iii) N-doped commercial CeO2 and (iv) N-doped high-surface-area CeO2. Commercial CeO2 was obtained from Sigma-Aldrich and high-surface-area CeO2 was synthesized in-house via a hydrothermal precipitation route using aqueous ammonia and Cerium (III) chloride heptahydrate.4,60,61 See Figure S1(a) under supporting information (SI). The commercial CeO2 and as-prepared high-surface-area CeO2 were doped via exposure to a nitrogen rich atmosphere. During the N-doping process, a polyaniline-CeO2 mixture was prepared and the mixture was annealed at 900°C under flowing argon to yield N-doped CeO2 samples57 See Figure S1(b) under SI. Detailed procedures describing the synthesis of the high-surface-area CeO2 and the N-doping of both variants of CeO2 are provided in the SI section (I.a and I.b).
BET surface area measurement
The BET surface area of all CeO2 samples was measured using a Quantachrome NOVA 2200 BET analyzer. The Brunauer–Emmet–Teller (BET) method was used to calculate specific surface area from nitrogen sorption measurements performed at −196°C.
Transmission electron microscopy
Transmission electron microscopy (TEM) was used to determine the particle size, lattice spacing and d-spacing (from small angle electron diffraction- SAED) of all CeO2 samples. The nanoparticles were dispersed in ethanol, deposited onto carbon coated copper grids and dried at room temperature. TEM micrographs were obtained using a JEOL- 3010F electron microscope at an acceleration voltage of 300 kV equipped with a LaB6 filament. Elemental analysis was performed for all CeO2 samples using X-Ray Energy Dispersive Spectroscopy (XEDS) and the details are discussed under SI section IV (Figure S3).
X-ray photo electron spectroscopy and raman spectroscopy
X-ray photoelectron spectroscopy measurements were performed using an XPS spectrometer model Axis 165 (Kratos Analytical, Shimadzu Co.), with a monochromatic X-ray source of MgKα. Raman spectra were recorded from 100 to 1200 cm−1 using a Renishaw Ramascope 2000. The calculation of Ce3+ surface concentration and surface oxygen vacancy concentration are presented under SI sections IV and V respectively.
X-ray diffraction
The X-ray powder patterns of all CeO2 samples were measured on a Bruker D2 Phaser diffractometer equipped with a LynxEye position-sensitive detector (15–100° 2θ, 0.0202144° steps, 0.5 sec/step, 0.6 mm divergence slit, 2.5E Soller slits, 3 mm scatter screen height). Quantitative phase analysis of the crystalline phases was carried out by the Rietveld method using the General Structure Analysis System (GSAS).62
X-ray absorption spectroscopy
X-ray absorption spectroscopy measurements - which include XANES (X-ray absorption near edge structure) and EXAFS (extended X-ray absorption fine structure) - were recorded for all samples at room temperature in the transmission mode using synchronton radiation with a Si (111) double crystal monochromator at the 10 BM beam line of the Advanced Photon Source (APS) at Argonne National Laboratory. Fine powder samples were uniformly spread on a 50 μm thin Kapton tape and used for the measurements. The spectra were scanned in the range of 5500 eV to 6200 eV, which covered the L3 edge XAS region of cerium atoms. The photon energy was initially calibrated with the inflection point of the Ce L3 edge of commercial CeO2. By satisfying the edge step (Δμx) of ≤ 1, the effect of sample thickness on the measurement was avoided. The thickness of the sample layers in the Kapton film was varied in each case to get a reasonable edge step.
In-situ ROS scavenging experiments
In-situ fluorescence spectroscopy was employed to determine the regenerative ROS scavenging efficacy of all CeO2 samples. Details of the in-situ fluorescence method and setup have been described in detail in our previous work, and are reproduced in the SI section (I.c - I.f).24 The membrane electrode assemblies (MEAs) described in Section I.f were used in the in-situ experiments.
These in-situ experiments were performed with the following materials added to the Nafion PEM: i) 2 wt% of undoped commercial CeO2 (ii) 5 wt% of N-doped commercial CeO2 (iii) 0.5 wt% of undoped high-surface-area CeO2 and (iv) 1 wt% of N-doped high-surface-area CeO2. The weight fractions of CeO2 in the membrane were varied since the CeO2 samples employed in this study had significant differences in their BET surface area, and it was desired to maintain the total surface area of CeO2 in the membrane constant at  . The distribution of CeO2 nanoparticles in the Nafion membrane were estimated by obtaining optical micrographs of the CeO2 impregnated membranes (refer SI section II). The CeO2 nanoparticles observed in all membrane configurations were well dispersed. These images provide the required evidence to showcase that the scavenging activity was derived from all the CeO2 added to the Nafion membrane, and that there was no significant agglomeration of CeO2 nanoparticles in the membrane. Furthermore, to ensure that the availability of CeO2 active sites exceeded the total number of ROS generated in-situ, the ratio of total number of FRS active sites available in the CeO2 samples to the total amount of ROS generated in-situ (per second) was estimated to be on the order of 105. The calculation is shown in SI section III. Given that the FRS was regenerative, it was concluded that an adequate number of active scavenging sites were present in the membrane. Hence, the regenerative ROS scavenging efficacy inferred from in-situ fluorescence experiments are an intrinsic property of the respective CeO2 samples. Two sets of in-situ experiments were performed: (i) The first set of experiments were conducted at 80°C and 75% RH, with H2 and O2 flowing at the rate of 0.1 lpm at the anode and cathode, respectively; and (ii) The second set of experiments were performed under much accelerated conditions at 90°C and 50% RH wherein the rate of ROS generation in-situ was much higher than at 80°C and 75% RH.
An in-situ fluorescence technique was chosen to monitor PEM degradation. We have established that the in-situ fluorescence method yields results that have a direct correlation with the more conventional fluoride emission rate (FER) measurements across all fuel cell operating conditions.63
Ex-situ ROS scavenging experiments
Ex-situ experiments were conducted to elucidate the stability of Ce3+ active clusters upon exposure to ROS (generated using Fenton's reagent). In the first set of experiments, both the N-doped CeO2 samples were exposed to ROS, and the surface Ce3+ concentration and surface oxygen vacancy concentration were estimated subsequent to this treatment using XPS and Raman spectroscopy. See Figure S9. In the second set of experiments (which mimicked the conditions existing in an operating fuel cell), all the CeO2 samples were exposed to ROS generated by Fenton's reagent in the presence of Nafion. Subsequent to exposure, the samples were analyzed by XAS to determine changes in the electronic structure and microstructure of the samples upon exposure to and interaction with ROS. A detailed experimental description is provided under SI (Section VI).
Results and Discussion
Investigation of effect of N-doping on CeO2 microstructure
Transmission electron microscopy
TEM images and corresponding SAED patterns were recorded for all CeO2 samples to probe their micro and nano-structure. See Figure 2. The average particle size (HRTEM), estimated lattice fringe spacing (HRTEM) and the d-spacing (SAED) obtained have been marked in the corresponding images in Figure 2. The highlights of the observations were as follows: Commercial CeO2 and its N-doped version had particle sizes of 12 nm and 20 nm respectively. Both nanowire and nanocluster formations were seen in the high-surface-area CeO2 as expected based on past reports.64 The nanowires had an average diameter of 25 nm and the nanoactive clusters had an average particle size of 4 nm. It has been postulated in the literature that the presence of nanowires among the nanoactive clusters in other metal oxide systems improved the stability of the entire oxide structure.65,66 It was hypothesized that the combination of nanoactive clusters and nanowires minimized the further ripening of CeO2 particles upon high temperature annealing during the N-doping process.66 The N-doped high-surface-area CeO2 exhibited exclusively a nanocluster morphology, with an average particle size of 15 nm, which was 5 nm less than that of N-doped commercial CeO2. The calculation of lattice fringe spacing using HRTEM images showed that commercial CeO2 and its N-doped version had the same lattice fringe spacing of 3.0 Å. The high-surface-area CeO2 and its N-doped version showed a larger lattice fringe spacing of ∼3.5 Å. The observed expanded lattice structure of the high-surface-area CeO2 samples correlated well with the increase in lattice parameter seen in XRD analysis (discussed below). SAED patterns were analyzed for all CeO2 samples and the d-spacing for the different lattice planes were indexed to the corresponding lattice planes of standard CeO2 (JCPDS# 81–0792). Refer to Table S1 (under SI, Section V) for the list for parameters extracted from the TEM analysis. The correlation of d-spacing for different lattice planes in the CeO2 crystal structure confirmed the crystallinity of all CeO2 samples, in-line with XRD observations.
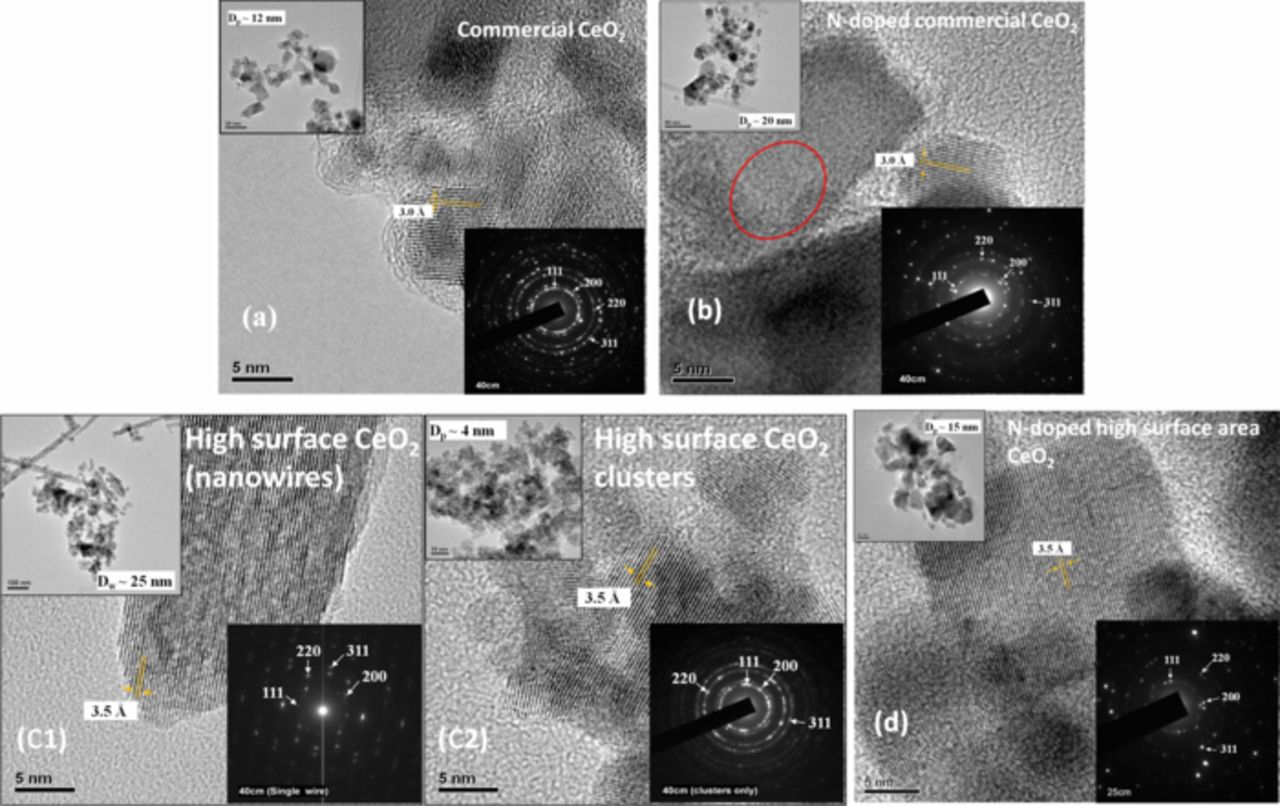
Figure 2. High-resolution transmission electron microscopy (HRTEM) micrographs of undoped CeO2 (a, c1, c2) and N-doped CeO2 (b, d). The corresponding low-resolution TEM images and diffraction patterns are placed at the top and bottom of the HRTEM images respectively. The smaller lattice fringes in N-doped commercial CeO2 (circled in red) were attributed to the difference in the orientation (viewing angle) of the CeO2 crystal during measurement.
Surface concentration of Ce3+ and oxygen vacancies
It is well-known that doping CeO2 with nitrogen increases the amount of Ce3+ sites, which are critical for scavenging ROS.56 The concentration of Ce3+ sites reflects the availability of oxygen vacancies (i.e., defects) for ROS scavenging activity.18,55 The change in the surface concentration of Ce3+ and in the surface oxygen vacancy concentration of CeO2 before and after N-doping was studied using XPS and Raman spectroscopy.
(i) X-ray photoelectron spectroscopy
All percentages are reported as mol%. The surface concentration of Ce3+ was estimated by analyzing the obtained XPS spectrum for each sample. A detailed description of the method employed, the peak assignments and method used in the calculation of Ce3+ concentration is presented under SI (Section VI) (See Figures S3 – S6 and Table II).
Table II. Estimated Ce3+ concentration, nitrogen content and oxygen vacancies of different CeO2 samples.
| Samples | Ce3+ concentration (mole%) | Nitrogen content (mole%) | Surface oxygen vacancy concentraion × 1020 vacancies cm−3 | BET surface area, m2/g |
|---|---|---|---|---|
| Commercial CeO2 | 21% | – | 1.90 | 50 |
| N-doped commercial CeO2 | 29% | 4.5% | 2.97 | 20 |
| High-surface-area CeO2 | 30% | – | 3.01 | 220 |
| N-doped high-surface-area CeO2 | 35% | 5% | 10.10 | 90 |
| N-doped commercial CeO2 after ex-situ treatment (first set of experiments) | 19% | 4% | 2.90 | – |
| N-doped high-surface-area CeO2 after ex-situ treatment (first set of experiments) | 33% | 4.9% | 9 | – |
The surface concentration of Ce3+ in undoped commercial CeO2 was estimated to be 21%. 4.5% of N-doping on commercial CeO2 resulted in an increase in Ce3+ surface concentration to 29 mol%. Likewise, the surface concentration of Ce3+ in undoped high-surface-area CeO2 was estimated to be 30% and 5 mol% of N-doping on high-surface-area CeO2 resulted in an increase in the Ce3+ surface concentration to 35 mol%. Thus, XPS analysis confirmed that N-doping enhanced the Ce3+ surface concentration in CeO2.
(ii) Raman spectroscopy
The surface oxygen vacancy concentration varies with the Ce3+ surface concentration. Raman spectroscopy was used to estimate the concentration of surface oxygen vacancies in each sample (see SI, Section VII, for details of the calculations). Raman spectroscopy was recorded for all CeO2 samples in the interval 300 cm−1 to 600 cm−1 (See Figure 3a). A Raman active mode at 460 cm−1 was observed in all samples, and was attributed to the symmetrical stretching mode of the Ce-O8 vibrational unit.55,67,68 Figure 3b shows the Raman spectrum of N-doped high-surface-area CeO2 scanned from 600 to 2400 cm−1. The peak observed around 1300 cm−1 was assigned to the longitudinal optic mode of Ce3+ from the excited 5d state in the conduction band to the 4f state of Ce; an additional peak at 1600 cm−1 was attributed to nitrogen atom occlusion on the CeO2 surface.56
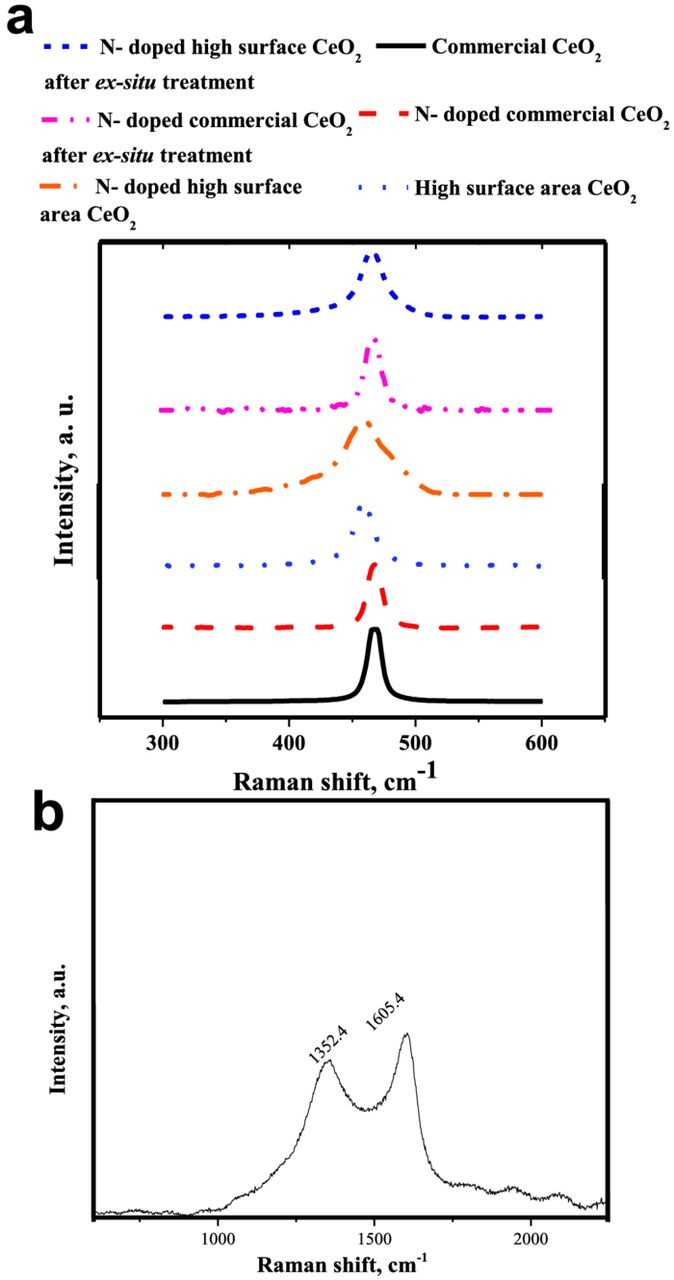
Figure 3. (a) Raman spectra of commercial CeO2, N-doped commercial CeO2, high-surface-area CeO2 and N-doped high-surface-area CeO2 scanned from 300 cm−1 to 600 cm−1 (b) Raman spectrum of N-doped high-surface-area CeO2 scanned from 600 cm−1 to 2400 cm−1.
Undoped commercial CeO2 had a surface oxygen vacancy concentration of 1.9 × 10¹⁹ vacancies cm−3 while N-doped commercial CeO2 had an enhanced surface oxygen vacancy concentration of 3 × 10²⁰ vacancies cm−3. The surface oxygen vacancy concentration of high-surface-area CeO2 was 3 × 10²⁰ vacancies cm−3, which was equivalent to the surface oxygen vacancy concentration observed in N-doped commercial CeO2. The N-doped high-surface-area CeO2 showed a further enhancement in the surface oxygen vacancy concentration to 1.01 × 10²¹ vacancies cm−3. This analysis confirmed that N-doping of CeO2 enhanced its surface oxygen vacancy concentration.
X-ray diffraction of CeO2 samples
Figure 4 presents the X-ray diffractograms of the four CeO2 samples evaluated. The diffraction peaks of all CeO2 samples could be completely indexed to the cubic FCC structure of CeO2 (JCPDS no. 81–0792). The average value of the cubic lattice parameter (a, Å) of stoichiometric CeO2 is 5.4112 Å.62 The commercial CeO2 sample and its N-doped version had lattice parameters slightly higher than this value (5.4123 Å and 5.4125 Å respectively). The high-surface-area CeO2 and its N-doped version had significantly larger lattice parameters (5.4189 Å and 5.4192 Å respectively). See Table I. The expanded unit cell observed in high-surface-area CeO2 was attributed to the increase in the concentration of Ce3+ active clusters and a corresponding increase in Ce-O distance (as ascertained from XPS and XAS analysis, respectively). The crystallinity of the CeO2 samples was quantified using the scale factor determined by least squares refinement during Rietveld analysis. The scale factor is the constant factor that scales the calculated intensities of all reflections in the XRD pattern up to the observed intensities. The scale factor for commercial CeO2 was the largest, and this sample was assigned a crystallinity of 100%. The crystallinity of all the other samples was compared against this benchmark. See Table I. It was postulated that the annealing process at 900°C (during N-doping) induced an increase in N-atoms introduced into the CeO2 structure.69 The increase in the N-atoms in CeO2 surface resulted in an increase in the number of defects, leading to loss of crystallinity. The loss of crystallinity was more significant in N-doped high-surface-area samples, implying that phase transformation occurred on a more significant scale during the N-doping process on high-surface-area CeO2.
Table I. Parameters calculated from analysis of XRD patterns of all CeO2 samples.
| Parameters | Commercial CeO2 | N-doped commercial CeO2 | High-surface-area CeO2 | N-doped high-surface-area CeO2 |
|---|---|---|---|---|
| a, Å | 5.41233(9) | 5.41258(7) | 5.41899(37) | 5.41920(38) |
| Scale | 21.09(6) | 19.94(7) | 20.61(9) | 11.46(11) |
| % Crystallinity. | 100 | 94.7 | 97.7 | 54.3 |
| Crystallize size, Å | 330(1) | 770(10) | 156(3) | 133(3) |
| Ce Uiso, Å2 | 0.0019(2) | 0.0049(2) | −0.0001(4) | 0.0055(7) |
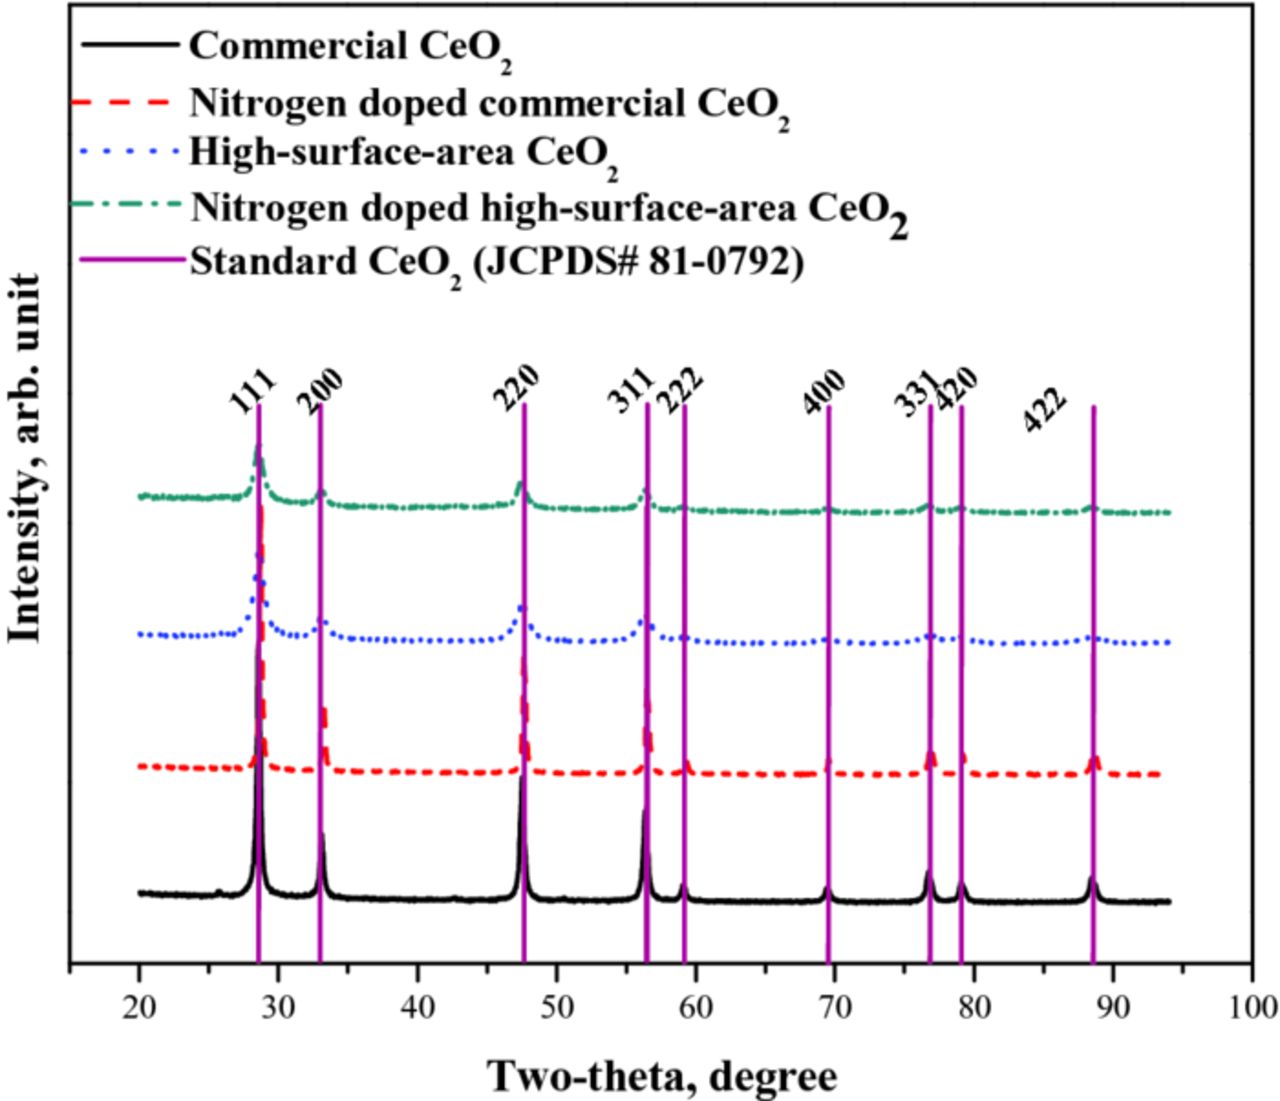
Figure 4. X-ray diffraction patterns of commercial CeO2, N-doped commercial CeO2, high-surface-area CeO2 and N-doped high-surface-area CeO2.
The electron density at the Ce site was probed using the isotropic displacement coefficient (Uiso) calculated after Rietveld refinement.70 See Table I. The value of Uiso for commercial CeO2 was smaller than the corresponding value for the N-doped sample, indicating the formation of a lower electron density region in the vicinity of the nitrogen rich sites in the N-doped sample (likewise for the high-surface area samples). The formation of lower electron density regions in the lattice upon N-doping was in line with expectations as the nitrogen atoms inside the CeO2 lattice replaced the more electronegative oxygen atom. This phenomenon was previously observed and reported in nitrogen-doped on carbon nanotubes.71 The difference Fourier maps were calculated using GSAS in an attempt to map the nitrogen atoms in the crystal structure of CeO2. The possibility of interstitial inclusion of nitrogen atoms within CeO2 lattice was completely ruled out as no acceptable coordinates for the interstitial placement of nitrogen atom could be obtained from the Fourier mapping calculation. (The interstitial placement of nitrogen atom based on the coordinates found by Fourier mapping yielded a Ce-N distance of less 2 Å which was not feasible).70 The elimination of interstitial nitrogen suggested that the most likely structure involved the substitution of lattice oxygen atoms with nitrogen upon doping.
X-ray absorption spectroscopy
XAS was employed to probe the electronic transitions in the local atomic states of CeO2. The spectra obtained from XAS can be subdivided into two regions, namely XANES and EXAFS. The XANES region primarily probes the low-lying discrete and extended electronic states, which provides insights into the local geometry and valence states of CeO2. The EXAFS region probes the continuum states above the vacuum limit with the help of higher energy irradiation; this provides insights into the global geometry and the unoccupied electronic states in the material. The normalized XANES spectra of the cerium L3 edge and Fourier transformed EXAFS signals for all CeO2 samples are shown in Figure 5. The proximity of the L2 edge of cerium to the L3 edge limited the utilizable energy range to 440 eV above the L3 edge. This complication limited the information that could be derived based on structure-dependent oscillations (e.g. Ce-neighbor distance). In this study, the main focus was placed on monitoring the electronic transitions observed in the different CeO2 samples as a consequence of N-doping. The XANES spectra of all CeO2 samples showed two distinct peaks (marked as I and II in Figure 5a) arising from the electronic transition of 2p3/2 → 5d5/2 and 5d3/2, with the final state configuration describable as [*]4f1Ln-15d1 and [*]4f1Ln 5d1.69 Qualitative observation of the XANES spectra suggested that the first electron transition (2p3/2 → 5d 5/2) was favored in the N-doped versions of CeO2. This in turn suggested that more electronic transitions were occurring from the Ce3+ state, confirming the abundant existence of active Ce3+ active clusters in the N-doped samples. The decreasing participation of the 4f1Ln 5d1 component in the ground state was correlated to the decrease of the crystal field acting on the Ce ion.69 This was consistent with our observations about the crystallinity of the various samples as gathered from XRD. The 2p3/2 → 5d5/2 transition was larger in the N-doped high-surface-area CeO2 than in the N-doped commercial CeO2, which implied that a larger numbers of catalytically active Ce3+ active clusters resided in the high-surface-area samples.
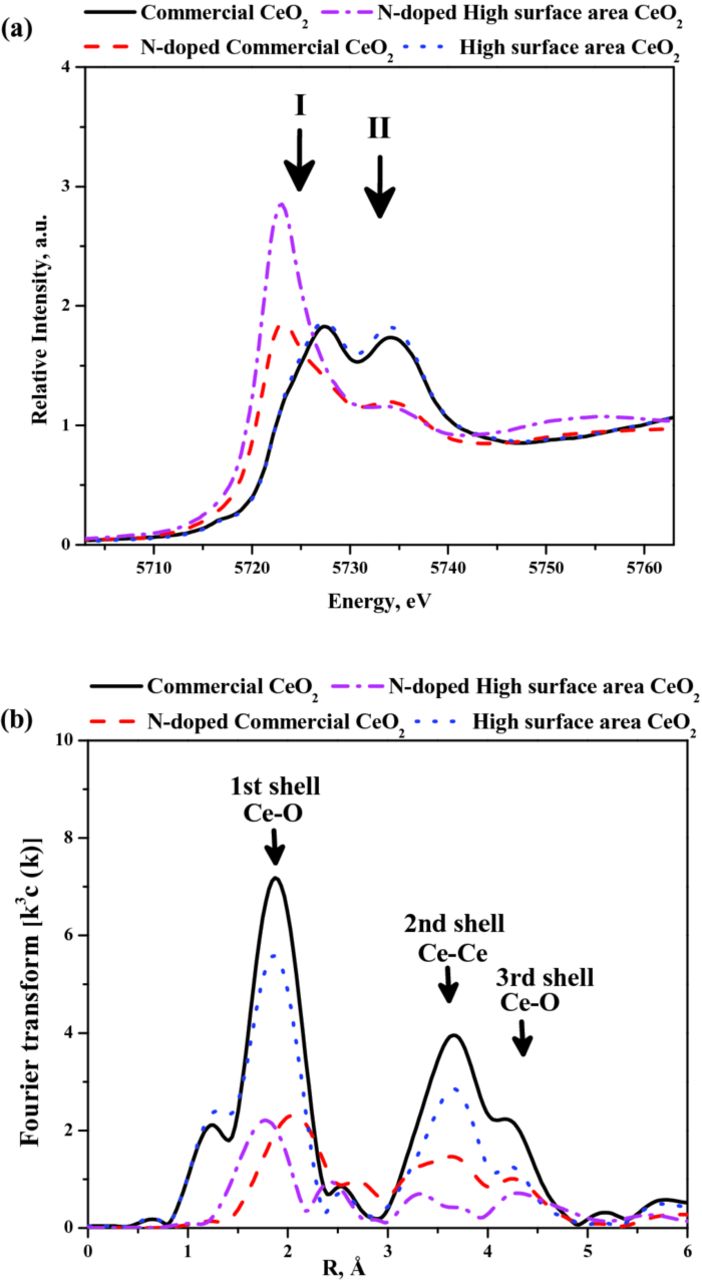
Figure 5. (a) XAS spectra: The normalized XANES spectra of all CeO2 samples. (b) The Fourier-transformed EXAFS oscillations for all CeO2 samples.
The EXAFS region the XAS spectra were analyzed after processing the data as follows: the data were initially processed for background removal and the normalized EXAFS spectra obtained using the following equation.72
Where k is the wavenumber, μ(k) is the measured absorption, μ○(k) is the background, and Δμ○(0) is the edge step. After backround substraction, Fourier transforms of χ(k) to r space with k3 weighting factor and a Hanning window function (Dk1 = 0.2 and Dk2 = 4) were performed using the Athena data analysis system. From the Fourier transformed EXAFS data in r space, the qualitative change in the coordination number (number of Ce neighbors) and bond distances such as Ce-O (first shell), Ce-Ce (second shell) and Ce-O (third shell) were extracted from Figure 5b (the corresponding shells (Ce-O, Ce-Ce and Ce-O) are labeled in the figure). A significant increase in the first shell Ce-O distance and a corresponding decrease in intensity of the Fourier transformed EXAFS signals were observed in the N-doped samples. The increase in the Ce-O distance was attributed to lower orbital mixing (which causes lower covelency and higher ionicity) and to lower crystal field formation; the corresponding decrease in intensity was attributed to the decrease in the coordination number.69,73 It was postulated that the greater ionic nature of the Ce-O bond strengthened the CeO2 lattice and improved stability during prolonged ROS scavenging.
In-situ evaluation of regenerative ROS scavenging efficacy of CeO2 samples
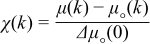
In-situ fluorescence spectroscopy experiments were performed to determine the regenerative ROS scavenging capacity of all samples.24 The results obtained from the experiments performed at 80°C and 75% RH are shown in Figure 6. Briefly, any decay in fluorescence is indicative of ROS action (and hence lack of efficacy of ROS scavenging). The undoped samples exhibited high free radical scavenging efficacy for the first 40 hours, but subsequently began to lose scavenging ability as evidenced by the decay in the fluorescence signal emanating from within the PEM. On the other hand, the PEMs containing N-doped samples (both commercial and high-surface-area variants) evidenced no decay in the fluorescence signal for at least 60 hours, confirming superior regenerative scavenging of the free radicals generated in-situ. This demonstrated that N-doping enabled CeO2 to retain its regenerative ROS scavenging capacity for a longer time period.
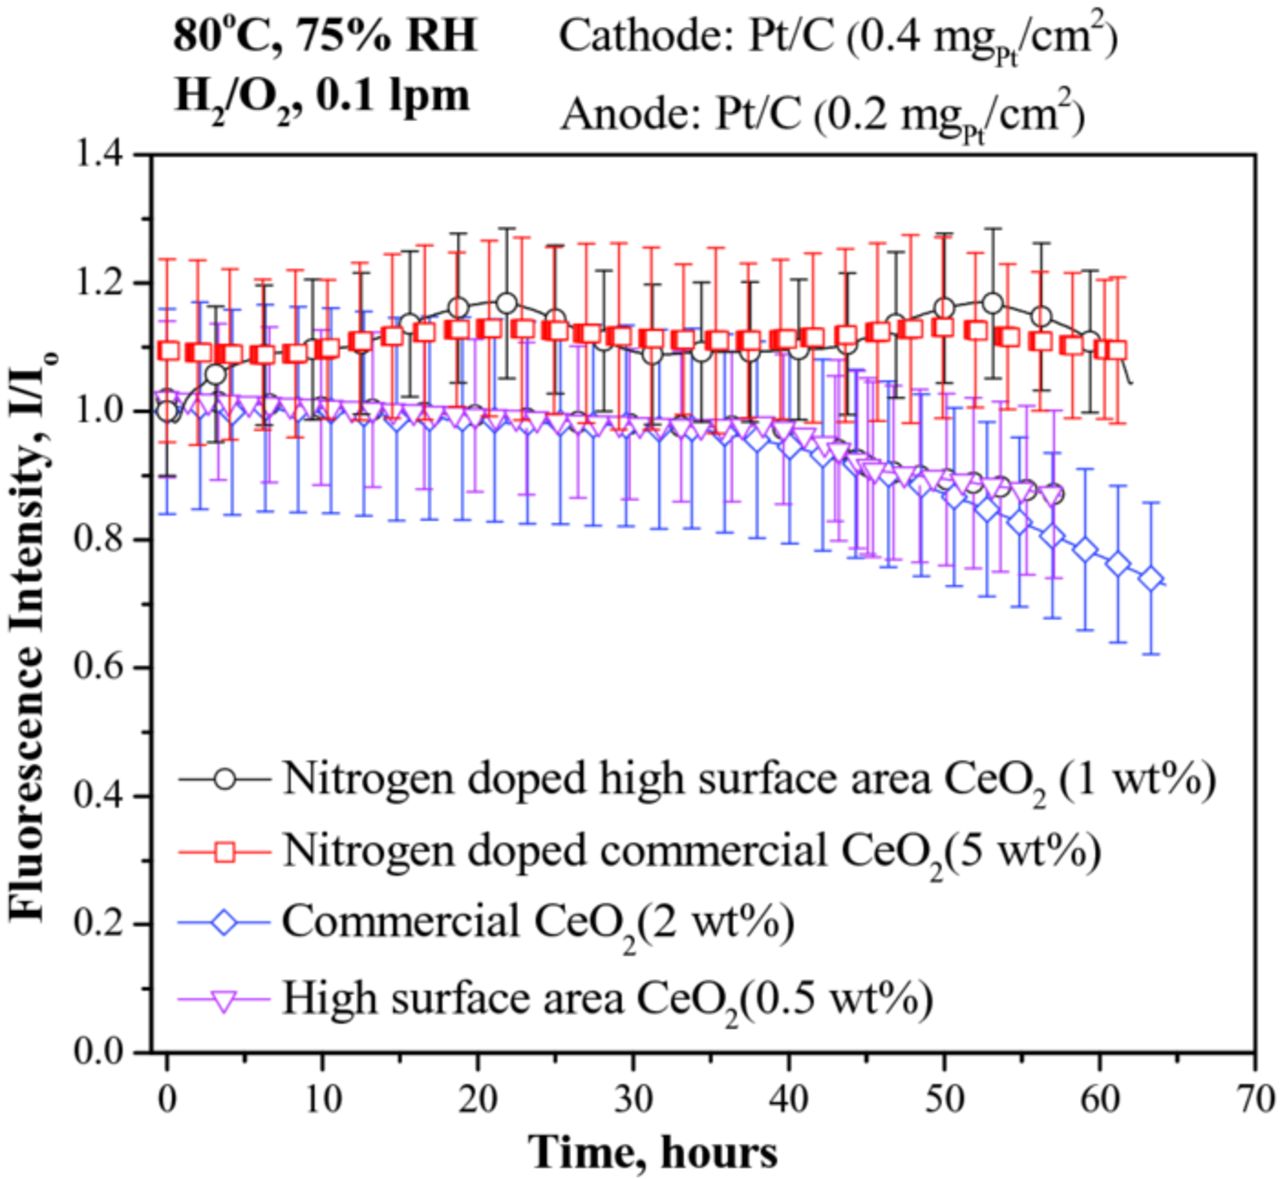
Figure 6. In-situ fluorescence spectroscopic estimation of regenerative ROS scavenging efficacy within the PEM of an operating PEFC upon addition of: (i) 2 wt% of undoped commercial CeO2 (ii) 0.5 wt% of undoped high-surface-area CeO2 (iii) 5 wt% nitrogen-doped commercial CeO2 and (iv) 1 wt% of nitrogen-doped high-surface-area CeO2. All experiments were performed at 80°C and 75% RH under flowing H2/O2 at a flow rate of 0.1 lpm.
To distinguish between the two nitrogen-doped samples (i.e. to establish whether the surface area of the N-doped cerium oxide and resultant changes in microstructure played a role in ROS scavenging efficacy), a similar in-situ fluorescence experiment was conducted under much accelerated conditions at 90°C and 50% RH, wherein the rate of ROS generation in-situ would be much higher than at 80°C and 75% RH. The results obtained are shown in Figure 7. Under these conditions, the N-doped commercial CeO2 lost its regenerative ROS scavenging ability after 40 hours. However, the N-doped high-surface-area CeO2 showed no change in ROS scavenging efficacy even after 100 hours, at which point the experiment was stopped. The exceptional regenerative scavenging efficacy of the N-doped high-surface-area CeO2 was attributed to to the higher quantity and higher stability of the Ce3+ active clusters as well as to the higher stability of Ce-O bond in its lattice, as discussed under microstructure characterization. Further ex-situ experiments were performed to confirm this hypothesis.
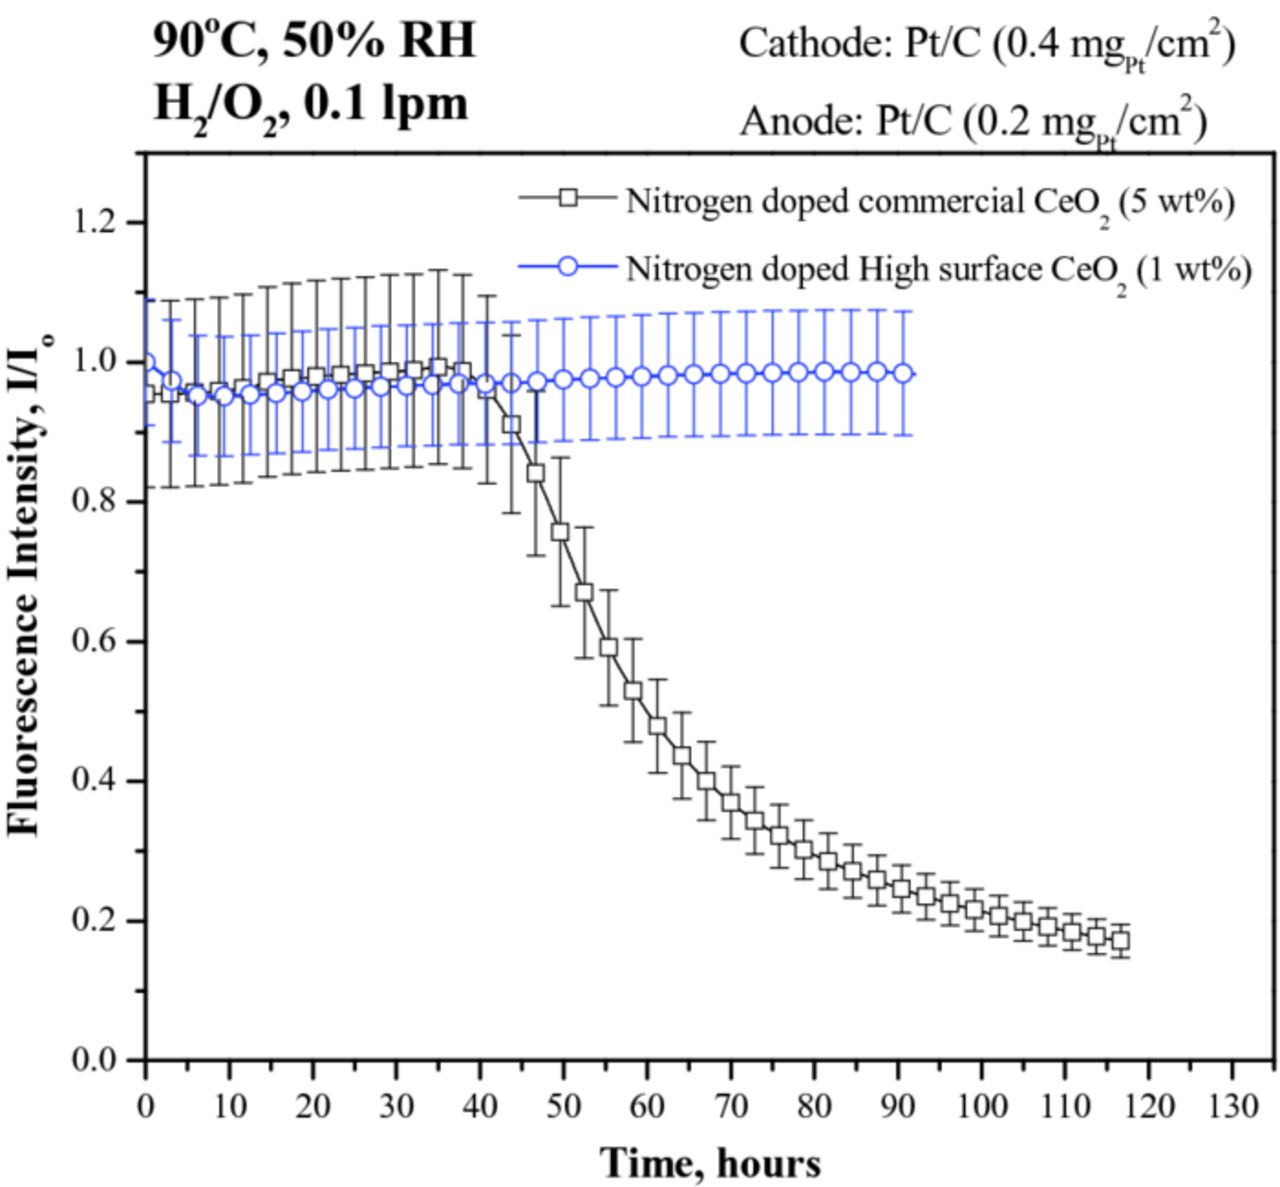
Figure 7. In-situ fluorescence spectroscopic estimation of regenerative ROS scavenging efficacy within the PEM of an operating PEFC upon addition of: (i) 5 wt% N-doped commercial CeO2, and (ii) 1 wt% N-doped high-surface-area CeO2. The experiments were performed at 90°C and 50% RH under flowing H2/O2 at a flow rate of 0.1 lpm.
Impact of exposure to ROS on CeO2 microstructure (Ex-situ studies)
The CeO2 samples were studied using ex-situ experiments designed to elucidate the stability of Ce3+ active clusters upon exposure to ROS (generated using Fenton's reagent). In the first set of experiments, both the N-doped CeO2 samples were exposed to ROS generated using Fenton's reagent. This ex-situ experiment did not provide any tangible insights into the mechanism underlying the observed difference in the regenerative ROS scavenging capacity in the N-doped CeO2 samples. See Figure S7. A second set of ex-situ experiments were performed by mimicking the conditions existing during fuel cell operation, wherein XAS spectra were recorded after sample exposure to ROS (Fenton's reagent) in Nafion. The normalized XANES spectra of the cerium L3 edge and the Fourier-transformed EXAFS signals for all treated CeO2 samples are presented in the Figure 8. From the normalized XANES spectra of the commercial CeO2 sample, a decrease in the number of active Ce3+ active clusters upon exposure to ROS could be discerned. A corresponding decrease in the Ce-O distance was also observed in the Fourier transformed EXAFS spectra of this sample (See Figure 8a). The N-doped commercial CeO2 showed a small increase in the number of Ce3+ active clusters, but a decrease in the Ce-O distance upon ROS exposure in Nafion (See Figure 8b). The normalized XANES spectra and Fourier transformed EXAFS spectra of high-surface-area CeO2 showed a small decrease in both the number of Ce3+ active clusters and in Ce-O distance upon exposure to ROS. (See Figure 8c). The normalized XANES spectra of N-doped high-surface-area CeO2 revealed that there was an increase in the number of active Ce3+ active clusters upon exposure to ROS. Likewise, an increase in the Ce-O distance was observed from the Fourier transformed EXAFS spectra obtained with this sample. (See Figure 8d).
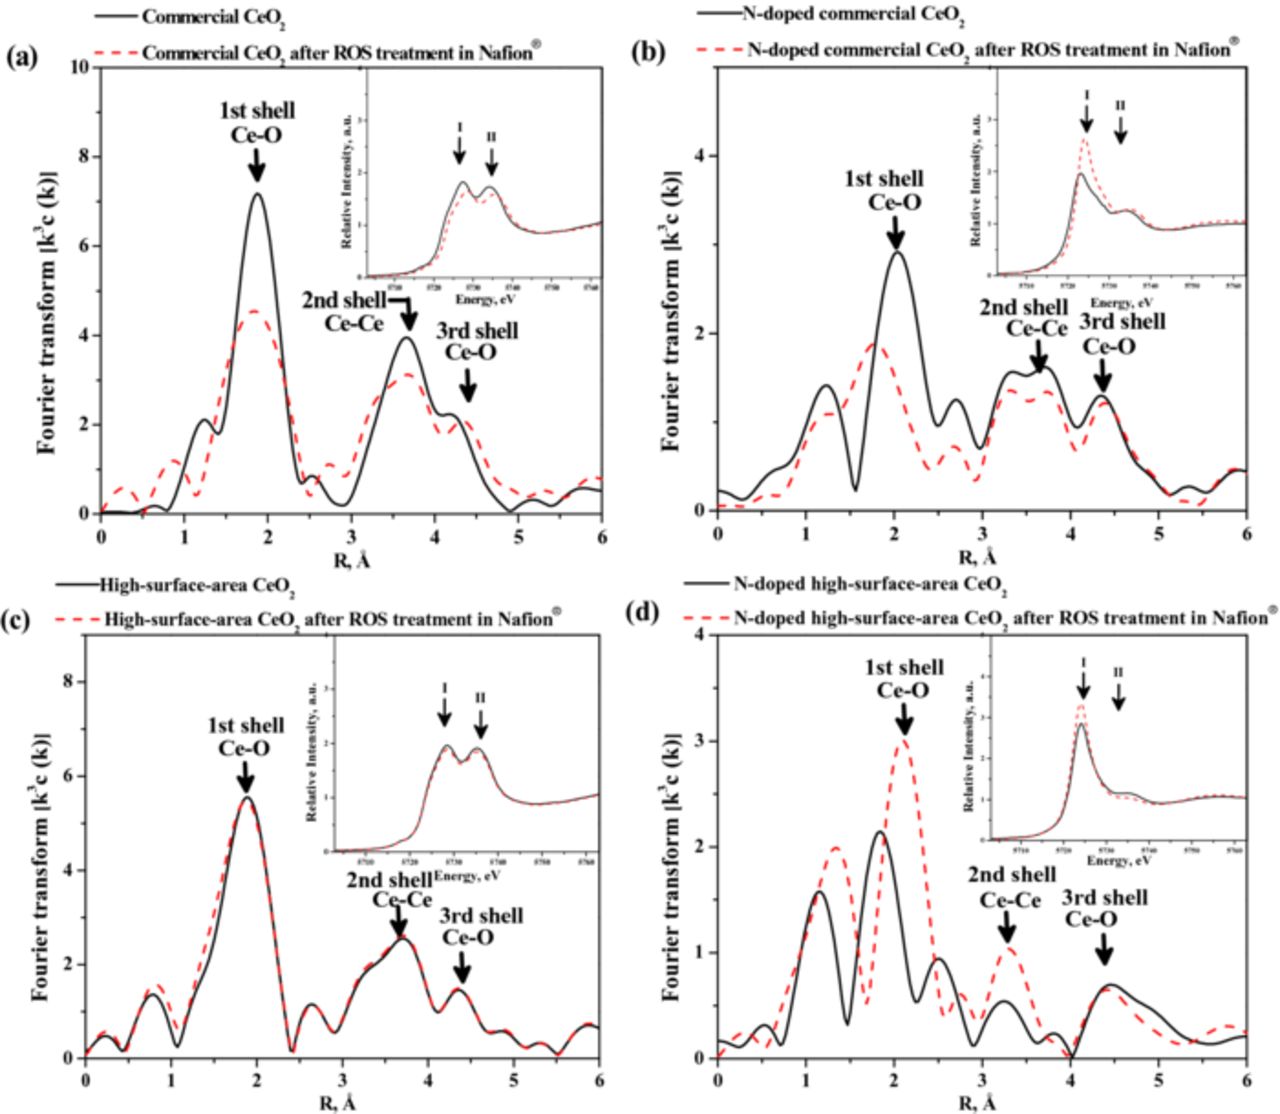
Figure 8. Fourier-transformed EXAFS oscillations of (a) commercial CeO2 (b) N-doped commercial CeO2 (c) high-surface-area CeO2 and (d) N-doped high-surface-area CeO2 after ex-situ exposure to ROS. Inset: The corresponding normalized XANES spectra for the samples after ex-situ exposure to ROS.
It is reported in the literature that there exist two possible events that can occur during ROS scavenging by CeO2: (i) First, CeO2 changes its valence state from +3 to +4 upon scavenging ROS. The presence of a larger Ce3+ active clusters after the ROS scavenging reaction is advantageous in that this allows the CeO2 to beter retain/regenerate its ROS scavenging ability.74,75 (ii) Second, the increase in Ce-O bond distance during the ROS scavenging reaction leads to an expansion of the CeO2 lattice structure. This CeO2 lattice expansion favors the creation of additional oxygen vacancies in CeO2 at the end of the ROS scavenging reaction.69 To maintain its regenerative ROS scavenging ability, the CeO2 has to either retain its expanded lattice structure (i.e. retain the larger Ce-O bond distance) or, at most, revert back to its normal lattice structure (i.e. retain the Ce-O bond distance before ROS exposure).74,75 Based on these insights and from our observations, we propose that a contracted lattice structure (i.e. shorter Ce-O bond distance) at the end of the ROS scavenging reaction leads to loss of regenerative ROS scavenging ability in CeO2. Furthermore, we propose that the sustained regenerative ROS scavenging ability of CeO2 depends on the simultaneous occurrence of both of the above mentioned events (i.e. both enhancement in Ce3+ clusters and increase in Ce-O bond distance) at the end of the ROS scavenging reaction. The rationale is presented below.
Our XAS experimental results demonstrated that there was a loss of Ce3+ active clusters and a decrease in Ce-O bond distance in the commercial CeO2 at the end of the ROS scavenging reaction; this correlated well with the loss of in regenerative ROS scavenging ability of this material. Similarly, while N-doped commercial CeO2 showed an increase in Ce3+ active clusters, it also exhibited the decrease in Ce-O bond distance at the end of the ROS scavenging reaction, ultimately leading to loss of regenerative ROS scavenging ability. High-surface-area CeO2 exhibited a small decrease in Ce3+ active clusters and Ce-O bond distance upon exposure to ROS. Though these changes were small relative to commercial CeO2, the high-surface-area CeO2 still lost its regenerative ROS scavenging ability. N-doped high-surface-area CeO2 evidenced a clear increase in both the number of Ce3+ active clusters and in the Ce-O bond distance at the end of the ROS scavenging reaction. This was the only material to also demonstrate quantitative regenerative ROS scavenging for over 100 hours under harsh conditions (at which point the experiment was stopped).
Based on these observations and the above discussion, the in-situ fluorescence spectroscopy results correlated well with the results obtained from ex-situ ROS scavenging experiments. The superior regenerative ROS scavenging activity capacity of the N-doped high-surface-area CeO2 was attributed to: a) the facilitation of a large number of active Ce3+ active clusters and, importantly, the retention of these active clusters even upon exposure to ROS; and b) maintaining an expanded lattice (Ce-O bond distance) upon exposure to ROS.
Conclusions
Commercial CeO2 and high-surface-area CeO2 (synthesized in-house) were doped with nitrogen by annealing in a nitrogen rich atmosphere. The BET surface areas of commercial CeO2, N-doped commercial CeO2, high-surface-area CeO2 and N-doped high-surface-area CeO2 were 60 m2/g, 20 m2/g, 220 m2/g and 90 m2/g respectively. The evolution of CeO2 microstructure in N-doped CeO2 samples was probed using XRD, TEM, XAS XPS and Raman spectroscopy.
The particle sizes, lattice fringe spacing and d-spacing of all the CeO2 samples were calculated using TEM, HRTEM and SAED respectively. Commercial CeO2 and its N-doped version had particle sizes (12 nm and 20 nm respectively) larger than that of High-surface-area CeO2 (nanowire- 25 nm; nanocluster - 4 nm) and its N-doped version (15 nm). High-surface-area CeO2 exhibited both nanowire and nanocluster formations, with average diameters of 25 nm and 4 nm respectively. The N-doped high-surface-area CeO2 exhibited a nanocluster morphology, with an average particle size of 15 nm. HRTEM images confirmed that the high-surface-area CeO2 samples had an expanded lattice structure. The correlation of d-spacing (calculated from SAED patterns) for different lattice planes in the CeO2 crystal structure confirmed the crystallinity of all CeO2 samples. XPS and Raman measurements revealed that doping CeO2 with nitrogen enhanced the surface concentration of Ce3+ and concomitantly increased surface non-stoichiometry (surface oxygen vacancy concentration) in both commercial CeO2 and high-surface-area CeO2.
XRD revealed the presence of the cubic FCC structure of CeO2 in all the samples. The high-surface-area CeO2 and its N-doped version had significantly larger lattice parameters (5.4189 Å and 5.4192 Å respectively) than commercial CeO2 sample and its N-doped version (5.4123 Å and 5.4125 Å respectively). The expanded unit cell observed in high-surface-area CeO2 was attributed to the increase in the concentration of Ce3+ active clusters and a corresponding increase in Ce-O distance. XRD analysis also confirmed that the nitrogen atom replaced the oxygen atom in the CeO2 lattice and that a lower electron density region prevailed around the N-doped sites. Qualitative observation of XANES spectra suggested that the first electron transition of 2p3/2 → 5d5/2 was larger in the N-doped high-surface-area CeO2 than in the N-doped commercial CeO2, which implied that a large number of catalytically active Ce3+ active clusters resided in the high-surface-area samples. The qualitative change in the Ce-O (first shell) was ascertained from the Fourier transformed EXAFS data in r space. The significant increase in the first shell Ce-O distance observed in the N-doped samples was attributed to lower orbital mixing and to lower crystal field formation; the corresponding decrease in intensity was attributed to the decrease in the coordination number.
In-situ fluorescence spectroscopy experiments in an MEA running at 80°C and 75% RH showed that the undoped CeO2 lost ROS scavenging efficacy beyond 40 hours, as evidenced by the decay in the fluorescence signal emanating from within the modified PEM. In contrast, N-doped CeO2 (both commercial and high-surface-area) evidenced no degradation in the fluorescence signal for at least 60 hours, confirming quantitative regenerative scavenging of the free radicals generated in-situ. However, under accelerated degradation conditions (90°C and 50% RH), N-doped commercial CeO2 lost its regenerative ROS scavenging ability after 40 hours, while N-doped high-surface-area CeO2 showed at least 100 hours of regenerative scavenging lifetime. Based on concurrent ex-situ ROS scavenging experiments (coupled with XAS analysis), the exceptional regenerative scavenging efficacy of the N-doped high-surface-area CeO2 was attributed to a simultaneous increase in both the number of Ce3+ active clusters and in the Ce-O bond distance upon exposure to ROS. CeO2 based and MnO2 based materials have previously been used to scavenge ROS generated in-situ in a fuel cell, and perhaps represent the current state-of-the-art.46 Zirconium stabilized CeO2 has been shown to be an effective FRS, since doping with Zr increases the surface oxygen vacancy concentration in CeO2 (∼1021 vacancies cm−3).55 N-doped CeO2 samples (this study) have a comparable number of oxygen vacancies along with stable Ce3+ active clusters; this combination of high oxygen vacancy concentration and stable Ce3+ active clusters makes N-doped CeO2 more effective than the other FRS reported in the literature. While achieving a perfect dispersion of FRS within the membrane is always a challenge, the N-doped ceria presents an advantage over commercial ceria in that it is more readily dispersed, and in that a smaller quantity of additive is required to achieve high FRS efficacy. In closing, this type of stabilized N-doped CeO2 materials has great potential for application in technologies that require the creation and retention of a high number of oxygen vacancies.
Acknowledgments
The authors acknowledge the National Science Foundation for funding. NSF Award #0847030; PI V.R. The authors acknowledge Prof. James Kaduk, Department of Biological and Chemical Sciences, Illinois Institute of Technology for powder X-ray diffractograms and Rietveld analyzes and Prof. Carlo Segre, Department of Physics, Illinois Institute of Technology for helpful discussions on XAS analysis. The authors also acknowledge the Advance Photon Source at Argonne National Laboratory for facilitating XAS experiments (Proposal# GUP-33793).