Abstract
In this paper, a MnO2/activated carbon (AC) composite with high electrochemical performance is synthesized through a novel synthesis method (Grafting Oxidation Method). The structure and morphology are analyzed using X-ray diffraction, Fourier transmission infrared spectra, scanning electron microscopy and transmission electron microscopy. Additionally, the electrochemical properties are evaluated through cyclic voltammetry, electrochemical impedance spectra and galvanostatic cycling measurements. The results demonstrate this MnO2/AC composite owes homogeneous particle size of nanometer dimension. The quasi-rectangular and symmetric cyclic voltammetry curves of the composite, which are measured under a three-electrode electrochemical system with a 0.5 mol L−1 Na2SO4 solution at room temperature, indicate it has an ability of rapidly reversible Faraday reaction and good electrochemical behavior. Compared to the MnO2/AC prepared through liquid-phase method, the composite prepared by grafting oxidation method exhibits a much higher specific capacitance which is up to 332.6 F g−1 at scanning rate of 2 mV s−1. A laboratory capacitor assembled with this MnO2/AC composite electrode shows an average capacitance attenuation rate of just 0.0068% after 2000 cycles. Besides, the impedance tests results show that the charge transfer resistance of this composite is 0.92 Ω, which is much lower than the composite (2.52 Ω) synthesized through liquid-phase method.
Export citation and abstract BibTeX RIS

This is an open access article distributed under the terms of the Creative Commons Attribution 4.0 License (CC BY, http://creativecommons.org/licenses/by/4.0/), which permits unrestricted reuse of the work in any medium, provided the original work is properly cited.
Supercapacitors, also known as electrochemical capacitors or ultracapacitors, have attracted considerable interest worldwide, primarily because of their ability to provide higher power densities than batteries and higher energy densities than conventional dielectric capacitors.1,2 Because of these advantages, supercapacitors can be widely used in applications such as hybrid vehicles, electronic devices, and digital products.3–6
The most crucial factors determining the electrochemical performance rely on the electrode materials. The electrode-active materials that are widely used for supercapacitors include carbon, conducting polymers and transition-metal oxides. Considering the investigated electrode materials, transition metal oxides are considered to be good alternatives due to their high capacity from pseudocapacitance.7 Among the previously investigated metal oxides, RuO2 exhibits excellent electrochemical properties;8,9 however, its high cost and environmental toxicity have limited its commercial application. Thus, other metal oxides, such as iridium oxide,10 cobalt oxide,11,12 nickel oxide,13 tin oxide,14 vanadium oxide,15 bismuth oxide,16 molybdenum oxide17 and manganese oxide,18 have been investigated as possible substitutes for RuO2. In particular, manganese oxides, which are characterized by a high specific capacitance, low cost, high abundance and environmentally friendly nature, have attracted growing interest as electrode-active materials for supercapacitors.19,20 Furthermore, a MnO2 electrode operated in conjunction with a neutral aqueous electrolyte is considerably safer than most other metal oxides (such as RuO2 and NiO), which usually operate in conjunction with strongly acidic or alkaline electrolytes. Thus, intensive studies were recently conducted to elucidate the intrinsic properties of MnO2.21–23 Until recently, two mechanisms are proposed to explain the MnO2 charge storage behavior. The first one implies the intercalation of protons (H+) or alkali metal cations (C+) (such as Li+) in the bulk of the material upon reduction followed by deintercalation upon oxidation.24,25

The second mechanism is based on the surface adsorption of electrolyte cations (C+) on MnO2.18

where C+ = Na+, K+, Li+. This mechanism is proposed following the observation of significant difference of the cyclic voltammogram and the capacitance of MnO2 in the presence of various metal alkali cations in the electrolyte. It should be noticed that both mechanisms involve a redox reaction between the III and IV oxidation states of Mn. Brousse and Belanger et al.26 have investigated the charge storage mechanism of manganese dioxide compounds with various structures. They discovered that the capacitance of all amorphous compounds was due to faradaic processes localized at the surface and subsurface regions of the electrode. The capacitance of the crystallized materials is clearly dependent upon the crystalline structure, especially with the size of the tunnels that could be able to provide limited cations intercalation. It's also found that the interlayer spacing of the MnO2 birnessite structure increased upon electrochemical oxidation in the presence of Na+ cations in the electrolyte due to the deintercalation of Na+ and the intercalation of H2O between the layers.25
However, a major drawback of MnO2 is its poor conductivity, which greatly limits the utilization of bulk MnO2.27,28 Brousse et al.29 found that the ionic and electronic conductivities were 0.01 and 0.009 S cm−1 for cryptomelane, respectively, compared to 0.015 and 5.8×10⁻⁶ S cm−1 for birnessite, respectively. Because its poor conductivity was related to the microstructure, the conductivity values increased with the channel size and structure dimensionality from 1D to 3D. The 3D microstructure of the spinel form showed the highest value, followed by the 2D layer form, i.e., the birnessite sample. For the 1D tunnel group, the larger the cavity, the larger the measured conductivity.30
In order to improve the conductivity, the approach to incorporate nanostructured MnO2 into carbonaceous materials31–38 is great effectiveness and significance, which provide high electroactive surface area and reliable electrical connection for a maximum utilization of MnO2. At present, the studies of carbonaceous materials mainly focus on carbon nanotubes (CNTs), nanographite sheets, and carbon nanofoams/aerogels, but the complex synthetic process, expensive price and long processing time for these materials undoubtedly increase the cost in commercial development. Relative to the formers, the activated carbon (AC), one of promising carbonaceous materials for supercapacitors, is selected because of its relatively high power density, high specific surface area and low cost.39 The combination of MnO2 and AC may take advantage of the excellent electrical conductivity and chemical stability of AC and the high specific capacitance of MnO2. But at present, the research of MnO2/AC mainly focus on hybrid supercapacitor system or technology, such as enlarging the potential window,40,41 optimizing the weight ratio of positive and negative electrode materials,42 and adding Li+ into aqueous electrolyte,43 to improve supercapacitor performance, all of which are based on using MnO2 and activated carbon (AC) as positive and negative electrodes, respectively.
However, the electrochemical performance is also susceptible to the morphology of the MnO2 composites, and the control of the morphology is rather challenging which depends largely on the synthesis technique. Furthermore, the porosity and pore-size distribution play important roles in determining the effective electroactive surface area which is accessible for the electrolyte ions throughout electrode. The Simon and Gogotsi et al.44,45 discovered that the choice of the optimal pore size and the effect of pore size dispersion are important for leading to the maximum double-layer capacitance by minimizing the free space available. Both larger and smaller pores lead to a significant drop in capacitance. And it found that MnO2 with superior porosity shows high specific capacitance with excellent rate capability. Therefore, it would be of significance but a challenge to develop a synthesis technique to prepare mesoporous MnO2-based composites.
In this paper, a MnO2/AC composite was firstly synthesized through a novel synthesis method (grafting oxidation method) as electrode material for electrochemical supercapacitors. Several researches on grafting prepare MnO2-based composites, Muralidharan et al.46 investigated MnO2 grafted V2O5 nanostructures which exhibit considerably better specific capacitance, rate capacity and stability compared to pristine V2O5. They adopted capping agent assisted co-precipitation technique to prepare this material. The MnO2 and V2O5 combined to form profitable hierarchical network morphology which is sustainable even after MnO2 loading. But the common drawback of low electronic and ionic conductivity of V2O5 and MnO2 has not improved. Downard et al.47 have modified the surface of MnO2 nanorods with aryl groups by grafting from aryldiazonium salt solutions. They discovered that aryl groups are attached to the nanorod surface via Mn–O–C bonds however the possible involvement of Mn–C bonds cannot be discounted. The stable attachment of aryl groups opens many opportunities for enhancing the performance of MnO2 materials through tuning the surface properties. But the organic-based systems suffer from the use of highly toxic solvents and high fabrication cost. Yu et al.48 through a one-pot hydrothermal method synthesized unique TiO2 nanotube arrays (TNAs) grafted with MnO2 nanosheets for the first time as an anode for Li battery. They found that the thickness of MnO2 nanosheet layer on the surface of TNAs has a significant impact on capacity, cycle performance and conductivity. Additionally, a very abnormal phenomenon that they call "late rise of capacity" is discovered after several hundreds of cycle times and it may be resulted from the structure change of the material but not chemical change. Belanger et al. have investigated the use of grafting for energy storage. They grafted electroactive anthraquinone (AQ) groups on high specific surface area carbon, afterwards the specific capacitance was doubled because the grafted AQ groups had redox capacitance.49–51 In the latest research of Brousse and Belanger et al,52 they prepared carbon/MnO2 nanocomposites via molecular bridging. The synthesis was performed in two steps, with a first step consisting in the surface functionnalization of carbon particles with aminophenyl groups and the subsequent attachment of amorphous manganese oxide particles through generated phenyl groups. The capacitance of the carbon/MnO2 grafted nanocomposites electrode is doubled compared to a simple mixture of its two components, and highlighting the role of intimate coupling of carbon and MnO2. Nevertheless, we use grafting oxidation method to prepare MnO2/activated carbon composite to make full use of the good conductivity of activated carbon and the advantage of MnO2. This method plays a significant role in directing structure growth, which contribute to MnO2 preparing with uniform interspace and superior porosity. And the MnO2/AC composite synthesized through grafting oxidation method has good conduction because of the better coverage of MnO2 on AC substrates, which are critical to enhance electrochemical properties. An aqueous symmetric supercapacitor is fabricated using prepared composite and presents well supercapacitor performance. The formation mechanism and the effect of microstructure on the electrochemical capacitive behaviors of the binary composites are also discussed.
Experimental
Synthesis of materials
In this paper, the Mn(Ac)2·4H2O, KMnO4, HNO3(70%), and AC(Sinopharm Chemical Reagent Co.) were analytical grade and without further purification. All of aqueous solutions were prepared using double-distilled water. The KMnO4/Mn(Ac)2 molar ratio was kept at 2:3 for all syntheses.
Grafting oxidation synthesis MnO2/activated carbon composite
Activated carbon (AC) powder (5 g) and 50 mL HNO3 were blended and treated under ultrasonic oscillation for 1h. After the mixture enclosed in a PTFE lined autoclave, the autoclave was put in an oven which was heated up to 120°C at rate of 2°C min−1 and maintained at 120°C for 9 h, then it was naturally cooled to room temperature. The obtained acid and activated carbon dispersion were slowly poured in 10 L deionized water for dilution. Then the diluted solution was filtered and washed with deionized water until the filtrate was neutral. The filtered AC powder was dried in an oven at 80°C for 12 h, then grinded and marked as T9-AC.
The T9-AC (1 g) was put into 100 mL 0.3 mol L−1 Mn(Ac)2 solution and mixed under ultrasonic oscillation for 30min. The obtained mixture was moved into water-bath and maintained at 60°C under continuously stirring for 24 h, then naturally cooled to room temperature. Afterwards it was filtered and washed with deionized water until the filtrate was neutral. The filtered powder was dried in an oven at 100°C for 12 h, then grinded and marked as T9-AC+Mn(Ac)2.
The T9-AC+Mn(Ac)2 (1 g) was put into 100 mL 0.2 mol L−1 KMnO4 solution prepared in advance, and mixed under ultrasonic oscillation for 30min. The obtained mixture was moved into water-bath and maintained at 60°C under continuously stirring for 24 h, then naturally cooled to room temperature. Afterwards it was filtered and washed with deionized water until the filtrate was neutral. The filtered powder was dried in an oven at 100 °C for 12 h, then grinded and marked as MnO2/G9AC.
Liquid-phase synthesis MnO2/activated carbon composite
Firstly, 0.02 mol KMnO4 and 0.03 mol Mn(AC)2·4H2O were separately dissolved in two beakers that contained 100 mL distilled water. The activated carbon (AC) (1 g) was added into the prepared Mn(Ac)2 solution, then the mixture was moved into water-bath and maintained at 60°C under continuously stirring for 1 h. The prepared KMnO4 solution was dropped into the mixture and maintained at 60°C under continuously stirring for 24 h, then the pH of solution was adjusted to 7 and naturally cooled to room temperature. Afterwards the solution was filtered and washed with deionized water until wash liquid was colorless. The filtered brown powder was dried in an oven at 100°C for 12 h, then grinded and marked as MnO2/L9AC.
Preparation of pure MnO2
MnO2 powder was synthesized through a simple redox reaction between KMnO4 and Mn(AC)2·4H2O. Firstly, 0.02 mol KMnO4 and 0.03 mol Mn(AC)2·4H2O were separately dissolved in two beakers that contained 100 mL distilled water. Then the Mn(AC)2·4H2O solution was moved into water-bath and maintained at 60°C under continuously stirring. Kept the solution stirring and dropped the prepared KMnO4 solution. The mixture solution maintained at 60°C under continuously stirring for 24 h, then the pH of solution was adjusted to 7 and naturally cooled to room temperature. Afterwards the solution was filtered and washed with deionized water until the filtrate was colorless. The filtered brown powder was dried in an oven at 100°C for 12 h, then grinded and marked as pure MnO2.
Materials characterization
X-ray diffraction (XRD) analysis was performed using a Rigaku-TTRIII X-ray diffractometer (Japan) equipped with a graphite-monochromated high-intensity Cu Kα radiation source. Fourier transmission infrared (FTIR) spectra were recorded on a Nicolet 6700 spectroscopy under the sweeping range of 400–4000 cm−1 at resolution 4 cm−1 with KBr as compressed slices. The morphologies of the products were investigated with a field emission scanning electron microscopy (FESEM, FEI Nova NanoSEM 450) and a high-resolution transmission electron microscopy (HRTEM, JEOL JEM-2100F).
Electrochemical measurements
To fabricate electrodes for evaluating the electrochemical properties, the prepared material (70 wt%) were separately mixed with acetylene black (20 wt%) and binder (polyvinylidene, PVDF, 10 wt%) in an agate mortar. A slurry of the aforementioned mixture was produced using N-methyl-2-pyrrolidone (NMP) as solvent.
In three electrodes system, the slurry was brushed onto Ni foam with an effective area of ∼1 cm2. Then the foam was dried in air at 100°C for 60 min to remove the solvent and uniaxially pressed into a thin electrode about 0.5 mm thick under 10 MPa. After the prepared electrode was completely dried, the mass of active material of each electrode was generally 5 ± 0.5 mg.
As to two electrodes system of symmetric capacitor, the slurry, which was the same with above, was brushed onto a big piece of nickel foam current collector, then dried for one hour and roll pressed about 0.5 mm thick. After the nickel foam was completely dried, cut the brushed nickel foam current collector into small round pieces with diameter of 8 mm as electrodes. The mass of active material of each electrode was generally 3±0.5 mg.
The electrochemical properties of the obtained materials were recorded through an electrochemical workstation (CHI660B) using a three-electrode electrochemical system with a 0.5 mol L−1 Na2SO4 aqueous solution at room temperature. The fabricated MnO2 electrode was used as the working electrode. A platinum foil (2 × 2 cm2) and a saturated calomel electrode (SCE) were used as the counter and reference electrodes, respectively. The ac-impedance spectra were measured with a 5 mV ac signal superimposed on the open-circuit potential (approximately 0.4 V vs. SCE) over the frequency range from 10−2 to 105 Hz.
The cyclic voltammetry (CV) measurements were performed over the potential range of 0–0.8 V (vs. SCE) at a scan rate of 2–200 mV s−1. The specific capacitance was calculated from the CV curves according to the Equation 1:
![Equation ([1])](https://content.cld.iop.org/journals/1945-7111/162/8/A1654/revision1/jes_162_8_A1654eqn3.jpg)
where m(g) is the mass of active materials, v(mV s−1) is the potential scan rate, ΔV (V) is the sweep potential window and I(V) (A) is the voltammetric current on the curves.
The galvanostatic charge/discharge tests were performed using a NEWARE auto-cycler (China) in two-electrode system of symmetric capacitors which were fabricated using the prepared MnO2/AC as active material and a 0.5 mol L−1 Na2SO4 aqueous solution as electrolyte. The specific capacitance can be calculated from the discharging curve based on the Equation 2:
![Equation ([2])](https://content.cld.iop.org/journals/1945-7111/162/8/A1654/revision1/jes_162_8_A1654eqn4.jpg)
Here I(A) is the applied current, Δt(s) is the discharge time, m(g)is the mass of active material, ΔV (V) is the discharging potential window.
Results and Discussion
The Fig. 1 shows the XRD patterns of pure activated carbon (AC), pure MnO2, MnO2/G9AC (grafted composite) and MnO2/L9AC (liquid-phase synthesized) composites. In the XRD pattern of pure AC, the diffraction peaks cannot be detected, which suggests that the pure AC is amorphous in nature and has no apparent influence to composite pattern. For the patterns of pure MnO2 and MnO2/L9AC, all the diffraction peaks can be readily indexed to the tetragonal-type α-MnO2 (JCPDS 44–0141), with cell parameters of a = b = 9.73 Å, c = 2.88 Å and a = b = 9.89 Å, c = 2.86 Å, respectively. Compared with the sharp and obvious peak of pure MnO2, the peak of MnO2/L9AC suggests that it is a relative less crystallized compound. In MnO2/G9AC XRD pattern, it can be seen that there are two broadened characteristic peaks at 2θ = 37° and 65.4° which exist in the pattern of δ-MnO2 (JCPDS no. 18-0802) and α-MnO2 (JCPDS no.44-0141)) as well. From the crystal analysis of different MnO2 in the reference,53 we recognize that the MnO2/G9AC is a poor crystallized material, which may originate from the smaller particle size of the MnO2/G9AC composite.
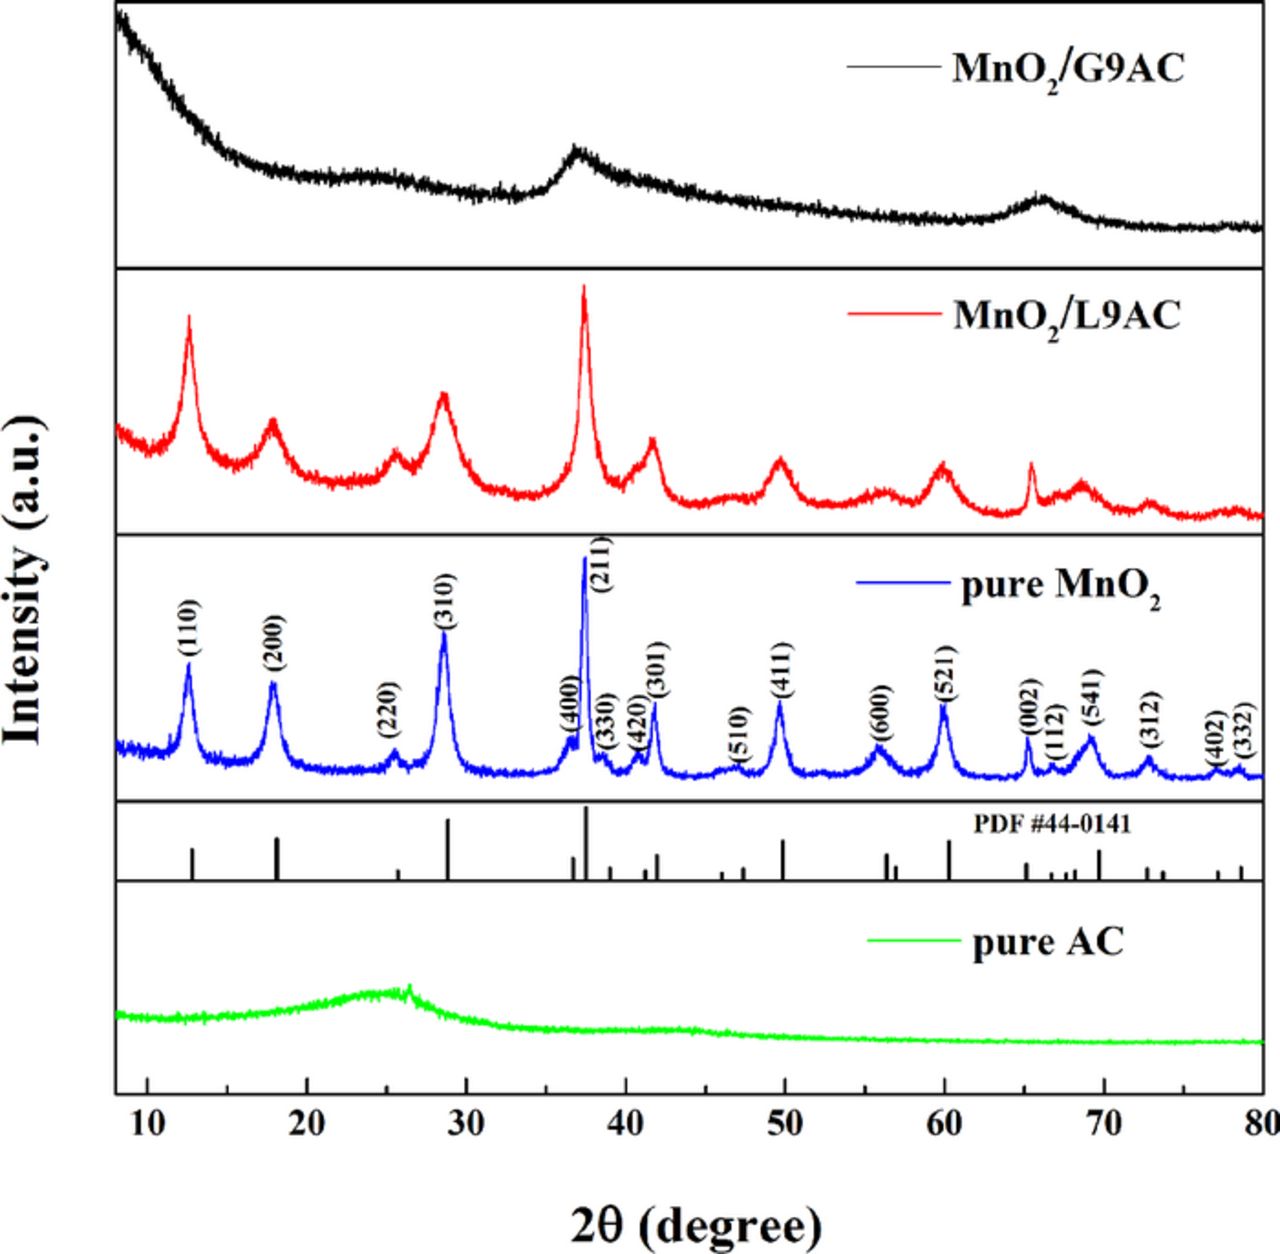
Figure 1. XRD patterns of pure AC, pure MnO2, MnO2/G9AC (grafted composite) and MnO2/L9AC (liquid-phase synthesized).
The structure and component formation processes of MnO2/G9AC are further elucidated by FTIR, as shown in Fig. 2a. And the comparison of pure MnO2, MnO2/L9AC and MnO2/G9AC are shown in Fig. 2b. It can be seen from Fig. 2a, the bands at 3300–3500 cm−1 can be assigned to stretching vibrations of physical adsorbed water molecules. As can be seen in the figure, compared with pure activated carbon (AC), the main differences of AC after hydrothermal treatment lie in the region from 1000 to 1800 cm−1. As for T9-AC material, the three distinct absorption peaks at 1228 cm−1, 1345 cm−1 and 1536 cm−1 bands are owing to C-O-C stretching, CO2 symmetric stretching, and NO2 anti-symmetric stretching, respectively. The CO2 and NO2 are generated and adsorbed on the AC surface during the surface treatment. Besides, the other two absorption peaks at 1717 cm−1 and 1608 cm−1 can be attributed to the C==O stretching and COO anti-symmetric stretching respectively, which indicates that there are a great deal of carboxy groups on the surface of T9-AC. Compared with pure AC, T9-AC exhibits higher absorption peaks indicating that the content of the carboxy groups on the surface of AC particles increase significantly after hydrothermal treatment. The spectra of T9-AC+Mn(Ac)2 show that after treated with Mn(Ac)2, the material exhibits low absorption peaks of carboxy and the characteristic absorption peak corresponding to Mn-O stretching vibration begin to appears at low band region, which indicate that Mn2+ are grafted onto the AC surface. The wide band in the region from 500 cm−1 to 800 cm−1 can be assigned to Mn-O stretching vibrations. It can be seen from the spectra of MnO2/G9AC that a distinct absorption peak exists at 503 cm−1, which is caused by the Mn-O vibration of octahedral [MnO6]. While the bands of absorption peaks corresponding to carboxy groups decrease significantly, indicating that substantial MnO2 are formed through reaction between T9-AC+Mn(Ac)2 and KMnO4.

Figure 2. FTIR spectra of the materials: (a) formation processes of MnO2/G9AC (grafted composite) (b) the comparison of pure MnO2, MnO2/L9AC (liquid-phase synthesized) and MnO2/G9AC.
As can be seen from MnO2/L9AC FTIR spectra in Fig. 2b, there is a peak located at 730 cm−1 while pure MnO2 and MnO2/G9AC not present. We believe that the IR band at 730 cm−1 is owing to the distortion of [MnO6] octahedra structure caused by the constitutional water.54 It can be seen from the Fig. 2b, the bands at 3300–3500 cm−1 in infrared spectra of MnO2/L9AC and pure MnO2 are consistent. But compared with pure MnO2, the absorption peaks intensity of MnO2/L9AC is obviously weakened indicating that the content of structural water decrease. This change leads to the distortion of [MnO6] octahedra, which is in line with the XRD results shown in Fig. 1. In comparison, MnO2/G9AC FTIR spectra does not present this peak, which may result from the poor crystallization and opened structure of this material, thus the structural water has little impact on the structure variation.
In the FTIR spectra of pure MnO2, MnO2/L9AC and MnO2/G9AC, the typically presented peaks are C-O and Mn-O peaks. As can be seen, there are three absorption peaks at 1280 cm−1, 1050 cm−1 and the 918 cm−1 in MnO2/G9AC FTIR spectra. Among them 918 cm−1 peak reflects C-O-C symmetric stretching vibration, and both of the 1280 cm−1 peak and 1050 cm−1 peak are caused by C-O stretching vibration in C-OH. In addition, it's reported that the bands of 1280 cm−1 and 1050 cm−1 are normally attributed to O-H bending vibrations combined with Mn atoms.40 In conclusion, it's definite that MnO2 have been grafted onto AC, and the C-O-Mn bonds are typical existence in MnO2/G9AC.
The FESEM images of the as-prepared samples are shown in Fig. 3. It can be seen from the Fig. 3a and Fig. 3b, the size of T9-AC particles conspicuously decrease from 50∼60 μm to 2∼10 μm after 9h hydrothermal treatment. Furthermore, the original smooth surface of the particles turns to be rough and defective. Fig. 3c presents the FESEM image of T9-AC+Mn(Ac)2. It can be seen that Mn(Ac)2 treatment has no significant effect on the morphology and particle size. Fig. 3d shows that in the MnO2/G9AC composite, the activated carbon (AC) particles are barely observable because the surface of the composite is well-coated with MnO2 over the AC surface. As can be seen from the higher magnification, the MnO2 in MnO2/G9AC tend to form uniform and loose sphere particles, with a size less than 50 nm. As shown in the MnO2/L9AC FESEM image (Fig. 3e), it can be observed that there are large number of linear and sphere MnO2 particles exiting on the surface of AC particles, which may result from the aggregation of MnO2 primary particles. Furthermore, it can be obviously observed that the surface of AC particles is not well-coated by MnO2 and readily to fall off. This indicates the existence of individual MnO2 which are not integrated with AC in the MnO2/L9AC composite. It is well-known that carbonaceous materials are usually added to MnO2 to improve the electrical conductivity of MnO2 electrodes, because the electrical conductivity of pure MnO2 generally lies in the range from 10−4 to 10−6 S cm−1, depending on the structural water content.55 The enhancement of electrical conductivity over that of MnO2 is obviously due to the high conductivity of AC in the composite. Therefore, the contact between the MnO2 and AC is critical to determine the composite conductivity.
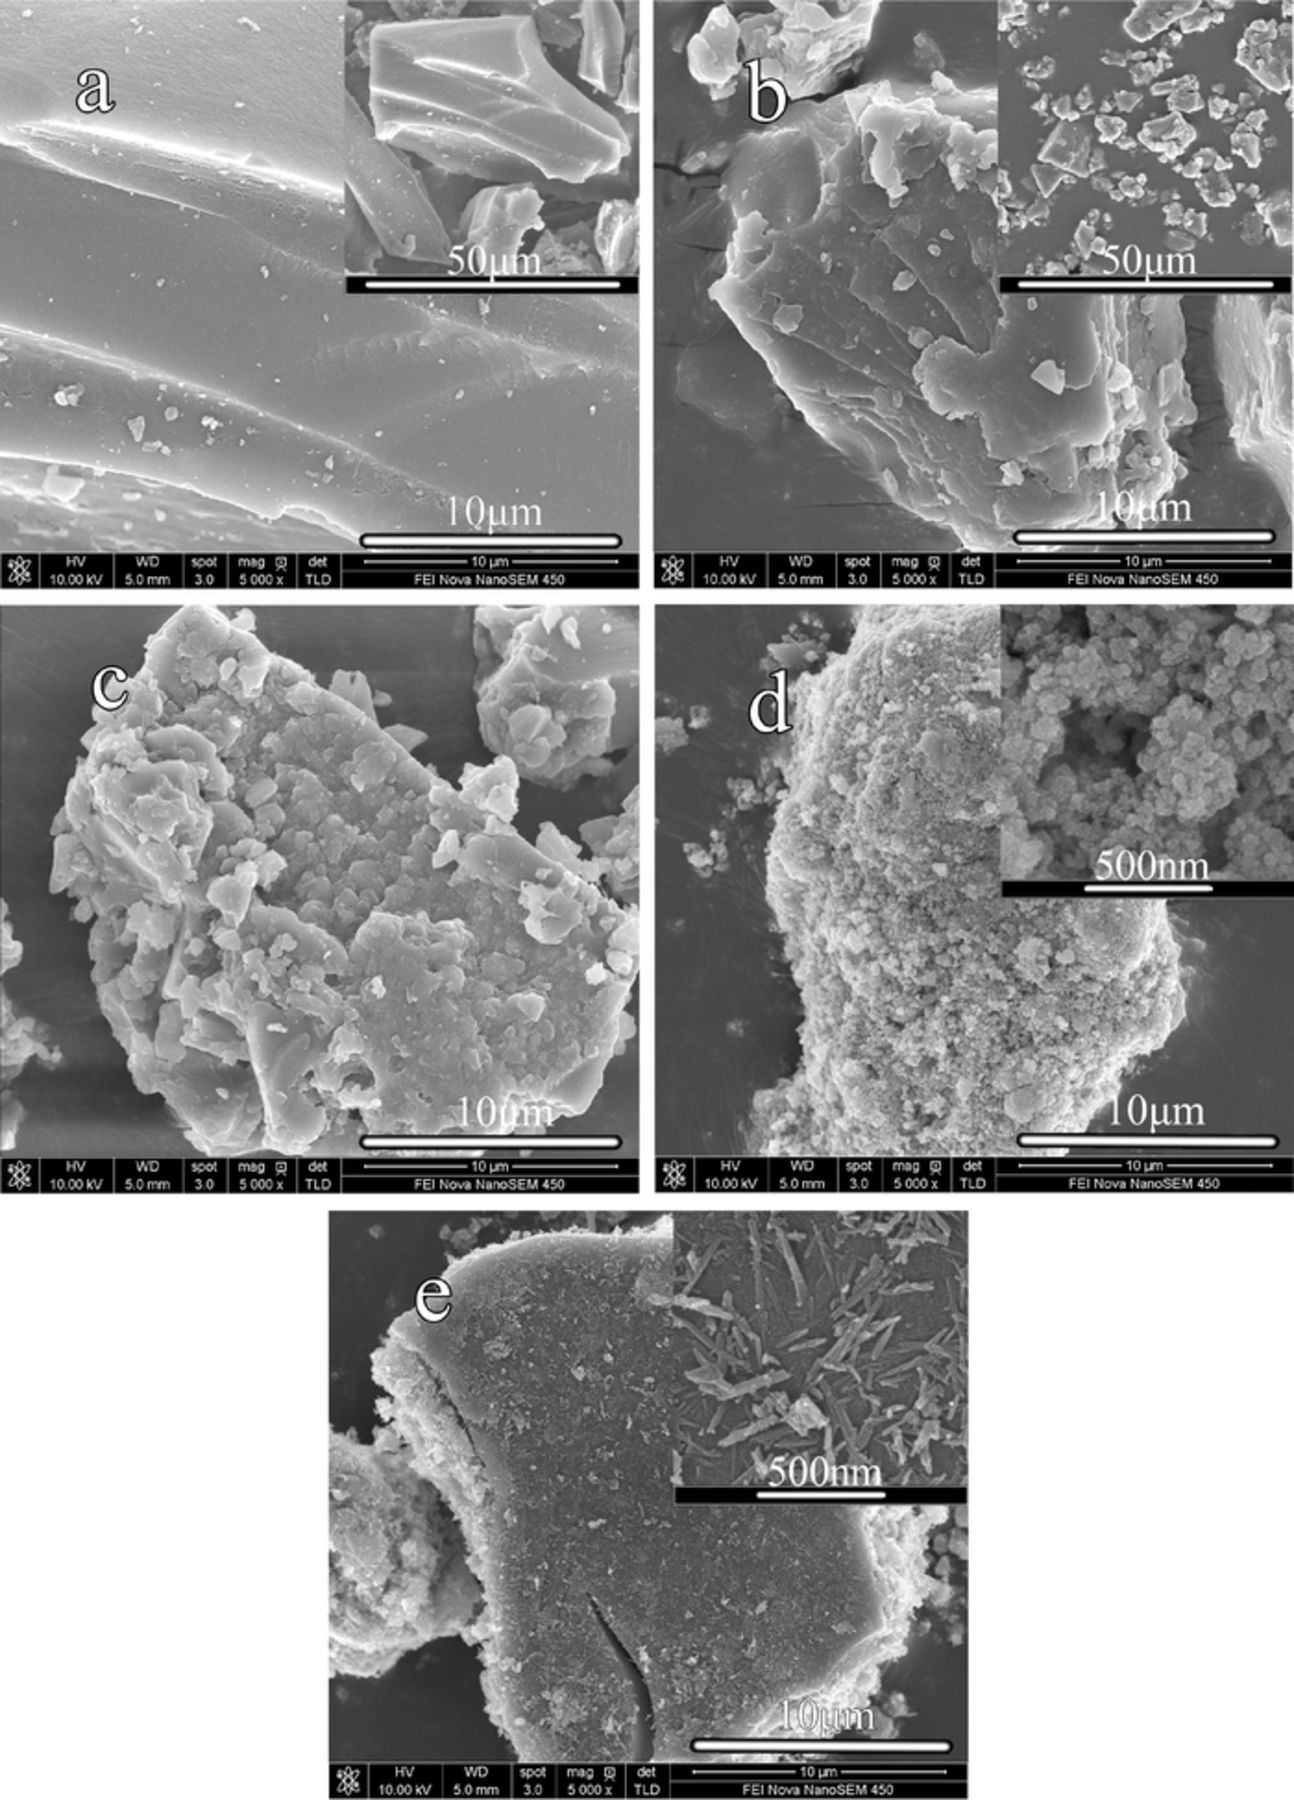
Figure 3. FESEM images of the as-prepared powder samples (×5000) (a) Pure AC; (b) T9-AC; (c) T9-AC+Mn(Ac)2; (d) MnO2/G9AC (grafted composite); (e) MnO2/L9AC(liquid-phase synthesized).
The microstructure can be further confirmed by the TEM images of MnO2/G9AC as shown in Fig. 4. From Fig. 4a1 it can be seen the activated carbon (AC) surface is finely and uniformly coated with MnO2 nano particles, and from Fig. 4a2 of higher magnification, the nanoparticles size is about 10 nm. The distribution of nanoparticles may be much advantageous in the specific capacitance improvement. This is because it increases the probability of conducting pathways in the electrode/electrolyte interface.55 From the TEM micrographs of MnO2/L9AC (Fig. 4b1, 4b2), it's obviously observed that the MnO2 particles are independent from AC and agglomerate severely, which is not presented in MnO2/G9AC. This is because that there are lots of reaction active sites on AC surface in MnO2/G9AC, which decreases the probability of particles aggregation in MnO2/G9AC and tends to form smaller MnO2 particles. The small MnO2 particles are uniform, loose and porous, which is beneficial to enhance the electrochemical performance.
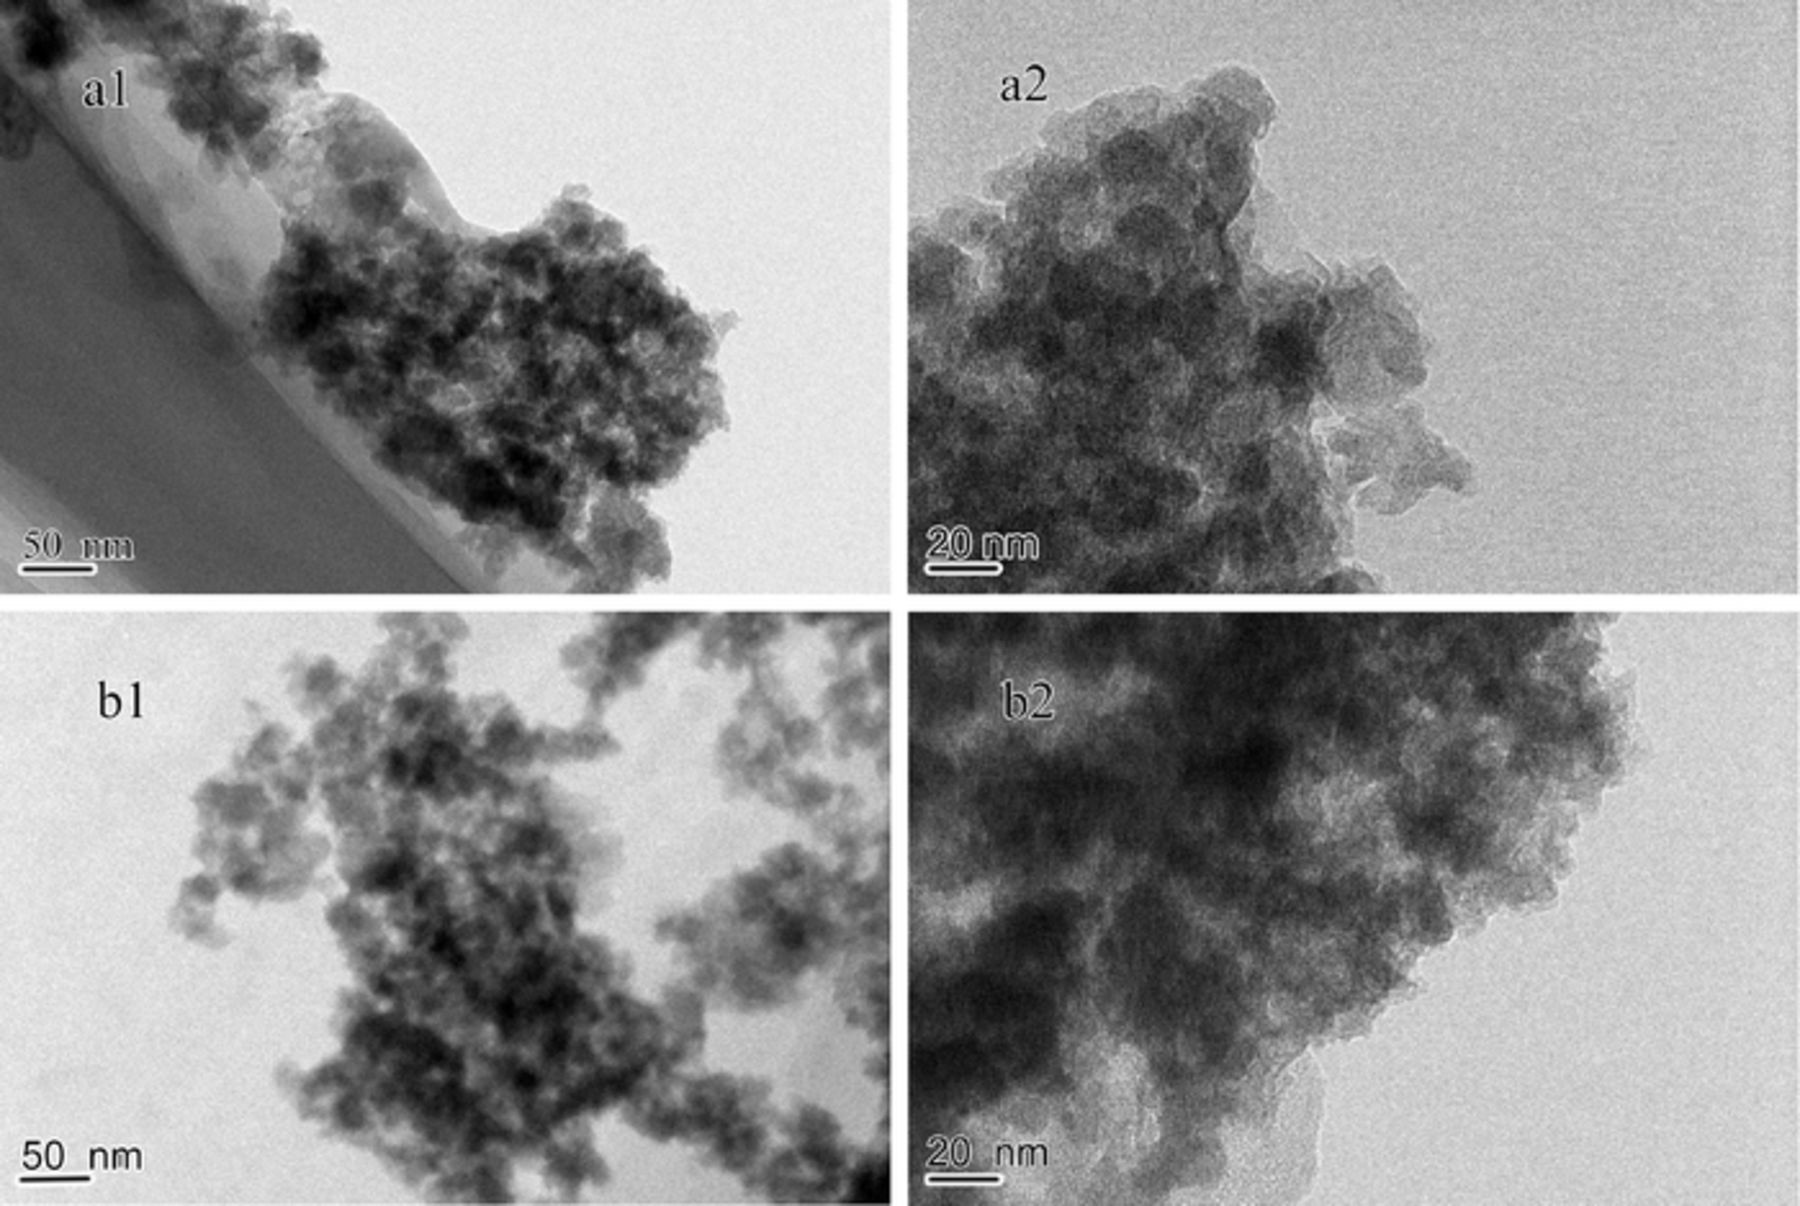
Figure 4. TEM images of the materials: (a) MnO2/G9AC (grafted composite); (b) MnO2/L9AC (liquid-phase synthesized). (a1 b1 ×40000; a2 b2 ×100000).
The different morphology between MnO2/G9AC and MnO2/L9AC can be rationalized with the formation mechanism. For the grafting oxidation method, firstly the activated carbon (AC) is activated by HNO3 to generate lots of carboxyl group on the surface. Afterwards Mn2+ are grafted onto these carboxyl group to generate massive active sites for reaction, and the obtained material is marked as T9-AC+Mn(Ac)2. Then T9-AC+Mn(Ac)2 reacts with KMnO4 so that the grafted Mn2+ are chemically oxidized by MnO4−. Due to that the redox reaction only occurs at the solid-liquid interfacial region (between T9-AC+Mn(Ac)2 and KMnO4 solution), while the reaction proceeding, the nucleation and growth of the MnO2 particles occur on the interface, and ultimately coat on the AC surface uniformly. As to the liquid phase method, the redox reaction could occur not only at solid/liquid interface between AC and KMnO4 solution, but also in the bulk of Mn(Ac)2 and KMnO4 solution. As a result, on the one hand the MnO2 generated on the AC surface could not coat well, on the other hand, a large number of MnO2 individuals generated in the bulk of solution could not contact with AC effectively. Both two aspects depress the contact between AC and MnO2, which restrict the contribution of AC for the electrical conductivity as well.
The Fig. 5 shows the representative CV curves of the as-prepared MnO2/G9AC, MnO2/L9AC, pure MnO2 and pure activated carbon (AC) at a scan rate of 2 mV s−1 in the potential window of 0–0.8 V, using a three-electrode electrochemical system and a 0.5 mol L−1 Na2SO4 solution as the electrolyte. The CV curves are quasi-rectangular and symmetric in shape, indicating a rapidly reversible faradaic reaction and an ideal capacitive behavior for the composite electrode. At the scan rate of 2 mV s−1, it is clearly that the current density of MnO2/G9AC composite electrode is much larger than that of MnO2/L9AC and pure MnO2 electrode. The electrode specific capacitance can be calculated from the area enclosed by the CV curves through formula 1. Based on the CV curves, the calculated specific capacitance of AC is no more than 3 F g−1. Furthermore, the AC surface is uniformly coated with MnO2 deposits and thus it could rarely participate in the charge-storing process. As a result, it could be concluded that the capacitance of AC could be negligible for both composite electrodes. The calculated results indicate that the specific capacitances of MnO2/G9AC, MnO2/L9AC, and pure MnO2 are 332.6 F g−1, 256.06 F g−1 and 191.2 F g−1, respectively. The previous intensive studies reported that the capacitive performance of MnO2 was strongly affected by its crystalline phase and morphology, which greatly depended on the employed synthetic strategy and reaction conditions. The MnO2/G9AC composite synthesized through grafting oxidation method has a rather stable structure, with loose spherical particles covered on surface as well. The sizes of the particles are uniform and fine which could increase the probability of conducting pathways in the electrode/electrolyte interface, then the occurrence of electrochemical reaction and the capacitance are greatly improved as well. Relative to grafting oxidation method, the capacitance of the composite synthesized through liquid-phase method is much lower, which is possibly because of the poor contact between MnO2 and AC, thus decrease the electrical conductivity effectiveness of the AC.
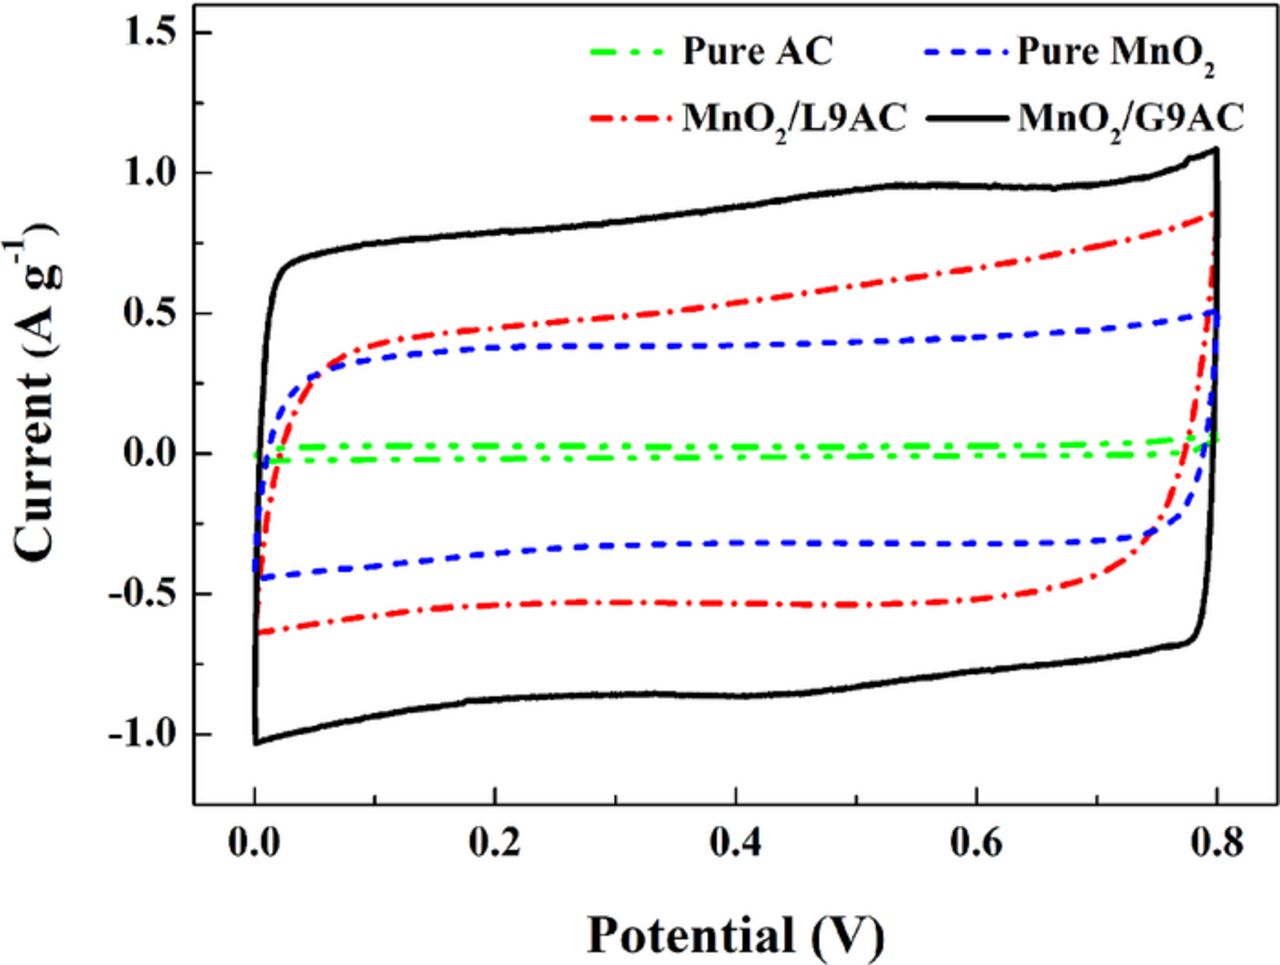
Figure 5. CV curves of pure AC, pure MnO2, MnO2/L9AC (liquid-phase synthesized) and MnO2/G9AC (grafted composite) (scan rate: 2 mV s−1, potential window: 0-0.8 V, electrolyte: 0.5 mol L−1 Na2SO4, three-electrode system).
Fig. 6 shows the specific capacitances of the as-prepared MnO2/G9AC and MnO2/L9AC electrodes at different CV scan rates (2, 5, 10, 25, 50, 100, 150, and 200 mV s−1) in the potential window of 0-0.8 V, using a three-electrode electrochemical system and a 0.5 mol L−1 Na2SO4 solution as the electrolyte. The specific capacitances of the two composites decrease with the scan rate increasing. It is worthy to note that the MnO2/G9AC composite electrode exhibits much larger specific capacitance than MnO2/L9AC composite at the same scan rate.
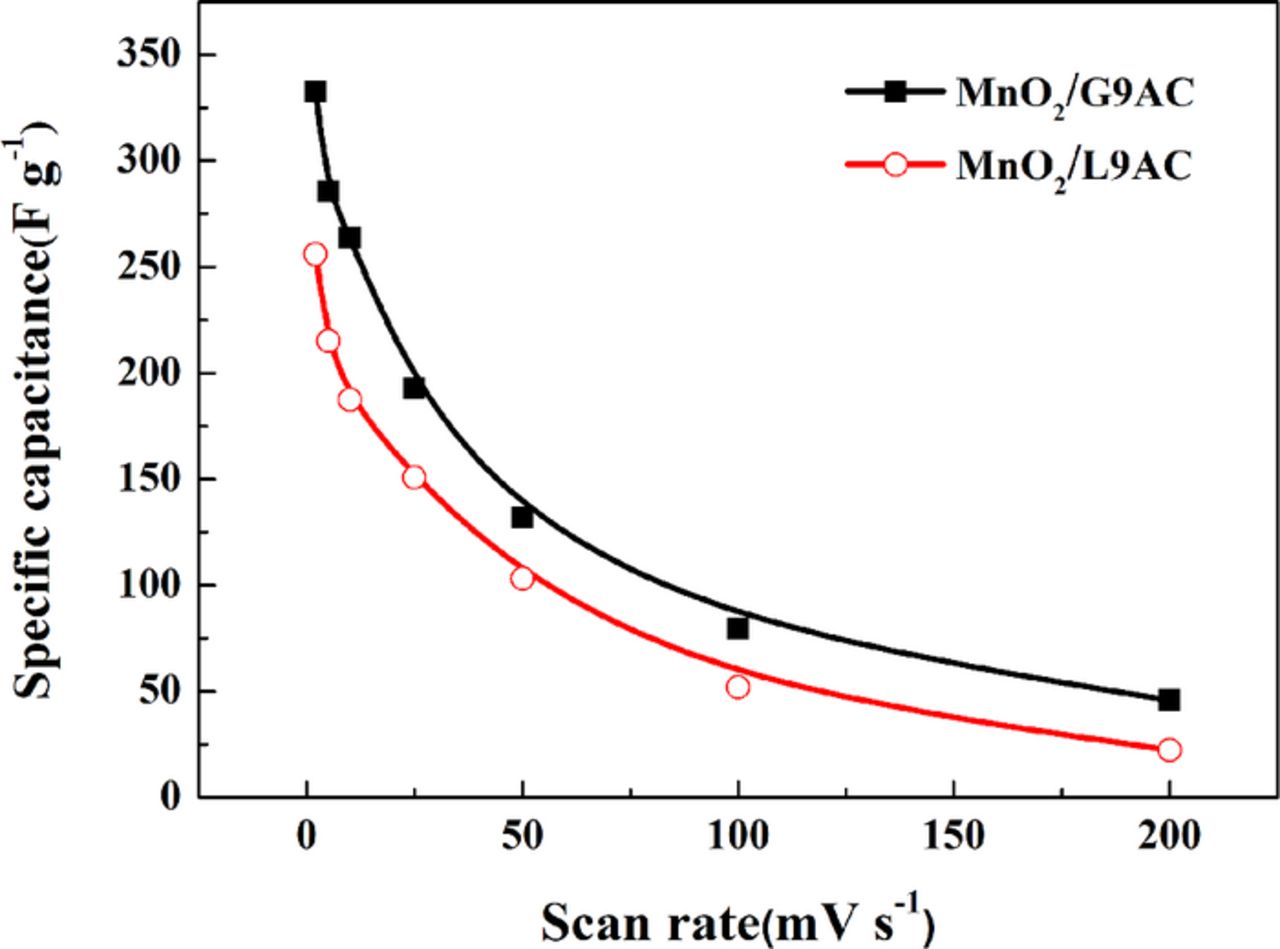
Figure 6. The specific capacitances of MnO2/G9AC (grafted composite) and MnO2/L9AC (liquid-phase synthesized) electrodes as a function of scan rate (scan rate: 2, 5, 10, 25, 50, 100, 150, and 200 mV s−1, potential window: 0–0.8 V, electrolyte: 0.5 mol L−1 Na2SO4, three-electrode system).
It is well-known that the charge storage mechanism of MnO2 mainly is a surface process which includes adsorption/desorption and insertion/extraction of proton and alkali cations.29,30,56–58 The process could be expressed as:

Obviously, the diffusion of the cations (i.e. Na+) into MnO2 surfaces or bulks and the transfer of electrons have a great influence on the rate capability. The higher scan rate results in smaller available capacitance, because of the reduced diffusion time and the low conductivity of MnO2.29
As shown in Fig. 6, in contrast to the MnO2/L9AC electrode, the MnO2/G9AC electrode presents a better rate capability while the scan rate increases from 2 mV s−1 to 200 mV s−1.The better electrochemical performance of MnO2/G9AC composite can be rationalized by two reasons: (i) the enhanced electrical conductivity of MnO2/G9AC promotes charge transfer rate; (ii) given the same mass load, the smaller particles size of MnO2/G9AC with higher specific surface area is expected to lead to the overall thinner MnO2 coatings and thus a better utilization of MnO2.
The superior electrochemical performance of the MnO2/G9AC composite is further confirmed by electrochemical impedance spectra (EIS) and the resulted Nyquist plots are shown in Fig. 7, using a three-electrode electrochemical system and a 0.5 mol L−1 Na2SO4 solution as the electrolyte. Both measured impedance spectra are consist of depressed arcs at high frequencies, straight lines inclined at a constant phase angle to the real axis (Warburg region) at intermediate frequencies and almost vertical capacitive lines at low frequencies. It is generally demonstrated that the arc is mainly caused by the charge-transfer reaction at the electrode/electrolyte interface.59 During the charging/discharging process, the cations including Na+ and H+ participate in the redox reaction.18,60 In addition, the Warburg impedance is associated with the semi-infinite diffusion of cations in the electrode, and the capacitive line is related to the accumulation of cations at the impermeable interface under the finite diffusion condition.
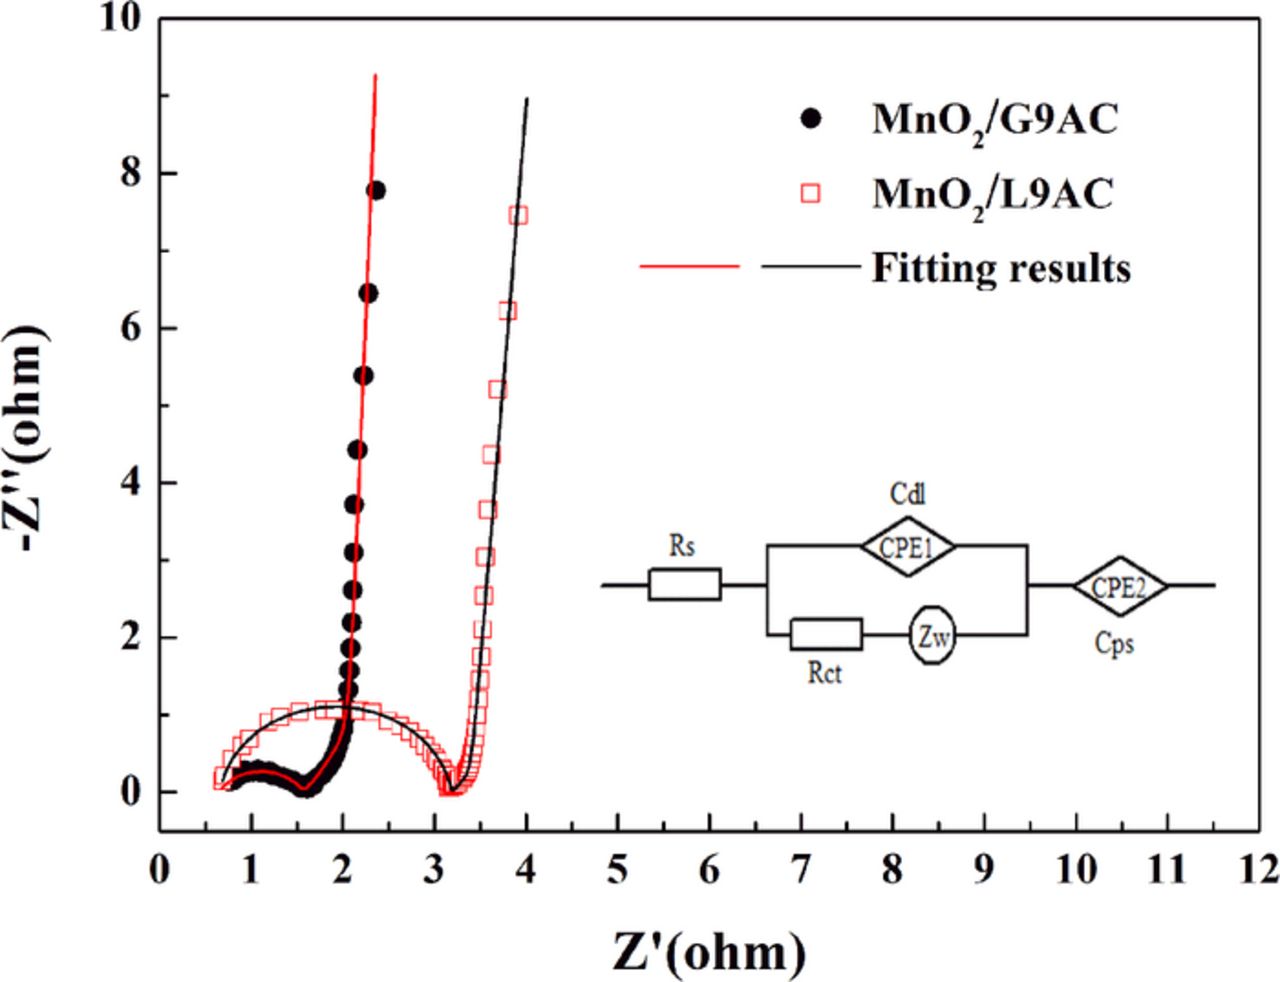
Figure 7. Nyquist plots of the impedance spectra of electrodes prepared with MnO2/G9AC (grafted composite) and MnO2/L9AC (liquid-phase synthesized) (Frequency range: 10−2-105 Hz, electrolyte: 0.5 mol L−1 Na2SO4, three-electrode system).
In order to determine the values of resistance and capacitance of the oxide electrodes, the measured impedance spectra are analyzed through the CNLS fitting method61 on the basis of an equivalent circuit shown in Fig. 7. Here, Rs is the solution resistance, Rct corresponds to the charge-transfer resistance through the pseudocapacitance process, and CPE1 arises from the interfacial double-layer charging. The Warburg impedance ZW is associated with the cations diffusion in the electrode and CPE2 represents the non-ideal capacitive behavior at the impermeable interface. The fitting result values of the MnO2/G9AC and MnO2/L9AC electrodes, including the solution resistance Rs, the charge-transfer resistance Rct, the diffusion resistance W-R, the diffusion time constant W-T, double-layer capacitance Cdl and the pseudocapacitance Cps, are listed in Table I.
Table I. The impedance spectra fitting of the electrodes prepared with MnO2/G9AC (grafted composite) and MnO2/L9AC (liquid-phase synthesized). (Frequency range: 105–10−2 Hz, electrolyte: 0.5 mol L−1 Na2SO4, three-electrode system).
| Sample | Rs (Ω cm−2) | Cdl (F cm−2) | Rct (Ω cm−2) | W-R (Ω cm−2) | W-T (Ω cm−2) | Cps (F cm−2) |
|---|---|---|---|---|---|---|
| MnO2/G9AC | 0.64613 | 4.4147 × 10⁻⁴ | 0.91771 | 1.421 | 3.087 | 1.522 |
| MnO2/L9AC | 0.6555 | 3.9041 × 10⁻⁶ | 2.525 | 0.60037 | 1.183 | 0.813 |
It can be seen that the two oxide electrodes exhibit significantly different values. The diffusion time constant W-T for finite diffusion is described as W-T = L2/D62 (L is the diffusion depth of cation in the electrode and the D correspondes chemical diffusivity). In the MnO2/L9AC the AC surface is not well coated by MnO2, thereby the diffusion path of cation is shorter with less diffusion time, as a result the W-R and W-T of MnO2/L9AC is lower as well. On the other hand, it is noticeable that the MnO2/G9AC leads to a much lower reaction resistance Rct, which can be ascribed to the fact that the surface is well-coated with MnO2 nanospheres to improve the electrical conductivity. According to the Cps values, the MnO2/G9AC exhibits a much higher specific capacitance, which is consistent with the result of CV tests as well.
To evaluate the cyclic stability of the as-prepared materials, galvanostatic charge-discharge tests were performed on the supercapacitor systems, which were assembled respectively using MnO2/G9AC and MnO2/L9AC composites as electrode material and a 0.5 mol L−1 Na2SO4 solution as the electrolyte in a two-electrode electrochemical system, at a current density of 0.1 A g−1 as shown in Fig. 8. Both charging/discharging curves have a very symmetric nature, indicating again that the composites have good electrochemical capacitive characteristic and superior reversible faradaic reactions. The specific capacitance can be calculated from the discharging curve based on the Equation 2. The respective specific capacitances of MnO2/G9AC and MnO2/L9AC electrodes are 324.3 F g−1 and 281.4 F g−1, which are comparable with the results of the CV tests. Fig. 9 shows the cyclic performance of the MnO2/G9AC and MnO2/L9AC electrodes evaluated by charge-discharge testing for 2000 cycles. As can be seen, during the initial 200 cycles, the capacitance of the MnO2/L9AC rapidly declines by nearly 15%. By contrast with MnO2/L9AC, the capacitance attenuation of MnO2/G9AC is only 5% in the initial 200 cycles. After 2000 charge-discharge cycles, the average attenuation rates of the MnO2/G9AC and MnO2/L9AC are 0.0068% and 0.021%, respectively. In evidence the electrochemical performance of MnO2/G9AC is better than that of MnO2/L9AC.
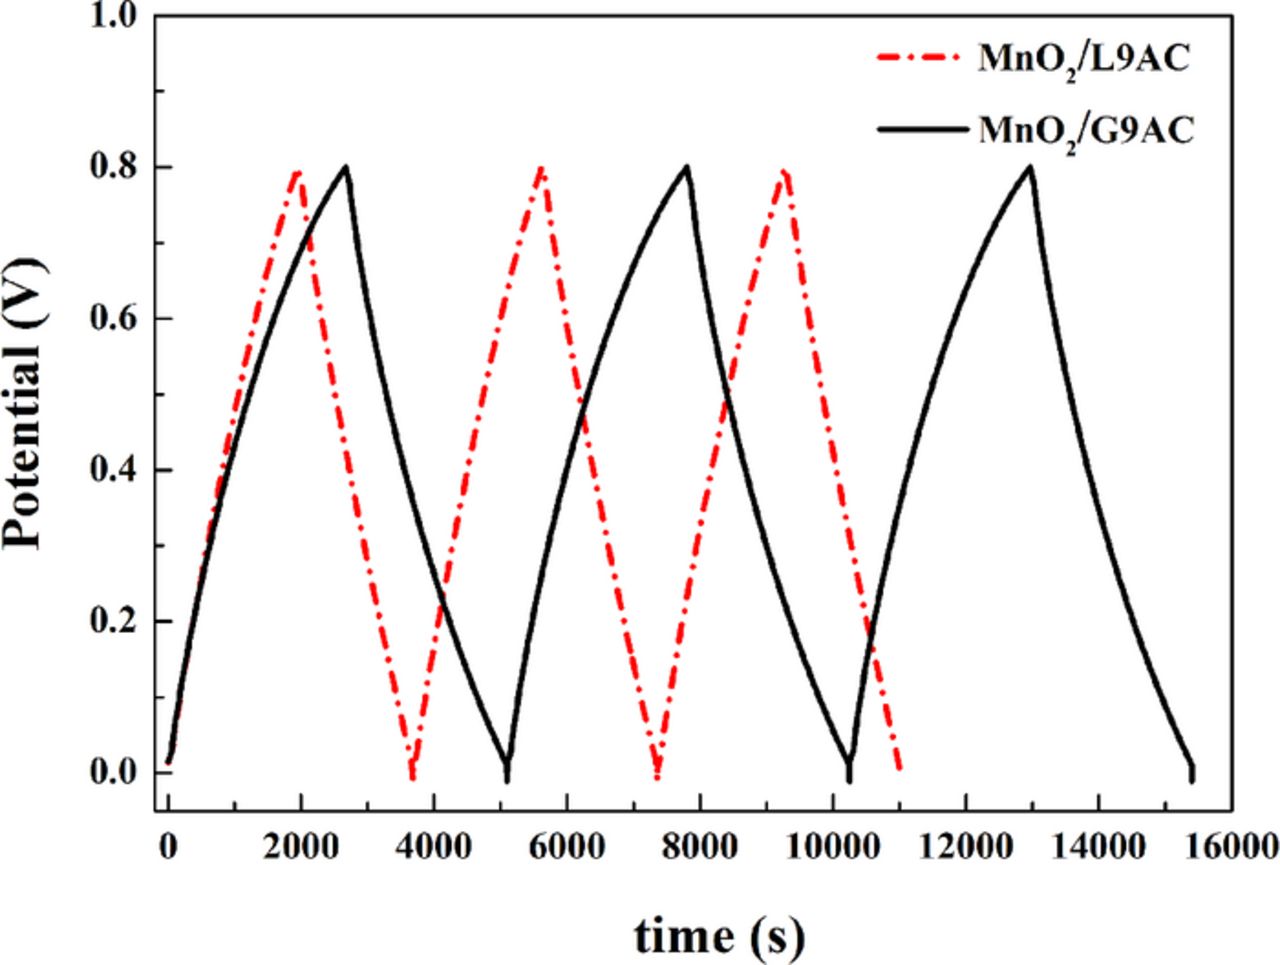
Figure 8. Galvanostatic charge/discharge curves of MnO2/G9AC (grafted composite) and MnO2/L9AC (liquid-phase synthesized) (current density: 0.1 A g−1, electrolyte: 0.5 mol L−1 Na2SO4, two-electrode system).
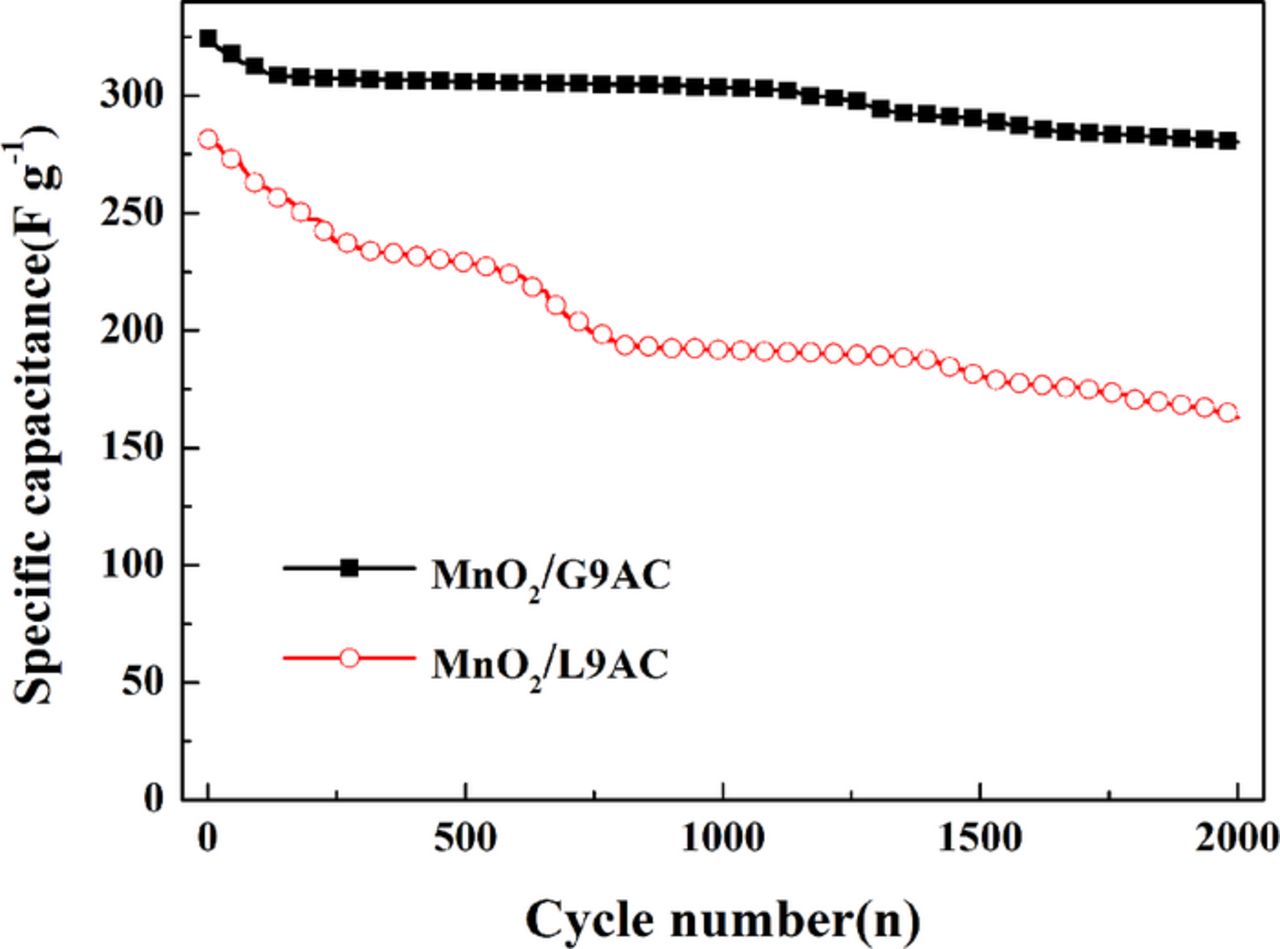
Figure 9. The Discharge capacity as a function with cycle number for MnO2/G9AC (grafted composite) and MnO2/L9AC (liquid-phase synthesized) (current density: 0.1 A g−1, electrolyte: 0.5 mol L−1 Na2SO4, two-electrode system).
Conclusions
A MnO2/activated carbon (AC) composite (MnO2/G9AC) with high electrochemical performance is firstly synthesized through a novel synthesis method (grafting oxidation method). The obtained MnO2/G9AC composite is a poorly crystallized compound and the surface of AC particles in the composite is well-coated with MnO2 nanospheres. The quasi-rectangular and symmetric cyclic voltammetry curves indicate the MnO2/G9AC has an ability of rapidly reversible Faraday reaction and good electrochemical behavior. Based on the CV curves, the capacitance of MnO2/G9AC is calculated to be 332.6 F g−1 at scan rate of 2 mV s−1, which is much higher than that of MnO2/L9AC prepared through a liquid-phase method. Electrochemical impedance spectra shows that the charge transfer resistance of MnO2/G9AC (0.92 Ω) is much lower than that of MnO2/L9AC (2.52 Ω). The specific capacitance of MnO2/G9AC electrode is 324.3 F g−1 by galvanostatic charge-discharge tests at a current density of 0.1 A g−1, and after 2000 charge-discharge cycles, the average attenuation rate of MnO2/G9AC (0.0068%) is much lower than MnO2/L9AC (0.021%) as well.
Acknowledgments
The authors acknowledge financial support from the National Natural Science Foundation of China (grant No. 51374252) and the Natural Science Foundation of Hunan province, China (grant No. 12jj3014).