
Abstract
We investigate the heat release of Li- and Mn-rich NCM (LMR-NCM) and NCA half-cells during cycling at different C-rates and quantify the individual contributions to the overall heat flow using a combination of isothermal micro-calorimetry and electrochemical methods. The paper focuses in particular on the open-circuit voltage (OCV) hysteresis of the LMR-NCM material, which results in a significant reduction in energy round-trip efficiency (≈90% for LMR-NCM/Li cells vs ≈99% for NCA/Li cells at C/10) and therefore in an additional source of heat that has to be considered for the thermal management of the cell. The total heat release of the LMR-NCM/Li cells is found to be nine times higher than that of the corresponding NCA/Li cells (at C/10). In the case of the LMR-NCM cathode, the heat due to OCV hysteresis is responsible for up to 55% of the total energy loss. Using the applied approach, the OCV hysteresis heat is separated into its share during charge and discharge and is furthermore presented as a function of SOC. Additional sources of heat, such as reversible entropic heat, parasitic effects, and measurement limitations, are discussed in terms of their contribution to the overall energy balance of the two cell chemistries.
Export citation and abstract BibTeX RIS

This is an open access article distributed under the terms of the Creative Commons Attribution Non-Commercial No Derivatives 4.0 License (CC BY-NC-ND, http://creativecommons.org/licenses/by-nc-nd/4.0/), which permits non-commercial reuse, distribution, and reproduction in any medium, provided the original work is not changed in any way and is properly cited. For permission for commercial reuse, please email: permissions@ioppublishing.org.
Lithium-ion batteries (LIB) for use in portable electronic devices and in battery electric vehicles (BEVs) dominate the battery market. For the latter application, high-energy density batteries are required (> 350 Wh kgcell −1), 1 so that a significant challenge is to create a suitable thermal management system, since the reduced surface area to volume ratio in large batteries can result in insufficient heat transfer from the cells to the surroundings. 2 Thus, the design of large batteries requires an accurate prediction of the heat flow rate from the LIB for the current loads applied.
Heat is produced and absorbed through various processes during electrochemical cycling of a battery. These processes generally include reversible entropic heat, irreversible heat due to the effects of polarization, heat from side reactions, and heat of mixing caused by the effects of the relaxation of lithium ion concentration gradients after interruption of the current. This study does not take into account the heat generation from side reactions because after several formation cycles and compared to the other sources of heat, it is typically negligible for cells that can be reversibly cycled. 3,4 Heat evolution due to mixing was also neglected, since it is a diffusional effect after current interruption, which is only significant for electrodes with large active material particles and at high current densities. 5 In the isothermal calorimetric measurements applied here, the heat absorbed by the cell remains close to zero, since the cell is maintained at a constant temperature. This means that only entropic and polarization effects contribute to the total heat generation. Usually, the heat flow rate of a LIB is dominated by irreversible heat at high current densities, while at lower currents, reversible heat can make a significant contribution. A recently published study, comparing the cycling behavior of 7 Ah pouch full-cells with Li- and Mn-rich layered oxide (LMR-NCM) cathodes to that of NCA cathodes, points out an additional significant heat evolution term for LMR-NCM cathode active materials (CAMs) that is caused by its large open-circuit voltage hysteresis (OCV hysteresis) and that largely affects thermal management. 6,7 Hence, apart from the applied current, the heat generation is also closely related to the cell chemistry and for active materials with a significant voltage hysteresis like Li- and Mn-rich NCMs and silicon, an additional heat term due to the OCV hysteresis needs to be considered. The thermal properties of electrode active materials are therefore critical for the design of large-scale high-energy density batteries. These thermodynamic data are essential input parameters in the modeling and development of thermal management systems.
The aim of the present study is therefore to enable a thorough understanding of the heat generation processes taking place in cells with an LMR-NCM (Li1.14(Ni0.26Co0.14Mn0.6)0.86O2) CAM that exhibits a significant OCV hysteresis in comparison to cells with NCA (LiNi0.81Co0.15Al0.04O2). We will compare these two CAMs cycled in half-cells with a lithium anode, whereby NCA serves as a reference CAM with a negligible OCV hysteresis that has been commercialized by Tesla in its electric vehicles and is incorporated in projections for grid-connected applications. 8 The scientific focus of this study is on LMR-NCM, which has a high gravimetric capacity (≈250 mAh gCAM −1) and a low material cost compared to other state-of-the-art CAMs, as it has a high manganese content instead of cobalt and nickel. However, issues such as oxygen evolution, gradual voltage fade during cycling, and a large OCV hysteresis still hamper the commercialization of LMR-NCM. 9–11 As mentioned by Kraft et al., 6 its OCV hysteresis, which is largely independent of the applied current and thus a material-specific property, negatively affects the round-trip efficiency of LMR-NCM based cells when compared to NCA based cells. At low C-rates, the energy round-trip efficiency for LMR-NCM/Li cells is ≈90%, while it is ≈99% for NCA/Li cells. If this energy inefficiency is dissipated as heat, it not only constitutes an additional source of heat in the overall energy balance, but it is also a challenge for the development of a thermal management system of such batteries. Hence, the following questions need to be addressed for materials like LMR-NCM that have a pronounced OCV hysteresis: (i) Is the energy loss due to the OCV hysteresis dissipated as heat? (ii) In what proportions is this heat dissipated in charge and discharge? (iii) At what point during charge and discharge is the heat evolved? (iv) What conclusions can be drawn from the heat evolution profiles with regard to the underlying thermodynamic mechanisms behind voltage hysteresis?
The current independent OCV hysteresis of LMR-NCM has previously been studied from several perspectives. Literature reports show correlations between OCV hysteresis, impedance response, 12 lattice parameters, 13 entropy, 14 and oxygen redox behavior. 15,16 Shi et al. showed that the entropy and overpotential behavior of LMR-NCM is unique compared to that of regular layered oxide materials. 17 Using only electrochemical methods, their study mainly correlates the gradual voltage decay (shown to be ≈100 mV over 100 cycles by Kraft et al. 6 ) with the entropy change within the material, whereas we focus on the OCV hysteresis between the charge and discharge voltage curve of a single cycle (≈up to 300 mV), which has a significant impact on the thermal behavior of the cell. The application of isothermal micro-calorimetry (IMC) in the precise thermal analysis of batteries was demonstrated long ago with the measurement of parasitic reactions in LIBs. 18 In a similar approach to ours, Housel et al. 19 analyzed the heat evolution of silicon anodes by combining IMC with the measurement of polarization induced and entropic heat flows. A recent study by Assat et al. 20 addressed some of our questions for an LMR-NCM model system (viz., Li2Ru0.75Sn0.25O3) and showed how the thermal characterization of a cathode active material with a pronounced OCV hysteresis could be accomplished with the help of isothermal micro-calorimetry (IMC). Chevrier et al. 21 used IMC in a similar manner to study silicon as an anode material, which also shows a path dependent behavior and heat generation for zero-current hysteresis.
The present study uses isothermal micro-calorimetry to analyze the thermal behavior during cycling of NCA/Li and LMR-NCM/Li half-cells at different C-rates. The data obtained relating to the generated heat are complemented by measurements of reversible and irreversible heat in order to quantify the different heat sources measured by IMC. Reversible heat is determined by entropy measurements, 14 while irreversible heat is calculated using impedance spectroscopy and overpotential data from an intermittent cycling protocol (constant-current charge intervals followed by OCV periods). In the case of LMR-NCM, the combination of all data sets enables the quantification of the evolved heat due to OCV hysteresis during charge and discharge, along with the calculation of a respective heat evolution profile.
Theoretical Considerations
Derivation of total heat generation in a battery
The heat flow ( ) generated by an electrochemical cell is described by Eq. 1. The interpretation of IMC data is based on the thermodynamics of a battery. A detailed derivation of Eq. 1 is provided by Housel et al.
19
in their Supporting Information.
) generated by an electrochemical cell is described by Eq. 1. The interpretation of IMC data is based on the thermodynamics of a battery. A detailed derivation of Eq. 1 is provided by Housel et al.
19
in their Supporting Information.

The first term on the right-hand side of Eq. 1 denotes irreversible heat generation ( ), which originates from the polarization processes that cause the measured cell potential under load (
 ) to deviate from the thermodynamic equilibrium potential (
 ). The difference between
  and
and  is generally called overpotential (
 ). It is further illustrated in Fig. 3 (whereby
  is used instead of
  as explained below). Note here, that
  is a function of the applied current (
 ).
).  is always exothermic. The second term is the reversible heat generation (
 ) caused by an entropic heat flow arising from changes in entropy as a result of the electrochemical reaction.
  can be calculated based on the change in
  with temperature. Entropic heat flow is reversible, hence it has different signs in the charge and discharge directions and should, by definition, have a zero contribution if a complete charge/discharge cycle is considered. In addition to these conventional heat flows, another term might be added to Eq. 1 to describe the parasitic heat flow (
 ) caused by any side or parasitic reactions, such as electrolyte decomposition
22
or SEI formation.
19
Although the contribution from parasitic heat flow is not equal to zero, it is not further analyzed in the present study, because it can be assumed to be small in comparison to the other sources of heat for a reversibly cycling cell, as will be shown later. As outlined in the Experimental section, a correction for minor parasitic heat flow is applied similar to what is reported by Assat et al.
20
Other non-Faradaic heat sources include the heat of mixing and the heat absorbed by the cell from the surroundings. As the measurements are conducted in an isothermal environment, the latter heat term is considered to be close to zero. The heat of mixing is reported to be only important at high current densities (>2C) and for electrodes with large particles (d ≈ 40 μm),
5
which is not the case in the present paper (max. 1C and particles with d ≈ 10–15 μm).
) caused by any side or parasitic reactions, such as electrolyte decomposition
22
or SEI formation.
19
Although the contribution from parasitic heat flow is not equal to zero, it is not further analyzed in the present study, because it can be assumed to be small in comparison to the other sources of heat for a reversibly cycling cell, as will be shown later. As outlined in the Experimental section, a correction for minor parasitic heat flow is applied similar to what is reported by Assat et al.
20
Other non-Faradaic heat sources include the heat of mixing and the heat absorbed by the cell from the surroundings. As the measurements are conducted in an isothermal environment, the latter heat term is considered to be close to zero. The heat of mixing is reported to be only important at high current densities (>2C) and for electrodes with large particles (d ≈ 40 μm),
5
which is not the case in the present paper (max. 1C and particles with d ≈ 10–15 μm).
However, particularly in the case of LMR-NCM, heat generation is not adequately described by Eq. 1. This is due to the hysteresis of the open-circuit voltage between charge and discharge. For a given state-of-charge (SOC), a cell with an LMR-NCM cathode has different OCVs upon charge and discharge, meaning that the OCV is path-dependent. The OCV hysteresis thus translates into a yet undescribed energy loss term. The whole situation thus becomes more complicated, and Eq. 1 has to be extended. To adapt the commonly used energy balance established above to a system with an OCV hysteresis, the voltage measured under open-circuit conditions will not be considered as a reversible equilibrium potential ( ) but as
  Consequently, a similar situation to that of the polarization effect is created by establishing a difference (
 ) between a (hypothetical) equilibrium potential (
 ) without hysteresis and the measurable potential under open-circuit conditions (
 ). To account for this conceptually, the first term in Eq. 1 can be expanded into two separate terms, one describing nominally the heat evolution term due to a current induced polarization (≡
 first term in Eq. 2) and one describing nominally the heat evolution induced by the OCV hysteresis (≡
 first term in Eq. 2), whereby the true reversible voltage (
 ) is unknown:

We want to underline that, unlike in classical intercalation materials, the position of  cannot simply be assumed to be halfway between the charge and discharge
  because
  is highly path-dependent. The position of
  is thus not directly accessible by experimental methods. Instead of the equilibrium potential, Assat et al.
20
and Chevrier et al.
21
constructed the so-called enthalpy potential based on calorimetric data. In the usual case with active materials that show no OCV hysteresis, i.e., where
is thus not directly accessible by experimental methods. Instead of the equilibrium potential, Assat et al.
20
and Chevrier et al.
21
constructed the so-called enthalpy potential based on calorimetric data. In the usual case with active materials that show no OCV hysteresis, i.e., where  (as for NCA/Li cells), Eq. 2 again simplifies to the form of Eq. 1. Note that there is an important difference between the calculation of
  and
and  although in both cases, the heat flow is based on the product of current and a potential difference. However,
  becomes very small when the current is reduced because
  is a function of the applied current and approaches
  for small currents, thus
  for small
  In contrast, since both
  and
and  are a material specific property, their potential difference
  is independent of the applied current and hence leads to a significant contribution even at low currents. Strictly speaking, the entropic heat for LMR-NCM is also determined from the change in
  with temperature, since the (hypothetical)
  is not accessible. However, this is more of a theoretical problem, and since the contributions from entropic heat flow are minor in the case of LMR-NCM, it will not be discussed further here. The interested reader is referred to a detailed discussion of the entropy of LMR-NCM by Friedrich et al.
14
The essential conclusion from Eq. 2 is that the heat flow due to OCV hysteresis (
is not accessible. However, this is more of a theoretical problem, and since the contributions from entropic heat flow are minor in the case of LMR-NCM, it will not be discussed further here. The interested reader is referred to a detailed discussion of the entropy of LMR-NCM by Friedrich et al.
14
The essential conclusion from Eq. 2 is that the heat flow due to OCV hysteresis ( ) can be calculated from the difference between the total heat flow
  measured by IMC and the sum of the reversible (
 ) and irreversible heat flow terms (
 ).
).
We want to make clear that the current ( ) in Eq. 1 is defined to be positive in the discharge direction (voluntary process, lithiation of the cathode) and negative in the charge direction. By this definition, a positive
  represents heat absorbed by the cell (endothermic), while a negative
  means that heat is generated by the cell (exothermic). It should be noted, however, that in contrast to this thermodynamic definition, the sign convention used in this study is based on the perspective of the calorimeter, as is common in the literature. Thus, if the IMC measures heat generated by the cell (exothermic reaction) the heat flow has a positive sign, while it takes a negative value for heat absorbed by the cell (endothermic process).
Contributions to irreversible heat
Irreversible heat arises from the internal battery resistance and is calculated either as the current multiplied by the polarization induced overpotential ( ) or as the product of the current squared and the total cell resistance (
 ).
).

The full voltage relaxation during the applied intermittent cycling protocol (constant-current charge intervals followed by OCV periods; Experimental section) gives the polarization induced overpotential  for each relaxation phase at this specific current (see Fig. 3), from which the total irreversible heat flow (
 ) can be calculated.
The contributions to the total cell resistance can be further analyzed by impedance spectroscopy. As shown in Fig. 1, the impedance spectra in this study were fitted with a simplified transmission line model. The fitted equivalent circuit is described by  Hereby,
  represents the sum of several contributions: (i) the high frequency resistance, which includes the ionic resistance of the separator and the electrical resistance of the external cell contacts; (ii) the resistance of the Li anode; and, (iii) the contact resistance between the cathode and the Al current collector. As can be seen from the example in Fig. 1,
  is defined as being at the end of the high-frequency semi-circle. The low-frequency semi-circle corresponds to a complex convolution of the pore resistance due to the lithium ion conduction across the porous cathode (
 ) and the cathode charge transfer resistance (
 ). In case of the LMR-NCM/Li cells, the low-frequency semi-circle was fitted by a transmission line model.
23
The assignment of the fitting parameters to the semi-circles is verified by experiments with a micro-reference electrode (not shown here) and by comparison to literature reports.
12
In the case of NCA/Li cells, the pore resistance could not be clearly distinguished. In this case, the second semi-circle was fitted by a simplified
). In case of the LMR-NCM/Li cells, the low-frequency semi-circle was fitted by a transmission line model.
23
The assignment of the fitting parameters to the semi-circles is verified by experiments with a micro-reference electrode (not shown here) and by comparison to literature reports.
12
In the case of NCA/Li cells, the pore resistance could not be clearly distinguished. In this case, the second semi-circle was fitted by a simplified  /
/ element where
  includes
  and
and  More details on the analysis and fitting of the impedance data can be found in the Experimental section. Since
  is assumed to be constant and independent of the SOC, we will focus on the analysis of and
  However, to compare the results of the impedance analysis to those of intermittent cycling, the low frequency resistance
  needs to be calculated from the fitting parameters:
23
needs to be calculated from the fitting parameters:
23

Equation 4 was applied for the impedance spectra of the LMR-NCM/Li cells within its validity criteria.
24
For NCA,  is calculated from the sum of and
  Both,
Both,  and
and  are only shown for NCA where they were clearly distinguishable (at high and low SOC). The difference between
  and the total resistance determined by the intermittent cycling (
 ) is a result of diffusion limitations. For a more advanced impedance analysis of cells with LMR-NCM cathodes, the reader is referred to the work by Teufl et al.
12
However, the aim of this study is not to conduct a detailed impedance analysis, but to deconvolute the different sources of irreversible heat, in particular the contributions of the cathode, which justifies the applied simplification.
) is a result of diffusion limitations. For a more advanced impedance analysis of cells with LMR-NCM cathodes, the reader is referred to the work by Teufl et al.
12
However, the aim of this study is not to conduct a detailed impedance analysis, but to deconvolute the different sources of irreversible heat, in particular the contributions of the cathode, which justifies the applied simplification.

Figure 1. Exemplary impedance spectrum of an LMR-NCM/Li cell at a nominal SOC of ≈260 mAh/gCAM during a C/10 charge, with data depicted as black circles and the applied fit as a blue line. Only the low-frequency semi-circle was fitted by the equivalent circuit  From this spectrum, the pore resistance of this cell was determined as 12.2 Ω cm2. The arrows mark the parameters extracted from the fit: (i)
  which includes the high frequency resistance of the cell, contact resistances, and contributions of the Li anode impedance; (ii) the charge transfer resistance of the cathode,
  , which was extracted from the transmission line model; and, (iii) the low frequency resistance
  , as described above. The high frequency semi-circle was not taken into account for fitting.
Download figure:
Standard image High-resolution imageThermal energy per cycle
So far, only heat flows, i.e., the evolution of heat over time, have been discussed. However, the total heat generated during a complete charge/discharge cycle, the thermal energy per cycle, can be obtained from them. This parameter can be accessed by various means: (i) as the sum of the integration of all calculated heat flow terms over time; (ii) as the integration of the voltage curve over a whole cycle; and, (iii) as the sum of the integrated heat evolution during a charge/discharge cycle measured by IMC. Therefore, the contributions of different heat sources can be quantified by calculating (i) and (ii) and then comparing it to the thermal energy measured by IMC (iii). An essential requirement for the validity of this analysis is that the total thermal energy per cycle calculated by all three methods is equal. This means that the electrical energy lost according to the voltage curve is fully converted into heat and that there are no other (non-Faradaic) heat sources.
For calculation method (i), the heat generated during charge  (during discharge
  ) is integrated from time t0, where the charge (discharge) commenced, to tc (td), where the charge (discharge) half-cycle ends. The sum of the heat generated during charge and discharge gives the total heat generated per cycle,
  Since reversible heat has opposite signs on charge and discharge, it cancels out and thus does not contribute to the thermal energy per cycle.
Thus, only the irreversible heat and the energy loss due to hysteresis (in the case of LMR-NCM), both separated into their charge and discharge components, contribute to the thermal energy per cycle.
Using calculation method (ii), the integration over the voltage curve on load, only one value, which is the sum of all heat sources, can be obtained:

However, when applying intermittent charging, the voltage under load can be distinguished from that under open-circuit conditions. This enables the quantification of individual contributions to the thermal energy per cycle. The generated irreversible heat can be calculated for the charge ( ) and discharge (
 ). For example, the energy loss caused by the effects of polarization during charge is the integrated area between the upper voltage curve under load and the upper OCV curve (analogously for the discharge):

The energy loss caused by OCV hysteresis is calculated by integrating the area enclosed by the OCV points upon charge and discharge. Only the sum of the charge and discharge contributions to  is accessible from integration of the OCV data.

It is important to keep in mind that the integration over the whole charge/discharge voltage curve is not a closed loop due to the coulombic inefficiency of the cell. When Eq. 6 is thus strictly applied,  is overestimated as compared to reconstructing
  according to Eq. 5 from
 and
and  calculated according to Eqs. 7 and 8. The resulting inaccuracy of the analysis and how to best minimize it will be discussed later in the Results section.
For method (iii), the heat flow signal measured by IMC is integrated over time to give the total generated heat. When a sufficiently long OCV phase is applied at the end of each charge/discharge half-cycle, the total heat generated during charge can be separated from that during discharge. The heat evolution is measured by IMC both during current flow and the consecutive OCV phase, in which the heat signal levels off while the cell cools down. When comparing with calculated heat flows, only the signal during current flow is considered, while for the calculation of the total heat generation, the heat evolution at zero current also needs to be taken into account. However, for this part of the IMC signal, the time delay of the instrument needs to be taken into consideration, in order to determine a reasonable time frame during which the IMC signal at open-circuit conditions is included in the integration. The applied method is explained in more detail in the Experimental section.
The combination of all three methods enables the differentiation and identification of the different sources of heat contributing to the experimental IMC data. In particular, when the irreversible heat calculated by Eq. 7 is subtracted from the calorimetric data of the respective half-cycle,  can be determined for the charge and discharge half-cycles. However, when calculating
  with this method, the reversible heat,
  cannot be neglected, although the fact that
  cancels out in Eq. 5 might give this impression. This is because, unlike a whole cycle, the reversible heat during a half-cycle, e.g.,
  during charge, contributes to the heat evolution measured by IMC. However, when calculating the heat evolution of a half-cycle by method (ii), the reversible heat is not included because it cannot be calculated from the voltage data collected during intermittent cycling. Thus, when comparing both values, the inconsistency with regard to
  constitutes an error source for determining the share of
  for individual half-cycles. Therefore, we use the term
  instead of
  (see Fig. 10) to make it more clear that what is determined by method (ii) is the residual heat for each charge/discharge half-cycle. In other words,
  only equals
  if
if  were zero. This will be discussed in more detail in the Results section.
Experimental
Battery assembly and cycling
LMR-NCM of the composition Li1.14(Ni0.26Co0.14Mn0.6)0.86O2, which corresponds to the nomenclature 0.33 Li2MnO3 · 0.67 LiNi0.38Co0.21Mn0.41O2 as used by Teufl et al. 9 and NCA of the composition LiNi0.81Co0.15Al0.04O2 were obtained from BASF SE (Germany). For electrode preparation, inks of the cathode active material (CAM) were prepared by mixing 92.5 wt% CAM (NCA or LMR-NCM), 3.5 wt% polyvinylidene-fluoride binder (PVdF, Solef 5130, Solvay, Belgium), and 4 wt% conductive carbon (Super-C65, Timcal, Switzerland) with N-methyl pyrrolidine (NMP, anhydrous, Sigma-Aldrich, Germany). The dispersion was mixed in a planetary orbital mixer (solid content ≈58 wt%; Thinky, USA). The resulting ink was coated onto aluminum foil (≈15 μm, MTI, USA) and the dried coatings were calendered (GK 300 L, Saueressig, Germany) to a porosity of ≈42%–45%. For electrochemical testing, the electrodes were dried for a minimum of 12 h at 120 °C under dynamic vacuum (Büchi, Switzerland). The loading of the LMR-NCM electrodes was ≈12 mg cm−2, which corresponds to ≈3 mAh cm−2, (based on a nominal reversible capacity of 250 mAh gLMR-NCM −1). The NCA electrode loading was ≈13 mg cm−2, which corresponds to ≈2.6 mAh cm−2, (based on a nominal reversible capacity of 200 mAh gNCA −1).
Coin cells (type CR2032) were assembled in an argon-filled glovebox (O2, H2O < 0.1 ppm, MBraun, Germany) with the manufactured cathodes (14 mm diameter), two glass fiber separators (17 mm diameter, glass microfiber #691, VWR, Germany), and a Li counter electrode (15 mm diameter, 450 μm thickness, 99.9%, Rockwood Lithium, USA). A volume of 100 μl of electrolyte was added, composed of 1 m LiPF6 in a FEC:DEC-based (12:64 v:v) solvent with 24 vol% of an additional fluorinated co-solvent (BASF SE, Germany). Electrochemical testing was performed at 25 °C in a temperature-controlled oven (Binder, Germany) using a potentiostat (VMP300, Biologic, France). First, a formation cycle at a C-rate of C/15 (voltage cutoffs for LMR-NCM were 2.0–4.8 V and for NCA 3.0–4.4 V; all voltages reported vs Li+/Li) and two stabilization cycles at C/10 (2.0–4.7 V for LMR-NCM and 3.0–4.4 V for NCA) were conducted. All C-rates reported here refer to the above stated nominal capacities of the CAMs. The cells analyzed in this study can be divided into two groups: (i) those used for the IMC measurements (red box in Fig. 2); and (ii) those used to determine the irreversible heat (blue box in Fig. 2).
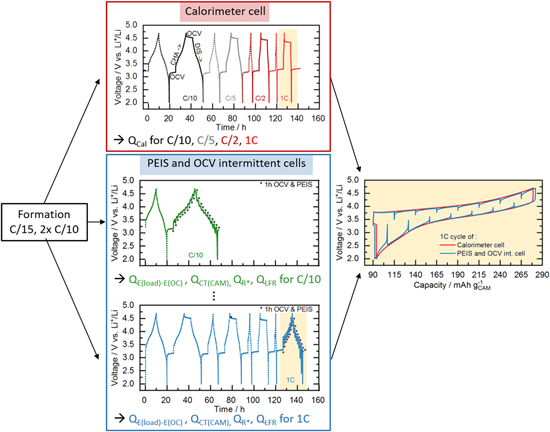
Figure 2. Graphic representation of the cycling procedures used in this study, with the initial formation cycle at C/15 (2.0–4.8 V for LMR-NCM/Li and 3.0–4.4 V for NCA/Li) and two stabilization cycles at C/10 (2.0–4.7 V for LMR-NCM/Li and 3.0–4.4 V for NCA/Li) conducted in-house (black box, left). The subsequent actual test protocols differ for the two types of experiments: (i) for the IMC measurements (red box), cells were cycled inside the calorimeter with a loop of one stabilization cycle and one cycle with 6 h rest phases at the beginning and end of each half-cycle, repeated for each applied C-rate (C/10, C/5, C/2, 1C;); (ii) for the determination of the different sources of heat (blue box), an intermittent cycling protocol with 10% SOC steps and 1 h OCV phases was applied. For each C-rate, two identical cells were cycled with the same protocol as the IMC cells but for the C-rate of interest, where the intermittent cycling was applied (see example for C/10 and 1C in the blue box). The panel on the right presents a comparison of the data at 1C for a calorimeter cell and the cell with intermittent cycling.
Download figure:
Standard image High-resolution imageIsothermal micro-calorimetry measurements
Following the initial formation cycles, which were conducted in-house, the calorimeter cells were transferred to an isothermal micro-calorimeter at the Helmholtz Institute Ulm to record the heat generation during cycling. A TAM IV calorimeter equipped with a 20 ml micro-calorimeter (stability ±50 μK, accuracy ± 300 nW, precision ±100 nW, TA Instruments, USA) was used for this purpose. All measurements were performed at 25 °C under isothermal conditions, following internal gain calibration. During the course of the experiments, the baseline drift did not exceed 700 nW. The step response of the heat flow is of second order, and the two characteristic time constants are T1 = T2 = 158 ± 1 s. This results in a time delay of ≈1050 s until 99% of the heat flow signal is detected. Here, a positive sign in the observed heat flow indicates that heat is generated by the cell.
The cells were cycled in a custom-made coin cell holder, which was connected by Cu-P bronze wires (36 AWG, Lakeshore, USA) to a potentiostat (VSP, BioLogic, France). Galvanostatic cycling was conducted, as shown in the red box in Fig. 2, at a number of current levels (C/10, C/5, C/2, 1C). For each C-rate, one first continuous charge/discharge cycle was performed and ended by a 6 h equilibration phase in the discharged state under open-circuit conditions. This first cycle was intended for the purpose of adapting to a new C-rate, and the heat generated during this process was not considered. The heat flows were determined from the second cycle, commencing with a constant-current charge to the respective upper cutoff voltage (4.7 V for LMR-NCM and 4.4 V for NCA) at the particular C-rate, followed by a further 6 h equilibration phase to enable separation of the heat flow during charge and discharge, and finally discharging to the respective lower cutoff voltage (2.0 V for LMR-NCM and 3.0 V for NCA). The discharge was followed by a 6 h open-circuit phase before the whole loop of two cycles was repeated for the next C-rate. Two identical cells were measured for each CAM. A constant baseline was used for integration of the data, which was determined as the minimum heat flow at each C-rate section. By subtraction of this constant background signal, a correction for minor parasitic heat flows is achieved. 20 However, it must be kept in mind this is not the true value of the parasitic heat of this cell, which depends on complex relationships among all cell components, the SOC and voltage of the cell and its cycling history. This simplification is acceptable for the scope of this study but it does not describe the nature of the parasitic heat flow. Due to the time delay, the integration of the heat flow of an individual charge or discharge half-cycle includes not only the heat signal during current flow, but also that during the subsequent relaxation phase. Of the applied 6 h relaxation phase, we only included the first 1.5 h into the calculation, which is sufficient to obtain most of the actual heat signal, considering the time delay of ≈18 min (until 99% of the signal is detected), while being short enough to minimize contributions from parasitic heat flows.
Determination of irreversible heat by intermittent cycling and impedance analysis
As shown in Eq. 3, the irreversible heat generation rate ( ) is a function of the voltage difference
  between the voltage on load (
 ) and after relaxation at open-circuit conditions (
 ). During intermittent cycling,
  is determined after a certain time
  of the intermittent relaxation phase, as shown in Fig. 3. The applied cycling protocol was similar to a galvanostatic intermittent titration and included (dis)charging steps of ΔSOC = 10% followed by a relaxation phase of
  = 1 h. This was repeated until the upper (lower) voltage cutoff was reached. To determine
  for the first SOC point during charging, the method shown in Fig. 3 is not applicable, because there is no preceding voltage relaxation in the charge direction. Therefore, for this data point, it was only possible to determine the instantaneous voltage jump upon applying the charging current. The same holds for the first point on discharge. The underlying resistance to this instantaneous voltage change was calculated using Ohm's law, and it was observed that it agrees well with the low-frequency resistance calculated from the impedance analysis. Hence, for the first SOC point of each half-cycle, the intermittent technique complies with the impedance and does not include any effects of diffusion, as is the case if
  can be determined from full voltage relaxation.
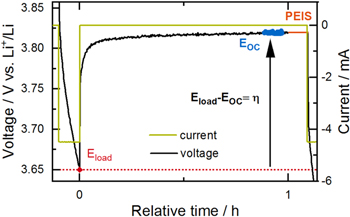
Figure 3. Application of intermittent cycling to determine the polarization induced overpotential  The current (green) and voltage (black) during a 1C discharge (ΔSOC = 10%) and a consecutive 1 h OCV phase are shown.
  is determined by averaging over the final 300 s of the OCV phase (data marked in blue). After relaxation, a PEIS measurement is conducted, whose duration is only shown schematically here (orange).
Download figure:
Standard image High-resolution imageThe intermittent cycling, shown in the blue box in Fig. 2, was conducted with identical cells, as used in the IMC measurement with two cells for each C-rate. To ensure applicability of the herein determined irreversible heat to the data obtained from IMC experiments, the intermittent cycling protocol mimics the cycling protocol for the IMC. This means that to determine  at a specific C-rate, the cell first underwent the same loop of continuous cycling and charging/discharging with a 6 h rest phase in between at each C-rate preceding the C-rate of interest, such that the irreversible heat data are from the exact same cycle with the same cycling history as the heat data from the IMC (illustrated in the bottom panel of Fig. 2 for acquiring intermittent cycling data at 1C). Furthermore, the OCV data shown in this paper were determined by a Matlab script averaging over the final 300 s of the intermittent relaxation phase (see data given in blue in Fig. 3).
In addition to determining the overpotential by intermittent cycling, the cell resistance was further analyzed by means of impedance spectroscopy. As marked in Fig. 3, an impedance measurement (PEIS) was conducted at the end of each 1 h intermittent relaxation phase of the protocol described above. A potentiostat (VMP300, Biologic, France) was used in a frequency range of 200 kHz to 100 mHz with an AC voltage perturbation of 10 mV (taking 20 data points per decade and 3 period repetitions). As explained in the Theoretical Considerations above, data were fitted by the equivalent circuit  Here,
Here,  includes the high frequency resistance of the cell, the impedance of the Li anode, and the contact resistance of the cathode. The data of the high-frequency semi-circle was not taken into account for the fit, and
  was set to the end of the first semi-circle, as shown in Fig. 1. The low-frequency semi-circle was fitted by the transmission line model, including contributions from the pore resistance,
  and the charge transfer resistance of the cathode,
  The pore resistance of the LMR-NCM/Li cells was extracted from a fit of an impedance spectrum at high SOC during charge, in which the characteristic 45° line
23
was clearly observable and kept constant for all other impedance fits of this cell. In the case of NCA/Li cells, the pore resistance could not be clearly distinguished and is therefore a part of
The pore resistance of the LMR-NCM/Li cells was extracted from a fit of an impedance spectrum at high SOC during charge, in which the characteristic 45° line
23
was clearly observable and kept constant for all other impedance fits of this cell. In the case of NCA/Li cells, the pore resistance could not be clearly distinguished and is therefore a part of  Furthermore, we only show
  and the sum of
  and
and  for NCA where they were clearly distinguishable (at high and low SOC) and otherwise report
  Due to the generally much smaller
  of NCA/Li cells compared to LMR-NCM/Li cells, the impedance contribution of the lithium counter electrode in the mid-SOC region is of a similar order as
  which results in the two semi-circles merging. Hence, for the respective spectra,
  cannot be assigned unambiguously.
Figure 1 shows an example of an impedance spectrum for an LMR-NCM/Li cell. Unfortunately, we did not collect any data under blocking conditions, as would usually be performed to determine  23
The results for
23
The results for  are 12.2 Ω cm2 and 10.1 Ω cm2 for the two nominally identical LMR-NCM/Li cells at C/10. The charge transfer resistance of the cathode was extracted from the transmission line model. It was verified by impedance experiments using a gold wire micro-reference electrode (not shown here), which, furthermore, correspond with the data in the literature.
12
The difference between the irreversible heat calculated from the polarization induced overpotential
are 12.2 Ω cm2 and 10.1 Ω cm2 for the two nominally identical LMR-NCM/Li cells at C/10. The charge transfer resistance of the cathode was extracted from the transmission line model. It was verified by impedance experiments using a gold wire micro-reference electrode (not shown here), which, furthermore, correspond with the data in the literature.
12
The difference between the irreversible heat calculated from the polarization induced overpotential  and that calculated from the low-frequency resistance (
 ) determined from the PEIS data is due to the mass-transport limitations within the electrolyte and the porous electrode, which are not captured by the PEIS measurements in the applied frequency range.
Determination of reversible heat
As shown in Eq. 2, reversible heat is calculated as a product of the current, temperature and temperature-dependent OCV value,  The latter was measured as a function of SOC after (dis)charging the cell to a certain SOC point and allowing it to relax until the change in OCV over time was less than 0.2 mV/h. After this relaxation,
  was determined by linearly varying the temperature of the cell between 5 °C and 35 °C in an Espec temperature chamber (LU114, Espec, Japan), while recording the respective OCV variation (VMP300, Biologic, France). A detailed description of the method applied is reported elsewhere.
14
The obtained values for
was determined by linearly varying the temperature of the cell between 5 °C and 35 °C in an Espec temperature chamber (LU114, Espec, Japan), while recording the respective OCV variation (VMP300, Biologic, France). A detailed description of the method applied is reported elsewhere.
14
The obtained values for  are shown in the appendix (Figure A·1).
Results and Discussion
Lost electrical energy
Lost electrical energy is the difference between the charge and the discharge energy of one cycle, and is expected to dissipate as waste heat. The two cathode active materials of interest, LMR-NCM and NCA, exhibit considerably different energy efficiencies. While an LMR-NCM/Li cell has an energy efficiency of ≈90% in the 5th cycle at C/10, that of an NCA/Li cell reaches ≈99%. Figure 4 shows a voltage vs SOC charge/discharge curve for both cell types in a C/10 cycle. According to Eq. 6, the total energy loss corresponds to the integration of the geometrical area enclosed by the charge and discharge voltage curve (sum of orange, blue, and green shaded areas in Fig. 4). This total energy loss can be further separated into three parts: (i) the irreversible energy loss during charge ( ), i.e., the difference between the voltage curve on load and the OCV curve during charge (orange shaded area), as described by Eq. 7; (ii) the irreversible losses during discharge (
 green shaded area); and, (iii) the energy loss due to OCV hysteresis (
 blue shaded area), as described by Eq. 8.

Figure 4. Voltage vs SOC charge/discharge curves of (a) LMR-NCM/Li and (b) NCA/Li in the 5th cycle at C/10 obtained during intermittent cycling with 1 h OCV holds at every 10% SOC interval. The charge curve is shown as a black solid line and the OCV points are shown as black circles connected by a dashed line. The integral of the whole curve is the total lost electrical energy, which can be separated into three parts: irreversible losses during charge (orange) and discharge (green) due to polarization induced overpotential, and the lost energy due to OCV hysteresis (blue).
Download figure:
Standard image High-resolution imageNote here, that the coulombic inefficiency of the cell means that the end of the discharge curve does not meet the start of the charge curve. For clarity, the resulting "gap" is not colored in Fig. 4. The deconvolution of these different energy loss terms as a function of the C-rate is shown in Table I for LMR-NCM and NCA half-cells. Thereby, the values for  for charge and discharge were calculated by applying Eq. 7. The calculation of
  was based on Eq. 8. However, the last
  value upon discharge did not agree with the first
  on charge due to the coulombic inefficiency of the cell. If Eq. 8 were exactly applied, this would lead to an obvious overestimation of
  , which is physically not meaningful. In other words, the blue area in Fig. 4 would extend down to zero volts because there is no matching discharge voltage curve. Instead, we applied a small correction, so that the last
  value agrees with the first
  value.
  is thus calculated by integrating over a closed OCV hysteresis curve. This assumption minimizes the error of the coulombic inefficiency but does not exclude it all together. The resulting implications will be discussed throughout this work. For an absolutely accurate calculation the error introduced by the coulombic inefficiency should be ruled out by the design of the experiment using capacity limited cycling procedures (instead of voltage limited), so that the discharge capacity is equal to the charge capacity. This might be a starting point for future research activities striving for the exact quantification of individual heat terms.
Table I. Lost electrical energy for LMR-NCM and NCA half-cells calculated from the voltage vs SOC charge/discharge curve as a function of C-rate, using an intermittent cycling protocol. The total energy loss is shown in absolute numbers and relative to the charge energy of the respective cycle. The different energy terms as defined by Eqs. 7 and 8 are shown as absolute numbers and relative shares of  .
.
|
As outlined in the Theory section, irreversible energy losses due to overpotential ( ) are dependent on the applied current, while the hysteresis of the OCV is expected to be independent of the C-rate. As expected, the polarization induced overpotential losses in Table I increase with increasing current for both cell chemistries. In the case of LMR-NCM, the irreversible heat during discharge is larger than during charge and becomes more and more dominant for increasing current values, until it reaches 50% of total heat generation at 1C. In Fig. 4a, it can be seen that the potential difference between the voltage curve on load and the OCV curve increases drastically at the end of the discharge (to a lesser degree also at the end of the charge). Hence, the end of the lithiation process of the cathode active material seems to be accompanied by significant kinetic limitations, leading to high overpotentials and, in turn, to high irreversible heat evolution. The asymmetry of the LMR-NCM cathode resistance between the charge and discharge direction was previously demonstrated by Teufl et al.
12
) are dependent on the applied current, while the hysteresis of the OCV is expected to be independent of the C-rate. As expected, the polarization induced overpotential losses in Table I increase with increasing current for both cell chemistries. In the case of LMR-NCM, the irreversible heat during discharge is larger than during charge and becomes more and more dominant for increasing current values, until it reaches 50% of total heat generation at 1C. In Fig. 4a, it can be seen that the potential difference between the voltage curve on load and the OCV curve increases drastically at the end of the discharge (to a lesser degree also at the end of the charge). Hence, the end of the lithiation process of the cathode active material seems to be accompanied by significant kinetic limitations, leading to high overpotentials and, in turn, to high irreversible heat evolution. The asymmetry of the LMR-NCM cathode resistance between the charge and discharge direction was previously demonstrated by Teufl et al.
12
Energy loss due to overpotential is significantly smaller for NCA, as can be clearly seen in Fig. 4b and Table I. Still, the resistance behavior of NCA at low SOC during discharge is similar to that of LMR-NCM, with a steep increase at the end of the discharge. This was attributed to an increase in the charge transfer resistance, as reported by Weber et al.
25
More important is the OCV hysteresis comparison, since there is no significant contribution from this term for NCA/Li cells and the determined contribution of the OCV hysteresis to the overall energy loss of 0.1%–0.3% (see last row in Table I) are most probably due to the fact that the  is not yet exactly equal to
  after the 1 h rest phase. In contrast, the cells with an LMR-NCM cathode suffer a considerable energy loss due to OCV hysteresis of up to 55% of the total energy loss at C/10. At first sight surprising is the observation that the energy loss due to the OCV hysteresis of the LMR-NCM/Li cells decreases with increasing C-rate. The reason for this is that the applied cycling protocol is voltage-limited, meaning that a smaller overall SOC range is accessed when cycling at higher C-rates, and therefore only a smaller part of the OCV hysteresis is observable. We have shown elsewhere (see Fig S6 (available online at stacks.iop.org/JES/169/040547/mmedia) in Ref. 14) that when applying a capacity-limited cycling procedure, the OCV hysteresis is independent of the C-rate. The energy loss due to OCV hysteresis results in an undesirable energy inefficiency, which is presumably dissipated as heat. To clarify this, IMC measurements were conducted to analyze the different sources of heat, particularly the heat due to OCV hysteresis in such materials and to compare it to the thermal behavior of a classical CAM such as NCA.
Accuracy of the isothermal micro-calorimeter
In order to establish a quantitative correlation between the lost electrical energy calculated from the voltage vs SOC curve by method (ii), as described in the Theory section, and the heat measured by IMC (method (iii)), the accuracy of the calorimetric measurement first has to be validated. For this purpose, the heat evolution from the IMC data (pale, empty symbols) and that calculated from the respective voltage curves (dark, filled symbols) are contrasted in Fig. 5. Ideally, both data sets should show perfect agreement, which is indicated by the dashed lines that represent linear regression lines through all the data. For the LMR-NCM/Li cell, the deviation is between −2% and −6%, with one outlier of −12% for the LMR-NCM/Li cell for one of the two cells (cell number 1) at C/10. This means that the measured heat by calorimetry is generally slightly below the expected value, which may be due to instrument errors such as the loss of heat through the cables connecting the coin cell holder with the potentiostat. Also, it should be noted that if the integration of the calorimeter heat signal in the 6 h OCV rest phase at the end of discharge had been chosen to be longer than 1.5 h, the deviations would become smaller. However, since the estimated time delay for detection of 99% of the heat signal is ≈18 min, any extension of the integration window would increase the risk of including contributions from non-faradaic heat (e.g., through parasitic side reactions). In the case of NCA, the deviations are between +4% and +10%, i.e., the heat measured by calorimetry is more than that obtained by the integration of the voltage vs SOC curves. One of the two NCA/Li cells (cell number 2) showed an outlier of +45% at C/10, but since a fluctuation in the applied electrical current was detected, we did not include this data point in our calculations. Due to the much smaller absolute amount of produced heat in case of the NCA/Li cell, any contributions from undesired side reactions and parasitic heat terms result in a much higher relative error, which might be the reason why the integrated IMC signal is higher than expected. Nevertheless, since the deviations between the expected and measured heat are below ±10% (with the exception of the two above mentioned cases) for both cell chemistries, our original assumption that the lost electrical energy is converted into heat and that parasitic side reactions play no major role is confirmed within the error of the measurements. Another conclusion that can be drawn from Fig. 5 is that the experiments are reproducible, since the energy losses for both cells correspond fairly well (the deviation between two repeat cells at the same C-rate is less than 6% in all cases, except for the two instances mentioned above). For all further calculations, we considered LMR-NCM/Li cell 2 and NCA/Li cell 1.
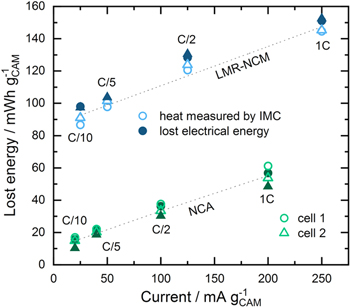
Figure 5. Comparison of the lost electrical energy calculated from the voltage vs SOC curve (dark, filled symbols) and the heat measured by IMC (pale, empty symbols) for two identical LMR-NCM/Li cells (blue) and NCA/Li cells (green) for different mass-specific current densities (corresponding to the C-rates indicated in the figure). The dashed lines represent a linear fit through the average of all data points of one cell chemistry at each C rate.
Download figure:
Standard image High-resolution imageWhen comparing the total electrical energy loss/heat production measured by the continuous constant-current (CC) cycling protocol used in the calorimeter experiments (data in Fig. 5) with the total electrical energy loss measured in the intermittent cycling protocol (first row in Table I), it becomes apparent that there is a reasonably good agreement at the low C-rate of C/10, with the intermittent cycling yielding slightly lower energy losses, but that at higher C-rates, this deviation increases substantially, so that at 1C the intermittent cycling procedure results in a ≈25%–35% lower total energy loss. This is mainly due to three factors. First, the CC-cycling procedure, particularly at higher C-rates, leads to a higher overall voltage polarization compared to the intermittent cycling procedure, for which the intermittent OCV holds allow for a repeated relaxation of the concentration gradients in the liquid and solid phase. This can be seen by the comparison of the resulting voltage vs SOC curves shown in the right-hand panel of Fig. 2. Thus, integrating a voltage vs SOC curve from an intermittent cycling protocol always resulted in a smaller value compared to that from a CC-cycling protocol, meaning that the energy losses from intermittent cycling are slightly lower (by ≈4%–7% for the LMR-NCM/Li cells and by up to ≈25% for NCA/Li cells). The second reason is that the Coulombic efficiency of each cycle is slightly less than 100%. This irreversible capacity leads to a small 'gap' between the charge and the discharge voltage curves, so that the integration of the voltage vs SOC curve cannot be performed 100% accurately. The calculation of total electrical energy loss from the voltage vs SOC curves of the cells tested in the calorimeter energy loss caused by the integration of the gap. For the cells from the intermittent cycling, the electrical energy loss is calculated based on Eq. 6. This mathematical approach, however, does not include the integration of the "gap" since it can neither be ascribed to  during charge or discharge, nor to
  Thus, the calculated electrical energy loss is lower in case of the cells from intermittent cycling due to the integration of the voltage vs SOC curve. The third reason is the slightly higher contact resistance of the custom-made coin cell holder for the experiments conducted in the calorimeter (≈9 Ω). As these three factors yield reasonably small differences in the total lost electrical energy determined from the voltage vs SOC curves obtained by the two different cycling protocols at C/10, but yield increasingly large differences at higher C-rates, the analysis in the following sections for which both cycling protocols are required will be limited to C/10.
Although the limits of the applied IMC method become clear from Fig. 5, it also provides an answer to the first question in the introduction to this paper: the energy loss due to the OCV hysteresis in LMR-NCM is indeed dissipated as heat (note that another, albeit unlikely possibility would have been that the OCV hysteresis presents a continuous chemical conversion of the bulk of the LMR-NCM material). Moreover, there is an important difference between the two cell chemistries, which is visualized in Fig. 5: the y-axis intercepts of the linear relationship between lost electrical work and measured heat vs mass-specific current density (dashed lines in Fig. 5) is rather small for the NCA/Li cells (≈12.1 mWh gCAM
−1 and ≈12.4 mWh gCAM
−1 for cell 1), while it is quite large (≈93.1 mWh gCAM
−1 and ≈88.9 mWh gCAM
−1 for cell 2) for the LMR-NCM/Li cells, caused by the quasi-static OCV hysteresis, as discussed by Assat et al.
20
for the Li2Ru0.75Sn0.25O3 model compound. Chevrier et al.
21
also report a significant heat production at zero current for silicon anodes, and thereby correlate their observation to the current independent nature of the voltage hysteresis. We conclude that even at very low rates, there is significant hysteresis between the OCV curve on charge and discharge, indicating that the underlying processes are far from the thermodynamic equilibrium. The fact that the intercept for the NCA/Li measurement results is not zero, however, underlines the limits of the applied IMC method especially at such small observable heat signals. One would have expected the intercept to be zero because both contributions of reversible and irreversible heat should ideally vanish to zero at infinitesimally small currents. Apart from the accuracy of the method at such small heat signal amplitudes, any assumptions and simplifications made during the calculation (e.g. correction for  integrating the voltage curve although the coulombic efficiency is less than 100%, etc.) are possible error sources, which might lead to the observed deviation from zero.
Conventional contributions to the heat flow profile
In addition to the integration of the IMC heat signal to a total heat value, it is also possible to analyze the heat flow profile as a function of the SOC. This analysis involves calculating different heat sources, as outlined in the Theory section of the paper. Figs. 6 and 7 show the heat flow signal measured by IMC (black) together with various heat flow profiles calculated as a function of SOC for LMR-NCM/Li and NCA/Li, respectively. According to Eq. 2, three contributions to the total heat flow can be identified: irreversible heat ( ), reversible heat (
 ) and heat due to OCV hysteresis (
 ); while the first two terms can be observed for any electrode material, the latter is only observable in materials with a pronounced OCV hysteresis, such as LMR-NCM. The discussion in this section will focus on the conventional sources of heat,
  and
and 
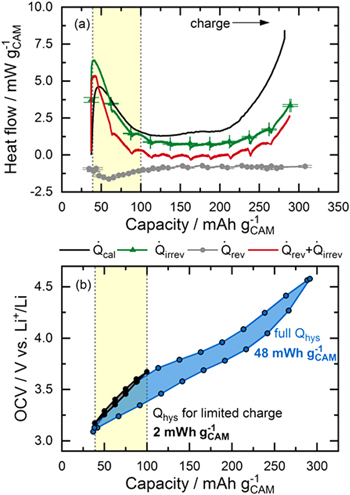
Figure 6. (a) Heat flow of an LMR-NCM/Li cell in charge at C/10 as a function of SOC. The heat flow measured by IMC (black) for cell 2 is compared to the calculated profiles of  based on the polarization induced overpotential (green, error bars from two measurements; the green line representing a linear interpolation of the OCV data points), and
  as determined from entropy measurements (gray, error bars from the calculation). The sum of
  and
and  is shown in red. (b) OCV curve at C/10 of a complete cycle (blue) and a cycle limited to a nominal capacity of 100 mAh gCAM
−1 during charge (black). The yellow shaded area highlights the SOC range in which no significant OCV hysteresis is expected (thus,
is shown in red. (b) OCV curve at C/10 of a complete cycle (blue) and a cycle limited to a nominal capacity of 100 mAh gCAM
−1 during charge (black). The yellow shaded area highlights the SOC range in which no significant OCV hysteresis is expected (thus,  ≈ 0).
≈ 0).
Download figure:
Standard image High-resolution image
Figure 7. (a) Heat flow of an NCA/Li cell in charge at C/10 as a function of SOC. The heat flow measured by IMC (black) for cell 1 is compared to the calculated profiles of  based on the polarization induced overpotential (green, error bars from two measurements), and
  as determined from entropy measurements (gray, error bars from the calculation). The sum of
  and
and  is shown in red. In panel (b) the same analysis is shown for the discharge process.
Download figure:
Standard image High-resolution imageTo compare the measured heat flow with the calculated values, two assumptions have to be made: (i) only the heat signal during current flow is analyzed, which means that heat dissipated after the current is removed is disregarded; (ii) the time delay of the IMC is assumed to be virtually negligible, so the heat flow profile measured as a function of time can be directly translated to the SOC. Since both the time resolution and the heat dissipation after switching off the current increase with increasing C-rates, this heat flow analysis is only reliable for low currents. For example, with a C-rate of 1C, a time delay of ≈18 min already corresponds to a deviation of ≈30% SOC, which substantially falsifies the translation of the time axis into an SOC axis, whereas for a C-rate of C/10, this time delay only represents a deviation of 3%. Furthermore, with a C-rate of C/10, the heat evolved after switching off the current at the end of charge is ≈12% of the total heat measured for the charge half-cycle of an LMR-NCM/Li cell (≈4% for NCA). In the discharge direction, ≈7% of the total heat is evolved at zero current for both cells. In contrast, for the cycle at 1C, these terms increase to ≈19% for the charge and ≈27% for the discharge in case of LMR-NCM/Li (≈11% and ≈22% for NCA), which would clearly not lead to a meaningful analysis. However, even with the slowest C-rate, it is important to bear in mind that measured heat flow profiles are never completely accurate.
Reversible heat contributions to the overall heat flow
As mentioned above, the reversible heat is included in the calorimetric signal but cannot be calculated from the voltage curve. As shown in Eq. 2,  is determined on the basis of the variation of OCV with temperature. These measurements were conducted with the same cathode active material but the OCV was measured against a Li reference electrode, which did not undergo any electrochemical cycling as the Li counter electrode used in this study. Details of the experiment and a discussion of the entropy profile of LMR-NCM are reported elsewhere,
14
but the results from the entropy measurements of the two cathode active materials are plotted in the appendix. For the present study, the most important aspect of our previous publication is that the reversible heat of LMR-NCM/Li cells cannot be calculated from the measured partial molar entropy data because of the path dependence of the entropy curve as a function of SOC. Its integration would include non-reversible pathways, as is generally the case for material that shows a hysteresis in the partial molar entropy vs SOC. This means that a theoretical
is determined on the basis of the variation of OCV with temperature. These measurements were conducted with the same cathode active material but the OCV was measured against a Li reference electrode, which did not undergo any electrochemical cycling as the Li counter electrode used in this study. Details of the experiment and a discussion of the entropy profile of LMR-NCM are reported elsewhere,
14
but the results from the entropy measurements of the two cathode active materials are plotted in the appendix. For the present study, the most important aspect of our previous publication is that the reversible heat of LMR-NCM/Li cells cannot be calculated from the measured partial molar entropy data because of the path dependence of the entropy curve as a function of SOC. Its integration would include non-reversible pathways, as is generally the case for material that shows a hysteresis in the partial molar entropy vs SOC. This means that a theoretical  curve calculated from the entropy data would include an unknown contribution of entropy production in the material. Hence, although mathematically possible, this would not produce a physically meaningful result for the reversible heat flow as a function of SOC. However, this means that we cannot determine what share of the theoretical
  curve corresponds to the heat term that is reversibly evolved as a function of SOC.
Yet, with the IMC data we can estimate what effect neglecting  has on the total heat evolution within a limited SOC range. For this purpose, Fig. 6 shows the IMC heat signal (
 black) together with the irreversible heat calculated from the difference between the voltage vs SOC curve on load and under OCV conditions (
 green) and the theoretical reversible heat, which was calculated from the entropy data as explained in Eq. 2, although we already know that this is physically not meaningful (gray). Nevertheless, we will use these calculated data sets in our approach and focus on the heat flow in the low SOC region (<100 mAh gCAM
−1) during charge. There are two reasons why this SOC region is of special interest: (i) the theoretically calculated reversible heat flow profile exhibits a peak at around ≈60 mAh gCAM
−1 meaning that in the low SOC region, the contribution of
green) and the theoretical reversible heat, which was calculated from the entropy data as explained in Eq. 2, although we already know that this is physically not meaningful (gray). Nevertheless, we will use these calculated data sets in our approach and focus on the heat flow in the low SOC region (<100 mAh gCAM
−1) during charge. There are two reasons why this SOC region is of special interest: (i) the theoretically calculated reversible heat flow profile exhibits a peak at around ≈60 mAh gCAM
−1 meaning that in the low SOC region, the contribution of  is expected to be most significant; (ii) from cycling experiments it is known that when LMR-NCM is only charged to ≈100 mAh gCAM
−1 and then discharged again, there is no significant OCV hysteresis (see black data points in Fig. 6b), which means that the heat measured by IMC is exclusively attributable to
is expected to be most significant; (ii) from cycling experiments it is known that when LMR-NCM is only charged to ≈100 mAh gCAM
−1 and then discharged again, there is no significant OCV hysteresis (see black data points in Fig. 6b), which means that the heat measured by IMC is exclusively attributable to  and
and  from which the first one can be easily determined. Figure 6b shows the OCV curve of a cell charged to 100 mAh gCAM
−1 together with an OCV curve that is obtained for a full charge/discharge. As is also known from window-opening experiments in the literature,
26
the OCV hysteresis of LMR-NCM is not pronounced if the charge window is not opened up to higher SOCs. Thus, Eq. 2 simplifies, since
from which the first one can be easily determined. Figure 6b shows the OCV curve of a cell charged to 100 mAh gCAM
−1 together with an OCV curve that is obtained for a full charge/discharge. As is also known from window-opening experiments in the literature,
26
the OCV hysteresis of LMR-NCM is not pronounced if the charge window is not opened up to higher SOCs. Thus, Eq. 2 simplifies, since  = 0. This means that any difference between the heat flow measured by IMC and the irreversible heat generation determined from the polarization induced overpotential has to be caused by
  However, as shown in Fig. 6a, the measured heat flow (black line) in the yellow shaded region, for which
  = 0, corresponds very closely with the irreversible heat generation (green line and symbols), indicating that the contribution from
  is not significant. The only deviation between the two heat signals is at the very beginning of charge, when the calculated irreversible heat exceeds the measured signal. This might be an artifact which comes from the fact that
  is determined by interpolating between the first and the second OCV points whereby the first OCV point is obtained differently from the subsequent OCV points, as outlined in the Experimental part. The interpretation of this apparent overshoot should be considered carefully. Another reason for the observed mismatch between
  and
and  at the beginning of charge might be the above-mentioned time lag of the IMC signal detection. Another possibility is that at the beginning of charge, the endothermic reversible heat indeed makes a contribution and hence partly compensates for the irreversible heat. However, when the heat flow calculated from the sum of the exothermic irreversible heat and the endothermic reversible heat (red curve in Fig. 6a) is compared to the measured data, no agreement is observed. This further underlines the conclusion drawn by Friedrich et al.
14
that the entropy measurements for LMR-NCM cannot be directly translated into a heat flow curve. The observation that the entropy does not significantly contribute to the measured heat flow profile in the low SOC range, where its values are maximum indicates that also for the rest of the cycle, its contribution can be neglected. Further IMC studies are required to quantify the reversible heat in this type of material. For the investigation conducted here, the reversible heat flow was neglected. Still, we want to emphasize that this simplification is a possible error source regarding the quantification of
at the beginning of charge might be the above-mentioned time lag of the IMC signal detection. Another possibility is that at the beginning of charge, the endothermic reversible heat indeed makes a contribution and hence partly compensates for the irreversible heat. However, when the heat flow calculated from the sum of the exothermic irreversible heat and the endothermic reversible heat (red curve in Fig. 6a) is compared to the measured data, no agreement is observed. This further underlines the conclusion drawn by Friedrich et al.
14
that the entropy measurements for LMR-NCM cannot be directly translated into a heat flow curve. The observation that the entropy does not significantly contribute to the measured heat flow profile in the low SOC range, where its values are maximum indicates that also for the rest of the cycle, its contribution can be neglected. Further IMC studies are required to quantify the reversible heat in this type of material. For the investigation conducted here, the reversible heat flow was neglected. Still, we want to emphasize that this simplification is a possible error source regarding the quantification of  What we report here as
  hence includes an unknown but comparably small contribution of the reversible heat.
The rather complicated discussion regarding the LMR-NCM material becomes simpler with a regular cathode active material, such as NCA, where no hysteresis is present and  can be directly calculated from the measurement of
  as explained in the Theory and Experimental sections. Since there is virtually no heat due to OCV hysteresis, Eq. 2 simplifies to
  As discussed above, neglecting the SOC dependence of
  results in a rough simplification of the energy balance for NCA. However, as can be seen in Fig. 7, this simplification is acceptable for a semi-quantitative analysis of heat flow as a function of SOC. In Fig. 7, the IMC signal (black) is shown together with the irreversible heat flow calculated from the intermittent cycling (green), the reversible heat calculated from entropy measurements (grey), and the sum
  (red). For the charge half-cycle in Fig. 7a, the irreversible heat is slightly higher than the measured heat at low SOC, while it is clearly smaller at a high SOC. By adding the reversible and irreversible heat, the calculated curve (red) moves closer to the measured one. However, there is still a gap, especially at a high SOC, between the measured signal and the calculated heat flow, which might be attributable to parasitic heat, or simply the inaccuracy of calculating and scaling such small heat flows. For the discharge direction, shown in Fig. 7b, the agreement of the calculated and measured heat flow is similar to that of the charge direction. However, it should be stressed that the absolute signal amplitude is nearly seven times higher, especially at the end of discharge, which makes a direct comparison of the two figure panels difficult.
Based on the data discussed, we conclude that the effect of reversible heat on total heat flow is a source of error, in particular for NCA/Li cells. While it is acceptable to assume a minor contribution of  for the LMR-NCM/Li cell due to the comparably very high contribution from the OCV hysteresis heat,
  has a more significant effect on the overall heat flow for the NCA/Li cell, in which the measurement uncertainties are of the same order of magnitude as
  Nevertheless, we want to stress that the exact contribution of
  was not quantified for either one of the two cells in this study, meaning that it is still contained in the additional heat term,
  which will be discussed in the following. Since the significance of
  was shown to be rather minor for LMR-NCM/Li cells, its contribution to
  is not considered to be falsifying the analysis.
Irreversible heat
So far, only the irreversible heat calculated from the potential drop during intermittent cycling has been shown. However, the resistances due to overpotential induced polarization can be further analyzed, using the impedances obtained by EIS analysis. Figures 8a and 8b show the heat flow profiles measured by IMC for the LMR-NCM/Li cell (black), together with those calculated from the impedance data based on Eq. 3 but using  instead of
  (orange). Figure 8 also includes the heat flow curves calculated from the individual components of
  , namely
  (blue) and
 (light green) as explained by Eq. 4 and the polarization induced overpotentials (i.e.,
  ) determined by the intermittent cycling protocol, using the first part of Eq. 3 (
 green triangles).

Figure 8. Heat flow during (a) charge and (b) discharge of the LMR-NCM/Li cell (number 2) at C/10 as a function of SOC. The heat flow measured by IMC (black) is compared to calculated heat flow profiles based on data from identical cells. Calculated heat flows are based on the voltage drop measured during intermittent cycling ( green triangles), and impedance measurements including the LFR (orange), the
  (blue) and the "ohmic" resistance
  (light green). Error bars are shown for two measurements. The line connecting the voltage drop points (green triangles) results from the subtraction of the OCV curve from the voltage curve on load for the respective half-cycle.
Download figure:
Standard image High-resolution imageIn a first comparison of the calorimetric data (black), a clear asymmetry between the charge and discharge heat flow profiles can be observed (see Figs. 8a and 8b). At the beginning of charge cycle, there is a peak in the heat evolution, with a maximum at ≈55 mAh gCAM −1, which levels off at around 100 mAh gCAM −1, after which a plateau is observed. At around 225 mAh gCAM −1, the heat flow increases again and reaches a maximum at the end of charge. For the charge half-cycle, the heat flow values over most of the charge are in a range of 1.3 mW gCAM −1 to 8 mW gCAM −1, while for the discharge, these values are much larger, varying between 3 mW gCAM −1 and 36 mW gCAM −1. Besides the absolute values, the profile shape between charge and discharge also differs. During discharge, the heat flow is constant in the high SOC region but starts to increase when discharging below ≈170 mAh gCAM −1. Following a steady increase in heat flow in this lower SOC region, a sharp increase is observed when discharging below ≈65 mAh gCAM −1.
Irreversible heat flow can be calculated with Eq. 3 based on the voltage drop occurring when the current is switched off during an intermittent cycling, as indicated by the green triangles in Fig. 8. In addition, the OCV curve of a charge/discharge half-cycle (linear interpolation between OCV points) can be subtracted from the respective voltage curve on load (green curve, which is identical with that shown in Fig. 6a), which in principle should give the same results as the data based on the potential drop after one hour of OCV. As a matter of fact, both data sets agree except for the first point during charge, at which the calculation of the voltage drop is based on the instantaneous voltage jump upon connecting the current, as described in the Experimental section. Thus, for the first 10% SOC range, the subtraction line is a better measure for the irreversible heat.
Since the generation of irreversible heat is based on the resistances within a battery cell, impedance spectroscopy is a complementary tool that can be used to further distinguish the underlying resistive phenomena that cause irreversible heat flow. The applied equivalent circuit model includes the charge transfer resistance of the cathode ( shown in blue in Fig. 8), the low-frequency resistance (LFR, orange) and a so-called
  (light green), which includes contributions from the high frequency resistance, cathode contact resistance, and anode impedance, as discussed in the Theory and Experimental sections. An example impedance spectrum is shown in Fig. 1. These resistances were translated into a heat flow with Eq. 3. As can be seen in Fig. 8, the profile of the total irreversible heat flow
  as determined from the voltage drop agrees with the shape of that calculated from impedance data,
  Both exhibit a U-shape as a function of SOC during charge, which is typical for this type of material.
12
Furthermore, the impedance measurements prove that the dominating contribution to the irreversible heat flow is the charge-transfer resistance,
Both exhibit a U-shape as a function of SOC during charge, which is typical for this type of material.
12
Furthermore, the impedance measurements prove that the dominating contribution to the irreversible heat flow is the charge-transfer resistance,  while all other resistances, summarized as
  make only minor contributions. The offset between the irreversible heat calculated from the voltage drop (
 ) and the heat obtained from the impedance data (
 ) is due to diffusion limitations, which are not captured in the impedance experiment with a lower frequency limit of 0.1 Hz but are included in the voltage drop. These limitations include liquid and solid diffusion, which seem to be rather constant in the middle of the SOC window, with increasing values at low and high SOCs. The overall diffusion resistance can be estimated from the difference of the two heat profiles by translating the respective heat flow into an apparent resistance based on Eq. 3. In the constant region, it is around ≈60 Ω cm2 while at high SOC during charge, it increases to ≈140 Ω cm2 and at low SOC during discharge up to ≈215 Ω cm2, with an extremely high value at the end of discharge in the kΩ-range.
We performed a similar analysis for the NCA/Li cells, shown in Figs. 9a and 9b. The heat flow measured by IMC ( black) displays some interesting differences to that of the LMR-NCM/Li cells. Most strikingly, the overall measured heat flow (black curve) is significantly lower. The curve of the IMC signal during charge has its maximum of ≈1.2 mW gCAM
−1 at the beginning of charge, after which the heat flow levels off until ≈75 mAh gCAM
−1 and gradually increases again until the end of the half-cycle. Overall, the heat flow curve during charge of the NCA/Li cell is rather flat compared to that of the LMR-NCM/Li cell. The IMC signal of the NCA/Li cell during discharge, shown in Fig. 9b, has a similarly flat shape as during charge, and its absolute values are of the same order of magnitude until the cell is discharged below ≈50 mAh gCAM
−1, at which point the heat signal displays a steep increase up to ≈7 mW gCAM
−1. The deviation between the irreversible heat flow (
black) displays some interesting differences to that of the LMR-NCM/Li cells. Most strikingly, the overall measured heat flow (black curve) is significantly lower. The curve of the IMC signal during charge has its maximum of ≈1.2 mW gCAM
−1 at the beginning of charge, after which the heat flow levels off until ≈75 mAh gCAM
−1 and gradually increases again until the end of the half-cycle. Overall, the heat flow curve during charge of the NCA/Li cell is rather flat compared to that of the LMR-NCM/Li cell. The IMC signal of the NCA/Li cell during discharge, shown in Fig. 9b, has a similarly flat shape as during charge, and its absolute values are of the same order of magnitude until the cell is discharged below ≈50 mAh gCAM
−1, at which point the heat signal displays a steep increase up to ≈7 mW gCAM
−1. The deviation between the irreversible heat flow ( green curve) and the measured signal (black curve), which is especially prominent at the end of the charge process, was discussed above and arises from a combination of reversible heat and measurement inaccuracy. The diffusion limitations causing the difference between
  (green) and
  (orange) cover ≈50% of the irreversible heat flow. They translate into diffusion resistances similar to those found for the LMR-NCM/Li cells of around 50 Ω cm2 in the mid-SOC region with increasing values at the end of charge (120 Ω cm2) and discharge (>200 Ω cm2). The cathode related resistance (
 ) dominates the impedance response in the lower SOC region, with values of up to 250 Ω cm2. In contrast to the impedance spectra of the LMR-NCM/Li cells (see Fig. 1), the two semi-circles of the NCA spectra, from which
  and
and  were determined, are merged together in the middle SOC range (40 mAh gCAM
−1 < SOC < 200 mAh gCAM
−1). This means that the two resistances could not be deconvoluted using the transmission line model. This is why, in this SOC region, only the LFR was determined from the impedance spectra of NCA. Another difference to the impedance response of LMR-NCM is that, at the end of charge,
were determined, are merged together in the middle SOC range (40 mAh gCAM
−1 < SOC < 200 mAh gCAM
−1). This means that the two resistances could not be deconvoluted using the transmission line model. This is why, in this SOC region, only the LFR was determined from the impedance spectra of NCA. Another difference to the impedance response of LMR-NCM is that, at the end of charge,  of NCA does not increase significantly, due to the simple fact that the cut-off potential for the NCA cells is lower and a larger amount of cyclable lithium is still available in the material at the end of the charge process.

Figure 9. Heat flow during (a) charge and (b) discharge of NCA/Li cells at C/10 as a function of SOC. The heat flow measured by IMC (black) for cell 1 is compared to calculated profiles based on data from identical cells. Calculated heat flows are based on the voltage drop ( green), and data calculated from impedance measurements including the LFR (orange), the
  (blue) and the "ohmic" resistance
  (light green). Error bars are shown for two measurements. The line connecting the voltage drop points (green triangles) results from the subtraction of the OCV curve from the voltage curve on load for the respective half-cycle.
Download figure:
Standard image High-resolution imageAs outlined in Eq. 2, another heat generation term exists for materials with an OCV hysteresis, such as LMR-NCM, which is  i.e., the heat due to OCV hysteresis. This will be discussed in more detail in the following.
Deconvolution of energy losses
Valuable information on the allocation of heat due to OCV hysteresis ( ) to a charge and discharge half-cycle can be gained by comparing the heat measured by IMC with the electrical energy loss terms. In Fig. 10, this analysis is conducted for the lowest C-rate of C/10 with the integrated calorimetric heat signal shown in the left-hand column (charge and discharge heat stacked) and the electrical energy losses in the right-hand column for both the LMR-NCM/Li and the NCA/Li cell. The analysis is based on the combination of electrochemical and calorimetric data visualized in Fig. 2. Thereby, the IMC signal is integrated over the charge or discharge half-cycle including the first 1.5 h of the consecutive relaxation phase at zero current as described above. In contrast to the heat flow data (
 in mW/gCAM) shown in Figs. 6 to 9, the integration over time leads to the amount of evolved heat
  (in mWh/gCAM). For example, from IMC, the evolved heat during charge (
 ) is accessible, which is a sum of the following terms:

Solving for  , this yields:

 is calculated from the electrochemical measurements by integrating over the voltage curve as shown in Fig. 4 and Table I. To obtain values for
  one has to assume that the contribution of
  is negligible since the moment
  becomes comparable to any of the other heat terms, independent values for
  cannot be obtained by this approach anymore. For the analysis shown in Fig. 10, we therefore deliberately use the term
  instead of
  to make the difference between both values more clear. The effect on the accuracy of the results will be discussed below. For the discharge, an equivalent derivation can be made.

Figure 10. Allocation of different sources of heat according to the results from intermittent cycling to the heat measured by IMC for the lowest C-rate of C/10 for the LMR-NCM/Li cell (number 2) and for the NCA/Li cell (number 1). For each cell, the left-hand column contains the stacked IMC heat data from the charge (red) and discharge (green) half-cycle. The expected electrical energy loss determined from intermittent cycling is shown for each cell by the right-hand column. Thereby, the relative shares for the polarization induced overpotential in charge (orange) and discharge (light green) are shown (see Table I) together with the residual energy loss ( , blue). In case of LMR-NCM/Li, this corresponds to the OCV hysteresis. The orange line and relative numbers indicate its share in charge and discharge.
Download figure:
Standard image High-resolution imageThe results from the IMC measurements ( and
and  ) are shown by the left-hand column for both the LMR-NCM/Li and the NCA/Li cell. The right-hand column for each cell marks the expected total electrical energy loss. To allocate the different sources of heat, determined by intermittent cycling, to the heat measured by IMC, the relative shares, as shown in Table I, were applied to the calorimeter signal. Note that by this definition, the height of the right-hand column agrees with that of the left-hand column since it simply illustrates the relative distribution of heat sources. For example, it is known from the intermittent cycling at C/10 that 18% of the total energy loss is attributable to
  and 27% to
  Hence, the remaining heat, which is measured by IMC (
 in Fig. 10), can be allocated to the OCV hysteresis and can furthermore be separated into its shares during the charge and discharge half-cycles, respectively. This is illustrated by the orange line in Fig. 10 and the percentage values in the blue section.
The left part of Fig. 10 shows the allocation of the different sources of heat to the IMC signal for the LMR-NCM/Li cell, indicating that the heat measured by IMC during charge (red column) is only about half of that measured during discharge (green column). As can be seen in the right-hand column for the LMR-NCM/Li cell in Fig. 10, the polarization induced overpotential losses during discharge ( , light green) are larger than during charge (
 orange), which means that more irreversible heat is evolved during discharge. The heat caused by these overpotential losses is directly attributable to the respective charge and discharge IMC heat signal. The additional heat, which is observed by IMC for each half-cycle (
 ), is assigned to the OCV hysteresis. It can be seen that the ratio between discharge and charge is around 70:30, meaning that most of the heat due to OCV hysteresis is evolved in the discharge process. Together with the higher irreversible heat evolved during discharge, this leads to a considerable asymmetric heat evolution between the two half-cycles.
As mentioned above, this analysis is somewhat compromised by the reversible heat due to entropic changes, which is assumed to be negligible for the construction of  in Fig. 10. It needs to be noted, however, that any contribution of the reversible heat is recorded by the calorimeter but cannot be observed in the voltage vs SOC curve. Hence, this heat term contributes to the overall heat observed by IMC (left-hand columns in 10) but is not considered for the construction of the right-hand ones. As explained in the Theory section, reversible heat has opposite signs on charge and discharge and is therefore, by definition, equal to zero for a whole cycle. This means that both the total heat measured by IMC and the electrical energy loss have no net contribution from
  However,
  influences the respective half-cycles by adding another exothermic heat source to one direction (discharge in the case of the LMR-NCM)
14
and an endothermic source to the other one (charge for the LMR-NCM).
14
The reversible heat can be determined from entropy measurement. However, in the case of LMR-NCM, these experiments revealed that the entropy is path-dependent between charge and discharge, which suggests that the integration of
influences the respective half-cycles by adding another exothermic heat source to one direction (discharge in the case of the LMR-NCM)
14
and an endothermic source to the other one (charge for the LMR-NCM).
14
The reversible heat can be determined from entropy measurement. However, in the case of LMR-NCM, these experiments revealed that the entropy is path-dependent between charge and discharge, which suggests that the integration of  would include non-reversible pathways, and hence would not give a meaningful value for
  14
Rather, we assume that the entropy curve indicates that entropy production is being observed.
14
For a detailed discussion on the entropy and reversible heat in LMR-NCM and the implications of non-reversible pathways, the interested reader is referred to our previous work (in particular the discussion of Eq. 17 in Friedrich et al.
14
). However, the effect of the reversible heat can be analyzed when the heat flow is considered instead of the total integrated heat. As is shown in Fig. 6, the reversible heat can be assumed to be negligible in the case of the LMR-NCM/Li cell investigated here, so that the analysis shown in Fig. 10 should be reasonably accurate.
14
Rather, we assume that the entropy curve indicates that entropy production is being observed.
14
For a detailed discussion on the entropy and reversible heat in LMR-NCM and the implications of non-reversible pathways, the interested reader is referred to our previous work (in particular the discussion of Eq. 17 in Friedrich et al.
14
). However, the effect of the reversible heat can be analyzed when the heat flow is considered instead of the total integrated heat. As is shown in Fig. 6, the reversible heat can be assumed to be negligible in the case of the LMR-NCM/Li cell investigated here, so that the analysis shown in Fig. 10 should be reasonably accurate.
Figure 10 also shows the IMC results of the NCA/Li cell, comparing them with the energy loss data expected from the intermittent cycling (Table I and Fig. 5) in the same way as for the LMR-NCM/Li cell. The generated heat of the NCA/Li cell is clearly less than for the LMR-NCM/Li cell. For the results from calorimetry, a symmetrical heat release between charge and discharge is observed. The electrochemical data, however, suggest that the irreversible heat in charge direction should be slightly smaller than the heat determined by calorimetry, while for the discharge direction it should be slightly larger. The mismatch between the heat measured by IMC and the calculated heat in charge and discharge is most likely attributable to the simplifications made with the calculation of the different heat terms. As mentioned above, the irreversible capacity loss results in a relatively large error when calculating the total electrical energy loss in the case of NCA, because of the rather small absolute heat flow signal. When the relative shares of the energy terms calculated from the intermittent cycling are then applied to deconvolute the different contributions to the IMC signal, this additional heat term is evenly distributed between 
 and
and  However, it seems that by doing so,
  is overestimated while
  is underestimated. For materials with small absolute heat signals, such as NCA, neglect of this energy loss term is not justified when aiming at a quantitative analysis. We therefore recommend determining this heat term separately so as to be able to allocate it to the charge or discharge direction or analyze the heat flow signal as a function of SOC.
Heat evolution due to OCV hysteresis of LMR-NCM
Figure 8 shows the various sources of irreversible heat, while Fig. 6 elucidates the rather minor contribution of reversible heat for LMR-NCM. The lost electrical energy, which can be calculated by integrating the OCV curve, as shown in Fig. 4a and Table I, is an additional source of heat for cells with LMR-NCM compared to normal cathodes like NCA. In Fig. 10, we discussed what share of this heat is evolved in each charge and discharge half-cycle at C/10 of LMR-NCM/Li cells. Besides absolute numbers, another interesting question, which we posed at the beginning of the paper, is how  is evolved as a function of the SOC. To answer it, we will compare the heat evolution measured by IMC with the total irreversible heat flow determined from the intermittent cycling protocol, as shown in Figs. 11a and 11b. The data are the same as in Fig. 8, but focus only on the two sources of heat that are essential for determining
  i.e., ignoring the minor contribution from reversible heat. The difference between the measured heat flow (
 black curve) and the expected irreversible heat flow (
 green curve) is a measure of the evolution of
  (blue shaded area). The difference curve,
  is shown in Figs. 11c and 11d for the charge and discharge half-cycle, respectively.
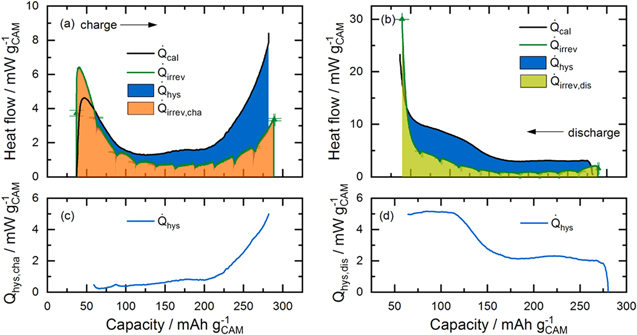
Figure 11. Heat flow during (a) charge and (b) discharge of the LMR-NCM/Li cell (cell number 2) at C/10 as a function of SOC. The heat flow measured by IMC (black) is compared to the irreversible heat generation calculated from the difference between the voltage at load and the OCV curve obtained by the intermittent cycling protocol (green line, error bars from two measurements). The shaded areas correspond to the irreversible heat in charge (orange) and discharge (green) and the heat due to OCV hysteresis (blue). The heat flow of  in (c) charge and (d) discharge is calculated by
  (only exothermic signal is shown).
Download figure:
Standard image High-resolution imageAs can be seen from the difference plot in Fig. 11c for the charge half-cycle, the heat flow due to the OCV hysteresis is small up to an SOC of ≈200 mAh gCAM
−1, after which it increases steadily. At the beginning of charge, however, the irreversible heat flow is greater than the measured signal. This apparent overshoot in the green curve is most likely due to the way how  is constructed by linear interpolation between the OCV points as mentioned above. This is supported by the observation that the two first data points (green triangles; direct result of taking the difference between
  and at this SOC) agree rather well with the IMC heat flow curve (black line). Other sources of errors include the time delay of the measurement setup and the inaccuracy in the determination of
  Since this deviation is considered to be an artifact from the calculation, no endothermic
  signal is shown in Fig. 11c. A more detailed analysis of this lower SOC range, for instance with a smaller ΔSOC spacing in the intermittent cycling, could shed further light on the thermal effects at the beginning of charge. During discharge,
  is evolved over the whole SOC window with a constant value of ≈2 mW gCAM
−1 during the initial discharge and an increasing heat flow when the cell is discharged below ≈170 mAh gCAM
−1; this forms a plateau at ≈5 mW gCAM
−1 towards the end of discharge, where the irreversible heat strongly dominates the total heat flow. A comparison with the total heat flow of NCA serves to classify the magnitude of the evolution of
is evolved over the whole SOC window with a constant value of ≈2 mW gCAM
−1 during the initial discharge and an increasing heat flow when the cell is discharged below ≈170 mAh gCAM
−1; this forms a plateau at ≈5 mW gCAM
−1 towards the end of discharge, where the irreversible heat strongly dominates the total heat flow. A comparison with the total heat flow of NCA serves to classify the magnitude of the evolution of  While for the NCA/Li cells the total measured IMC signal is between 0.5 mW gCAM
−1 and 2 mW gCAM
−1 for most of the SOC range, the heat evolution only due to the OCV hysteresis for the LMR-NCM/Li cells is between 0.5–5 mW gCAM
−1 in charge and between 2–5 mW gCAM
−1 in discharge. Hence, for LMR-NCM/Li cells, the material-specific
While for the NCA/Li cells the total measured IMC signal is between 0.5 mW gCAM
−1 and 2 mW gCAM
−1 for most of the SOC range, the heat evolution only due to the OCV hysteresis for the LMR-NCM/Li cells is between 0.5–5 mW gCAM
−1 in charge and between 2–5 mW gCAM
−1 in discharge. Hence, for LMR-NCM/Li cells, the material-specific  is of the same order of magnitude (or even greater) as the total heat flow of the reference material NCA.
The profile of the total heat evolution of LMR-NCM in charge is dominated by the shape of the irreversible heat flow (up to ≈100 mAh gCAM
−1), while in the discharge direction,  makes a significant contribution to the heat flow profile, especially in the SOC range between ≈250 mAh gCAM
−1 and ≈65 mAh gCAM
−1. The SOC ranges at which
makes a significant contribution to the heat flow profile, especially in the SOC range between ≈250 mAh gCAM
−1 and ≈65 mAh gCAM
−1. The SOC ranges at which  is mainly evolved in charge and discharge (see Figs. 11c and 11d) suggest that the underlying phenomena for OCV hysteresis in LMR-NCM occur particularly at high SOC during charge (>200 mAh gCAM
−1) and at low SOC during discharge (<170 mAh gCAM
−1). From window-opening experiments, it is known that the hysteresis of the OCV curve,
26,27
the lattice parameters,
13
and the entropy profile
14
grow gradually, becoming more and more pronounced as the charge or discharge window are continuously opened. The evolution of
is mainly evolved in charge and discharge (see Figs. 11c and 11d) suggest that the underlying phenomena for OCV hysteresis in LMR-NCM occur particularly at high SOC during charge (>200 mAh gCAM
−1) and at low SOC during discharge (<170 mAh gCAM
−1). From window-opening experiments, it is known that the hysteresis of the OCV curve,
26,27
the lattice parameters,
13
and the entropy profile
14
grow gradually, becoming more and more pronounced as the charge or discharge window are continuously opened. The evolution of  reflects the behavior of these other properties and hence indicates that the underlying processes leading to the reported hysteresis phenomena cause waste heat, which is observed at high SOC in charge and at low SOC during discharge. However, as discussed above, the accuracy of this analysis method is limited due to the time-delay of the calorimeter, and we can therefore only report a trend in
  evolution as a function of SOC. In an extreme case, a pronounced time lag would lead to a relative shift on the SOC axis, meaning that the SOC for the
  evolution in charge is generally overestimated, while in discharge it is underestimated. For the data shown in Fig. 11, this potential error is rather small, as outlined above (i.e., the time lag ≈18 min until 99% of the heat signal is detected corresponds to a ΔSOC of ≈3%). However, as mentioned above, there is still some heat flow present after removing the current, and there is also an excess of irreversible heat at the beginning of charge. This means that not all heat is detected at the moment of its production. The heat evolution towards the end of each half-cycle might therefore include some share of the heat produced at lower SOC, leading to an overestimation of the heat flow at high SOC. As mentioned above for Figs. 6 and 8, the heat signal after disconnecting the current was also neglected in the analysis shown in Fig. 11. Moreover, the heat flow observed by IMC might contain contributions from parasitic heat sources, such as electrolyte decomposition, leading to an overestimation of
  Probably the most significant source of error is the unknown but evidentially minor contribution of
  to the herein determined
  which might lead to an overestimation of
  in case of a exothermic
  (and an underestimated for an endothermic
  ). In conclusion, we wish to emphasize that what is reported here is a semi-quantitative trend in the evolution of
  in charge and discharge and that further measurements are required for a more accurate quantitative analysis.
Conclusions
We conducted a comparative study comprising an investigation of the heat release of LMR-NCM/Li and NCA/Li coin cells at different C-rates using isothermal micro-calorimetry. Impedance spectroscopy and an intermittent cycling protocol were applied as complementary methods to analyze the various heat sources. The focus of this study is on the LMR-NCM cathode active material (CAM), which has a unique OCV hysteresis. The electrochemical and calorimetric data sets were analyzed employing two different approaches: (i) integrating the heat flow for an individual half-cycle to get the total generated heat for the respective charge or discharge direction (in mWh gCAM -1), and (ii) converting the heat flow over time to a heat flow as a function of SOC (in mW gCAM -1). Using the first approach, we observed that the total heat generation for LMR-NCM is much higher than for NCA (decreasing from a factor of 9 to 3 for increasing the C-rate from C/10 to 1C), leading to a lower energy round-trip efficiency. For both CAMs, the overall released heat shows a linear correlation with the applied C-rate. However, while the heat release extrapolated to a zero C-rate is rather small for the NCA/Li cells, it is significantly higher for the LMR-NCM/Li cells due to the quasi-static OCV hysteresis being a material-specific property present even under zero current conditions.
The OCV hysteresis was further analyzed by intermittent cycling, in which a 1 h rest phase was applied after each 10% SOC step to collect OCV points during charging and discharging at different C-rates. These electrochemical measurements indicate that the OCV hysteresis of the LMR-NCM material is responsible for up to 55% of the total electrical energy loss of LMR-NCM/Li cells at C/10. The irreversible heat generated during charge and discharge was also calculated by this method. The share of the heat generation due to OCV hysteresis was attributed to either the charge or discharge direction on the basis of the calculated heat terms and the heat measured by IMC for the individual half-cycles assuming that the reversible heat due to entropy is negligible. We found that most of the heat due to OCV hysteresis in the LMR-NCM/Li cells is dissipated during discharge (72% for C/10).
Using approach (ii) above, we compared the measured heat flow signal with the profile calculated from electrochemical data. For the NCA/Li cells, the sum of the irreversible heat determined by intermittent cycling and the reversible heat calculated from entropy measurements corresponded well with the heat flow measured by IMC. The heat flow is clearly dominated by irreversible heat while the reversible heat serves more as a small correction for the calculated curve. However, the very small absolute level of the heat flow signal for the NCA material means that the limit of the applied approach's accuracy is reached, especially with regard to the combination of the measurement results from different cells and methods with an irreversible capacity leading to a source of error, which is in the order of the measured data. In contrast, due to the higher absolute signal for LMR-NCM/Li cells (≈4 times), the analysis is more accurate in this case. Using impedance spectroscopy, the irreversible heat determined from intermittent cycling was further differentiated into the underlying resistive phenomena, which lead to the observed potential drop. We found that for both cathode active materials, the charge transfer resistance of the cathode dominates the irreversible heat flow curve. For LMR-NCM, the  shows a characteristic U-shape as a function of SOC and further contributions from diffusional limitations are rather small. For the NCA/Li cells, the diffusion resistances are very similar, while the charge transfer resistance is generally much smaller and covers only ≈50% of the overpotential losses. The contribution of the Li anode is included in the fitting parameters but makes only a minor contribution to the low frequency resistance at very low and high SOC.
With LMR-NCM/Li cells, the analysis of the heat flow profiles provides detailed information about the OCV hysteresis. The heat evolution due to OCV hysteresis is determined as a function of SOC by subtracting the calculated irreversible heat flow from the measured heat signal. During charge,  is mainly evolved at a high SOC (>200 mAh gCAM
−1), while during discharge, it is released over the whole SOC range at a constant evolution rate until 170 mAh gCAM
−1 and an increasing rate below that. The heat evolved due to OCV hysteresis in LMR-NCM is of the same order of magnitude as the total heat release of the reference material NCA, which underlines the importance of the analysis of this heat source.
is mainly evolved at a high SOC (>200 mAh gCAM
−1), while during discharge, it is released over the whole SOC range at a constant evolution rate until 170 mAh gCAM
−1 and an increasing rate below that. The heat evolved due to OCV hysteresis in LMR-NCM is of the same order of magnitude as the total heat release of the reference material NCA, which underlines the importance of the analysis of this heat source.
To revisit the questions raised at the beginning of this paper, we found that (i) the energy loss due to OCV hysteresis is fully dissipated as heat and (ii) the majority is evolved during discharge. The fact that (iii) the heat due to OCV hysteresis is mainly generated at high SOC during charge and at low SOC during discharge indicates that (iv) the underlying processes leading to the hysteresis phenomena in LMR-NCM occur in these SOC ranges, which agrees with observations from literature reports on parameters, such as the LMR-NCM lattice parameters.
Acknowledgments
We want to acknowledge BASF SE for the support within its Scientific Network on Electrochemistry and Batteries and the German Federal Ministry of Education and Research (BMBF) for its financial support within the ExZellTUM II project (grant no. 03XP0081). We gratefully thank See Tow Wei Hao for his contribution to the entropy measurements of NCA and Viola Knödler for her support with the NCA/Li cell building.
Appendix
As shown in Eq. 2, reversible heat is calculated as a product of the current, temperature and temperature-dependent OCV value,  The latter was determined for both LMR-NCM/Li and NCA/Li cells as described in the Experimental section. A detailed discussion of the method and the results for LMR-NCM/Li cells is reported elsewhere.
14
The obtained
The latter was determined for both LMR-NCM/Li and NCA/Li cells as described in the Experimental section. A detailed discussion of the method and the results for LMR-NCM/Li cells is reported elsewhere.
14
The obtained  values are shown in Figure A·1.
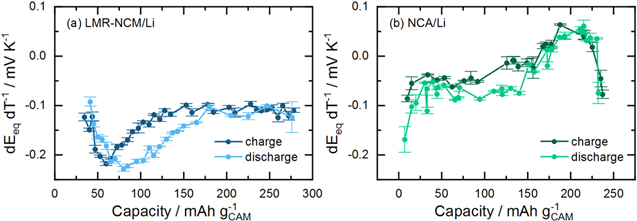
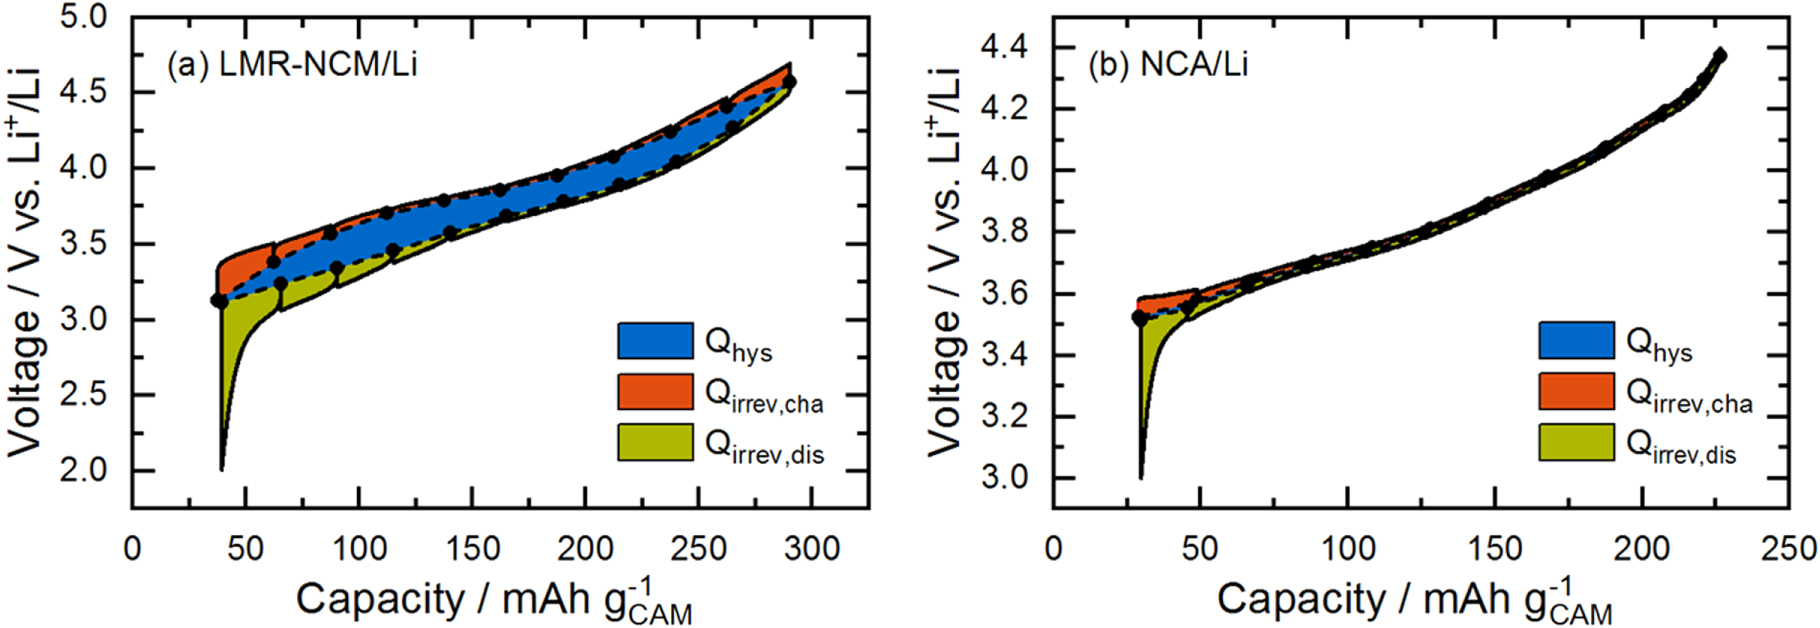
Figure A·1. Temperature-dependent OCV value,  for (a) LMR-NCM/Li and (b) NCA/Li cells during charge and discharge as a function of specific capacity. The variation of the OCV with temperature was measured as described above and discussed by Friedrich et al.
14
for (a) LMR-NCM/Li and (b) NCA/Li cells during charge and discharge as a function of specific capacity. The variation of the OCV with temperature was measured as described above and discussed by Friedrich et al.
14
Download figure:
Standard image High-resolution image