
Abstract
A transimpedance amplifier circuit as well as an instrumental amplifier circuit were used to measure current densities of a zinc-air battery with an integrated segmented current collector foil. Error calculation showed that the transimpedance amplifier is superior to the used instrumental amplifier, but both methods provide valuable and consistent results. They both showed comparable results with operando insight into the current distribution of the battery. The knowledge about those distributions is essential to avoid fast degradation of battery materials and irreversible capacity loss due to heterogeneous dissolution of the anode during discharge. In this work we showed that oxygen starvation as well as gas flow rate leads to large current gradients. It was also demonstrated that heterogeneous current distributions on cathode side induces also a heterogenous dissolution behavior on the anode, resulting in irreversible capacity loss.
Export citation and abstract BibTeX RIS

This is an open access article distributed under the terms of the Creative Commons Attribution 4.0 License (CC BY, http://creativecommons.org/licenses/by/4.0/), which permits unrestricted reuse of the work in any medium, provided the original work is properly cited.
The transition from fossil fuel resources to technologies based on renewable energy is hampered by the lack of cost-effective grid-connected storage solutions. Still, an internalization of the external cost associated to the environmental impact of fossil fuel use is not foreseen. While renewable electricity is nowadays cost competitive to fossil energy production in many parts of the world and slowly displacing conventional generation, the attention is continuously shifting towards energy storage solutions. For short-term storage (<1 h for grid service) lithium-ion batteries are currently the technology of choice as they exhibit a good compromise between energy density and cost which has been dropping significantly over the last decades due to advances in cell and production technology as well as economy of scale. However, concerns in terms of safety, resource availability and sustainability have led to efforts to find alternatives. One particularly promising alternative is the zinc-air battery owing to its high theoretical energy density of 1353 Wh·kg−1 (excluding oxygen) from which a practical energy density of 300 Wh·kg−1 is suggested to be realistic for primary button cells, 1 low cost below 100 $ kW·h−1 due to the use of low cost and abundant materials and inherent safety. 2 Although they are a mature technology already commercialized as primary batteries further development is needed to enable rechargeable Zn-air technology. 3 Great efforts and improvements are made on the catalyst development increasing cycle life and lowering over potentials. 4–7 Cycle life is also limited by precipitation of carbonates inside the cathodes porous system. 6,8 To minimize carbonate formation near neutral electrolytes 9–11 and ionic liquids are investigated lately. 8,12,13
The critical component of the Zn-air battery is the gas diffusion electrode where oxygen reduction (ORR) and evolution (OER) proceeds during discharge and charge, respectively. During ORR, the co-existence of gaseous and liquid phase inside the electrode is essential to provide effective transport of the gaseous O2 to the active sites wetted by the liquid electrolyte. Reaching and maintaining an optimal balance of wetting degree inside the electrode is therefore crucial but challenged by several factors during operation of the battery:
First the wetting changes during charge and discharge. Due to the volume increase of the zinc anode during discharge by a factor of 1.6 due to the conversion of zinc to zinc oxide, electrolyte might be pressed inside the porous system of the cathode, leading to a decreased active surface area between gas and liquid phase because of gradual flooding of the electrode structure. Importantly, during charging (OER) of the cell oxygen bubbles are evolved which isolates active areas in the cathodes porous system until the bubble are released. 14 Beside the effects of interaction between the electrodes and the gas evolution during OER the operation conditions especially the ambient humidity of the feed gas may change the water saturation level of the porous system of the cathode. If the ambient humidity is greater than the equilibrium relative humidity inside the Zn-air battery, water will be absorbed and might flood the porous system of the cathode. On the other hand, if ambient humidity is lower than the equilibrium humidity, the battery cell might dry out. 15
The wetting is further subject to local variations owing to the cell architecture. By using a vertical cell design, the hydrostatic pressure is higher at the bottom of the cell and less at the top, which alters the electrolyte pressure onto the porous system of the cathode, resulting in inhomogeneous penetration depths along the electrode height. The anode suffers from these gravimetrical effects as well as due to a complex reorganization of material to the cell bottom during stripping and plating of the zinc.
The effects on the GDE can be avoided by specially designed cathodes with a gradient in pore size structure and/or in the hydrophobic agent distribution to accommodate for pressure differences.
Finally, unlike the fuel cell design, where current is transported through bipolar plates, Zn-air cells often use the cathode itself for current transport, which results in inhomogeneous current distributions over the electrode length due to ohmic losses. 16
All of these effects lead to changes in the current distribution and inhomogeneous stress along the electrode geometry, which might affect electrochemical performance and accelerate the observed degradation mechanisms. A more elaborate understanding of these mechanisms phenomena and a visualization can help in optimizing components and cell design to identify where the components have to be improved.
A particularly powerful method to obtain information on inhomogeneities in operation and to elucidate local degradation is the use of the so-called segmented cell technique which is based on the use of segmented current collectors and printed circuit board technology. In contrary to post-mortem analysis of the electrode, this technique allows locally-resolved electrochemical measurements and can be performed during cell operation. This information is only accessible through simulation so far. 17 This method was first introduced for the application in fuel cell systems and since then extended for investigation of proton exchange membrane (PEM) and alkaline electrolysers as well as redox-flow batteries. For example, Sanchez et al. investigated the influence of temperature and humidification onto the performance of polymer electrolyte membrane fuel cells (PEMFCs) 18–21 and showed the feasibility of such investigations with the segmented cell technology. Segmented cells were also used to investigate Vanadium Redox Flow batteries to measure current distribution on electrode level and Li-Ion batteries on stack level. 19,22–27
Numerous possible solutions to measure current distributions are reported in literature: the measuring of current distribution can be realized by several approaches such as measuring the voltage drop over a defined resistor or by using hall sensors. Both approaches are costly, prone to measurement errors and need a lot of time setting up the measurement. 28,29 Using printed circuit boards (PCB) shows less measurement errors and is very flexible in design but additional space is required due to the thick board inside the cell as well as on the equipment side where a multiplexer and digital multimeter are needed. 22,23,30
In our work we use an approach with a segmented current collector printed onto a PEEK foil in which the gold segments are individually contacted to the external circuit. Additionally, the foil is very flexible and easy to process and the design can be easily adjusted to the specific needs. In principle, a dedicated and reduced segmentation can be implemented to monitor the behavior during operation, e.g. at positions which have been shown to degrade fastest. A more detailed explanation on the technique is given in sections cell assembly and segmented cell technique. Direct temperature measurements are not implemented so far, which is commonly used when using the PCB approach. Only indirect measurement via electrochemical impedance spectroscopy (EIS) can be performed with our setup.
By combining locally resolved impedance measurements and current distributions, the cause for local changes in the current density and the underlying degradation phenomena can be identified, further enhancing the possibilities and benefit of the segmented cell technology even further. 31,32
The focus of this work is the validation of the new setup on Zn-Air battery cathodes and to establish the method for evaluation of metal-air batteries in general. The investigation as exemplary study demonstrating its feasibility. The influence of gas flow variations on how gas flow variation influences the uniformity of current density on such electrodes is investigated. In addition, it is shown how heterogeneous current distributions on the cathode side leads to equivalent non-uniform dissolution of the anode.
Materials and Methods
Electrode preparation
Silver (Ag) electrodes consisting of 90 wt.% Ag (Ferro AG, type 311) and 10 wt.% PTFE (TF9207Z, 3 M Dyneon) were produced. For this purpose, the powders were physically mixed in a knife-mill, filled into a mossy frame and pressed at 300 kN m−2 for 1 min in a hydraulic press together with a metal mesh (0.125 mm, Haver & Boecker). After removal of the frame the electrode was pressed again using the same parameters. To achieve a mechanical stable electrode, it was heat treated in an oven for 1 h at 340 °C as described by Wittmaier et al. 33 A punching tool with a diameter of 12 mm was used to obtain the electrodes for cell assembly. Ag was used as catalyst due to its high activity and thus, to avoid effects ascribed to inhomogeneous electrode performance.
Gas diffusion layer preparation
80 wt.% Timcal Timrex T150 with 20 wt.% PTFE (TF9207Z, 3 M Dyneon) were physically mixed using a knife mill for 30 s. The powder mixture was filled into a frame, calendared at 30 Kg and heat treated for 1 h at 340 °C.
Cell assembly
The test cell was build using Poly(methyl methacrylate) (PMMA). It consists of a solid back plate on the anode side, a ring-shaped electrolyte compartment with a thickness of 1 cm and a plate with four connections for gas supply. The gas supply is placed at the four electrode corners (see Fig. 1).
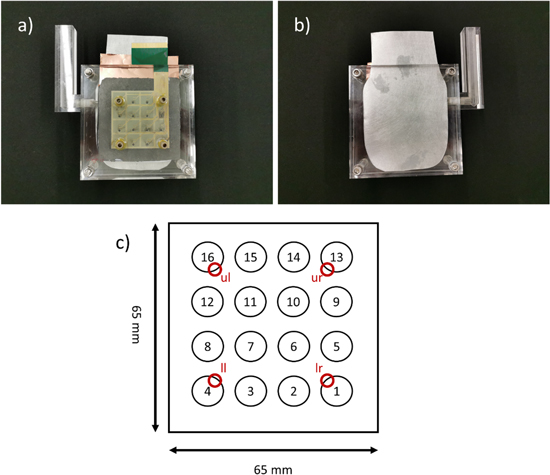
Figure 1. (a) and (b) show the assembled test cell, (c) shows the segment numbers and the gas inlets (upper left, ul; upper right, ur; lower left, ll; lower right, lr) referred to in this work.
Download figure:
Standard image High-resolution imageA zinc foil (250 μm thick) was used as anode. The produced Ag electrodes were pressed into a PTFE frame and mounted into the cell, together with the GDL and the segmented current collector. As segmented current collector a PEEK foil (100 μm thickness) with printed gold contacts (40 μm thickness) was used. Airflow was realized through the segmented current collector by four holes marked in Fig. 1c as red circles.
The cathode consisted of the 12 mm Ag electrodes pressed inside a 0.5 mm thick PTFE frame. Between the electrolyte and the cathode assembly a rubber foil and a PMMA plate, both with 11 mm holes were mounted. This was done to better seal the edges of the cathodes and provide homogenous pressure onto the cathode to reduce contact problems.
The cell was either operated with ambient air or pure oxygen. The gas flow was led to a 3 cm high water column and set to 1 bubble per second. Compared to fuel cells, batteries exhibit much lower currents densities and therefore a homogenous gas distribution can be achieved more easily. As a consequence, no forced convection by pumps is necessary, however, a sufficient gas supply is mandatory which was accomplished by providing enough gas inlets/holes. In our case up to four inlets were integrated.
Segmented cell technique
Due to the fact, that potential can be measured more precisely than current, a core element of the segmentation diagnostics is the current to potential conversion. In this work it was carried out by using two different kinds of operational amplifiers (OpAmp) circuits. The transimpedance amplifier (TIV) and the instrumental amplifier (InAmp). The following part is divided into the description of the setup, the functionality and the main advantages and disadvantages of the certain amplifier circuits.
Transimpedance amplifier (TIV):
The TIV, depicted in Fig. 2 is an inverted amplification circuit, based on the signal source being connected to the inverted input. UE describes the input and UA the output signal. All existing resistances before the inverted input are condensed in an equivalent resistor R1. R2 is the feedback resistor. The negative input is called inverted and the positive none inverted. ┴ symbolizes ground potential (GND). The bipolar potential source of the operational amplifier is marked by V- and V+.
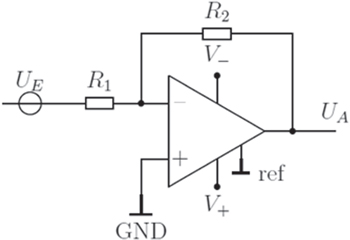
Figure 2. Circuit diagram of a transimpedance amplifier.
Download figure:
Standard image High-resolution imageThe non-inverted input is connected to ground (GND). As a consequence of the non-inverted input being connected to GND and the input potentials are set to the same potential both input signals and the output potential UA share the same potential. An incoming potential coming from the input (UE) increases the potential according to the ohmic law. The current flow through the feedback resistor R2 is connected to an internal circuit of the amplifier and with this is connected to the negative power source. The amplifier evens out the amplified potential by supporting a current flow over the feedback wiring to V-. As a consequent there is a potential drop at the amplifier output UA. The resistor R2 and the new output potential UA results in an equivalent current compared to the input current. These currents balance each other out at the inverted input. The amplifier maintains the potential between the potential source and the inverted input. Since the potential drop of R2 is controlled by the operational amplifier, the signal source is not being influenced by R2 which avoids errors commonly present with shunt resitors setups.
The amplification is calculated with the following formula:

Instrumentation amplifier (InAmp):
The InAmp is a differential amplifier (Fig. 3). UE describes the input and UA the output signal. RS describes the shunt resistor and RV the setting resistor. ┴ symbolizes ground potential (GND). The bipolar potential source of the operational amplifier is marked by V- and V+.
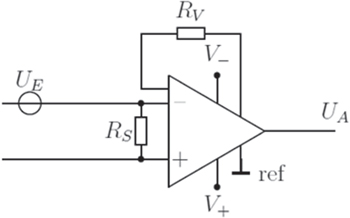
Figure 3. Circuit diagram of an instrumental amplifier.
Download figure:
Standard image High-resolution imageThe current from the signal source is flowing through the shunt resistor RS. There is a potential drop over the resistor dependent on the incoming current and the resistor value, which is measured by the OpAmp. The potential then is amplified by a factor, which is determined by the setting resistor RV. The output potential is raised respectively. Table I gives an summary and comparison of the TIV and InAmp circuit.
Table I. Comparison of the advantages (pro) and disadvantages (con) of both the InAmp and the TIV setup.
| TIV | InAmp | |
|---|---|---|
| Pro | •The measured signal source is not being influenced by a sense resistor. | •The measurable current range is only restricted by the temperature dependence of the resistor. |
| •Only one resistor is needed. | ||
| Con | •The measurable current and potential range is limited by the OpAmp. | •The shunt resistor contributes to signal source error. |
| •OpAmp which are designed for current ranges higher than 100 mA are expensive. | •A minimum of two resistors is needed. The error tolerance assigned to the resistors propagate through the shunt- and amplification resistor. |
The above described characteristics of both circuits determine the sources for errors. These errors were calculated by error propagation (see supporting information) and showed an approximately 10 times smaller error for the TIV. This is mostly due to the shunt and variable resistors. In the following experiments the TIV is mainly used because of the lower errors.
Measurement techniques
A Zahner electric Im6 equipped with 4 PAD4 (Parallel Analog-Digital 4) cards for parallel voltage measurements was used to record the current distributions. During charge and discharge constant currents were applied and the sampling rate was set to 2 s.
Results and Discussion
Influence of electrolyte level
For the validation of the setup, an experiment with a variation of the electrolyte level which leads to a varying amount of electrochemically active electrode segments was performed and the current distribution was measured. Furthermore, two different types of operational amplifier circuits were compared in their ability to measure and resolve currents from the segmented current collector. The aim was to identify an electronic design with signal of high quality and resolution. For a description of the circuits with the corresponding features, see section segmented cell techniqu.
Figure 4 shows the comparison of the transimpedance amplifier (TIV) and the instrumentation amplifier (InAmp) circuit board connected to the cell for an increasing electrolyte level. 16 electrically isolated silver electrodes were used in a 4 × 4 arrangement. The electrolyte level was raised 4 times (15 mm, 30 mm, 45 mm, 65 mm), with each level adjusted to fully contact the next row of electrodes and the current distribution was recorded at a fixed current of 160 mA. Since the electrochemical reaction can only take place where electrolyte is in contact with the electrodes, the applied current will flow through the wetted electrode segments. This results in locally high current densities (depicted in yellow) for low electrolyte levels, as the total current is fixed for all measurements. When the electrolyte level is raised up to the next row of electrodes the contacted segments become active leading to a more homogeneous current distribution. At full contact deep blue regions vanish and the overall current distribution is homogeneous with modest local current densities. As expected both circuit boards show this behavior demonstrating the functionality of the setup.
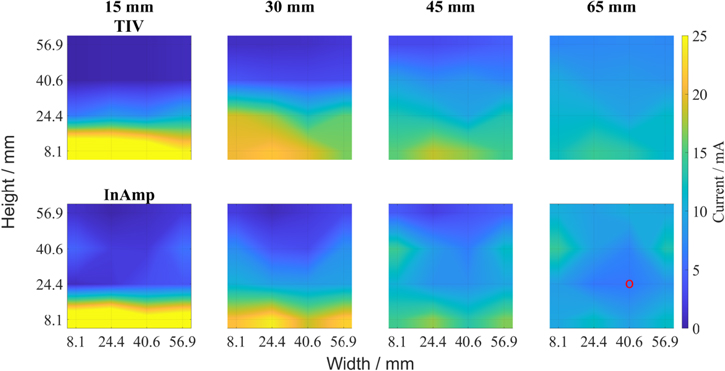
Figure 4. Variation of electrolyte level for the transimpedance amplifier (TIV, top) and the instrumental amplifier (InAmp, bottom). The red circle marks segment 6.
Download figure:
Standard image High-resolution imageWhile the TIV and the InAmp circuit show comparable results for an electrolyte level of 15 mm and 65 mm, both electrolyte levels of 30 mm and 45 mm show some deviations. The formation of a homogeneous current distribution seems to be better for the TIV circuit. Especially in the center region of the InAmp circuit measurement only low currents were recorded. The use of 16 single electrodes placed in the PTFE frame could inflict contact problems since during mounting the electrodes it was not possible to place them completely in plane with the PTFE frame. This can be seen for the InAmp circuit at segment 6 (cf Fig. 1 red circle), which always shows very low currents, e.g. for the fully filled cell segment 6 shows around 6 mA compared to 10 mA at the other electrodes. In further studies this electrode arrangement consisting of 16 single electrodes will be replaced by one electrode which covers the whole measured area. In this respect it has to be mentioned that for all segmented measurement techniques the local resolution is determined by the in-plane electric conductivity which counteracts the heterogeneity of current distributions. Since silver exhibits very high electronic conductivity we needed to have an insulating frame. The following results in the following figures were recorded with the TIV set up.
Influence of gas supply location
To further validate the setup and demonstrate its capabilities, the effect of gas supply location was investigated. To this end, three gas ports were sealed (Fig. 5 red crosses), only the gas port at the lower right was left open (Fig. 5 green circle). Figure 5 shows the current distribution at the start of the measurement (left figure) and the normalized current distribution at the end of the measurement after reaching 0.5 V vs Zn (right figure). The normalization was done by subtracting the initial current distribution from the current distribution of interest and was done to better identify changes between start and operation and to mitigate small deviations in the initial state most probably ascribed to contact problems. During the measurement a clear shift of current to the lower right corner with the open gas port can be identified while the rest of the electrode shows a decrease of current indicating the depletion of oxygen and therefore lower reaction rates. The three corners with closed gas inlets still show higher current densities than the center of the electrode. This could be explained by diffusion of oxygen through the sealing.
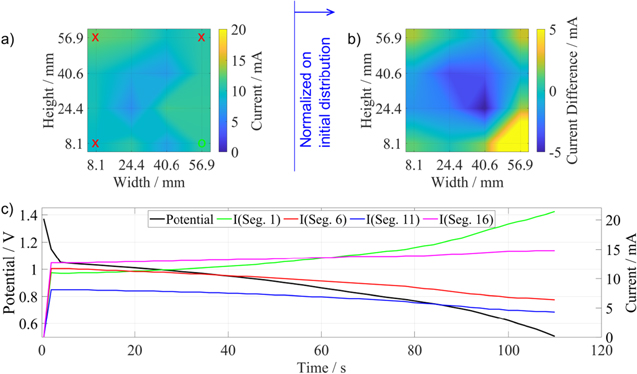
Figure 5. Influence of gas distribution if only the gas port at the lower right (green circle) is open for the transimpedance amplifier (TIV). The red crosses mark the closed gas ports. The current distribution in figure (b) shows the normalized current distribution at t = 110 s. Figure (c) shows the current over time.
Download figure:
Standard image High-resolution imageInfluence of gas flow rate
To investigate the influence of the flow rate in more detail, the flow was increased 3-fold from 0.065 ml s−1 increased to 0.327 ml s−1 and set back to the initial 0.065 ml s−1. At each rate the flow rate was maintained for 2 min. The flow direction was adjusted by using only one gas port as inlet and another one as outlet. Accordingly, the gas flowed either from the lower right (lr) to the upper right (ur), or from the upper left (ul) to the lower left (ll), respectively. Both tests were done on the same setup including the same electrodes. First the gas flow was set to the right side (lr→ur) and afterwards to the left side (ul→ll). The results are shown in Fig. 6.
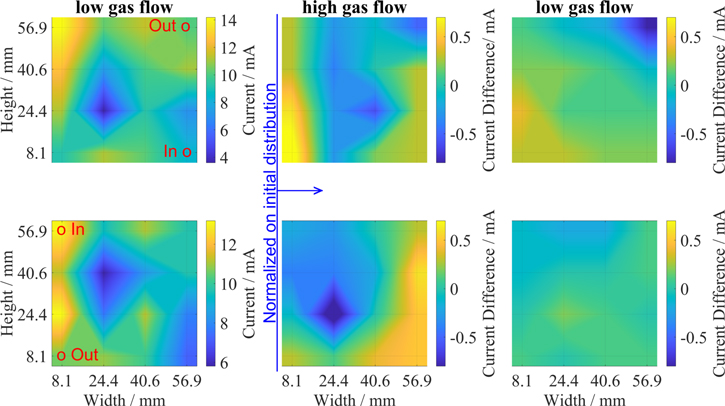
Figure 6. Variation of gas flow rate for the transimpedance amplifier. Upper figures show gas flow from lower right (lr) to upper right (ur), lower figures the gas flow from upper left (ul) to lower left (ll). Both left figures show the initial distribution after 2 min of gas flow. All other diagrams are normalized to this initial distribution.
Download figure:
Standard image High-resolution imageThe current distribution at t = 0 shows an acceptable homogeneity. For the gas flow from lower right (lr) to the upper left (ul), segment 16 (upper left corner) shows a slightly higher current than the other segments which is ascribed to the position of the inlet (Fig. 6 upper line). This effect increases with the increase of the flow rate as can be seen in the middle figures for high gas flow rate. For the flow on the right side the reaction shifts to the left, while for flow on the left side the reaction shifts to the right. In our setup the gas flowed through the GDL which inflicts resistance to the gas flow and therefore led to increased gas pressures for higher flow rates. The increased gas pressure shifts the location of the three-phase boundary away from the gas towards the electrolyte side of the GDE, thereby reducing the electrochemically active surface area. After reducing the gas flow again to the initial value, the current distribution levels off and exhibits a more homogeneous distribution again. This can be seen clearly for the ul→ll test while for the lr→ur test the initial state was not achieved again. For all segments a small drop in current density was observed after around 1 min (see Fig. S1 in supp. Information (available online at stacks.iop.org/JES/168/120530/mmedia)). This drop might explain the deviation from the initial state as the system might not have been in equilibrium state. This is because changes in current density also lead to changes in the surface coverage with reactants as well as changed electrolyte saturation of the surface due to changed electrowetting.
It has to be mentioned, that the pressure inside the porous system which builds up as a result of the change in the gas flow is more severe than what is commonly observed for membrane electrode assemblies (MEAs) in fuel cells. The cell used in this study did not have a flow field, but instead uses gas ports which lead the gas directly through the GDL. Flow fields could homogenize the gas pressure throughout the channel system, and reduce the pressure inside the porous structure as the gas would not have to be transported through the GDL to its full extent. An additional difference is the thickness of MEAs compared to our electrodes. That said, the presented technique can serve as a valuable tool in evaluating and optimizing cell design and flow-field structure in future work.
The observed current inhomogeneities cause heterogeneous aging. For fuel cells such degradation investigations were carried out by e.g. Durst et al. and showed that fuel starvation under the land compartment of the flow field leads to decreased degradation. 34 This is because oxygen has to diffuse from areas with channels to areas without channels. In our case the forced heterogeneous gas distribution has the same effect. In areas with low concentration of reactant lower reaction rates are present, whereas in areas with sufficient supply of oxygen the current densities are high. These regions show faster degradation.
Influence of heterogenous cathode current distribution on anode dissolution
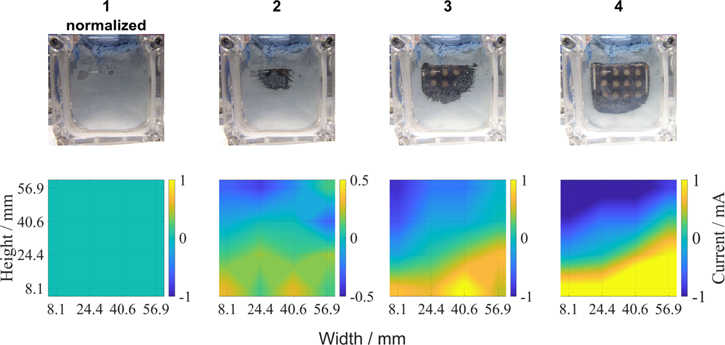
Inhomogeneities on the cathode side might also inflict inhomogeneities on the anode side. These inhomogeneities can be due to several reasons like gas flow and distribution, as it was shown above but also due to different penetration depths of electrolyte in the porous system. The wetting behavior affects the active surface inside the porous electrode. To investigate the influence of inhomogeneities on the anode, the battery was discharged to 0.5 V vs Zn. The current was set to 240 mA and the gas flow was set from both lower gas ports to both upper gas ports. The result is depicted in Fig. 7. The first row shows the normalized state at 2.78 h and was used to normalize the current distribution for better visualization of changes, as at this point the system was in a stable condition (the non-normalized distribution can be found in the supporting information Fig. S3). Row 2 shows the result at the first visible hole in the anode at 7.37 h. This is accompanied by a shift of current to the bottom of the cell where the anode is still intact. At 9.43 h the hole in the anode grew larger and the current shift to the bottom has advanced further. At the end of the test (11.5 h) the anode is almost completely dissolved and the cathode can be seen through the cell. A potential and current diagram over time is shown in the SI in Fig S4.
Figure 7. Discharge of Zn-air battery until 0.5 V vs Zn. Upper figures show the anode at 2.78 h (1), 7.37 h (2), 9.43 h (3) and 11.5 h (4). Lower figures show the corresponding current distributions on cathode side.
Download figure:
Standard image High-resolution image
The faster dissolution of the anode is due to higher currents at the top of the cell. Reason for this might be either the hydrostatic pressure of the electrolyte or the pressure induced by the gas flow. The influence of the gas flow was investigated in Fig. 5. As we used the low flow rate from bottom to top on both sides the influence of the gas flow rate onto the current distribution should be negligible. The hydrostatic pressure on the other hand inflicts higher electrolyte pressure at the bottom of the cell and therefore higher penetration depths. This reduces the active area and therefore has a similar effect than the high gas flow rate would show.
This inhomogeneous dissolution of the anode hinders high cycle life since the structure of the anode is disintegrated at some areas, while on others is still intact. During charging inhomogeneous currents inflict higher local currents resulting in dendrite growth, 3 which short circuits the battery.
Parker et al. proposed a structured zinc sponge consisting of zinc with interconnected pores in between. The capacity of such electrodes cannot be used completely since a backbone structure is needed to precipitate metallic zinc during charging back onto the structure. Inhomogeneous current distributions during discharge, like observed by us, would destroy such host structures resulting in reduced capacity and cycle life. 3,35,36 The loss of usable zinc is accompanied by gravimetrical forces in vertical cells, like the one used by us. This is due to the reaction pathway where first zinc hydroxide is formed. After reaching the solubility limit zinc oxide formation takes place. Therefore, the current distribution should be optimized to accommodate for hydrostatic pressure influences on cathode side as well as gravimetrical forces on anode side.
Conclusion
Two different kinds of operational amplifiers (OpAmp) circuits were shown and compared to measure a segmented current collector printed on a thin foil. The transimpedance amplifier circuit showed smaller errors than the instrumental amplifier circuit, as shown by error calculation. To verify both amplifier circuits the electrolyte level was slowly filled and the resulting current distribution was measured, showing that both amplifier circuits can give valuable in-operando information about the system. The used cell setup already showed good current homogeneity.
The influence of the gas distribution and the flow rate was investigated. For this only one gas port was left open and the oxygen starvation was observed in the rest of the cell, showing that enough gas access points must be provided for good current homogeneity. Variation of gas flow rates showed that a low flow rate gives a smoother current distribution than higher flow rates. This is probably due to the higher gas pressures inflicted by the flow through the porous system which reduces the electrolyte saturation level inside the porous system and therefore the active area on the side of the high gas flow.
In a last experiment the influence of non-uniform current distribution on the cathode side on the dissolution rate on the anode side was investigated. It was shown that due to higher currents on the upper part of the cathode the anode dissolved faster in this area. This inhomogeneous dissolution inflicts lower cycle life due to the loss of host structures to reprecipitate the zinc.
In further investigation the influence of humidification and aging must be further investigated with this cell setup and a modified version with a flow field. A heterogeneity of material degradation (GDL, GDE, Anode) needs to be considered as well for further studies and has to be examined.
As conclusion it can be mentioned, that the knowledge about current distributions can be used for material development, performance enhancement, investigation of degradation, cell and flow field development and optimizing operating conditions. This setup can be used in other battery applications like Li-Ion and metal-sulfur batteries as the shown setup can accurately measure the low current densities used and can therefore be used for system and material development in these as well.
Acknowledgments
This research was supported by funding of the DLR in the frame of the project "Next Generation Car."