
Abstract
Operation of solid oxide fuel cells (SOFCs) with bio-syngas from the gasification of biomass is a promising approach to highly efficient and sustainable power generation. At the same time, the coupling is challenging as several biogenic impurities in the bio-syngas have a negative effect on the SOFC. For this paper the impacts of the impurities naphthalene and phenol on SOFC short-stacks were investigated experimentally for the first time. The cell in the stacks were anode-supported SOFCs with Ni/YSZ anode. The experiments were performed at 700 °C under load with simulated bio-syngas consisting of hydrogen, carbon monoxide, carbon dioxide, methane and water vapor. 2 g Nm−3 of naphthalene (350 ppm) caused a pronounced voltage drop and an increase in cell temperature. By analysing the anode off-gas and recording of I–V-curves, it could be shown that naphthalene blocked the electrochemical hydrogen oxidation as well as the reforming of methane and the shift reaction of carbon monoxide. Up to 8 g Nm−3 of phenol (1900 ppm), on the other hand, led to carbon deposition and irreversibly damaged the structure of the anode substrate by metal dusting. This form of degradation was not visible in the electrochemical data during operation.
Export citation and abstract BibTeX RIS

This is an open access article distributed under the terms of the Creative Commons Attribution 4.0 License (CC BY, http://creativecommons.org/licenses/by/4.0/), which permits unrestricted reuse of the work in any medium, provided the original work is properly cited.
The majority of solid oxide fuel cell (SOFC) systems are currently operated directly on natural gas or on gray hydrogen produced by methane steam reforming.1 As this creates fossil CO2 emissions, it is more sustainable to operate the SOFC on bio-syngas instead, which is produced by gasification of solid biomass and therefore CO2 neutral. The coupling of gasifier and SOFC is called biomass integrated gasification fuel cell system (B-IGFC). A very high electrical efficiency of 63%LHV can be achieved by such a B-IGFC at a total exergetic efficiency of 55% for an optimised interconnection, in which the heat of post-combustion of unconverted fuel gas and a part of the waste heat of the SOFC are introduced into the gasifier via heat pipes and a part of the anode exhaust gas is recycled.2
Bio-syngas mainly consists of hydrogen (H2), methane (CH4), carbon monoxide (CO), carbon dioxide (CO2), water (H2O) and nitrogen (N2).3 In addition to these main gas components, the raw bio-syngas contains impurities in the form of particles, sulfur, alkali and chlorine compounds and tars.4–6 In this context tars are higher hydrocarbons which result from incomplete conversion of complex biogenic macro-molecules in the gasifier. Tars can potentially block catalytic centres for both electrochemical and reforming reactions, inhibit the diffusion of fuel, or lead to mechanical deterioration of the cell.7 At the same time they can be reformed at the nickel of the SOFC anode and serve as a fuel.
The successful coupling of gasifier and SOFC with complete removal of all impurities upstream of the SOFC was shown by several authors using different setups.8–11 The authors of this paper operated two F10 short-stacks from Forschungszentrum Jülich at 700 °C with the bio-syngas from an allothermal fluidised-bed gasifier.12 During the first test with extensive gas cleaning (particles, chlorine- and sulfur components, tars and unsaturated hydrocarbons) the stack performance was stable and there were no carbon deposits or material-related problems. The test on the second short-stack without tar-removal had to be stopped even after 5.4 h. The reason for this was that a large amount of carbon in the form of carbon whiskers had deposited inside the stack at the Ni mesh contacting the anode side of the SOFC which blocked the fuel gas flow and increased the pressure drop drastically.13 Under these deposits metal dusting of the anode support at the fuel entrance of all cells and of the nickel meshes for contacting had started. Metal dusting is a type of corrosion which affects different metals—especially iron and nickel—in gases with high carbon activity.14 Due to carburisation of nickel and the resulting stress on the cermet matrix, disintegration takes place, resulting in metal dust.15
The tar concentration during the test with the second stack was approx. 5 g Nm−3 at the anode inlet, mainly consisting of benzene, toluene, cresol, phenol and naphthalene. As these tars were all present at the same time, it was not possible to determine which components caused the damage to the anode and if there were different impacts of the single components. In order to distinguish between various tars, tests with individual model tars are therefore necessary. SOFC tests with naphthalene as model tar were conducted by several authors.16–19
Papurello et al.16 tested the influence of naphthalene on Ni/YSZ ASCs at 0.33 Acm−2 and 750 °C: in pure H2 30 ppm of naphthalene (0.17 g Nm−3) did not affect the performance of the cell negatively whereas 10 ppm (0.06 g Nm−3) in syngas drastically decreased the cell potential. Additionally using I–V-curves, the authors stated that naphthalene inhibited both electrochemical and reforming reactions. Naphthalene therefore did not only adsorb on the nickel surface at the active sites for reforming, but also at the TPB where electrochemical oxidation takes place. In the worst case the reduction of available fuel by the shortfall of H2 from reforming could lead to critical fuel utilization levels and consequently to nickel oxidation at the anode.
Like Papurello et al., Hauth et al.17 saw the multiple effects of naphthalene for Ni/GDC anodes when adding 11.6 g Nm−3 of it to either hydrogen or syngas at 900 °C. For the first case the authors reported an increase of the open circuit voltage (OCV) whereas it decreased in the second case. The increase in OCV during H2 operation cannot be interpreted as a relevant successful usage of naphthalene: in open circuit conditions (OCC) usually a minimum number of free TPB exists with which the Nernst voltage can be reached and the Nernst voltage is increased by partial reforming of naphthalene. During operation under load naphthalene poisoning manifested itself for all fuel gas mixtures in an increased over-voltage caused by a reduced amount of free TPB, as discussed in Ref. 16. In addition, during syngas operation Hauth et al.17 detected an increased concentration of CH4 in the anode off-gas due to naphthalene poisoning of methane reforming. It is remarkable that naphthalene was able to block CH4 reforming even at an operation temperature of 900 °C. This phenomenon and a decrease in cell voltage were also observed by Dekker et al.18 when operating a Ni/GDC electrolyte-supported cells (ESC) at 850 °C using syngas and naphthalene as model tar. They reported analogue effects for phenantrene and pyrene.
All studies with naphthalene have in common that no carbon deposits or structural changes of the cell were reported. In contrast, benzene and toluene can lead to severe carbon deposits at the cell. Using these two model tars in dry H2 plus N2, Mermelstein et al.20 reported carbon deposits and subsequent metal dusting on Ni/YSZ ESCs at 775 °C.
Previous investigations by the authors of this paper have shown the effects of phenol21 and naphthalene19 on anode-supported single-cells with Ni/YSZ anode and Ni/YSZ substrate at a cell temperature of 700 °C. Up to 4 g Nm−3 phenol in simulated bio-syngas had no effect on electrochemistry, but caused heavy carbon deposition due to thermal cracking22 and subsequent metal dusting. 0.4 g Nm−3 of naphthalene, on the other hand, did not cause carbon deposition, but interfered with the electrochemistry as it led to a severe decrease of cell voltage. Impedance measurements have shown that naphthalene first inhibited mass transfer in the anode layer and only afterwards, when CH4 and CO as fuel had been eliminated, did it affect mass transfer through the substrate. The polarization resistance of the electrochemical oxidation itself increased only to a small extent. Tests with other concentrations of naphthalene showed that the decrease of cell voltage correlated with the accumulated amount of the model tar.
Data in literature on the impact of model tars on SOFCs is mostly based on single-cell tests. In this paper short-stacks were operated on simulated bio-syngas to which the tars naphthalene and phenol were added separately. Phenol and naphthalene were selected as model tars as these are two of the most frequent tar components in bio-syngas from fluidised-bed gasifiers.23 The use of short-stacks instead of single-cells provided more application-oriented results. Unwanted reactions can take place on the metallic surfaces inside the stack, which are not visible with the almost inert alumina normally used in single-cell experiments. These possible interactions with contaminats must therefore be considered in addition to cell degradation if SOFCs are to be operated on bio-syngas. Moreover, the sealing is better in short-stacks compared to single-cell tests, as are the gas distribution and the electric contacting.
Experimental
Two stacks were operated under load at 700 °C. For the first stack (Stack N) naphthalene was used. For the second (Stack P) the model tar was phenol. In addition to cell voltage, temperatures and pressure drop, I–V-curves were used to measure the impact of the tars. The concentrations of CH4, CO, CO2 and H2 in the anode off-gas were analysed for the detection of inhibition of fuel conversion reactions. After the tests the stacks were dissected to check the state of the cells.
Tested short-stacks—In this work short-stacks in the F10 design of Forschungszentrum Jülich with two cells were used. Details on this stack type can be found in Ref. 24. Inside the stack fuel gas and air flow in counterflow, with both gas streams being supplied from below. The interconnectors and cell frames of the stack consist of Crofer 22 APU,25 which up to 900 °C forms a top layer of electrically conductive chromium-manganese oxide with a low chromium evaporation rate.26 The individual metal layers are sealed with glass sealant. In order to further reduce chromium evaporation and poisoning of the cathode, a MnCo1.9Fe0.1O4 (MCF) coating is applied via atmospheric plasma spraying (APS) on all exposed parts of the interconnector on the air side.27 A fine and a coarse nickel mesh is used for contacting at the anode side, and a thick contact layer of LaMn0.45Co0.35Cu0.2O3 (LCC10) coating is applied onto the cathode via screen printing.
The cells in the two short-stacks examined in this work had a 10 × 10 cm2 Ni/3YSZ substrate from CeramTec (Marktredwitz/Germany) printed with the functional layers (Ni/8YSZ anode, 8YSZ electrolyte, GDC barrier layer, LSCF cathode) by Jülich.28 The electrochemically active area in the stack was determined by the size of the cathode of the cells and was 80 cm2 per cell. The end plates and the middle interconnector plate had three drill holes with a depth of 40 mm each, into which thermocouples could be inserted. With these the temperature inside the stack—10 mm from air and gas inlet and in the middle of the cells—could be measured. Wires of Pt welded to the end plates and to each interconnector acted as contact for measurement of all cell voltages. The two stacks were both joined at 850 °C for 100 h at Forschungszentrum Jülich followed by reduction of the anodes and reliability tests. The latter had a duration of 180 h for Stack N and 30 h for Stack P. Afterwards they were shipped to TUM for the tests with simulated bio-syngas.
Short-stack test rig—Since the short-stacks do not generate enough waste heat, they had to be placed inside a 8 kWel furnace to control their temperature. An adapter plate made of high temperature steel (1.4742) was used for the supply and removal of both fuel and air. Four plates made of high temperature steel (1.4828) with a total weight of 50 kg were used as compression weight for stack and sealing. Rods made of Inconel served as connection between the end plates of the stacks and the electrical load (PLI 2106 from Höcherl & Hackl, Konzell/Germany). There was no device for impedance measurements implemented in the stack test rig; for the discussion of the influence of naphthalene on the impedance the reader is referred to Ref. 19. To control the current and measure the stack voltage, thin silver potential wires were connected to the load in parallel. The load could be operated stand-alone or with a LabView programme which also controlled the fuel gas supply. The single-cell voltages were stored either by a data logger (HOBO UX120-006M, Onset, Bourne/USA) or by the LabView programme via an USB interface (RedLab 1208LS, Meilhaus Electronic, Alling/Germany). The latter had a lower resolution which led to scrawly I–V-curves. For the better representation of the I–V-curves data from this device was therefore fitted with a hyperbolic plus linear term (U(I) = a/(I + b) + c · I + d). All wires for the voltage measurement and the thermocouples which measured the temperatures in the stack were sheathed in glass fabric insulation to prevent short circuits. Besides voltage and current, all temperature (stack, oven, pipes, tar container) and differential pressure signals ( ,
,  ) were recorded.
A mobile gas mixing station was used for operation of the stacks on simulated bio-syngas. With its mass flow controllers the anode could be supplied with H2, CH4, CO, CO2 and N2. The purities were 5.0, 2.5, 3.0, 4.5 and 5.0, respectively. Steam was dosed with an pump which dosed liquid H2O into a heated main pipe. Oscillations due to the evaporation of the water led to noise in the recorded cell voltages, see for example period from 12 to 16 h in Fig. 2. The anode could also be purged with forming gas during start-up and failure situations via a separate pipe. The supply of forming gas was controlled by a normally-open solenoid valve so that reducing conditions at the anode were ensured even in the event of a power failure. The air volume flow on the cathode side was regulated manually by a float. All fuel pipes were equipped with trace heating to prevent the condensation of tars.
In order to protect the stack in the best possible way in all situations, further safety aspects were taken into account. First, an overflow valve at the fuel gas inlet ensured that the overpressure there could not exceed a design limit of 100 mbar. The under-voltage protection of the load also ensured that the fuel gas utilization could not reach critical values after a minimum voltage had been specified. When the emergency stop of the test rig was activated, the load automatically switched to OCC and the solenoid valve for forming gas opened. The LabView programme also ensured that the flow of CH4 and CO were stopped if the steam supply was interrupted to prevent carbon deposition.
After passing through a condenser, some of the fuel gas went into the off-gas analysis and the rest was burnt in an outside flare. The pipe to the flare was heated to prevent condensation or freezing of residual moisture. The anode exhaust gas composition after condensation of the water was measured online using a gas analyser (Sick C700, Waldkirch/Germany). The gases CH4, CO and CO2 were measured by non-dispersive infra-red absorption (NDIR). For H2 a thermal conductivity detector (WLD) was used, and a paramagnetic sensor for O2.29 The ranges for CH4, CO, CO2, H2 and O2 were 0–10, 0–70, 0–40, 0–40 and 0–25 vol%, respectively. The nitrogen content resulted from the difference to one hundred percent. If the concentration of a component left the respective measuring range, the excess was output as N2. The response time of the analysis was around 5 min and the realistic accurancy was approx. 1%. A zero point calibration was performed before each measurement. Non-condensable by-products of incomplete tar conversion, for example ethylene or propane,30 could not be measured with the applied set-up.
Tar dosing and detection—A tube-shaped container filled with tar was used for the dosage of tar during stack tests. The inner diameter of the tube was 56 mm and its length was 180 mm whereas the distance between gas inlet and gas outlet was 150 mm. A heating sleeve was used for accurate temperature control. The container was placed horizontally in order to achieve the largest possible interface between tar and carrier gas (CO2). For easy filling or cleaning the container was equipped with Tri-Clamp connections. Two thermocouples measured the temperature of the container wall and in the gas outlet. The latter was used to calculate the saturation vapor pressure, and from this the tar concentration in the fuel gas (see Appendix for the applied formulas). When the SOFC was operated with tar-containing syngas, the anode off-gas was led through a separate condenser in order to protect downstream equipment from tar contamination.
The actual presence of tar was checked by the solid phase adsorption (SPA) method proposed by Brage et al.31 The gas volume for each measurement was 100 ml which was sampled manually using a syringe. As solid phase for tar adsorption Hypersep 100 mg Nh2 columns from ThermoScientific, Rockwood/USA were used. The captured tars could be eluted afterwards with a solvent, here dichloromethane (DCM SupraSolv, Merck, Darmstadt/Germany) was used. The mixture of solvent and tars was collected in 2 ml glass vials. 1 μl of the mixture was injected to the column (19091J-413, Agilent, Santa Clara/ USA) of a gas chromatograph (7890 A from Agilent) which allowed the quantitative analysis of the tar content by integrating the signal of the flame ionisation detector. The short-stack test rig was equipped with three ports for SPA measurements: one after the tar dosing, one upstream and one downstream of the stack. Sampling in the wet anode gas streams was inaccurate since steam condensed in the syringe. Sampling in the dry carrier gas after the tar dosing led to blockage of the needle of the syringe due to the high tar concentration. The SPA method was therefore only used to check the presence of the respective model tar in the fuel inlet and outlet gas and not its amount.
Procedure of the tests—After installing the stacks inside the furnace on the adapter plate, they were heated to 700 °C at 4 K/min (furnace set temperature 708 °C). At the same time, 0.5 Nl/min/cell forming gas were flowing through the fuel gas side to prevent the anode from re-oxidising. The air side flow was 2 Nl/min/cell for the entire duration of the tests from the start of heating. After a stationary temperature was reached a basic characterization was performed in the form of several I–V-curves with pure hydrogen (1.125 Nl/min/cell H2), a H2/H2O mixture (1.1 Nl/min/cell H2 and 0.275 Nl/min/cell = 0.221 mg/min/cell H2O) and a H2/N2 mixture (0.5 Nl/min/cell H2, 0.61 Nl/min/cell N2). The rate of current increase was 20 A/min. The basic characterization was followed by the actual test programme. The sequence of the test phases and the applied concentrations of naphthalene and phenol are shown in Table I. The volume flow of simulated bio-syngas was 1 Nl/min/cell, and except for Syn0 at Stack N the applied current was 27 A (current density 0.34 Acm−2). For the dosing of tars 67 ml min−1 of the overall CO2 flow were led through the heated tar container which was either filled with naphthalene or phenol.
Table I. Sequence of the test phases for the short-stack tests. Anode side gas flows during syngas (Syn) in Nl/min/cell: 0.5 H2O, 0.25 H2, 0.1 CO, 0.1 CO2. 0.05 CH4. Cathode: 2 Nl/min/cell air. Standard current 27 A.
| Reading point | Start, h | Duration, h | TTar, °C |
|---|---|---|---|
| Stack N | |||
| Initial I–V-curves | —- | —- | —- |
| Syn0§ | 0 | 19 | —- |
| Syn | 19 | 1 | —- |
| Syn + 2 g Nm−3 Naph | 20 | 29 | 81 |
| Syn (recovery) | 49 | 26 | —- |
| Forming gas | 75 | 66 | —- |
| Syn | 141 | 6 | —- |
| Relaunch* | 1027 | 52 | —- |
| Stack P | |||
| Initial I–V-curves | —- | —- | —- |
| Syn | 0 | 64 | —- |
| Syn + 2 g Nm−3 Phe | 64 | 24 | 74 |
| Syn + 4 g Nm−3 Phe | 88 | 24 | 87 |
| Syn + 8 g Nm−3 Phe | 104 | 24 | 101 |
Notes.
§ 40 A.
* different mixtures of H2, N2 and H2O.
Results and Discussion
The results of measured cell voltages and I–V-curves, temperatures, pressures, off-gas composition, and the preliminary post-test analysis are shown and discussed in the following.
Initial characterization—For both stacks a basic characterization was performed in the form of several I–V-curves at 700 °C with different reference gas mixtures. Using the curves with 0.5 Nl/min/cell H2 and 0.61 Nl/min/cell N2 as fuel, the stacks could be compared with each other and with previously tested stacks12 regarding their performance, see Fig. 1. It can be seen that the performance of Stack N and P was lower but still in accordance with the other stacks. The F10 stacks lose some of their performance each time they are removed from a test stand. In addition, the bottom cell always has a lower cell voltage, which is probably due to the lower temperature caused by heat dissipation through the adapter plate. Since the preheating of the cathode air was optimised before the test on Stack N, its two cells showed minor voltage-deviation from each other in contrast to the other stacks.
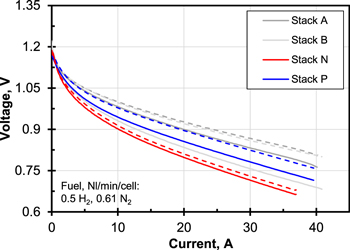
Figure 1. Initial I–V-curves at 0.5 Nl/min/cell H2 and 0.61 Nl/min/cell N2 of Stack N and P compared to previously tested stacks (Stack A and B from Ref. 12). Solid line bottom layer (Cell 1), dashed line top layer (Cell# ≥ 2).  , active cell area 80 cm2. Due to high noise data from Stack P was fitted with a hyperbolic plus linear term for better visibility.
Download figure:
Standard image High-resolution imageInfluence of naphthalene—Figure 2 shows the time response of the stack voltage from the start of operation of the stack with syngas. A clear decrease of voltage occurred within the first 19 h, which can be evaluated as running-in behavior. At the end of this running-in process the current was lowered from 40 to 27 A which led to the increase of voltage from Syn0 to Syn. By lowering the current, the current density (0.34 Acm−2) was the same as in the previous single-cell measurements.19,21 At the same time the slightly larger cell area contacted in the short-stack (80 instead of 72 cm2) led to a higher fuel gas utilization than in the single-cell tests (34% instead of 30%).
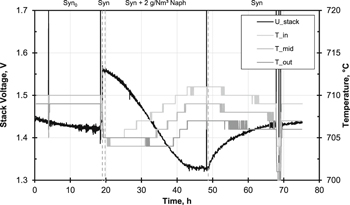
Figure 2. Course of voltage of Stack N (two cells) and temperatures of the top cell (inlet, middle, outlet). Syngas as main gas.
Download figure:
Standard image High-resolution imageAfter approximately one hour of operation at syngas and 27 A, 2 g Nm−3 of naphthalene (350 ppm) were added to the fuel gas. The temperature of the tar container was 81 °C. Complete reforming of the added naphthalene would theoretically have resulted in additional 0.004 Nl/min/cell H2 and 0.005 Nl/min/cell CO2. After a delay of approx. 1 h the voltage dropped steadily, and after 25 h reached a plateau which was for both cells approx. 110 mV below the voltage last measured with pure syngas. This corresponded to the observations from the previous single-cell tests whereas the rate and absolute value of voltage decrease was lower and the transition to the plateau was smoother. This was probably due to the different tar dosing devices and the longer piping at the short-stack test rig. Overall, the behavior of the stack was in accordance with the observations of Dekker et al.18 or Hauth et al.17 who saw a distinct decrease of performance when adding naphthalene to the fuel gas.
The presence of naphthalene in the fuel gas was regularly tested using SPA samples. Naphthalene was found in all samples upstream of the stack. In the first sample, which was taken 3.5 h after the start of dosing, a lower amount of naphthalene was measured compared to later samples. In the last sample, which was taken 1.5 h after switching back to pure syngas, a small amount of naphthalene (0.05 g Nm−3) was still present in the fuel gas. Both findings indicate that minimal amounts of naphthalene had condensed somewhere in the fuel supply pipes. Naphthalene was also present in the SPA samples of the anode exhaust gas but the amount was small so that the signal of the flame ionisation detector could not be integrated by the software of the gas chromatograph. This means that only a small fraction of the supplied naphthalene left the stack unconverted and the balance was adsorbed and slowly reformed.
As in the single-cell tests, the voltage drop was accompanied by an increase in temperature. The gray lines in Fig. 2 show the signals of the three thermocouples at the top cell. The trends of the thermocouples in the bottom cell layer behaved parallel to each other, which together with the parallel cell voltages indicated a uniform effect on both cells. The temperature initially increased at the inlet and only with a delay at the middle and the outlet of the cell, which was interpreted as a progressing naphthalene front which inhibited endothermic reforming of methane. This was also confirmed by an increasing amount of non-converted methane in the anode off-gas. The trends of the gas analysis will be discussed later. The pressure drop across the stack fluctuated between 4 and 10 mbar with no observable trend. This was an indication that the flow in the layers had not changed during naphthalene dosing. In contrast to the experiments with phenol, no carbon deposits were to be expected, which would have increased the pressure drop in the stack.
After 29 h of naphthalene dosage the switch back to pure syngas was carried out, which resulted in the recovery of voltage. After 26 h on syngas—interrupted by a phase with H2/N2 as fuel gas for an I–V-curve from hour 67 to 70—the gas supply was switched to forming gas. The voltage on syngas by then (t = 75 h) was still slowly increasing and had reached 93% of its original value. Again similar behavior was observed by Dekker et al.18 who saw that the cell performance recovered when naphthalene was removed from the fuel gas.
Figure 3 left shows the I–V-curves that were recorded on syngas during the test. Compared to the state in the plateau (red curves), the performance had clearly recovered up to the switching to forming gas (blue curves). However, the performance was still far from its original state (black curves); the ASR was increased and the OCV decreased. The comparison of the I–V-curves for syngas and H2/N2 in Fig. 3 shows that the influence of naphthalene poisoning on the OCV was only present in syngas. There are two influences which explain the reduced OCV in syngas: first, the H2 partial pressure was reduced by unconverted CH4 and CO and second, less additional H2 from the conversion of CH4 and CO was available. Both had an effect on the reactant term in the Nernst equation, resulting in lower a OCV. Under load both gas compositions had an increased ASR due to naphthalene poisoning. This again shows that naphthalene did not only block reforming reactions but also directly inhibited electrochemical oxidation of hydrogen or fuel gas diffusion to the TPB, as observed by Papurello et al.16 Due to a high voltage drop in the current collectors, it was not possible to set a sufficiently high current during the I–V-curves to visualise the mass transport limitation through the anode substrate. Together with the ASR, this maximum current density would have provided further data for the interpretation of the poisoning.
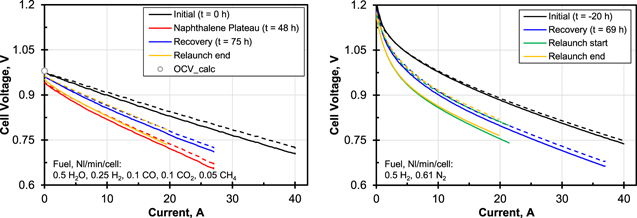
Figure 3. Left: I–V-curves of Stack N on syngas at indicated instants. Right: I–V-curves on H2/N2 mixture at indicated instants. Solid lines represent voltage of bottom cell.  , active cell area 80 cm2. Noisy data were fitted with a hyperbolic plus linear term for better visibility.
Download figure:
Standard image High-resolution imageAfter the first part of the test (t < 75 h) the stack was "parked" for 66 h with a forming gas flow at the fuel gas side and without drawing current. It was noticed that the OCV did not increase further in this phase. Two hypotheses could explain this behavior. First, the recovery at OCC was not visible because enough triple phase boundaries (TPB) were unpoisoned to deliver the open cell potential. This means that experiments on the influence of naphthalene should always be carried out under load and not at OCC. Second, naphthalene could probably only be removed from anode and substrate by reforming, which would have required water vapor. When resuming the operation with syngas under load (27 A) after the 66 h, the stack voltage was at the same level as before the forming gas phase, which suggests that no further regeneration had taken place by flushing with forming gas. The stack was cooled down afterwards.
In order to investigate the influence of the fuel gas composition on recovery, the stack was relaunched. The stack had lost performance due to removal and reinstallation and the air preheater was damaged before this second run. The stack was operated at 0.5 Nl/min/cell H2 and 0.5 Nl/min/cell H2O at the fuel gas side to force the reforming of naphthalene at the anode, intermitted by phases on H2/Nm and syngas for I–V-curves. When switching back to syngas, however, 3 vol% CH4 were still present in the exhaust gas, which was interpreted as a clear sign of persistent poisoning. As can be seen from the respective I–V-curves in Fig. 3 right, the performance could not be further increased. All I–V-curves on syngas and on H2/N2 recorded in the second run were nearly superimposed. Consequently, the stack could not be regenerated by advantageous gas compositions at 700 °C.
In addition to voltage, temperature and pressure drop, the dry exhaust gas composition (CH4, CO, CO2, H2, O2, balance N2) was also measured during the stack tests. The value of O2 was always below 0.1 vol% and therefore was not evaluated further. The qualitative values of the exhaust gas analysis (in vol%) could be converted into actual volume flows (in Nl/min) of components. Via a carbon balance

the volume flows for CO, CO2 and CH4 in the outlet could be calculated from their volume proportions. Here ideal gas was assumed, so volume flow corresponded to flow of matter. The values for  ,
,  ,
,  were 0.1, 0.2 and 0.2 Nl/min, respectively. Using the example of CH4:
From this the total dry volume flow at the outlet

could be determined. Since apart from CO, CO2 and CH4 only H2 was present in the flue gas, the H2 volume flow could be calculated with the total dry volume flow:

The results of the dry gas volume flow calculations at the stack outlet are shown in Fig. 4. For comparison, the curves of the cell voltages (U1 bottom cell and U2 top cell) were plotted in gray in the same diagram. The vertical coloured lines indicate the intervals in which the CH4-or H2-concentration was outside of the detection limit of the respective sensor, i.e. when CH4 > 10 vol% or H2 > 40 vol%. As can be seen for CH4, the addition of the excess N2 resulted in slight discontinuities in the curves. Fortunately only either H2 or CH4 was at its limit in accordance with the measuring ranges. According to the calculation of the volume flow, more CH4 left the stack at the end of the naphthalene dosing than was fed to it. The overestimation of 20% (0.12 instead of 0.1 Nl/min) might have been caused by reading errors in gas dosing and analysis.
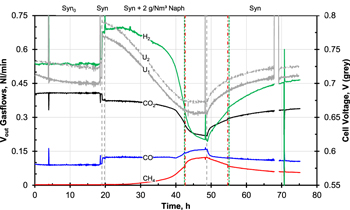
Figure 4. Flow rate of main gas components CO, CO2, CH4 and H2 in the anode exhaust gas during measurement at Stack N. U1 voltage of bottom cell and U2 voltage of top cell.  , syngas as main gas.
Download figure:
Standard image High-resolution imageInitially, no methane was measured in the exhaust gas, which corresponds to the reaction equilibrium for the adjusted syngas composition at 700 °C. However, the increasing proportion of CH4 in the exhaust gas confirms that the presence of naphthalene blocked the conversion of CH4 at the anode. Even at the end of syngas operation after the naphthalene phase the poisoning was still pronounced, as can be clearly seen from the increased CH4 content, analogous to the non-recovered stack voltage. It can also be seen that the CO2 volume flow decreased significantly in line with decreasing CO and CH4 conversion when naphthalene poisoning progressed. Since the omission of both reactions led to less H2 at the anode and the H2 utilization had to increase to maintain the current level, the H2 concentration in the exhaust gas decreased. The CO conversion was very constant initially and it is noticeable that, in contrast to CH4, the CO flow quickly returned to its original level after the switchover to pure syngas. The reaction kinetics of the endothermic reforming of CH4 at 700 °C might be slower than the exothermic WGS of CO. This would mean that compared to CH4, CO would require less non-poisoned cell area to be converted. The fact that CO is formed during the reforming of CH4 and CO can be used directly by the SOFC under certain conditions32,33 leads to a complex relationship that cannot be clarified on the basis of the collected data alone.
After evaluating the impedance data of the single-cell tests with naphthalene,19 it was assumed that the presence of the tar led directly to the inhibition of fuel diffusion inside the anode layer and of the reaction at the TPB. The impairment of reforming activity was observed in the EIS at a later stage. This is for the test in this paper also evident in the stack exhaust gas: the volume flows of CO, CO2 and H2 were approximately constant during the first five hours of naphthalene dosing while the voltages of the cells had already dropped by approx. 25 mV. Even the absolute value of CH4 only rose imperceptibly during this period, but the beginning of its subsequently exponential increase in the exhaust gas can be guessed. During this initial phase naphthalene blocked an increasing number of active centres for electrochemical reactions at the anode so cell voltages dropped while gas conversion across the cell was still nearly constant.
The omission of CH4 and CO as fuel led to an increase of fuel utilization (FU): in normal operation it was 34%; without CH4 54%; without CH4 and CO 75%, which then represented the hydrogen utilization. The last H2 volume flow determined during naphthalene dosing was 0.2 Nl min−1, corresponding to an  of 60%. For a hydrogen utilization of 75% the H2 volume flow would have had to decrease to 0.125 Nl/min. So reforming and WGS were not completely inhibited at the time of shutdown, which was also indicated by the fact that the gas analysis values were not yet stationary. The further omission of CO and CH4 might not have led to a further voltage decrease from a certain point in time: It is possible that then it was no longer the amount of available fuel that was limiting for the cell potential but the diffusion to the anode and the rate of the electrochemical reaction at the TPB.
After the end of the measurement, the stack was dissected at Forschungszentrum Jülich. There were no macroscopically visible carbon deposition inside the stack. The structure of the cells as well as the surfaces inside the stack did not show visible abnormalities. Detailed investigation on possible microscopic changes via SEM and the detection of microscopic carbon deposits via Raman spectroscopy is pending. It is expected that the results will be comparable to the post-test examination of single-cells tested with naphthalene as model tar previously published by Jeong.34 He found that the microstructure of the cells was unaltered but traces of carbon were detectable in the substrate and the anode layer.
Influence of phenol—After initial I–V-curves Stack P was operated on pure syngas at 0.34 Acm−2 for 64 h. Then 2, 4 and 8 g Nm−3 of phenol (475, 950, 1900 ppm) were added to the syngas for 24 h each. With complete reforming these phenol concentrations would have resulted in additional 0.007, 0.014 and 0.028 Nl/min/cell H2, respectively. The temperatures of the phenol-filled tar container necessary to achieve the desired tar concentrations were 74, 87 and 101 °C, respectively. In contrast to the single-cell tests21 the phenol phases were conducted without interruption, only the temperature of the tar container was increased. The tar content was regularly checked using the SPA method. Phenol was detected in all samples from the fuel inlet gas and the measured amount doubled for each phenol phase. In the fuel outlet gas no phenol was detected in any sample.
Figure 5 shows the stack voltage during the test. It was subject to a drift of approximately 25 mV which was caused by the bottom cell whereas the voltage of the top cell was constant. The stack voltage first fell for approx. 20 h after the start of Syn1 and then rose above the original level until Phe3. The reason for this upward drift might have been the shorter reliability tests compared to Stack N. The noise in the voltage signal was due to steady oscillation of the water dosage. During Phe3 a discontinuity occurred at t = 120 h which ended the rise. Apart from this discontinuity, which may be attributed to the known dusting effects of phenol on the substrate,21,35 the stack voltage did not respond to the presence of tar in the simulated bio-syngas. The shape of the I–V-curves recorded during pure syngas and at every concentration of phenol was similar but followed the upwards trends of the cell voltage under load, see Fig. 6. This shows that as in the single-cell experiments, electrochemistry was not affected by phenol within the duration of this test.
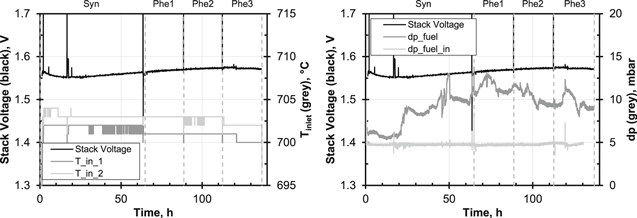
Figure 5. Recorded data of Stack P (two cells). Left: Trends of stack voltage and inlet temperature of bottom cell ( ) and top cell (
 ). Right: Pressure drop on fuel gas side (pfuel) and overpressure at fuel inlet (pfuel,in). Phe1, Phe2 and Phe3 indicate the addition of 2, 4 and 8 g Nm−3 of phenol to the syngas, respectively. Syngas as main gas.
Download figure:
Standard image High-resolution image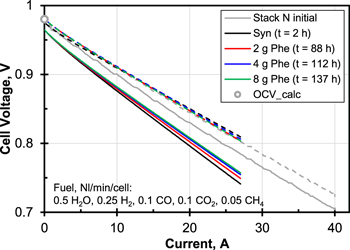
Figure 6. I–V-curves of Stack P on syngas plus 0, 2, 4 and 8 g Nm−3 of phenol together with data from Stack N. Solid lines represent voltage of bottom cell.  , active cell area 80 cm2. Data for Stack P was fitted with a hyperbolic plus linear term for better visibility.
Download figure:
Standard image High-resolution imageNeither did the temperatures in the stack react to phenol but fell during the experiment analogously to the increasing stack voltage; in Fig. 5 the fuel gas inlet temperatures in both layers are shown. The pressure drop across the stack  changed more during Syn1 than during the phenol phases. The overpressure at the inlet
  was constant to a large extent; only starting from the discontinuity at approx. 120 h during Phe3 did a slow increase become apparent. In the previous single-cell experiments21 the pressure drop increased during the dosing of 8 g Nm−3 of phenol since the gas flow was blocked by solid carbon formed by thermally cracked phenol and metal dusting of the substrate. Potentially, the exposure time before the start of dosing of 8 g Nm−3 of phenol—48 h for Stack P vs 144 h during the comparable single-cell test—was not long enough for these phenomena to occur in a pronounced way at Stack P. On the other hand, the shape of the gas flow in the stack was different compared to the ceramic housing in the single-cell experiments: in the stack the manifolds —in which the gas flow is distributed across the width of the cells—were upstream of the cells. Preheated gas was thus supplied in parallel to the cells. In the single-cell housing, on the other hand, the manifold was located underneath the cell, which meant that there was an area in which the residence time of the fuel gas was very long before it flowed along the anode in the channels of the flow field. Due to the longer residence time, it can be assumed that the cracking of phenol took place in this limited area which resulted in the accumulation of soot at the fuel inlet hindering the gas flow considerably. The materials used—Crofer and nickel instead of ceramic, gold and nickel—might also have had different influences on the decomposition of phenol upstream of the cells. Since water droplets had formed in the pipes leading to the differential pressure sensors during the measurement, the signals might have been falsified and an increase of pressure drop—if it had actually occurred—might not have been recorded.
Possible alterations of the anode exhaust gas composition could be monitored by the gas analysis. Besides minor drifts the composition was constant during the test. The analysis was not accurate enough to establish a balance with which the amount of carbon deposited in the stack (see Fig. 7) could have been determined.
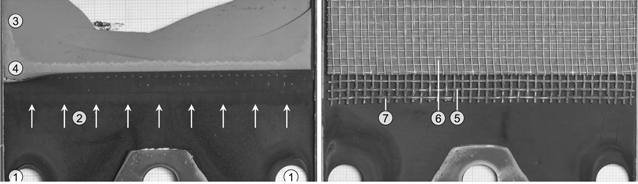
Figure 7. Photos of one layer of Stack P after the tests with phenol. Left: view at the surface of the anode substrate. Right: view at the nickel meshes for contacting. Annotations: fuel inlet (1), fuel gas flow direction in manifold (2), unaltered anode substrate (3), degraded anode substrate (4), (5) coarse nickel mesh, (6) fine nickel mesh, (7) carbon deposition.
Download figure:
Standard image High-resolution imageAfter the end of the measurement the stack was dissected at Forschungszentrum Jülich. Macroscopically visible metal dusting similar to the single-cell tests with phenol as model tar35 occurred on both cells. The substrate on the fuel gas inlet of both cells was discoloured along the entire width of the cell (see the band of brighter gray along the cell in Fig. 7 left). In addition, soot-like carbon deposits were found on the nickel meshes, see Fig. 7 right. Such deposits trigger the dusting of the nickel meshes which in the long run causes a loss of electric contact between substrate and interconnector. In contrast to our previous short-stack test on tar-containing real bio-syngas,12 the amount of deposits was smaller and therefore did not inhibit the gas flow through the stack. It seems that the real bio-syngas contained tar components with a higher potential for carbon deposits. In addition, loose carbon particles were found in the fuel gas manifold, which suggests that phenol was partly cracked upstream of the cells as in the single-cell experiments. Compared to the single-cell tests with phenol,21 the amount of particles was smaller and at the same time the flow cross-section at the gas inlet of the stack was larger. So there was no blockage of the gas flow at this location, which would have increased the pressure drop. A detailed examination of the stack and the cells using microscopy and Raman spectroscopy has not been carried out so far. It would be interesting to find out if the morphology of the carbon deposits was different compared to our previous tests on real tars,12 as it was similarly observed by Lorente et al.7: using temperature programmed oxidation they observed that pure toluene led to more stable carbon deposits compared to a mixture of real tars.7
Conclusions
In addition to previous single-cell experiments with naphthalene and phenol as model tar components, tests were carried out on two two-level short-stacks at 700 °C for investigations under application-oriented conditions. The results of the single-cell tests could be reproduced and broadened with the short-stack tests.
In accordance with literature naphthalene led to a strong decrease in voltage, an increase in cell temperature and to the inhibition of the conversion of methane and carbon monoxide. The latter could be monitored by the analysis of the anode off-gas and led to a higher consumption of the fed hydrogen. All effects partly reversed when the supply of naphthalene was stopped. No full recovery of the stack voltage and gas conversion could be established, even when applying hydrogen plus steam as fuel gas. The I–V-curves confirmed that naphthalene in syngas operation reduced both the OCV and the operating voltage under load. With H2/N2 as fuel gas an over-potential could also be found with persistent naphthalene poisoning, but the OCV was unaffected. This shows that naphthalene not only inhibited reforming and CO shift, reducing H2 partial pressure, but also blocked H2 reactions and mass transfer to TPB. Although no detailed post-test analysis was performed, the initial results suggest that the stack materials—Crofer and nickel—were apparently not strongly affected by naphthalene so no interaction between the model tar and the metallic surfaces seems to have taken place. Likewise, no carbon deposits visible to the naked eye occurred, as it was already the case in the single-cell tests.
Phenol had no detectable influence on cell voltage, temperature, pressure drop and the composition of the anode off-gas. Only post-mortem analysis revealed carbon deposits at the cells and starting metal dusting of the anode support. Spotwise accumulations of carbon were present in the inlet manifold but the Crofer inside the stack appeared unaltered. It can be stated that the nickel used as contacting material at the anode will not be stable when phenol is present in the fuel gas since the nickel meshes were covered with soot which triggers metal dusting. The extent of the effects of phenol was not yet large enough to interfere with the operation of the stack; but in the long run a decrease of performance is to be expected.
For future tests the analysis of the anode off-gas should be extended. Besides CH4, CO, CO2 and H2, the additional measurement of possible gaseous decomposition products like ethylene or propane would be helpful to better understand the decomposition reaction of naphthalene, phenol and other tars and the role of the related intermediates during degradation.
The cells in the stacks were anode-supported ones with a Ni/YSZ anode. The tests showed that the materials applied in their anode are not suitable for operation with tar-containing bio-syngas under the operating conditions applied, especially at a moderate temperature of 700 °C. In a B-IGFC the tar cleaning step which removes or pre-reforms critical components can therefore not be omitted when state-of-the-art cells are used. Future improvement of SOFCs for this application must aim at accelerated reforming of naphthalene and other higher hydrocarbons at the anode in order to avoid performance losses. It is likely that a reforming catalyst other than nickel will have to be used due to its high susceptibility to poisoning of the active sites and its tendency to the formation of carbon deposits. The latter must be prevented as these act as a trigger for metal dusting, which negatively affects both the cells and nickel surfaces inside the stack.
Acknowledgments
The investigations presented here are supported by Deutsche Forschungsgemeinschaft (DFG) which is gratefully acknowledged (SP 367/5-1). Moreover, we would like to thank Ute de Haart and Dr. Quingping Fang for carrying out the reduction of the stacks at Forschungszentrum Jülich and Dr. Carole Babelot for the photographs of the dissected stacks.
: Appendix: Saturation Pressure of Phenol and Naphthalene
In order to obtain a desired concentration of tar in the fuel gas, a constituent equation is necessary with which the saturation vapor pressure  can be calculated as a function of temperature. If the saturation vapor pressure is known, the concentration of tar in the fuel gas in g Nm−3 can be calculated:
Here  is the volume flow of carrier gas through the tar container and
  is the total volume flow at the anode. It is assumed that the gas behaves ideally and reaches saturation in the tank (partial pressure = saturation pressure), given the residence is high enough.
  is the volume of 1 mole of an ideal gas.
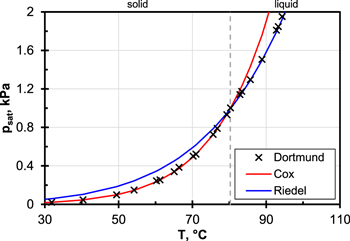
For the calculation of the saturation vapor pressure, a distinction must be made between whether the tar is present in a solid or liquid state, i.e. whether an equilibrium is established between the solid and gas phases or between the liquid and gas phases. For the first case the Cox equation can be used for naphthalene
with parameters a0 = 3.272310, a1 = −2.663498 · 10−2, a2 = −2.929123 · 10−9,  ,
,  .36 For temperatures above 80.3 °C, i.e. for the gas/liquid equilibrium, the Riedel equation can be used
For naphthalene the coefficients are  ,
,  ,
,  ,
,  and
and  .37
.37
As can be seen in Fig. A·1 the two equations in the respective validity ranges very well represent the experimentally measured saturation vapor pressure of naphthalene.38 In order to determine the necessary container temperature for a desired tar concentration, the correct equation can be selected with the aid of the required saturation vapor pressure.
Figure A·1. Trend of saturation pressure of naphthalene calculated with Cox and Riedel equation. Experimental reference values are found in Ref. 38.
Download figure:
Standard image High-resolution image
For phenol the saturation pressure was calculated with the Riedel equation. Between 314 (melting point) and 694 K the coefficients are  ,
,  ,
,  ,
,  and
and  .37 For temperatures below 314 K other coefficients for a solid/gas equilibrium must be applied. No reference data could be found for phenol so it is assumed that the coefficients from Ref. 37 are of the same quality as for naphthalene.
This website http://www.thersites.nl/completemodel.aspx39 offers an online calculation of the dew point temperatures for gases containing defined amounts of tars.