
Abstract
Lithium Sulfur (Li-S) batteries are a promising energy storage technology with very high theoretical limits in terms of specific capacity and specific energy. However, these batteries suffer from high self-discharge rates, associated with a low coulombic efficiency due to the polysulfide shuttle mechanism. A better understanding of the self-discharge characteristics and suppression of the self-discharge is of great interest for most applications. Hence, a continuous self-discharge current measurement method is applied to evaluate the self-discharge behavior of a Li-S battery, based on a corrected reference open-circuit voltage. The result is a continuous self-discharge current measurement method, that investigates the self-discharge in the upper plateau of a Li-S battery at 10 °C and 25 °C. This self-discharge current displays a plateau and extended balancing times directly before this plateau and is validated by a discrete self-discharge current measurement method at 10 °C and 25 °C. Furthermore, the activation energy is continuously calculated for the upper plateau and compared to a discrete reference measurement.
Export citation and abstract BibTeX RIS

This is an open access article distributed under the terms of the Creative Commons Attribution 4.0 License (CC BY, http://creativecommons.org/licenses/by/4.0/), which permits unrestricted reuse of the work in any medium, provided the original work is properly cited.
Li-S batteries are a highly promising future electrical energy storage technology for batteries with a high specific energy and high specific capacity. This technology is a close-to-market, post Lithium Ion (Li-ion) technology. The potential practical specific energy is estimated to be around  .1 A further important advantage of this battery, is the low material costs of the cathode.2 On account of the increased gravimetric energy compared to state-of-the-art Li-ion cells, this technology can be used in weight-dependent applications and has already been used in some niche applications of unmanned aerial vehicles (UAV), as pointed out in Ref. 3. These technological advantages are offset by known problems such as a high degradation rate, low sulfur utilization, a high self-discharge current known as the polysulfide shuttle mechanism and a low conductivity of the sulfur. These problems are related to the problems of multiple redox reactions, high electrolyte to sulfur (E/S) weight ratios4 and decreasing reactivity as well as decreasing reaction kinetics associated with a decreasing State of Charge (SoC).5 Under these circumstances, the intermediates in polysulfide chains gradually decrease, ultimately leading to the precipitation of lithium polysulfide Li2S. Equation 1 shows the overall redox reaction.

Figure 1 shows a galvanostatic discharge voltage profile at a low constant discharge current close to the open-circuit voltage (OCV) of a Li-S cell. This discharge profile is split into two parts: the upper plateau is represented by I and II and the lower plateau by III. The two plateaus are connected by the superimposed voltage dip at approximately 75% SoC. Some Li-S dependent mechanisms can be assigned to the specific plateaus. Li2S only precipitates in the lower plateau6 whereas the shuttle mechansim usually occurs in the upper plateau.
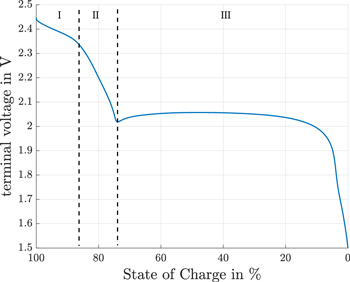
Figure 1. Terminal voltage of a Li-S cell at a constant discharge current of  and an environmental temperatur of 10 °C.
Download figure:
Standard image High-resolution imageThis study focuses on the relevant polysulfide shuttle mechanism, which is associated with cell degradation and also causes a low coulombic efficiency (CE). There is ongoing research into polysulfide shuttle suppression of this technology and improvements have been reported in the cell assembly, materials and electrolytes. The prevalent method to prevent this shuttle mechanism is to add the co-salt LiNO3.  anions are the key to suppressing polysulfide shuttle by catalyzing polysulfides to elemental sulfur.7 This leads to a high CE for some tens of cycles. Nevertheless, the drawback of this additive is an irreversible solid electrolyte interface (SEI) that forms on the anode and the cathode. This does not completely suppresse polysulfide shuttle and therefore continues to consume LiNO3.4 Finally, LiNO3 depletes in the cell, which is associated with an irreversible active material loss. Furthermore, LiNO3 reduces to LiNO2 at cell voltages below 1.8 V, which also reduces the electrical cell performance of this already low power technology.7 In order to improve CE, research coin cells benefit from an increased amount of electrolyte, associated with an increased amount of reduceable LiNO3. Further reasearch was carried out into the cathode structure. Micropores in the cathode,8 a nafion coated cathode,9 a nafion coated separator10 and a mixed conduction membrane in the middle of the seperator11 were therefore investigated. In Ref. 12, a transition metal oxide replaced LiNO3. These methods showed beneficial results in polysulfide shuttle prevention. Nevertheless, the E/S weight ratio is more critical than sulfur utilization for cells with high energy density and should be below 3 according to Ref. 2. This aim has not yet been achieved.
These methods were evaluated with research coin cells and often combined with a post-mortem analysis and extended cycling to test the CE behavior. In order to evaluate these improvements, methods for quantification and modelling of self-discharge currents for cells with high energy density had to be designed. Basic measurements and modelling have already been examined by Mikhaylik et al.13 They began by introducing a self-discharge model using a first-order reaction. The resulting rate constant was used to validate the discharge capacity of the upper plateau at different discharge currents. The available sulfur mass and the rate constant allowed them to calculate the self-discharge current. The Arrhenius equation was then used to include temperature influences. In Ref. 14 a direct shuttle current measurement (see section "Direct shuttle current measurement methode") and a basic shuttle flux model were introduced. In their study, the authors used potentiostatic charging to measure the shuttle current at a specific voltage level. A charge current compensated the self-discharge current in order to keep a constant terminal voltage. This procedure was used to measure 9 irregularly distributed voltage levels of the upper pleateau. The chemical model they used in their study based on the concentration gradients of different polysulfide species in the cell. This charge current compensation method was also used in Refs. 15 and 16 to create a mathematical model of the self-discharge behavior with respect to SoC and temperature. The high self-discharge is one of the main reasons for the low CE of the Li-S cells as shown in Ref. 17.
To the best of the author's knowledge, all existing methods to measure the Li-S self-discharge current are based on voltage discretisation, whereas this study focuses on a continuous quantification of Li-S self-discharge currents in the upper plateau. The results in Ref. 14 identified a greatly reduced shuttle current in the lower plateau. Due to these findings, our study focuses solely on self-discharge in the upper plateau, which is measured for 10 °C and 25 °C.
Phenomenological cause of the shuttle effect
The shuttle mechanism usually takes place in the upper plateau with long polysulfide chains (Li2Sn n > 4). It is assumed that the multiple reaction mechanism in the upper plateau occures at the same time and depends on the SoC and the electrochemical kinetics. These reactions yield multiple Nernst potentials, one for each reaction. The standard equilibrium voltages of these different Nernst potentials differ from each other. Therefore, the terminal voltage of a Li-S cell is superimposed by multiple Nernst potentials. The reduction reactions used in this study are Eqs. 2 to 4. This reduction mechansim is common in literature. The investigations by Cuisinier et al.18 omit the reduction of solid sulfur S8 to  as the
  species seems to be further reduced to
  directly. The species Li2S6 and Li2S4 seem to be most stable long-chain intermediate polysulfides.19 Nevertheless, the reaction mechanism of Li-S cells has not yet been fully understood.
In region (I) (Fig. 1), the elemental sulfur is reduced to polysulfides with n = 6 as proposed in Eq. 2. During charging the polysulfides are not completely oxidized back to nucleations of elemental sulfur.13 This means that the initial species composition of a fully charged Li-S cells is a mixture of dissolved polysulfides and nucleations of elemental sulfur.

In region (II) (Fig. 1), the polysulfides with n = 6 are further reduced to polysulfides with n = 4 (Eq. 3).
In region (III) (Fig. 1), the polysulfides with n = 4 are further reduced (Eq. 4) as proposed in Ref. 13.

The reduction reaction mechanism of Eqs. 2 to 4 consists of a capacity of  . This reaction is proposed in Ref. 13 due to low lithium disulfide solubility in electrolyte solvents and slow electrochemical kinetics. This reaction is also acceptable for the measurements of our Li-S cells.
In Li-S cells, the mass of metallic lithium is usually higher than necessary in order to compensate losses caused by side reactions. A more important influence is the incomplete reduction reaction described in Eq. 4, which does not consume the available Li compared to the complete reduction reaction forming solely Li2S (Eq. 1). The findings in Ref. 7 show, that the concentration of Li varies only slightly during cycling. Hence, the cause for the cell voltage decrease is located in the cathode half cell. These assumptions were used in Ref. 20 to model a full Li-S cell.
The shuttle mechanism mainly occurs in the upper plateau. Figure 2 illustrates the occurance of the shuttle from an electrical an a chemical point ov view. From a chemical point of view, the reason for this mechanism is the high solubility of long-chain polysulfides (n > 4) in the electrolyte. Due to this solubility, the polysulfides diffuse toward the negative lithium anode where they are reduced. Along with this reduction, a change in concentration of polysulfide species must take place at the cathode and the anode. The increasing concentration of short-chain polysulfides at the anode leads to a flux of these species back to the cathode. According to this concentration change, fluxes of short-chain polysulfides from anode to cathode are accompanied by fluxes of long-chain polysulfides from cathode to anode.14 This is called the shuttle mechanism. The reduced species arriving at the cathode are oxidized to long-chain polysulfides under the consumption of active material. This leads to a reduced Nernst potential. The exact side reactions remain unknown.
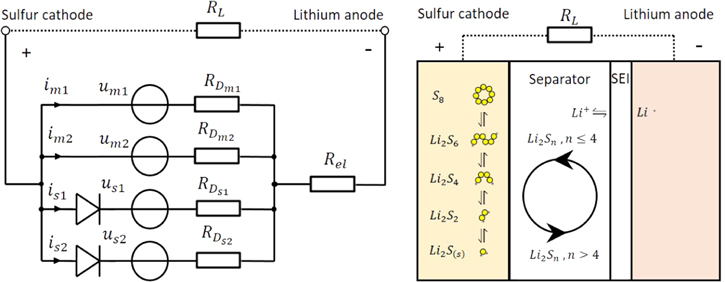
Figure 2. Shuttle mechanism from an electrical point of view (left) and from a chemical point of view (right).
Download figure:
Standard image High-resolution imageFrom an electrical point of view, there has to be a source and a sink for the self-discharge current. Each Nernst potential consists of a voltage source calculated by the Nernst equation and a charge transfer resistor in series with the voltage source. Such voltage sources are calculated for each redox reaction of Eqs. 2 to 4. These voltage sources are connected in parallel and form the source of the self-discharge current. The sink for the self-discharge current are side reactions, which are also voltage sources and therefore consist of Nernst potentials and charge transfer resistors in series. These side reactions are unidirectional (see diodes in Fig. 2). The side reactions have lower equilibrium Nernst potentials than the main reactions and forces reactions of active material along with self-discharge currents inside the cell. The difference in potential between the voltage source of the main and the side reactions and the charge transfer resistors define the magnitude of the self-discharge current. Thus, the shuttle suppression actions are interpreted as an increase in the charge transfer resistances of the side reactions.
The self-discharge of Li-S cells depends on several properties. First and foremost of these is the SoC. The SoC determine the concentration of each species in the cathode, which defines different Nernst potentials. Moreover, the difference between potentials in main reactions and side reactions depends on the Nernst potentials. According to Ref. 21, the SoC-dependent species concentration in the electrolyte causes impedance evaluation in the upper plateau. Second, the setup of the cell with its given thickness and porosity of the electrode and the amount of electrolyte determine the self-discharge current. These coefficients mainly influence the diffusion of polysulfide species. Third, the amount of electrolyte and sulfer loading determines the amount of polysulfides which take part in the shuttle process. Fourth, the surface areas of the cathode and anode and the kinetics of each reaction determines the shuttle current. Fifth and last, cell aging further influences the mentioned parameters. Moreover, there is an unrecoverable precipitation loss of active material during the shuttle process.14 This loss is modelled in Ref. 22.
Experimental
In this self-discharge study, we use a commercial 10 Ah cell. The electrolyte of this cell contains a certain amount of LiNO3, in order to prevent the cells' self-discharge. This cell is cycled by a BaSyTec CTS with a 5 A channel. For static environmental temperatures, a Weiss thermal chamber is used at two different temperatures of 10 °C and 25 °C. Electrochemical Impedance Spectroscopy (EIS) is carried out with a Gamry Reference 3000. The cell voltage range lies between 2.45 V and 1.50 V.
Direct shuttle current measurement method
In order to measure the self-discharge current, a direct shuttle current measurement method is used in the upper plateau. This method measures the potentiostatic charge current into the cell. Figure 3 illustrates a basic sequence of this method.
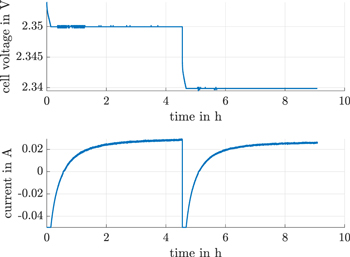
Figure 3. Direct shuttle current measurement method with the constant voltage (CV) in the upper plateau and a transition from one fixed voltage level to another. The transition discharge current is limited to −50 mA by the battery cycler.
Download figure:
Standard image High-resolution imageSelf-discharge currents are measured at equidistant and potentiostatic terminal voltage steps of ΔU = 10 mV. First, the cell is discharged to a new fixed voltage value by a constant voltage (CV) discharge. In addition to this constant voltage (CV), the discharge current limit is −50 mA. Second, the equilibrium cell voltage falls below the fixed constant voltage (CV) level during discharge, which leads to a reduction of this discharge current down to zero. The cell-inherent self-discharge then becomes dominant and therefore a charge current is applied to compensate the self-discharge current. As a third effect, the compensation charge current ends in a steady-state current after approximately 4 h. This steady-state current is directly attributable to the shuttle current. Finally, the next voltage level is measured. The fixed voltage levels are corrected using the ohmic electrolyte, the ohmic charge transfer resistor and the steady-state current. The negative current corresponds to the reduction of polysulfide species at the cathode. The positive current corresponds to the oxidation of polysulfides to form long-chain polysulfides of active material. This positive, steady-state current is equal to the rate of oxidation of polysulfied species so as to maintain the concentration at the cathode at the measured voltage level.
Continuous shuttle current measurement method
The continuous self-discharge measurement method introduced in this section allows a continuous self-discharge current calculation based on the voltage and capacity relationship between two consecutive discharge cycles. The complete measurement procedure is shown in Fig. 4. The method consists of an initial condition and three parts. In the initial condition, the cell is fully charged. The full cell is ensured by a constant current (CC) charge of 0.1 C up to the cutoff voltage of 2.45 V, followed by a constant voltage (CV) charge. Due to the high production diversification of Li-S cells, the constant voltage (CV) charge ends after a defined time of 4 h. This time span ensures a steady-state self-discharge current, the same as used in the direct shuttle current measurement method (see section above). Thus, the cell is in an equilibrium state and charged maximally.
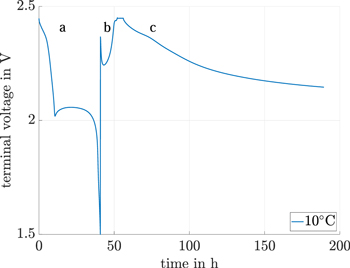
Figure 4. Continuous shuttle current measurement method with the terminal voltage over time in part (a) and (b) during the constant current cycle and the OCV of the upper plateau during part (c) without an applied discharge current.
Download figure:
Standard image High-resolution imageFirst part (a): a galvanostatic discharge at a low discharge current of  follows the initial condition and measures the capacity of the upper plateau. This low discharge current ensures a small difference between the terminal voltage and the OCV.23
Second part (b): the cell is again charged by a constant current constant voltage (CCCV) method. A constant voltage (CV) time span of 4 h is used. During this constant voltage (CV) time span, an additional direct shuttle current value is measured based on the measurement method described in the section above. This directly measured self-discharge current value can be compared to the continuous shuttle current for the cutoff voltage.
Third part (c): the terminal voltage in this part is only reduced by the consumed active material due to the self-discharge current. Thus, the measured terminal voltage is the OCV reduced by polarization effects of the self-discharge current. In order to represent the OCV, the measured terminal voltage is corrected by the amount of polarization effects. This terminal voltage is the closest measureable equilibrium cell voltage and is predestined to measure the cell impedance. An Electrochemical Impedance Spectroscopy (EIS) is measured every five hours or every ΔU = 10 mV , whichever occurs first. In order to keep the influence of Electrochemical Impedance Spectroscopy (EIS) measurement on the inherent self-discharge as low as possible, the minimal measured frequency was 200 mHz with an effective current of  . The measurement dependent charge neutrality and the high frequencies compared with the low measurement currents justifies the assumption of a neglegtable interference on the cell-inherent self-discharge.
The calculation method is based on the linkage between the upper plateau voltage level of the cells' galvanostatic terminal voltage in part (a) with the same voltage level in the terminal voltage in part (c) (see Eq. 5). This link establishes a relationship between the self-discharged terminal voltage and the discharged capacity. The self-discharged capacity is then calculated by Eq. 6.


tS is the self-discharge time in part (c), QD is the discharged capacity of the upper plateau in part (a), uvdip represents the voltage at the transition of the upper plateau to the lower plateau (see Fig. 1). QS is the self-discharged capacity in part (c) and  represents the voltage linked between the voltages in part (a) and part (c) based on Eq. 5.
In order to link the voltages in part (a) with part (c), both terminal voltages have to be injective. By focusing on the upper plateau, it is obvious (see region I and II in Fig. 1), that the OCV of this Li-S cell is injective until the voltage dip. We therefore investigated the upper plateau for self-discharge ending at the bottom of the voltage dip between the plateaus. Finally, the inherent self-discharge current is calculated by the derivation of the self-discharged capacity in Eq. 7.

Open-circuit voltage
In order to improve the continuous self-discharge calculation method, the terminal voltage of the constant current discharge of part (a) in Fig. 4 has to be replaced by the OCV of the cell. This section will focus on the quantification, estimation and reduction of these OCV measurement errors. The continuous self-discharge current is evaluated at environmental temperatures of 10 °C and 25 °C. The self-discharge current is lower at 10 °C. Therefore, it is beneficial to use the terminal voltage at 10 °C constant current discharge to calculate the OCV. The resulting OCV linked to each terminal voltage in part (c) for 10 °C and 25 °C is then used for self-discharge current calculations. Such an OCV should depend soley on entropy influences caused by temperature.
In this section, the term self-discharge is used for the discharging in part (c) and the term constant current (CC) discharge stands for the discharging in part (a). Four main failure sources have to be reduced to transform the measurements of part (a) in Fig. 4 to an OCV.
First, there is a voltage drop across the cell impedance during the galvanostatic discharge due to polarization. Thus, the measured terminal voltage is lower than the true OCV. The cell impedance was measured parallel to the self-discharge voltage measurement (Fig. 5). The impedance is linked between the self-discharge sequence (part (c)) and the CC discharge sequence (part (a)) by using the same terminal voltages as used for capacity linking (Eq. 5). The impedance measurement result in the electrolyte resistance and the charge transfer resistance. These results are used to correct the voltage drop during the CC discharge. The minimum voltage drop during the CC discharge cycle is calculated as 3 mV and measured as 4.2 mV for a fully charged cell. Due to the increase in impedance during the upper plateau, the maximum voltage drop is calculated as 20 mV at the voltage dip between the upper and the lower plateau. Additional polarization effects caused by impdances for frequencies <200 mHz are not measured and therefore not compensated.
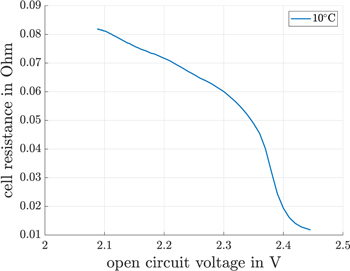
Figure 5. Summation of electrolyte and charge transfer resistance for 10 °C.
Download figure:
Standard image High-resolution imageA small impedance error during the CC discharge occurs by linking the impedance from self-discharge voltage because the linked CC discharge voltage includes polarization effects. For voltages above 2.42 V and voltages below 2.36 V, an impedance error of <0.7% occurs for every mV the corrected OCV differs from the accurate OCV. This error rises to a maximum of 3% at 2.38 V, at the maximum of the impedance gradient (see Fig. 5). The impedance data is used to calculate the electrolyte resistance and the charge transfer resistance. The charge transfer resistance is equal to the linear resistance described by the Butler-Volmer equation for overpotentials lower than ±10 mV,24 which is given in part (a) and part (c). Thus, the summation of the electrolyte resistance and the charge transfer resistance are used to correct the polarization voltage drop caused by the discharge current during the CC discharge cycle.
Second, the cell temperature rises due to power dissipation across the real parts of the impedance. Based on the Arrhenius equation, it is clear that the self-discharge reaction of Li-S cells is very temperature-sensitive. The cell heating and the self-discharge current influences the choice of the discharge current in the CC discharge cycle. The self-discharged capacity that is not measured during the CC discharge cycle, increases for smaller discharge currents due to the longer discharge time of the upper plateau. Moreover, a high discharge current potentially influences the self-discharge current due to cell heating. As seen in Fig. 4, the self-discharge time at 10 °C during self-discharge cycle is many times longer than the discharge time during the CC discharge cycle. Thus, a low discharge current of  was chosen to obtain a very small power dissipation and a reasonable discharge time for the upper plateau during CC discharge cycle. Another advantage is that the self-discharge current is reduced, whereas cell impedance gradually increases with a decreasing SoC in the upper plateau. This is beneficial for the cell heating caused by the self-discharge current. Using the measured impedance data, the power dissipation during the CC discharge in the upper plateau is below 5 mW and therefore negligible.
Third, the true equilibrium OCV changes with variations in temperature because of entropy. There are no entropy influences on the self-discharge current calculations at 10 °C , since the corrected OCV is based on the 10 °C CC discharge cycle. Using the OCV at 25 °C an entropy dependent error is included because of thermodynamics. Since the self-discharge current is to high, it is not possible to measure the entropy, which needs a long measurment time. Moreover, the temperature change causes a voltage change in the mixed potential. This results then in a change of the species composition. This species composition change, mainly causes a change of the cells' mixed potential. Therefore, an ordinary entropy measurement by varying the ambient temperature is not applicable for Li-S cells.
Fourth, the cell experiences a self-discharge during the CC discharge cycle, followed by a reduced capacity of the upper plateau. With a high SoC in particular, the cell is discharged by an inherent self-discharge current in the range of the reference discharge current of  . It is clear that the non-measurable superimposed self-discharge current reduces the discharged capacity and hence the calculated self-discharge current in the section before. This correction was omitted because it was not needed for the results.
Results and Discussion
In this section, the continuous self-discharge current is evaluated and compared to the directly measured self-discharge current.
The corrections in section "Open-circuit voltage" do not include all polaristion effects on the CC discharge cycle. The cell suffers additional polarisations for discharge current frequencies lower than 200 mHz during the CC cycle. These impedances are not measured and therefore not compensated. Furthermore, the entropy is missing for 25 °C discharge. For reasons of simplification, we considered a constant voltage offset added to the calculated OCV voltage of the upper plateau in order to include the missing influences. We consequently assume an equal low frequency impedance throughout the whole upper plateau and ignore the nonlinearity of the entropy. The OCV voltage has quite a big influence on the invented continous self-discharge method. A sensitivity analysis is performed to investigate the influence of the necessary additional voltage offset. This analysis is based on a linear parameter change to the additional offset voltage added to the corrected OCV based on Eq. 8.

uOCV_S is the OCV used for the continuous self-discharge calculation. uOCV_C stands for the corrected OCV in the section before and uOff is the evaluated offset voltage.
Figure 6 shows the results of this sensitivity investigation of the OCV for an environmental temperature of 10 °C. The calculable self-discharge current range reduces by the offset for offset voltages < 0 mV. In general, Fig. 6 shows only the self-discharge currents after the startup transient phenomen of the filter that is used. Depending on the offset voltage, there is a great difference in the self discharge plateau (between 2.3 V and 2.4 V). The voltage plateau completely vanishes at an environmental temperature of 10 °C and an offset voltage of −10 mV. For offsets lower than these −10 mV, we see an increase of the self-discharge current throughout this plateau, whereas a reduced self-discharge currents are calculated for voltage offsets higher than −10 mV. For OCV voltages higher than 2.4 V, the self-discharge current increases with increasing offset voltages. In addition, the self-discharge gradients before the voltage plateau between 2.37 V and 2.4 V increase with increasing voltage offsets. It is obvious that mathematically speaking, the OCV level has a great influence on the self-discharge current in the continuous shuttle current measurement method. The reason for this plateau can be explained mathematically by a variation of the terminal voltage's gradient between 60 h and 80 h (part (c) in Fig. 4). In this time span, the negative gradient initially increases and then decreases. Due to this variation in gradient, a self-discharge plateau is calculated by the continuous shuttle current measurement methode in section "Continuous shuttle current measurement methode". One possible explanation for this is the increased reaction of S8 to  described by Cuisinier et al.18
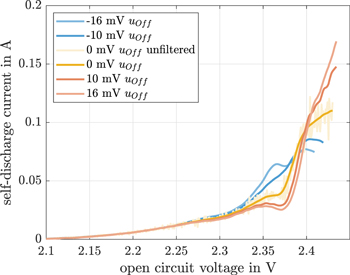
Figure 6. The continuous shuttle current calculation for 10 °C visualized over the OCV for uOff of 0 mV, ±10 mV and ±16 mV.
Download figure:
Standard image High-resolution imageDuring the continuous shuttle current measurement, a shuttle current is measured at 2.448 V between the self-discharge cycle and the continuous cycle by the direct shuttle current measurement method. This value is marked by a cross in Fig. 7. This value is not exactly the same as the continuously calculated self-discharge current at 2.448 V but does correlate very well for 10 °C. Nevertheless, it does not fit for 25 °C due to the transient behavior during the beginning of the measurement of the reference OCV. The findings in Ref. 15 show a decline in the gradient of the self-discharge current between 2.35 V and 2.38 V. We also observed this gradient decline in our findings (see Fig. 7). A further consistency is the voltage shift of the gradient decline by temperature to lower voltages with increasing temperatures.
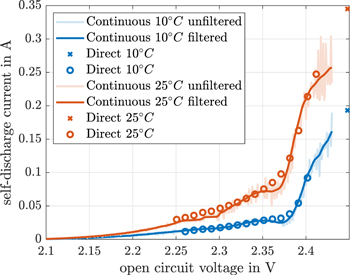
Figure 7. Continuous and direct self-discharge current at 10 °C and 25 °C over OCV of the cell. The cross at 2.448 V marks a direct self-discharge current measured during the 4 h constant voltage (CV) charge between the capacity cycle and the self-discharge cycle during the continuous self-discharge current measurement (10 °C in blue and 25 °C in red).
Download figure:
Standard image High-resolution imageA least-squares optimization fitting routine was used to obtain the best offset voltage for our continuous self-discharge measurements. We minimized the difference between the direct self-discharge current and the continuous self-discharge current at each direct self-discharge measurement (see Eq. 9). The result is an offset voltage of +16 mV for the self-discharge current at 10 °C and +3 mV for the self-discharge current at 25 °C. As mentioned above, the reasons for this offsets are the entropy and the missing corrections of low frequency impedances. Based on these findings, we suppose the existence of a self-discharge plateau.
uOff is the evaluated offset voltage, D represents the direct self-discharge measurement and C the continous self-discharge measurement.
Figure 7 shows the continuous and the direct self-discharge current over the OCV. During the self-discharge experiment at 25 °C, there was an interruption between 2.3 V and 2.28 V. This led to an invalid horizontal line. Unfortunately, an interpretation of the continuous self-discharge current above 2.43 V is not possible due to derivation calculations and the initial transient behavior of the CC discharging. It is obvious that the self-discharge current falls with a decreasing voltage, which is concurrently reduced by a decreasing OCV. This self-discharge current reduction could indicate that the equilibrium potentials of the side reactions converge toward the equilibrium potential of the main reactions. Thus, the difference between the equilibrium voltage of the side reaction and the main reaction reduces when the self-discharge current is reduced. The charge transfer resistance of the side reaction would otherwise rise and be accompanied by smaller self-discharge currents. The unwanted loss of active material is finally reduced to almost zero at the voltage dip.
The direct self-discharge current values decrease repetitively and have no self-discharge plateau (see Fig. 7). This is in line with the findings in Ref. 15. The aperiodic current behavior in the direct measured self-discharge current (see section "Direct shuttle current measurement method") is used to calculate an eigenvalue of a first order model for each voltage level, based on a least-squares optimization fitting routine. This nonlinear eigenvalue is OCV-dependent. The inverse of these eigenvalues are balancing time constants. These time constants are illustrated in Fig. 8 for the discretisized voltages. Due to the low maximum discharge current of −50 mA from one voltage measurement value to another (see Fig. 3), the concentration gradient of active material is close to equilibrium. Thus, the transient balancing time is caused by the multiple main and side redox reactions, which are the reason for the self-discharge of the cell. In order to balance the side reactions, this transient time is a balance process caused by the capacitances and the charge transfer resistances of the multiple reactions. A peak in this balancing time is seen at 2.38 V. An offset exists between the transient balancing time constant measurements at 10 °C and 25 °C , which shows temperature dependency caused by the Ahrrenius equation.
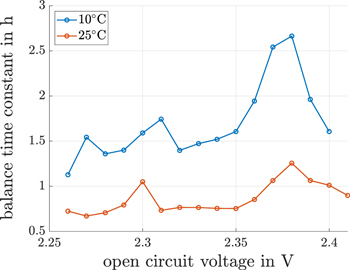
Figure 8. Charge balance transient times caused by multiple redox reactions over the OCV based on the transient charge current of the direct shuttle current measurement method at the constant voltages at 10 °C and 25 °C.
Download figure:
Standard image High-resolution imageIt is quite interesting to note that the balancing time constant peak is some way before the described plateaus of the continuous self-discharge current. What is also interesting is, that the peak of this balancing time matches the gradient peak of the impedance of the upper plateau (see Fig. 5). The charge balancing time gradient stays negative throughout the voltage range of the self-discharge plateau between 2.38 V and 2.35 V. This negative gradient of the charge balancing time constant might be the reason for the self-discharge current plateau. Starting with mixed polysulfide species concentrations at 2.38 V, the balancing of polysulfides increases up to 2.35 V, as is also reflected in a reduction of the charge balancing time. This drop in the charge balancing time could lead to a higher amount of reduceable polysulfides available in an equivalent time span, which leads to the self-discharge plateau. With this interpretation, we should see a self-discharge current reduction between 2.41 V and 2.38 V over the positive charge balancing time constant gradient. However, this could not be identified due to the very high self-discharge current gradient in this voltage range. There is another quite good correlation between the continuously measured self-discharge current and the directly measured self-discharge current for voltages above 2.38 V and voltages below 2.33 V.
The electrochemical kinetics of the self-discharge processes are greatly temperature-dependent. This dependency is expressed in the Arrhenius equation for the reaction rate. Using the directly and continuously measured self-discharge currents the activation energy of the self-discharge process is calculated using Eq. 10.

iself is the self-discharge current, A is the pre-exponential factor, Ea stands for the activation energy, R is the universal gas constant and T is the absolute temperature of the self-discharge measurement. We assume A to be temperature-independent for these small temperature range.
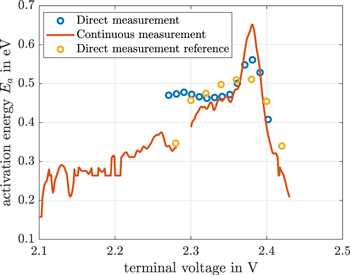
The resulting activation energy has to be a superimposed activation energy of multiple side and main reactions. Nevertheless, there might be periods of single rate determining processes in the upper plateau. In these periods the activation energy could be attributed to specific reactions. The calculation of the activation energy based on two temperature experiments is not reliable. Therefore, we used a Li-S cell of the same type in order to get a reliable activation energy. The activation energy is independet of sulfur loading by focusing on the terminal voltage. The new cell was used to directly measure the self-discharge currents at temperatures of 15 °C, 20 °C, 25 °C and 30 °C with a great fit of the Ahrrenius equation.
The activation energy of the direct measurements of the former cell at 10 °C and 25 °C, the continuous measurements of the former cell and the measurements of the new cell are shown in Fig. 9. The interruption of the continuous self-discharge experiment is seen between 2.3 V and 2.28 V. There is a good correlation between all measurements for voltages above 2.39 V. The correlation between the reference measurement and the continuous measurement is acceptable for voltages between 2.36 V and 2.28 V. All three measurments show a maximum of the activation energy around 2.38 V. It is quite interesting to note that these peaks correlate with the balancing time constant peak in Fig. 8 and is some way before the plateaus of the continuous self-discharge current. Moreover, this peak correlates with the great gradient change of the self-discharge observed at 2.38 V in Fig. 7. This seems to be accompanied by a change of the self-discharge reaction. Nevertheless, the peak in the continuous activation energy at 2.38 V is comparatively large for the continuous measurement. For voltages between 2.35 V and 2.2 V the activation energy decreases repetitively. It seems to end in a final value around 0.25 eV at 2.15 V.
Figure 9. Continuous and direct activation energy calculation. Blue and red are using 10 °C and 25 °C data. Yellow is using direct measurements as a reference of a different cell at temperatures of 15 °C, 20 °C, 25 °C, and 30 °C.
Download figure:
Standard image High-resolution image
The continuous activation energy calculation assists in identifying the underlying self-discharge mechanisms.
It is known that the Li-S cells have a high cycling cell degradation. As already mentioned, this is due to the consumption of LiNO3 and the electrolyte depletion. Particular mention is made of an irreversible loss of active material in Ref. 14 during constant voltage experiments in the upper plateau. Thus, a cell degradation cannot be observed, and it seems to be small enough that the degradations can be ignored in this study. In order to consider this ageing mechanism of the cell in our continuous self-discharge current measurement, an additional reduction of dissolved polysulfide must be assumed. This would lead to a local higher self-discharge current as the lost active material reacts to a lower order polysulfide.14 This study focuses on reversible capacity losses. Therefore, the higher discharge current and irreversible active material loss due to the comparatively slow reaction rate is ignored.
Conclusions
In summary, we investigated the self-discharge in Li-S cells based on the shuttle mechanism in the upper plateau. We developed a continuous calculation method to evaluate these self-discharge currents and the activation energy. This method provides a better insight into the shuttle mechanism. The basis of this calculation method lies within a corrected open-circuit voltage. Therefore, the open-circuit voltage was corrected by a discharge-dependent impedance voltage drop and by an additional offset voltage. The importance of a precise OCV was investigated by a sensitivity analysis of this offset voltage. An offset voltage was calculated for the continous self-discharge findings by comparing the continuous self-discharge currents with direct measured self-discharged currents. Finally, this offset voltage is temperature-dependent due to entropy influences. The corrected open-circuit voltage was then used to calculate self-discharge currents at 10 °C and 25 °C and the activation energy. The direct self-discharge currents were measured at discretised voltage levels. The self-discharge was therefore balanced by a charge current.
We found an interesting self-discharge plateau between 2.38 and 2.35 V with this methode. Nevertheless, the directly measured self-discharge currents do not show a self-discharge plateau. An evaluation of the transient behavior of the direct self-discharge currents shows a rise in charge balancing times right before the self-discharge plateau. This peak correlates with a peak in the activation energy, which seems to be accompanied by a change of self-discharge reaction. The reduction of the charge balancing times at the start of the self-discharge plateau are presumably the reason for the self-discharge plateau. These findings are especially valuable for modeling Li-S cells and evaluating of shuttle suppression actions.
A focus of further work will be the measurement of temperature influences on Li-S cells. These measurements are necessary to develop temperature-dependent models, especially for the upper plateau. Furthermore, investigations have to be carried out into the aeging influences on the self-discharge current.