
Abstract
Lithium copper tin silicon oxide was prepared from their precursor compounds using Brij surfactant and different sources of Si such as  , SiC, and
  . A hydrothermal autoclave method was used in the first stage of the preparation. X-ray diffraction characterization revealed that the crystal structures of these compounds were tetragonal. Scanning electron microscope investigation showed that the particle size morphology of
  is larger than that of
  . Electrochemical impedance spectroscopy explained that the cell prepared from the
  electrode using
  precursor had a lower charge-transfer resistance
  than that of
 . Furthermore, the reversible specific discharge capacity of the
  cell was 870 mAh/g in comparison with 780 mAh/g for the
  cell after 100 cycles.
Export citation and abstract BibTeX RIS
Rechargeable lithium batteries have been considered an attractive power source for a wide variety of applications in popular electronic devices such as mobile telephones, video tape recorders, and laptop computers. Nowadays, these batteries are being scaled-up for prospective use in electric vehicles and energy storage. Therefore, the development of lithium batteries into advanced utilities is considered an important goal to meet a great demand. Different types of active materials have been investigated for both positive and negative electrodes.1–8
To develop high capacity anode for lithium-ion batteries, silicon and some metals that can alloy with lithium at a high molar ratio are being exploited and developed as promising anode materials.9
Tin-based oxides have attracted much attention, as they have been considered as a potential substitute for the current graphite electrode (theoretical capacity  ) primarily on the basis of their higher theoretical reversible specific capacity (e.g.,
  for
for  ).1, 2
When  was used as the anode material of lithium-ion batteries, tin works as the virtual part, and its reversible capacity is based on the formation and decomposition of lithium tin alloys, LiSn,
  ,
,  ,
,  ,
,  , or
, or  .8
.8
The practical application of  , however, is hampered by poor material cyclability arising from the large specific volume change (300%) in repetitive charging and discharging of the battery, which causes mechanical failure and the loss of electrical contact at the anode.3–6
  undergoes severe phase changes during the lithiation and delithiation processes with severe volume expansion and contraction.
Thin films of a few nanostructured carbon-free anode materials ( ,
,  ,
,  , and
, and  composite) were prepared.
  was introduced to suppress the aggregation of the Li–Sn alloy; CuO was introduced to combine more Li per Sn metal and to improve the discharge capacity by enlarging the voltage range. These novel composites display outstanding cyclability when tested for Li storage in the voltage window 0.01–3.0 V. The ternary
  composite electrode has only 17.6% initial capacity loss and nearly 100% capacity retention after 100 cycles at 0.5C cycling rate.10
Fine powders of tin oxide doped with traces of silicon in combination with highly dispersed amorphous silicon oxide have been synthesized by an advanced flame-assisted ultrasonic spray pyrolysis method.7 Upon addition with enough Si, the irreversible reaction capacity, as well as the oxidation state of Sn, reduces significantly.11 When the silicon content in the precursor was high enough, some metallic tin appeared in the product. Huang et al. indicated that the addition of some  to the precursor will reduce the oxygen content of the final product. Because the oxygen bound to Sn is responsible for the observed irreversible capacity, a low oxidation state is highly beneficial for this anode material.7 Furthermore, a reversible capacity of 900–950 mAh/g was found for these composites. This improved performance was explained due to an enhanced interfacial diffusion caused by highly dispersed inert second phases, i.e.,
  and
and  .
.
We can also see that the introduction of  into the
  system will improve the specific capacity through the intercalation and deintercalation of Li with Si. This study is an attempt to study the electrochemical performance of this quaternary metal oxide system
  . Also, the amount of reported literature on this system is small, and more data are needed.
Experimental
Materials preparation
Stoichiometric amounts of  (Alfa Aesar),
  (Aldrich), and stannous oxalate (Aldrich) were dissolved separately in distilled water to prepare
  . Brij 30
  surfactant was added in a weight ratio of 5:1 wt/wt with respect to the active materials. To prepare
  , we used
  (Nanostructured and Amorphous Materials Inc., US, 15 nm), SiC (MTI Corporation, ≤ 30 nm) and SiO2, fumed silica 5 nm, CABOT GambH). The raw material compounds were then mixed together. The mixed solution was stirred and heat-treated at
  for 2 h. The mixture was then transferred to an autoclave vessel
  and heat-treated at
  for 10 h. Finally, the samples were calcined in air atmosphere at
  for 12 h in an alumina crucible. The samples were left to cool down to room temperature inside the furnace. The samples were sintered again for another 12 h at the same temperature in air.
Materials characterizations
Powder X-ray diffraction (XRD) measurements were carried out using a Philips powder diffractometer with  radiation. IR absorption spectra were recorded using an FT/IR-6300 type-A Fourier transform infrared (FTIR) interferometer. Samples were ground to fine powders, mixed, and diluted with KBr. The IR region examined was
  . Elemental compositions of the various tin oxide compounds were analyzed by inductively coupled plasma (ICP, Perkin-Elmer Optima 2000 DV). Scanning electron microscopy (SEM) was conducted with a JEOL SEM model 6460.
Electrochemical measurements
The homogeneous slurry used to form the electrodes was composed of 85 wt % active materials, 10 wt % acetylene black, and 5 wt % poly(vinylidene fluoride) binder dissolved in  -methyl pyrrolidone solvent. It was then spread onto Cu foil substrates. The area of each coated electrode was
  . The electrodes were dried in a vacuum oven under a vacuum pressure of 30 Torr at
  for 12 h. The electrodes were then pressed at a pressure of
  . The active material loading was about 4 mg for each individual electrode. CR2032 coin cells were then assembled in an argon-filled glove box (Mbraun, Unilab, Germany), using lithium metal foil as the counter electrode. The electrolyte was 1 M
  in a mixture of ethylene carbonate and dimethyl carbonate (1:1 by volume, provided by Merck). The cells were galvanostatically charged and discharged over a voltage range of 0.0–3 V using a current of 0.02 A for both processes. Cyclic voltammetry measurements were performed using a Multi-stat CHI660 Electrochemical Workstation at a
  scanning rate, and the potential windows were 0 and 3 V vs
  electrode. The ac impedance measurement amplitude was 50 mV. The frequency range was 100 kHz–10 mHz.
Results and Discussion
Structural characterization
XRD patterns of the  and
and  samples showed suitable crystallinity as shown in Fig. 1. The samples' diffraction peaks exhibited good crystalline structures. Their structures were indexed to the tetragonal system using Rietveld analysis of the XRD pattern data with a standard software package. The refined unit cell parameters are given in Table I. The crystallite sizes of
  and
and  prepared from
  precursor are 11.1836 and 28.2495 nm, respectively, according to the Debye–Scherrer equation12

where θ and  are the Bragg angle and the full width at half-maximum (fwhm) peak, measured in radians, of each diffraction peak, respectively. Also, λ is the X-ray wavelength (1.54056 Å) and
  is the effective particle or grain size. It is observed that the unit cell parameters of
  are greater in value than those of
  .
.

Figure 1. XRD patterns of (1)  and
and  prepared from different sources of Si: (2) SiC, (3)
  , and (4)
  .
.
Table I. Unit cell parameters of tetragonal  and
and  samples.
| Sample no. | Samples |
 (Å) (Å) |
 (Å) (Å) | Cell volume,  
| Selected 
| fwhm (°) | Crystallite size (nm) |
|---|---|---|---|---|---|---|---|
| 1 |

| 4.752 | 3.203 | 72.3285 | 34.55 | 0.778 | 11.1836 |
| 2 |

| 4.841 | 3.294 | 77.1958 | 34.1 | 0.289 | 24.3040 |
| 3 |
| 4.913 | 3.375 | 81.4643 | 34 | 0.308 | 28.2495 |
| 4 |

| 4.795 | 3.254 | 78.8160 | 34.1 | 0.5 | 17.4017 |
Figure 2 shows an SEM image of the samples. The powders have average crystal sizes of 50 and 100 nm. In general, the particles have an interconnected network structure in the form of nanoaggregates.

Figure 2. SEM of (1)  and
and  prepared from different sources of Si: (2) SiC, (3)
  , and (4)
  .
.
Figure 3 illustrates FTIR spectra collected in the wavenumber range from 400 to  . The bands at 1200, 1080, 790, and
  are attributed to different vibrational modes of Si–O–Si and O–Si–O groups; the vibration band at
  indicates an interaction between Sn, O, and Si, which is equivalent to a Sn–O–Si bond in the silicon-doped tin oxide composite. These data are consistent with previous literature.13

Figure 3. FTIR spectra of the prepared  and
and  prepared from
  .
.
EIS measurements
Electrochemical impedance spectroscopy (EIS) may be considered as one of the most sensitive tools for the study of differences in electrode behavior due to surface modification. The electrochemical impedance spectra of the cells, as presented in Fig. 4, show an intercept at high frequency on the real axis  for the resistance of the electrolyte,
  , followed by a semicircle in the high-middle frequency region and a straight line in the low frequency region. The numerical value of the diameter of the semicircle on the
  axis is approximately equal to the charge-transfer resistance,
  , and therefore, it can be seen that there is a marked decrease in
  after the addition of the silicon compound. The straight line in the low frequency region is attributed to the diffusion of the lithium ions into the bulk of the electrode material, or the so-called Warburg diffusion. The plot of the real part of the impedance,
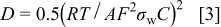
  , vs the reciprocal root square of the lower angular frequencies is displayed in Fig. 5. The straight lines are attributed to the diffusion of the lithium ions into the bulk of the electrode material, or the so-called Warburg diffusion. This relation is governed by Eq. 2. It is observed that the Warburg impedance coefficient,
  , is
, is  for the
  cell, and it has a lower value than in
 . The parameters of the equivalent circuit are presented in Table II. Also, the diffusion coefficient values of the lithium ions for diffusion into the bulk electrode materials have been calculated using Eq. 3 and are recorded in Table II.


The double layer capacitance is given by
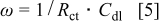
where  is the charge-transfer resistance,
  is the electrolyte resistance, ω is the angular frequency in the low frequency region,
  is the diffusion coefficient,
  is the gas constant,
  is the absolute temperature,
  is Faraday's constant,
  is the area of the electrode surface, and
  is the molar concentration of
  ions.14 The obtained diffusion coefficient
  for the
  cell "3" prepared from the
  precursor explains the higher mobility for
  ion diffusion than in the other cell, which lacked Si. Furthermore, the exchange current density is given by the following formula
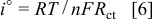
where  is the number of electron involved in the electrochemical reaction.
  cell (b) is higher than for the other cell. Therefore, the charge-transfer reaction of the
  electrode prepared from
  is stronger than in the other electrode prepared for the
  cell "1". It is observed that
  of cell "3" also has a higher value:
  .
.

Figure 4. EIS spectroscopy of (1)  and
and  from (2) SiC, (3)
  , and (4)
  cells.

Figure 5. Relationship between real impedance with the low frequencies for (1)  and
and  from (2) SiC, (3)
  , and (4)
  .
.
Table II. Electrochemical impedance parameters of  and
and  cell samples.
| No. | Samples |
 
|
 
| σ 
|
 
|

|
 
|
|---|---|---|---|---|---|---|---|
| 1 |

| 730 | 2936 | 1415.83 |

|

|

|
| 2 |

| 90 | 725 | 801.06 |

|

|

|
| 3 |

| 22 | 38 | 652.82 |

|

|

|
| 4 |
| 146 | 100 | 808.252 |

|

|

|
Cyclic voltammetry measurements were carried out between 0 and 3 V as shown in Fig. 6. The cyclic voltammograms of the investigated samples show a cathodic reduction peak in the range of 0.51–0.63 V. This peak is attributed to the intercalation of lithium into tin to form  compound
  as observed in the reported papers.3, 10 As we have
  and
and  as the starting materials, therefore the reduced forms are
  and
and  compounds and their intercalation with
  are as follows15, 16


 shows three anodic oxidation peaks at 0.42, 0.85, and 1.7 V, respectively, for the following reactions5, 7, 15, 16


 prepared from
  shows three anodic oxidation peaks at 0.68, 1.05, and 1.85 V for the deintercalation of
  from
from  , and the oxidation of
  to
to  and
and  , respectively. It is observed that there is a shift in the anodic peaks to more positive potentials. This can be attributed to the change of Si to
  and
and  .16
.16

Figure 6. Cyclic voltammograms of (1)  and
and  from (2) SiC, (3)
  , and (4)
  cells; scan rate:
  .
.
The first discharge capacity plateaus vs the working voltage between 3 and 0.0 V are shown in Fig. 7. The profiles for the first reduction look fairly similar for all the samples. There is a plateau that falls in the range between 1.5 and 1.7 V vs  for the reduction of
  to metallic Sn(0). The first discharge curve of cell "3" delivers the highest specific discharge capacity of about
  . Similar results have been observed in the literature in spite of using different methods of preparation.7, 13, 17 Also, the charge–discharge profile for the followed cycles for cell "3" is recorded in Fig. 8. The second discharge voltage started from 2 V; furthermore, the 100th discharge one began at 1.8 V. The drop in voltage from
  to
to  was observed in a different literature.18 The cycling performance of these cells, as shown in Fig. 9, remained good for 100 cycles with a gradual decrease. The specific discharge capacity of the
  cell prepared from
  is about
  and it is higher than that of the other cells. The higher capacity of the quaternary oxide can be explained on the concept of using mixed types of metal oxide. They can react reversibly with a larger amount of lithium and exhibit improved electrode performance compared to single oxides, and therefore provide benefits from maintaining the structural stability, leading to a good cycling performance.

Figure 7. First discharge voltage–capacity profile of (1)  and
and  from (2) SiC, (3)
  , and (4)
  cells.

Figure 8. Charge–discharge voltage–capacity profile of  cell prepared from
  .
.

Figure 9. Cycling performance of (1)  and
and  from (2) SiC, (3)
  , and (4)
  cells.
Conclusions
The addition of Si to  compound improves the electric conductivity as the charge-transfer resistance of Si compounds decreased. The specific discharge capacity of the cell prepared from
  was improved by
  in comparison with one prepared from the
  compound.
Central Metallurgical Research and Development Institute assisted in meeting the publication costs of this article.