Abstract
Using a binary ionic liquid (IL) electrolyte composed of  -methyl-
 -propylpyrrolidinium bis(trifluoromethanesulfonyl)imide and 2-oxo-3,9-dioxa-6-azonia-spiro[5.5]undecane bis(trifluoromethanesulfonyl)imide at an optimized ratio, we investigated battery cycling behavior at temperatures of
  and above. We achieved an extended cycle life using the binary electrolyte system as the problem of cell short-circuiting (stemming from lithium dendrite growth) was significantly reduced. We provide evidence that 2-oxo-3,9-dioxa-6-azonia-spiro[5.5]undecane bis(trifluoromethanesulfonyl)imide assists in short-circuit prevention through the suppression of lithium dendrites. For batteries employing a lithium metal anode and a
  cathode, we report capacities in excess of
  , and by utilizing a pulse charging technique we were able to charge a cell at a current density
  , which we were not able to achieve using a normal charging regime. We also present lithium cycling data for 2-oxo-3,9-dioxa-6-azonia-spiro[5.5]undecane bis(trifluoromethanesulfonyl)imide in the absence of another IL. We show that poor capacity and a necessarily high operating temperature make this system undesirable although we observed no short-circuiting. We conclude that the structure of the components of the IL and the nature of the charging regime employed can cause a significant reduction in dendrite-induced short-circuiting.
Export citation and abstract BibTeX RIS
The pursuit of a safe rechargeable lithium metal battery has led to a significant research effort into electrolytes based on ionic liquids (ILs). Although exceptions exist, these electrolytes are typically nonflammable and nonvolatile, making them attractive from a safety standpoint. However, the long-term electrochemical performance demanded of an electrolyte in a commercial battery remains a challenging goal for IL systems. One of the most challenging criteria that must be met is a long cycle life with minimum capacity fade.
Howlett et al.1 demonstrated the excellent potential of  -propyl-
 -methylpyrrolidinium bis(trifluoromethanesulfonyl)imide2 (
 TFSI) as a lithium metal battery electrolyte. Furthermore, Sakaebe and Matsumoto3 demonstrated the use of this IL in a lithium–
 battery, achieving nearly 30 cycles; however, cycling was accompanied by a large capacity fade, and they found somewhat improved results using an
  -methyl-
 -propylpiperidinium-type IL.
To date, ILs based on the bis(trifluoromethanesulfonyl)imide (TFSI) anion have proven to be the most popular in the lithium battery field. Seki et al.4, 5 demonstrated 125 and 120 cycles of a lithium metal– battery using 1,2-dimethyl-3-propylimidazolium TFSI and 1-octyl-3-methyl-imidazolium TFSI, respectively; however, capacity fade was significant (around 15% after 100 cycles in both cases), reflecting other test results for
  -type batteries with IL electrolytes.3–14 As an exception for a lithium metal battery with a
  cathode, Matsumoto et al.6 achieved 50 cycles with an uncharacteristically small capacity decline of about 5%. Opting for a non-TFSI IL, they used
  -methyl-
 -propylpyrrolidinium bis(fluorosulfonyl)imide (FSI) as the IL. However, recognizing growing concerns about the thermal stability of FSI ILs,7, 8 we have focused attention here on the TFSI anion.
The cathode material  (LFP)9 is now a reliable cathode material in lithium batteries. As a testament to its stability, a cycle life of 20,000 cycles has been reported for this material in a Li-ion battery using a standard organic electrolyte by Guerfi et al. ,10 and 2400 cycles have been reported by a different group.11 Moving away from traditional electrolytes, a cycle life of 500 cycles has been demonstrated for a lithium metal–
 battery using an IL–solid polymer-type electrolyte,12 and the same type of battery using a mixed IL–organic electrolyte has achieved 120 cycles.13 Of greater relevance to this study, the possibility of using a purely IL electrolyte in a lithium metal–
 battery has been demonstrated several times and, to date, always with a very low capacity fade.14–19 Most recently, this type of battery was studied using a
  FSI/Li TFSI electrolyte, with 400 cycles being reported and discharge rates up to 4C.19 Because of the consistently low capacity fade observed in
  batteries with respect to cycle number, apparently, in terms of cycle life,
  is superior to
  in IL systems.
Other cathode materials have also been demonstrated in lithium batteries with IL electrolytes. Sivakkumar et al.20 achieved 100 cycles using a conducting polymer–carbon nanotube composite cathode with an IL–vinylene carbonate electrolyte.  has been demonstrated several times25–28 but, like
  , appears to be very prone to capacity fade in IL electrolytes. This is possibly due to dissolution of the redox active transition-metal ion.29 Limited cycle life data in ILs are also available for other inorganic cathode materials: titanium-substituted
  ,29
,29  ,30
,30  ,31 and
  .21–23
While capacity loss due to cathode degradation can be severe, especially (as shown above) with IL electrolytes, the performance of the anode in a lithium battery can also greatly limit the device behavior. Often, this is associated with the formation of the solid electrolyte interphase (SEI), a phenomenon that is well documented, particularly for carbon and metallic lithium electrodes.24 Usually described as a film, the SEI serves to shield the lithium metal surface from the electrolyte solution and to prevent a direct reaction with lithium. Given that the impedance characteristics of the SEI can exert a dominant effect over battery performance, many groups have sought to use various additives to control the properties of the SEI.20, 32–35 In systems where IL electrolytes have been used with lithium metal anodes, it seems clear that sulfonyl-bearing anions, and products of their breakdown at reducing potentials, are important in generating SEI compositions that promote reversible lithium electrochemistry.36, 37
Because the charging of the lithium metal anode involves metal deposition, in the interests of achieving good deposit morphology, special consideration needs to be given to the charging method used. Pulse charging is beneficial in numerous battery systems, including lead acid,38–41 lithium ion,42, 43 nickel metal hydride,44 and zinc–nickel oxide.45 It generally involves interrupting the charge current with a rest period or a brief period of discharge.
As part of this study, we trialed a pulsed charging technique, which incorporates brief discharge pulses into the charging cycle. We used this method to charge at a rate that would normally be impossible due to dendrite-induced cell short-circuiting. In a further effort to combat short-circuiting, we took a chemical approach and investigated the effects of using structurally different IL cations in the electrolyte. If a quaternary ammonium cation contains only two alkyl groups, each bonded to the positive nitrogen center at both ends, a two-ring, azo-spiro, structure results. Such cations have been studied for use in organic carbonates as supercapacitor electrolytes.46–48
The azo-spiro structure results in a sterically well shielded positive nitrogen center, similar to  -dialkyl pyrrolidiniums, and it is thus plausible that such a cation would be reductively very stable; indeed, Chiba et al. observed that an electrolyte based on 5-azonia-spiro[4.4]nonane tetrafluoroborate and propylene carbonate was stable to −3 V (vs
  ).46
).46
However, the incorporation of functional groups into one or both rings may afford an increased level of reactivity to the cation, thus facilitating its use as an SEI forming species. Because both alkyl groups in the azo-spiro cation are doubly tethered, there is a reduced likelihood, during reactions at the electrode surface, of detachment of an alkyl chain from the cation in the event of bond cleavage. Therefore, the amount of volatile species formed during reaction processes may be minimized.
In this work, we trialed the azo-spiro compound 2-oxo-3,9-dioxa-6-azonia-spiro[5.5]undecane bis(trifluoromethanesulfonyl)imide (SMK TFSI) as an electrolyte in a lithium metal cell, both in its neat, lithium-doped state and as a nonvolatile additive in  TFSI.
TFSI.
Experimental
 TFSI was synthesized in our laboratories,2 and water content was
  by Karl Fischer analysis (Metrohm). The novel solid compound SMK TFSI was also synthesized in our laboratories. The method used to make the SMK cation was a variation of the process described by Uelzmann and Kuhner for a similar cation.49 Details of the synthesis, taken from Clare et al. ,50 are reproduced below.
Equimolar amounts of methyl bromoacetate (1% excess) and 4-(2-hydroxyethyl)morpholine were mixed in toluene at  for 8 h, forming the white solid compound SMK bromide, with methanol (volatile!) as a by-product. Purification included recrystallization from boiling water at
  . SMK TFSI was made by mixing equimolar amounts of SMK bromide with Li TFSI in water with heating to form a single-phase solution. Cooling to
  afforded precipitation of the colorless solid SMK TFSI. Further details of this synthesis and that of other azonia-spiro compounds are the subject of a forthcoming publication.50
Cathodes consisted of 75 wt %  coated with carbon (1.6 wt %) (Phostech), 15 wt % carbon black (Shawinigan), and 10 wt % poly(vinylidene fluoride) binder. Dry ingredients were milled together for 72 h before the addition of the binder (dissolved in
  -methylpyrrolidone) to form a slurry. The slurry was milled for 72 h more before being spread on aluminum foil using a
  roller. The coated foils were allowed to dry overnight in a fume hood before being dried in a vacuum oven at 100° for 72 h. The final LFP loading was
  , and the thickness of the coating was
  . Electrodes coated with
  of LFP were also produced from the same slurry using a different roller.
Half-cells consisted of a CR2032 stainless steel "coin cell" case, a 10 mm diameter disk cathode (LFP coated onto Al foil, as detailed above), a 10 mm diameter disk lithium foil (China Energy Lithium, 0.33 mm thick, cleaned with hexane) anode, and Separion separator (Evonik, dried under vacuum at  ). Separion separators consist of a nonwoven poly(ethylene terephthalate) mat coated with
  and
and  powders, which improve wettability. The Separion separators are particularly suitable batteries for use at elevated temperatures (they display only 1% shrinkage even at
  ). The Separion used in this study was
  thick and had an average pore size of 240 nm, with a total porosity of
  . An internal spring and spacer provided uniform pressure inside the cells. Cells were assembled in an argon-filled glove box.
 and
and  symmetrical cells were likewise made under argon in the same 2032 coin cell type configuration (also using Separion separator). In the
  cells, both anode and cathode consisted of 10 mm diameter lithium metal disks.
  symmetrical cells were cycled with a constant current of
  for 32 min (16 min "charge" and 16 min "discharge").
 quasi-symmetrical cells consisted of a 10 mm diameter Li metal disk "cathode" and Cu "anode." Copper anodes consisted of 10 mm diameter copper foil (
 thick) disks. A set of 16 min charges was used for the
  cells; however, the discharge was not time-limited but voltage-limited with a 1.8 V cutoff; the current density was again
  .
.
Lithium– half-cells were charged with a constant current of
  (except when charge rate capability experiments were performed) and discharged at
  (except where discharge rate capability experiments were performed). In all cases, the charge cutoff voltage was 3.8 V, and the discharge cutoff voltage was 3.0 V.
A special interrupted charge regime was used for some half-cells. This regime consisted of 1.5 h of charging at  , followed by a 30 s discharge at
  , followed by 30 min of charging at
  . The 30 s discharge and 30 min charge steps were then repeated until the charge cutoff voltage (3.8 V) was reached. Discharge was performed uninterrupted at
  .
.
Batteries were cycled on a Maccor series 4000 battery tester. All impedance spectroscopy was performed using a Solartron 1255B frequency response analyzer over a frequency range of 1 MHz to 0.1 Hz.
For cyclic and linear sweep voltammetry studies, a  diameter Pt working electrode and a Pt wire counter electrode were employed. The reference electrode consisted of a silver wire immersed in a solution of 10 mM silver triflate in
  -methyl,
  -butylpyrrolidinium
  TFSI and separated from the main solution by a glass frit, as reported by Snook et al.51 For the temperature-dependent study, the reference electrode consisted of a bare silver wire immersed in the test electrolyte. Unless otherwise stated, the scan rate was
  for cyclic voltammetry (CV) and
  for linear sweep voltammetry. Potentiostatic control was provided by an Autolab PGSTAT302 (Eco Chimie, The Netherlands) controlled with GPES (Version 4.9.005) software. An oil bath was used to heat the electrolyte to the required temperatures. Viscosities were measured using an Anton-Paar falling ball-type viscometer; the sample tube was filled under argon atmosphere.
Results and Discussion
SMK TFSI: Linear sweep and CV
SMK TFSI, a structure shown in Fig. 1, has a melting point of  .50 Its electrochemical window in the liquid state was measured by linear sweep voltammetry
  at
at  . Two scans, each using a cleaned electrode, were used to generate the figure, one beginning from 0 V and scanning negatively, and one beginning from 0 V and scanning positively. The electrochemical limits, indicated by the vertical bars in Fig. 1, were taken to be the potentials at which the current density exceeded a threshold value of
  . Figure 1 shows that the reductive limit of the IL is −1.8 V (vs
  ) and the oxidative limit is 1.7 V (vs
  ), giving an electrochemical window of 3.5 V. The reductive limit of this compound is substantially less negative than that of
  -dialkylpyrrolidinium TFSI compounds, which are typically stable at potentials beyond −3 V (vs
  ).2 We expect that the functional groups within the ring structure are responsible for the increased level of reactivity over similar
  -dialkylpyrrolidinium structures.
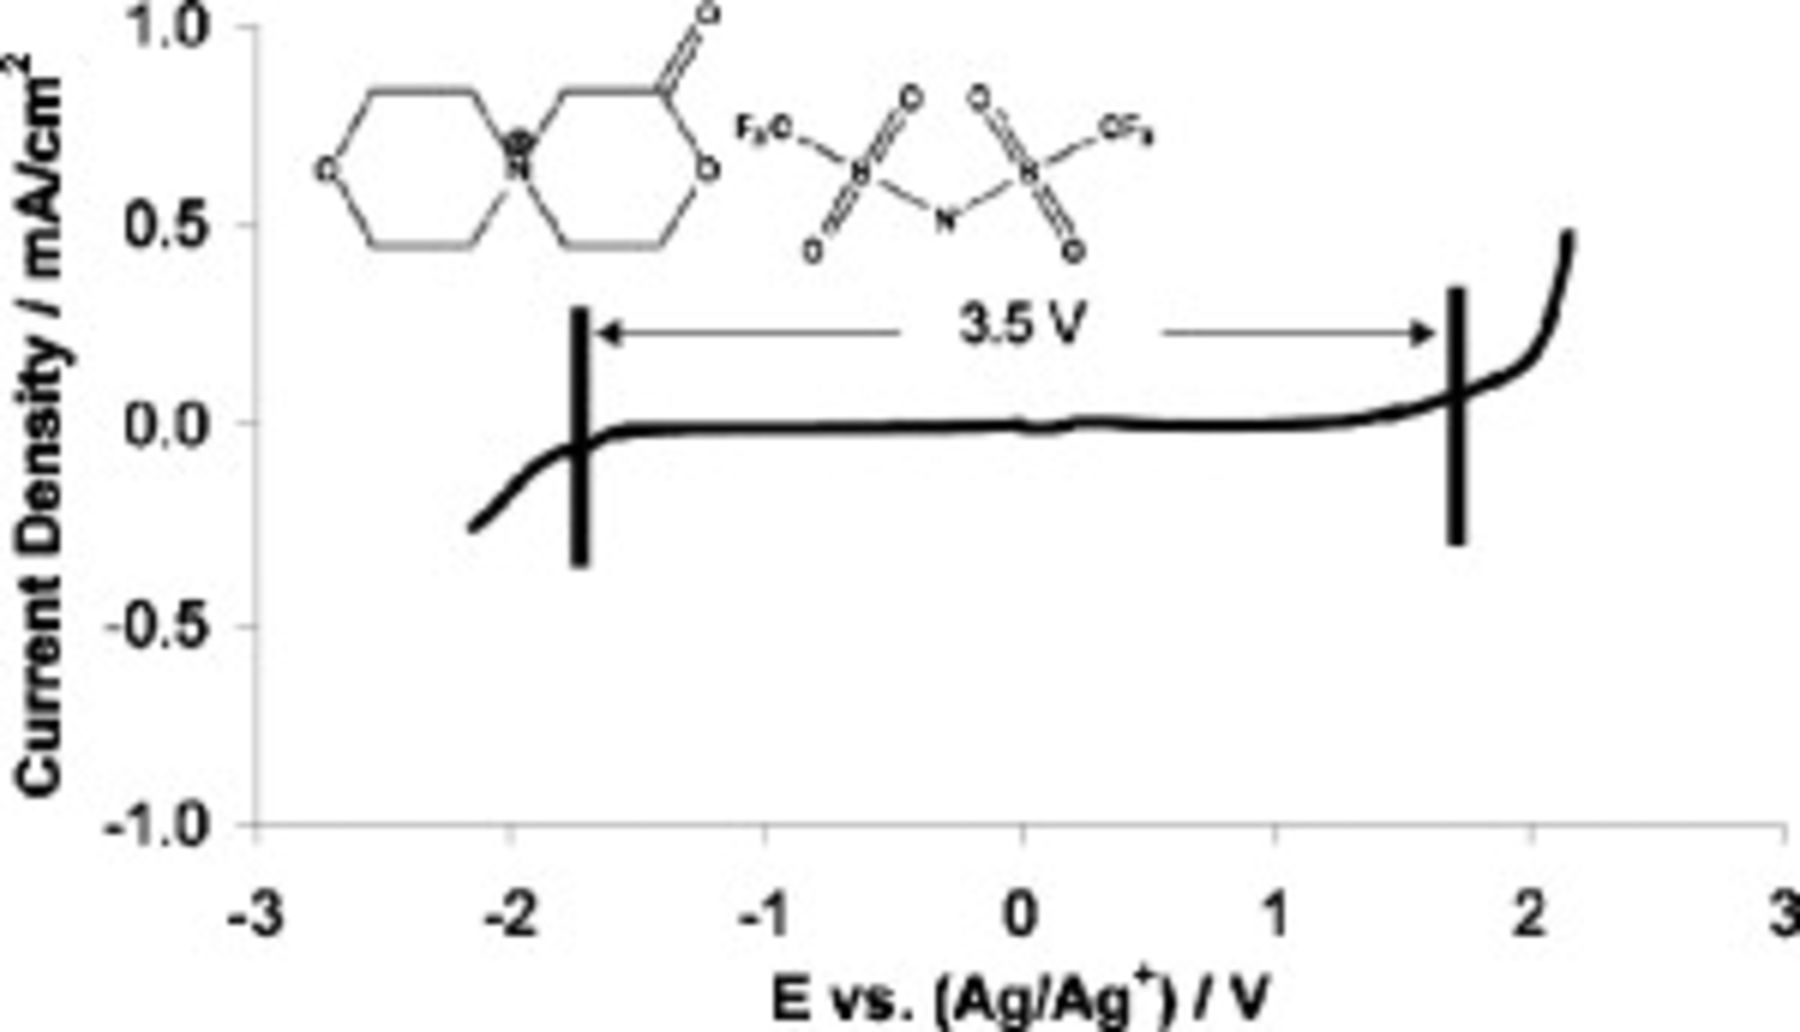
Figure 1. Linear sweep voltammogram of neat SMK TFSI at  and structure of SMK TFSI (inset).
Lithium cycling in SMK TFSI was examined by CV, as shown in Fig. 2. The electrolyte consisted of  Li TFSI in SMK TFSI. The mixture was heated to
  ; at this temperature, the electrolyte appeared as a highly viscous, clear liquid. We can report that with the presence of lithium salt in the IL, the negative potential limit was enhanced far beyond that of neat SMK TFSI; this effect has been observed by other researchers in the area.29, 52–54 Taking advantage of this effect, the first scan was allowed to go to deeply negative potentials to achieve lithium deposition and to find the reductive limits of the lithium-doped electrolyte.
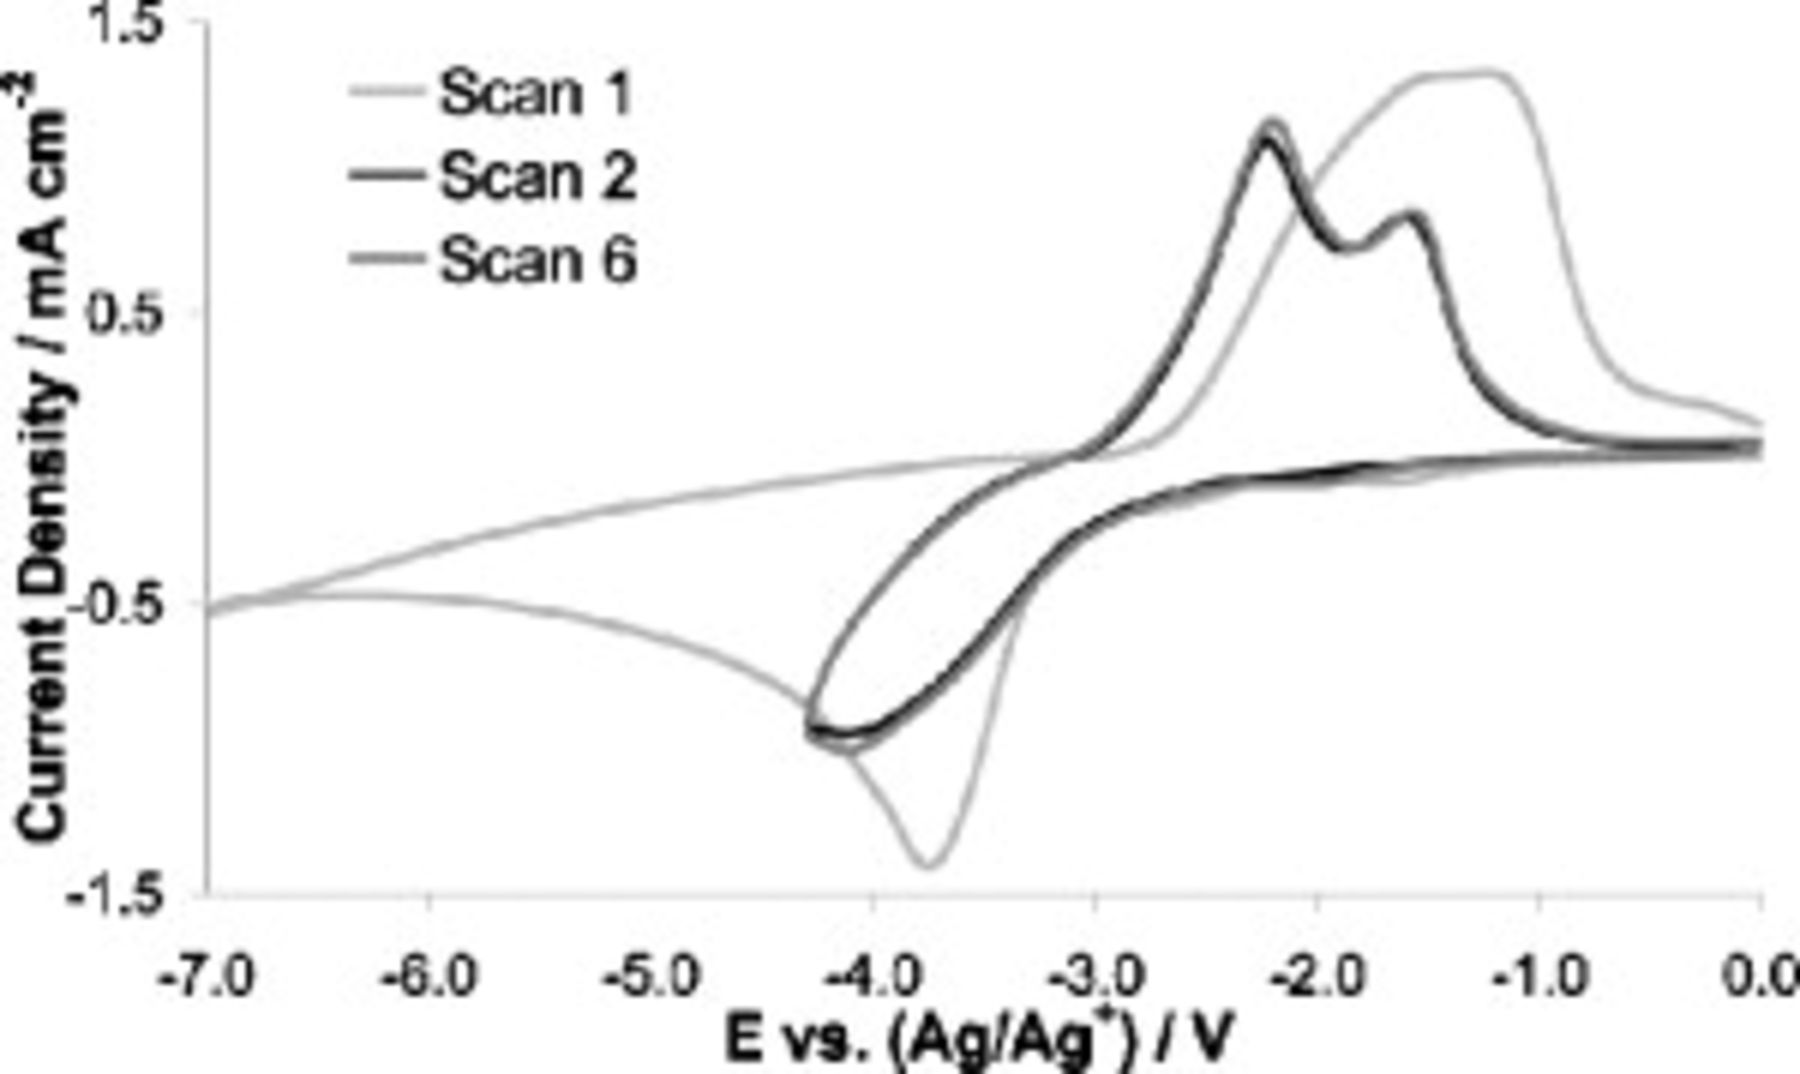
Figure 2. Cyclic voltammetric lithium cycling in SMK TFSI  Li TFSI at
  .
.
The lithium deposition peak is observed at −3.75 V (vs  ), with the deposition current reaching a mass-transfer-defined plateau thereafter. Surprisingly, no degradation current was observed until the electrode potential became more negative than −6 V (vs
  ), where there was still only a minor increase in the reductive current possibly indicative of IL degradation. The scan was repeated with a cleaned electrode at a slower scan rate,
  , and the same behavior was observed. Even at
  , only at potentials more negative than −5.9 V (vs
  ) did there occur a very slight increase in reduction current. This apparent stability at such negative potentials is not typical of IL systems; there is commonly a steep increase in current at potentials below −4.0 V [vs
  ] due to rapid electrolyte degradation.
On the reverse scan ( experiment) (Fig. 2), there appeared a broad oxidation peak, which we attribute to the stripping of the deposited lithium. Scans 2–6 were permitted only to progress to potentials negative enough to achieve initial lithium deposition before being reversed to strip away the deposited lithium. For scans 2–6, there is no decay in the magnitude of the lithium deposition and stripping peaks, nor a shift in peak positions.
Compared to scan 1, the reduction peaks in scans 2–6 of Fig. 2 are smaller, suggestive of a certain amount of electrode passivation achieved during the first scan. The lack of electrolyte breakdown at deeply negative potentials is also strongly indicative of a passivating layer or SEI. In summary, the SEI of this system appeared to be of excellent protective character and yet sufficiently lithium-ion conductive to allow lithium cycling to occur.
SMK TFSI: Symmetrical cells
To further study lithium cycling with this electrolyte, lithium symmetrical coin cells were made. The cells were cycled at  at
at  . As the cycle number increased, greater voltages were required to achieve the desired current density (see Fig. 3). This suggests that a slow but constant increase in passivation of the lithium metal has occurred, somewhat contrary to what was seen in the CV experiments. Lithium cycling in CV and in a coin cell are not precisely comparable due, in part, to the different time scales and quantities of lithium being cycled. To study this apparent passivation further, a symmetrical cell was cycled with electrochemical impedance spectroscopy performed at various cycle numbers; the Nyquist plots are shown in Fig. 4.
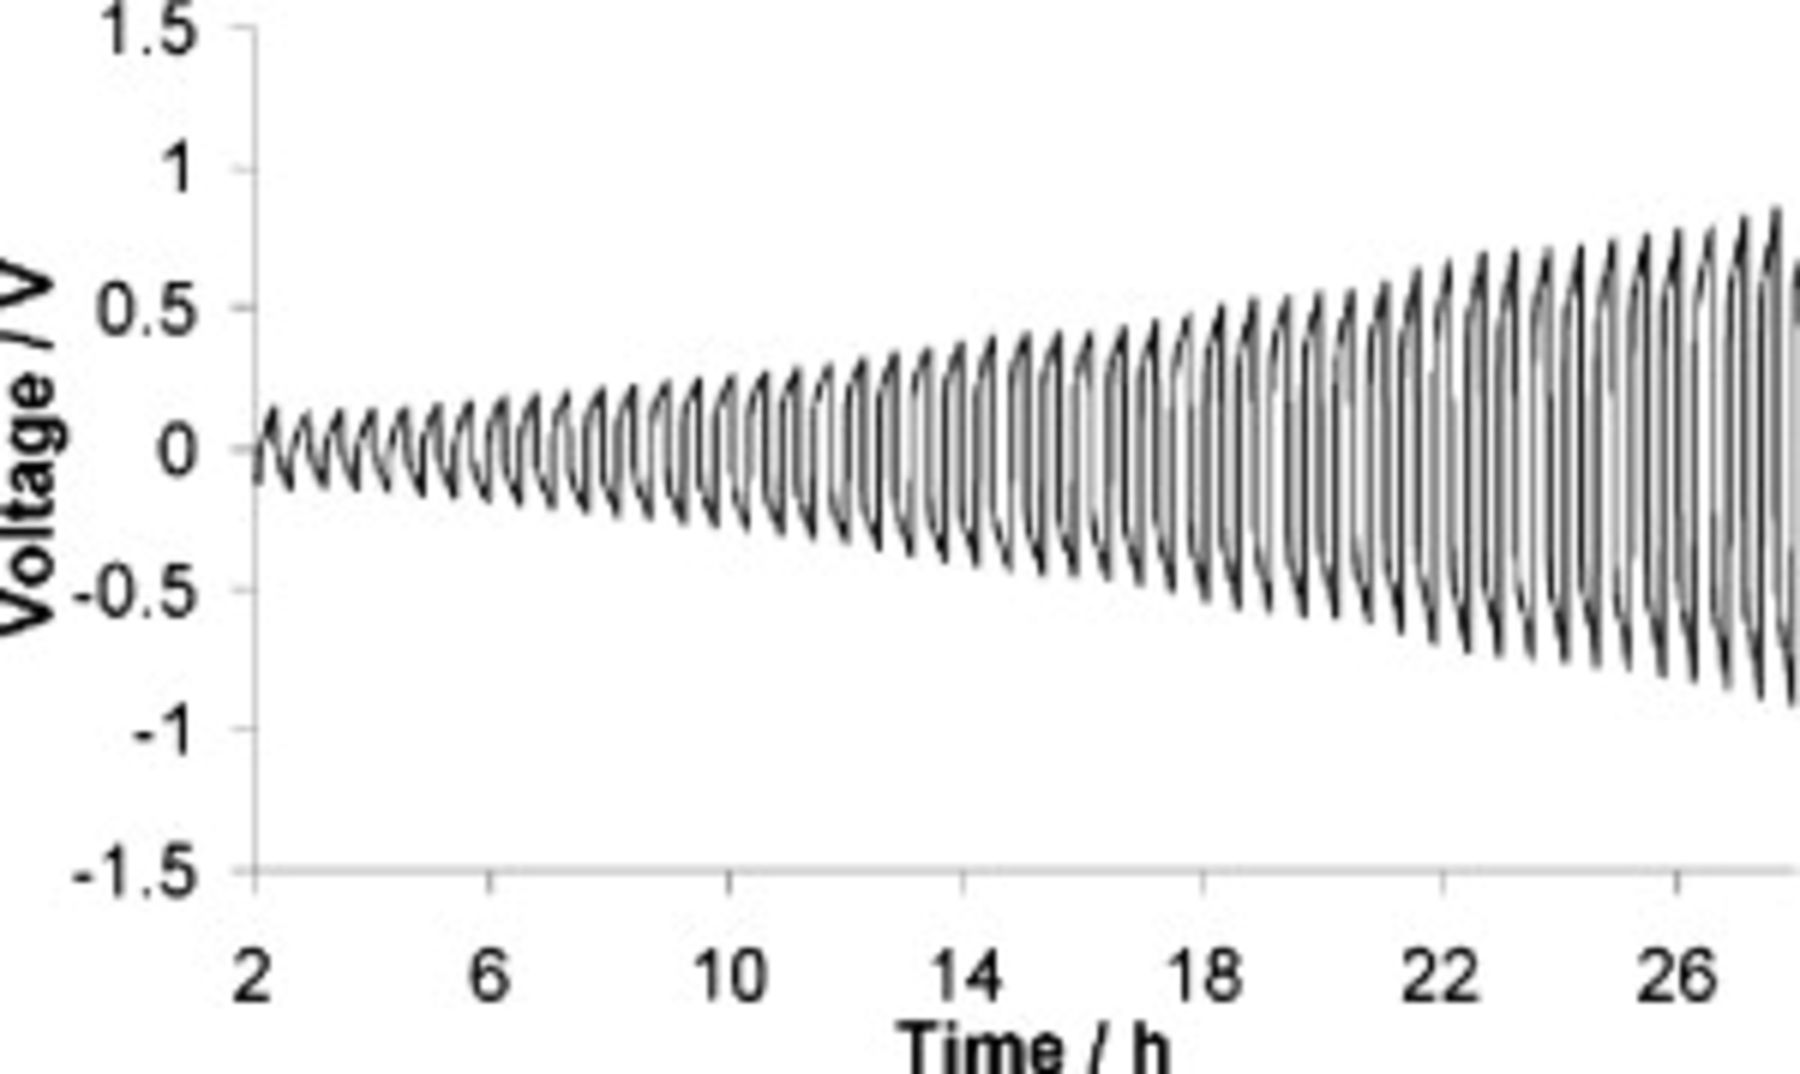
Figure 3. Overpotential of a symmetrical cell (lithium–lithium) with SMK TFSI  Li TFSI cycled at
  at
at  .
.
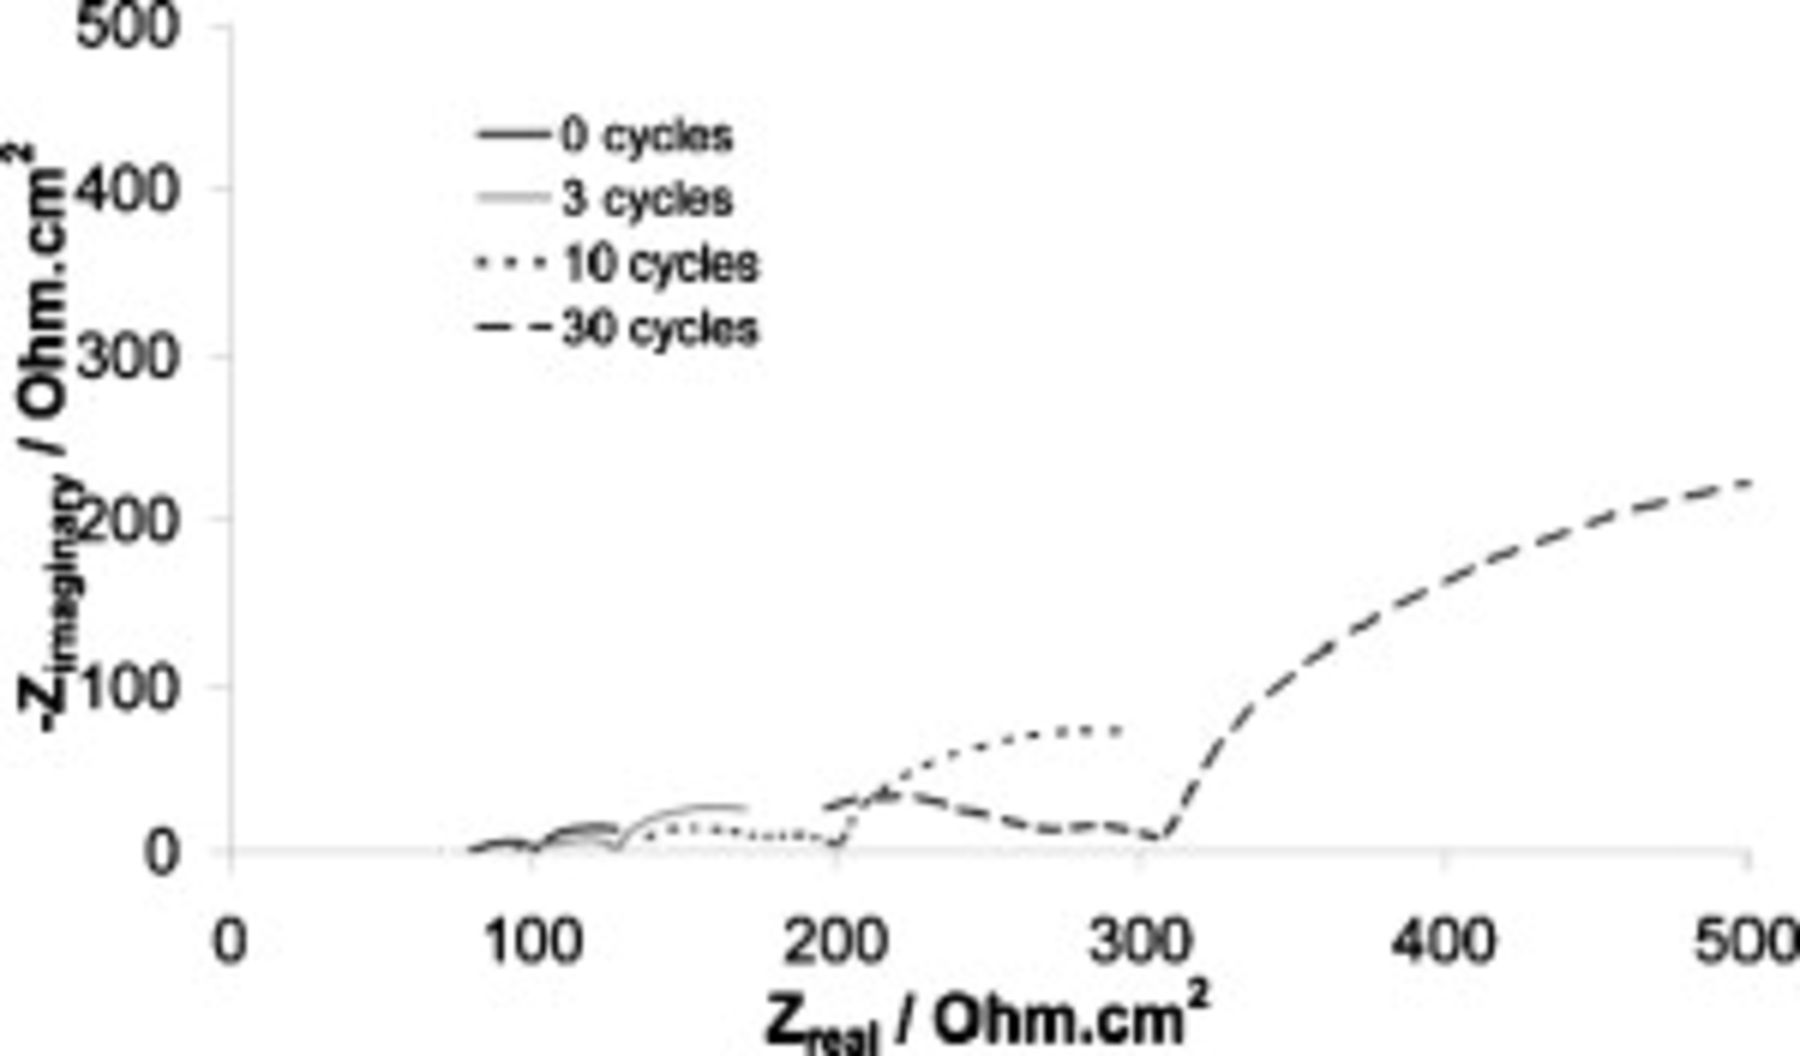
Figure 4. Nyquist plots at various cycle numbers for a  symmetrical cell containing SMK TFSA
  Li TFSI. Cycled at
  at
at  .
.
The key data points of Fig. 4 are summarized in Table I. Taking the commonly accepted interpretation of the Nyquist plot for such cells, the  intercept represents the solution resistance, the touchdown represents the total cell resistance, and the difference between the two represents the SEI resistance (if charge-transfer resistance is ignored). Based on this interpretation, we can state that both electrolyte and SEI resistances increase with cycle number, with the SEI increase being the more extreme. It therefore appears as though unchecked SEI development, in particular, is responsible for the decline in cycling performance. When, after completing 50 cycles, the cells were opened for visual microscopic inspection, they were completely free of lithium dendrites.
Table I. Normalized resistance values taken from the Nyquist plots of Fig. 4. Here, " -intercept" is taken to be representative of electrolyte resistance, "
 -touchdown" is the total cell resistance, and "Difference" is the the SEI resistance.
| Cycle no. |
 -intercept -intercept
|
 -touchdown -touchdown
| Difference
|
|---|---|---|---|
| 0 | 79.8 | 101 | 21.2 |
| 3 | 96 | 127 | 31 |
| 10 | 100 | 200 | 100 |
| 30 | 140 | 272 | 132 |
Lithium cycling was tested further in a  quasi-symmetrical cell. In the first charge cycle, a constant current was applied for a set time to facilitate lithium metal electrodeposition on the copper electrode. Discharge involved reversing the current direction for as long as necessary to strip the deposited lithium from the copper, returning the cell voltage to a cutoff level just below the open-circuit potential.
For a perfectly reversible system under constant current conditions, the stripping and deposition capacities should be equal; however, we observed relatively small stripping (discharge) capacities, leading to cycling efficiencies of about 20%, as shown in Fig. 5. The possible reasons for the very high amount of irreversible capacity include the consumption of current due to electrolyte electroreduction (especially during the first cycle) and chemical reaction of deposited lithium with the electrolyte. These results are in line with the  symmetrical cell results, which indicated unchecked SEI formation due to reactions between the IL and lithium metal. In summary, under the test conditions that were used, the lithium cycling attained in the SMK TFSI
  Li TFSI electrolyte on a copper substrate was poor.
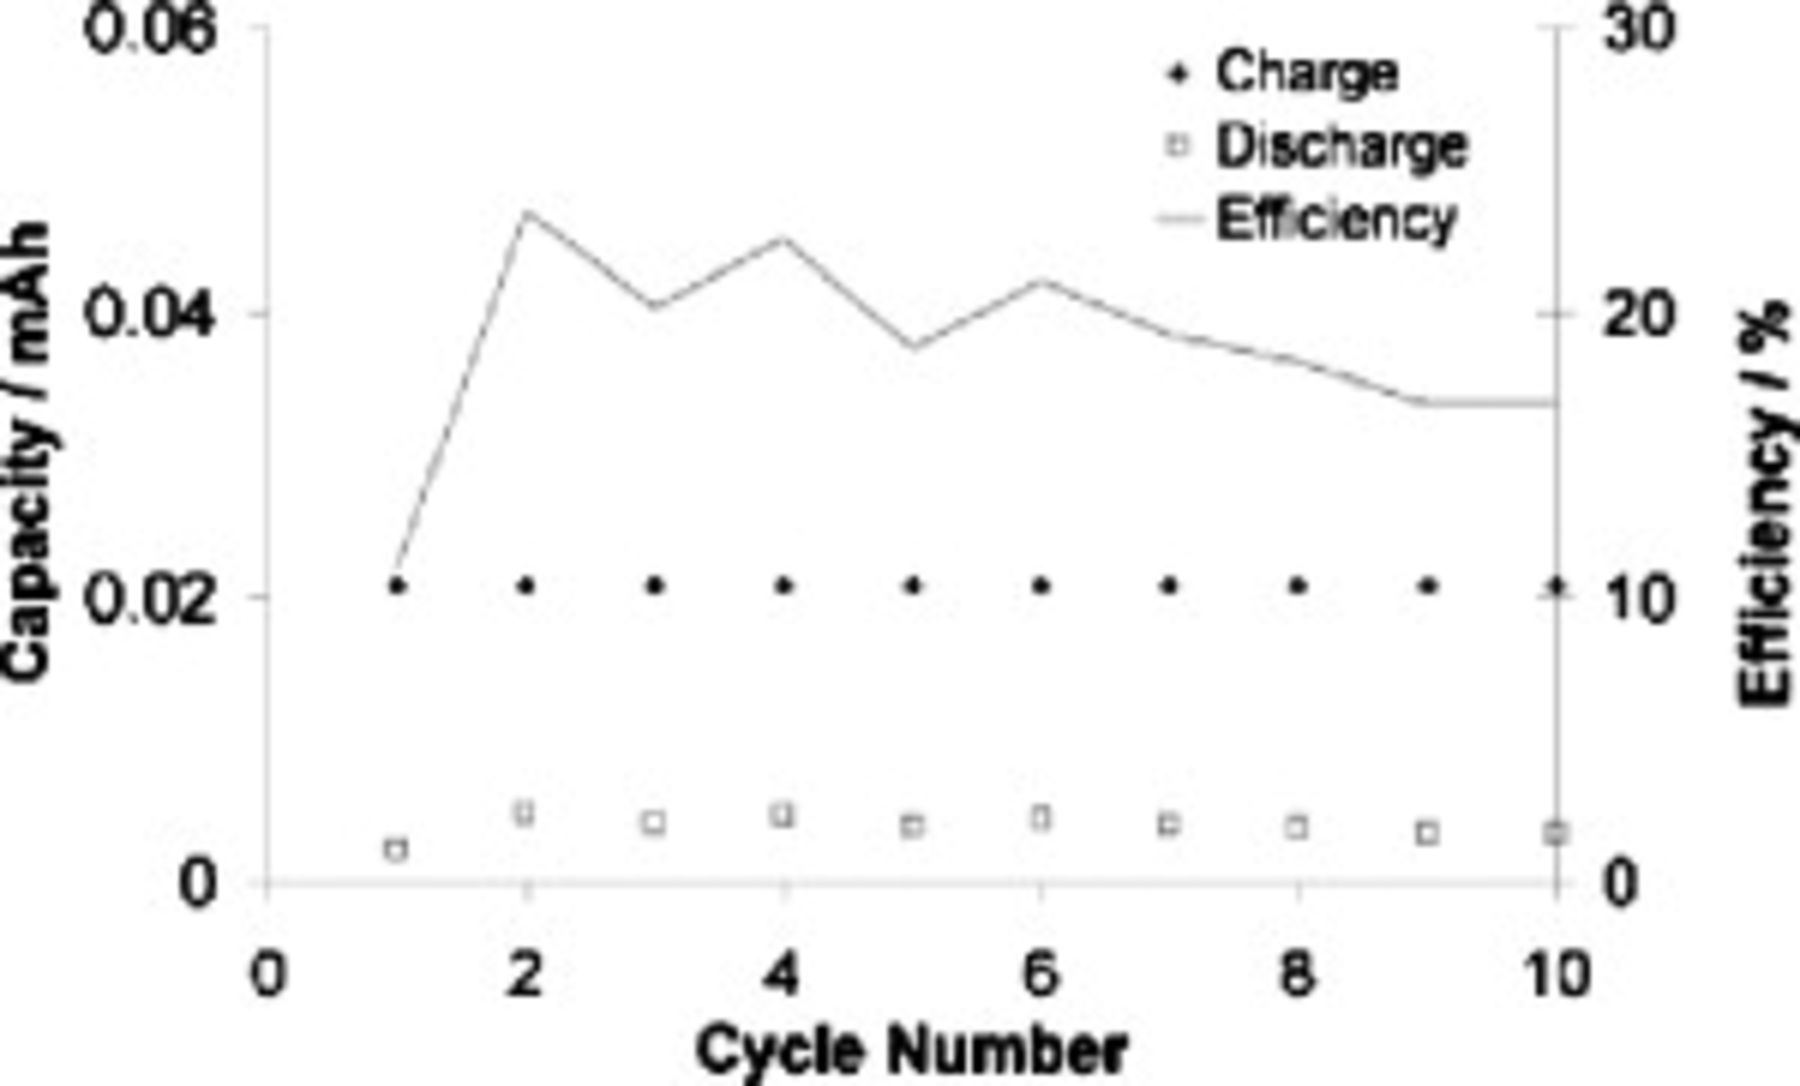
Figure 5. Lithium cycling efficiency in a  quasi-symmetrical cell. "Charge" denotes lithium plating onto copper, and "discharge" denotes stripping of the deposited lithium from the copper. Cell cycled at
  at
at  .
.
SMK TFSI: Lithium– cells
cells

The SMK TFSI 0.4 mol  Li TFSI electrolyte was then tested in a half–cell, which consisted of a lithium metal anode and a
  cathode9 with a
  active material. The cell was cycled at
  , ensuring that the electrolyte was in the liquid state. The cell gave an initial discharge capacity of
  , which declined rapidly to
  after 15 cycles and then slowly to
  after 30 cycles.
SMK TFSI as an additive: CV
Due to the high melting point of the SMK TFSI electrolyte and the poor capacity achieved in the lithium– cell, binary electrolytes of SMK TFSI and
  TFSI (melting point
  )2 were prepared. The optimal amount of SMK TFSI to be added to
  TFSI was determined by comparing the cycling behavior of batteries containing different amounts of SMK TFSI, as discussed in a later section.
The cyclic voltammograms in Fig. 6 demonstrate the ability of the optimized binary electrolyte to support lithium cycling at both high and ambient temperatures. To probe the stability of the binary electrolyte at each temperature, the potentials were allowed to progress negatively (and positively) enough to establish the electrochemical window.
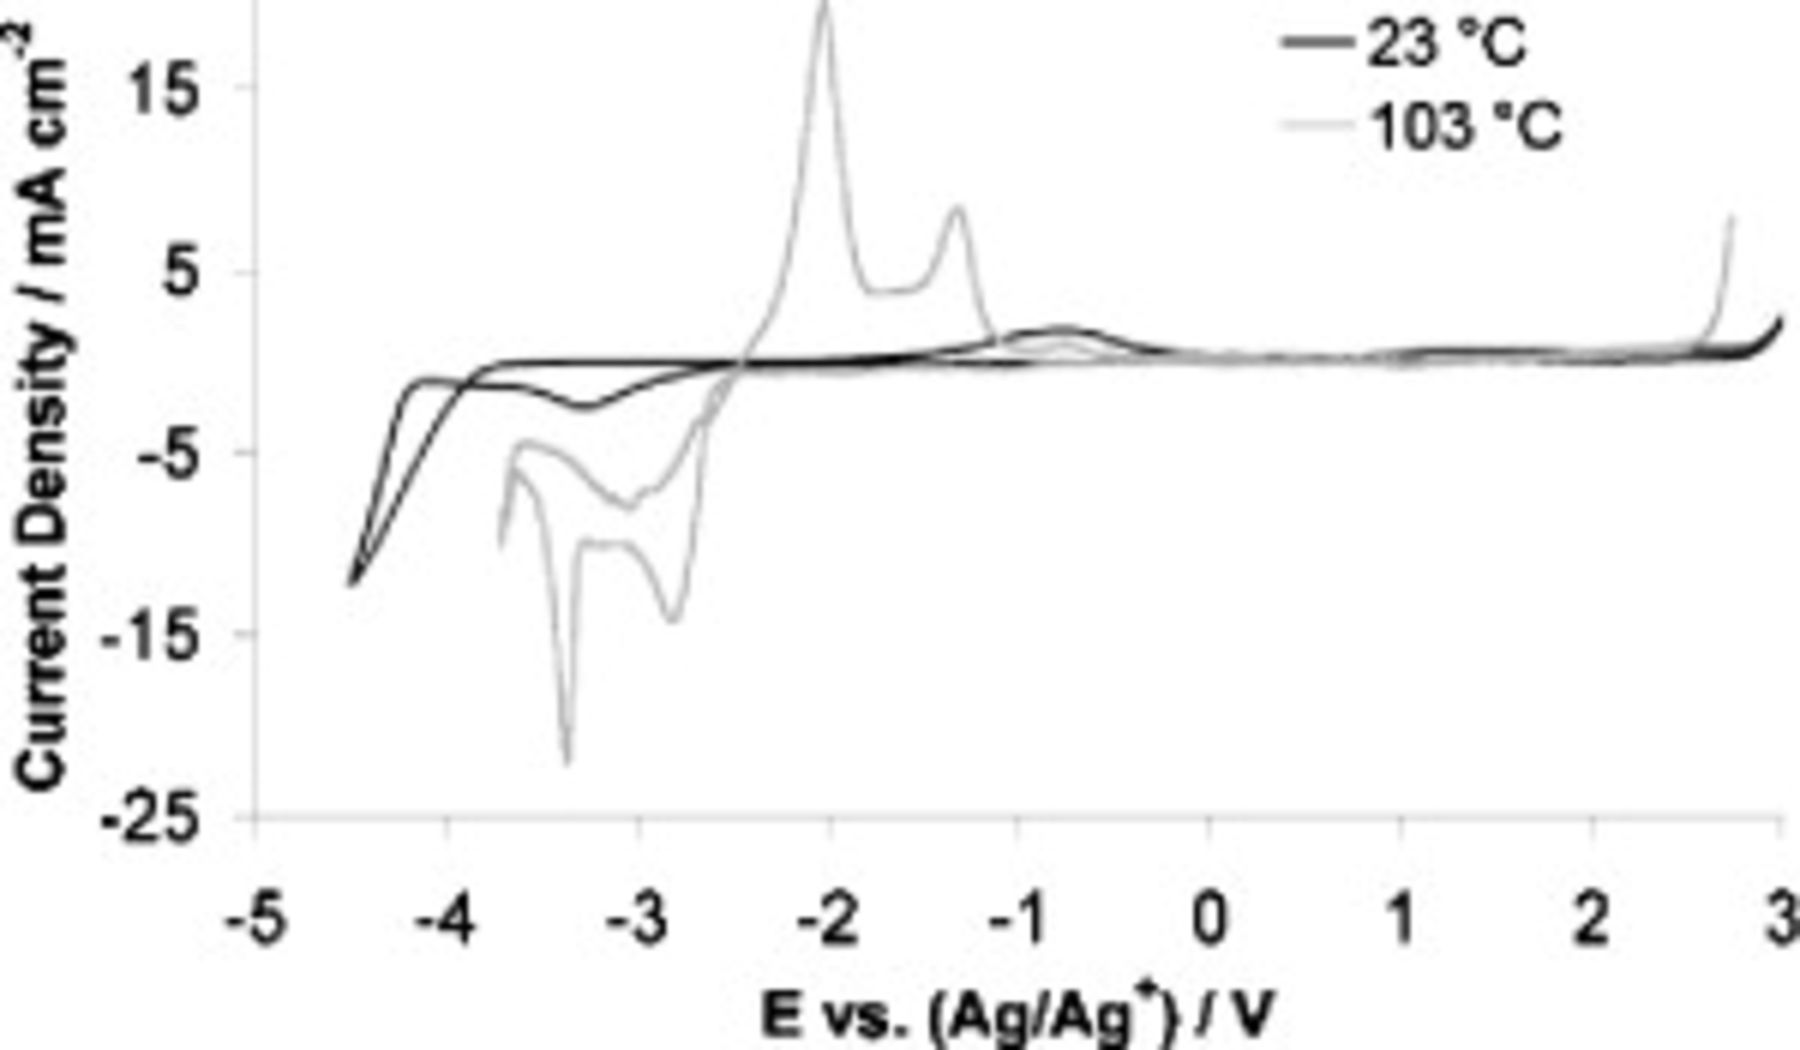
Figure 6. Cyclic voltammograms showing lithium deposition and electrochemical limits in  TFSI,
TFSI,  Li TFSI, and
  SMK TFSI at 23 and
  .
.
Figure 6 shows that rapid lithium deposition occurred at less negative potentials as the temperature was increased, and the peak current density associated with  reduction also increases markedly at higher temperatures. Another observation is that even at room temperature the current density associated with
  reduction in the binary electrolyte exceeds that observed for the neat SMK electrolyte at
  (see Fig. 2).
At  , the reductive limit of the electrolyte was significantly separated from the onset of lithium deposition, suggesting that this electrolyte has the potential to be used in a high temperature lithium battery.
An interesting phenomenon is observed during the reductive phase of the cyclic voltammograms at temperatures of  and above. Approximately 500 mV beyond the lithium deposition peak, there is a second reduction process, the sharpness of which is consistent with a process involving adsorption at the electrode surface. Further negative, the current again increases, without an apparent limit, which is indicative of a bulk reductive breakdown of the electrolyte.
Both the reductive and oxidative limits of the electrolyte shrunk as the temperature increased; these data are given in Table II and are also clearly visible in Fig. 6. The notable diminution of both the negative and positive potential limits of the electrolyte at high temperatures indicates faster kinetics for electrolyte breakdown at higher temperatures.
Table II. Negative and positive limits of the electrolyte  TFSI,
TFSI,  Li TFSI, and
  SMK TFSI obtained by CV at different temperatures.
Temperature
| Negative limit (V vs  ) ) | Positive limit (V vs  ) ) |
|---|---|---|
| 23 | −4.15 | 2.88 |
| 43 | −4.05 | 2.75 |
| 63 | −3.94 | 2.65 |
| 83 | −3.86 | 2.62 |
| 103 | −3.67 | 2.59 |
| 123 | −3.62 | 2.57 |
We suggest that the extra thermal energy in the system acts to overcome some of the activation energy, which is mechanistically required for electroreduction or electro-oxidation to proceed, therefore accelerating the kinetics of the breakdown reaction. The anodic breakdown current at each temperature (taken at 2.75 V vs  ) increased with temperature in an Arrhenius manner that is consistent with the accepted kinetic theory for solution phase reactions.55 This confirms that the effect is kinetic rather than thermodynamic.
SMK TFSI as an additive: Half-cells at

Initially, a  TFSI with a
  Li TFSI electrolyte was trialed without any SMK TFSI present in batteries containing a lithium metal anode and a
  cathode (
 active material). Figure 7 (top, inset) shows that at the current density employed,
  , lithium deposition results in the formation of dendritic lithium, as evidenced by the abundance of dendrites on the separator of a cell that was opened in the discharged state after completing several cycles (see inset in Fig. 7).
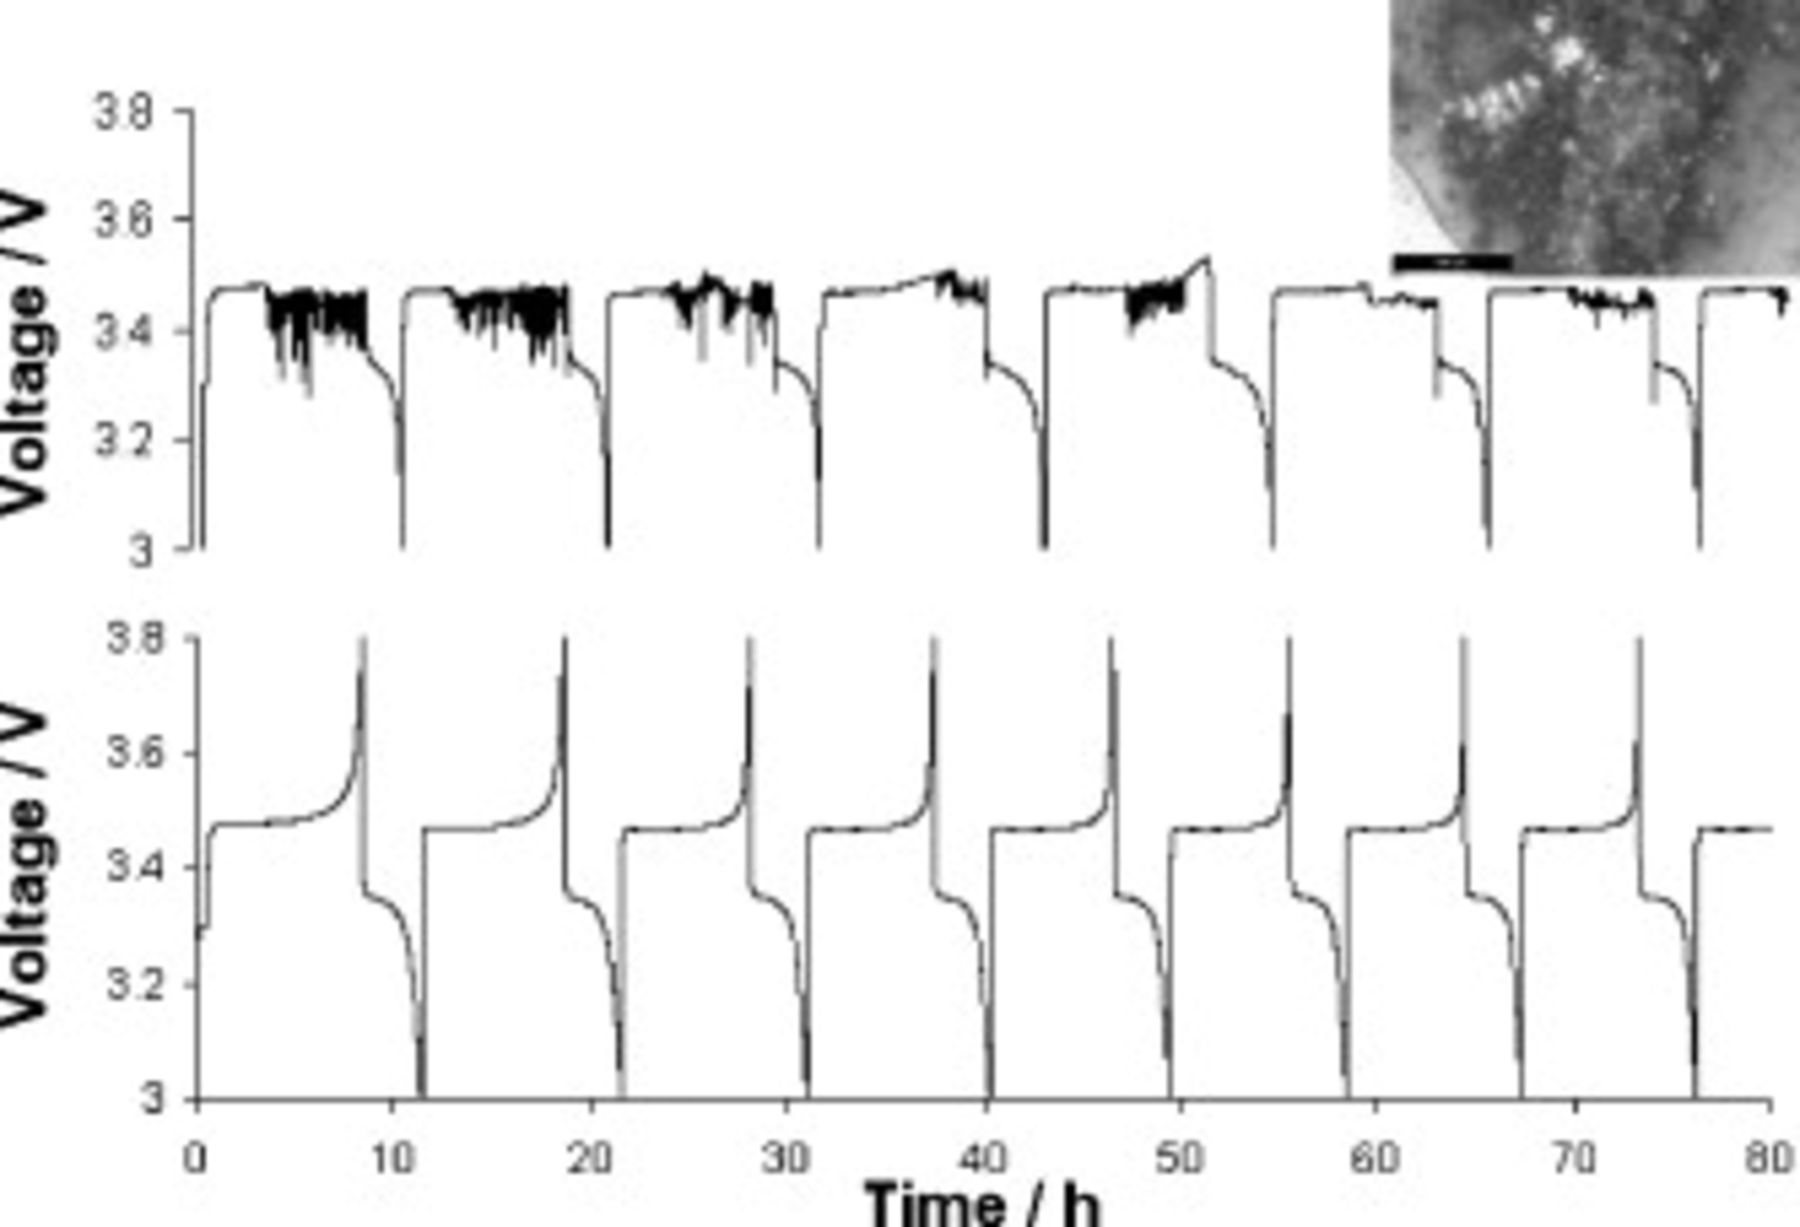
Figure 7. Top: Voltage behavior at  during cell cycling for a cell containing
  TFSI and
  Li TFSI electrolyte. Inset: Photograph of lithium dendrites on a separator removed from the cell. Bottom: Voltage behavior at
  during cell cycling for a cell containing
  TFSI,
TFSI,  Li TFSI, and
  SMK TFSI electrolyte. Cells charged at
  and discharged at
  .
.
The presence of dendrites was also evident in the voltage vs time charging curves (Fig. 7, top) generated during cell cycling. During the initial stages of each charge step, the applied voltage grew smoothly as expected. However, it soon dropped suddenly and took on an irregular choppy profile for the remainder of the charging process, and the cell failed to reach its 3.8 V cutoff voltage; hence, the charge step was terminated after a set time limit (8.25 h) was reached. Clearly, this erratic voltage behavior manifested because there were lithium dendrites shorting the cell. This interpretation is soundly supported by the findings of Rosso et al.56
Given that symmetrical cells with an SMK TFSI based electrolyte have been proven to cycle without the formation of dendrites (as described above), it was decided to add SMK TFSI, at different levels, to the  TFSI based electrolyte. When the additive was present at
  , cells still suffered from an irregular voltage behavior, indicative of shorting, although the prevalence of such behavior was reduced. At 0.25, 0.5, and
  SMK TFSI, the irregular voltage behavior was virtually eliminated. The best results were obtained at
  SMK TFSI, as demonstrated by the smooth character of the charging curves in Fig. 7 (bottom). As cell capacities decline with higher amounts of SMK TFSI in the system (Fig. 8), it was decided to use
  SMK TFSI in all further studies. Also, higher SMK TFSI concentrations resulted in higher electrolyte viscosities.
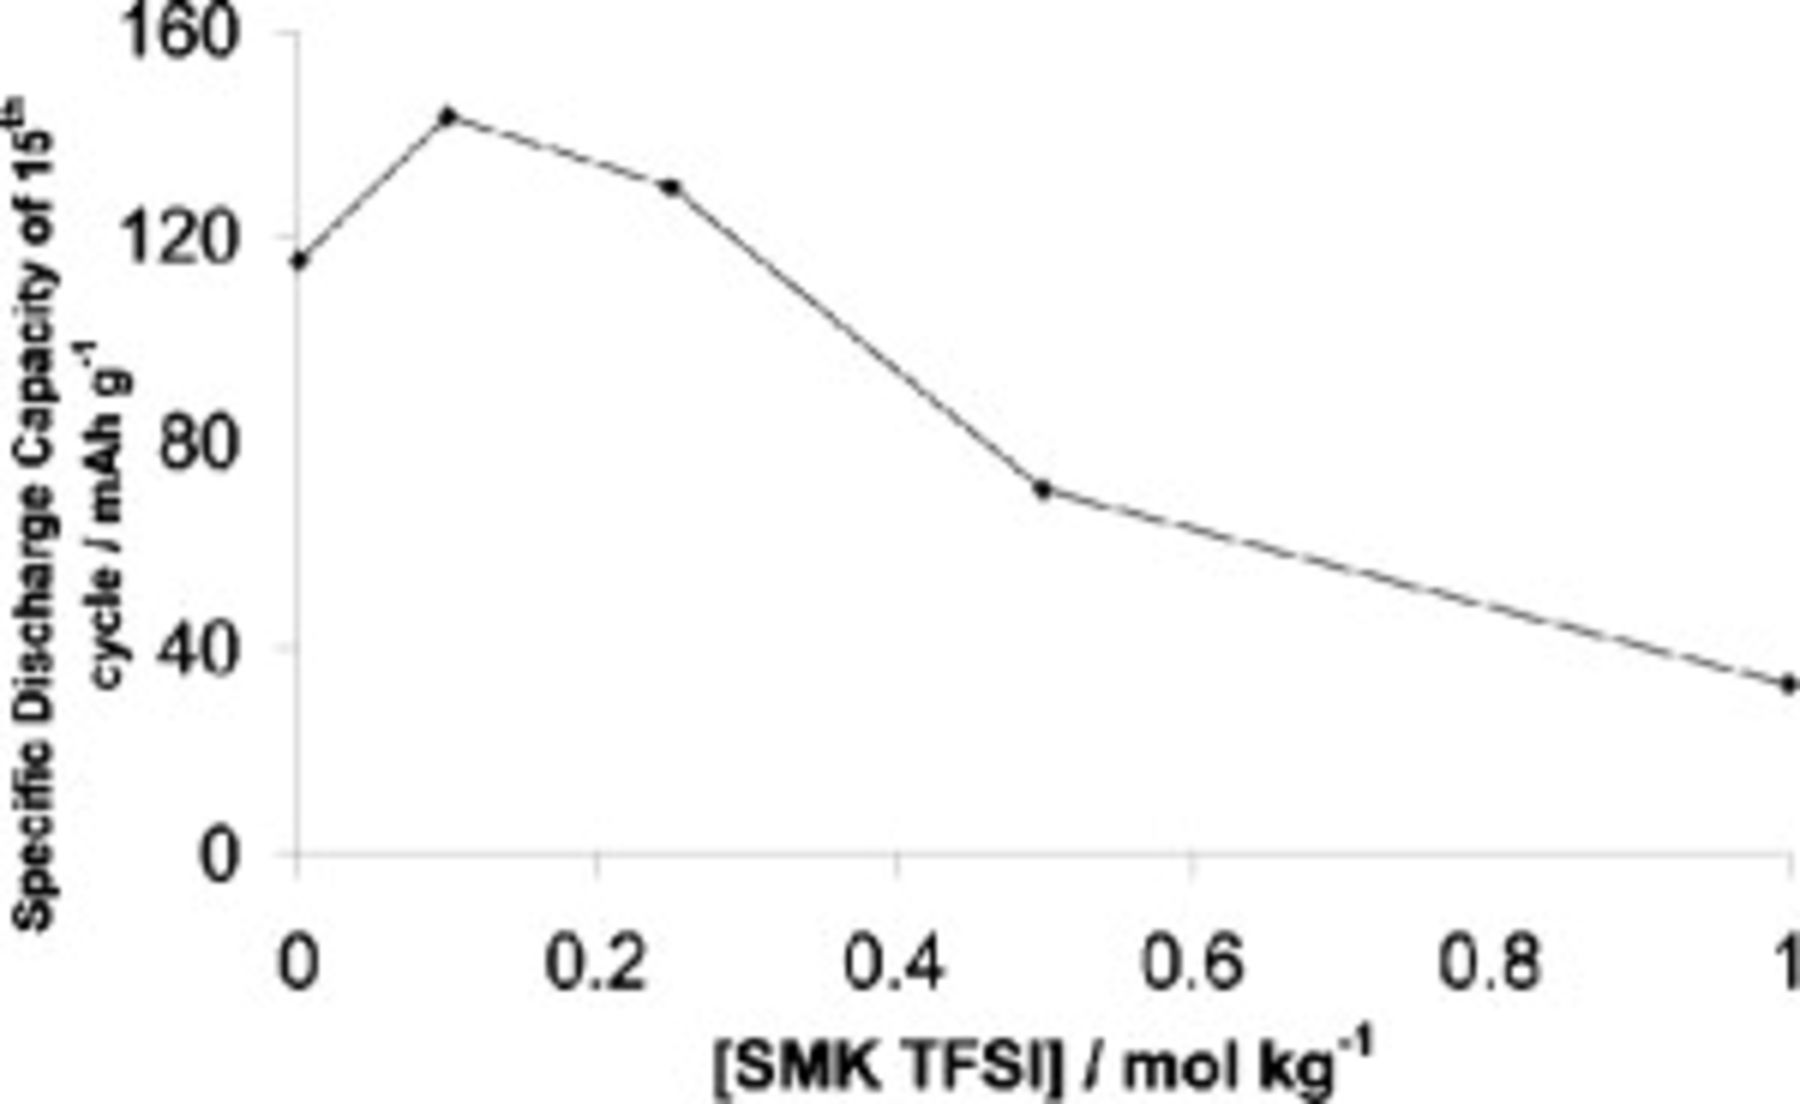
Figure 8. The effect of SMK TFSI concentration at  on cell discharge capacity for cells containing
  TFSI,
TFSI,  Li TFSI, and
  SMK TFSI electrolyte. Cells charged at
  and discharged at
  .
.
Cycled cells containing the  SMK TFSI electrolyte were opened and contained vastly fewer dendrites than the cells that did not contain any additive, supporting earlier observations that SMK TFSI appears to suppress dendrite formation at low current densities.
SMK TFSI as an additive: Electrochemical impedance spectroscopy
Impedance spectroscopy allows the interfacial characteristics of a system to be analyzed, and these impedance characteristics can be critical for the performance of a lithium battery. A cell comprised of lithium metal anode and LFP cathode utilizing the  SMK TFSI optimized electrolyte was cycled with impedance spectroscopy performed at regular intervals. Figure 9, left, shows the evolution of the shape of the Nyquist plot over the first 12 cycles. A double semicircle pattern emerges by the third cycle; the second semicircle appears to grow until the two semicircles are barely resolved by the 12th cycle. In Fig. 9, right, we see a very slow broadening of what is now visually a single flattened semicircle between cycles 20 and 41.
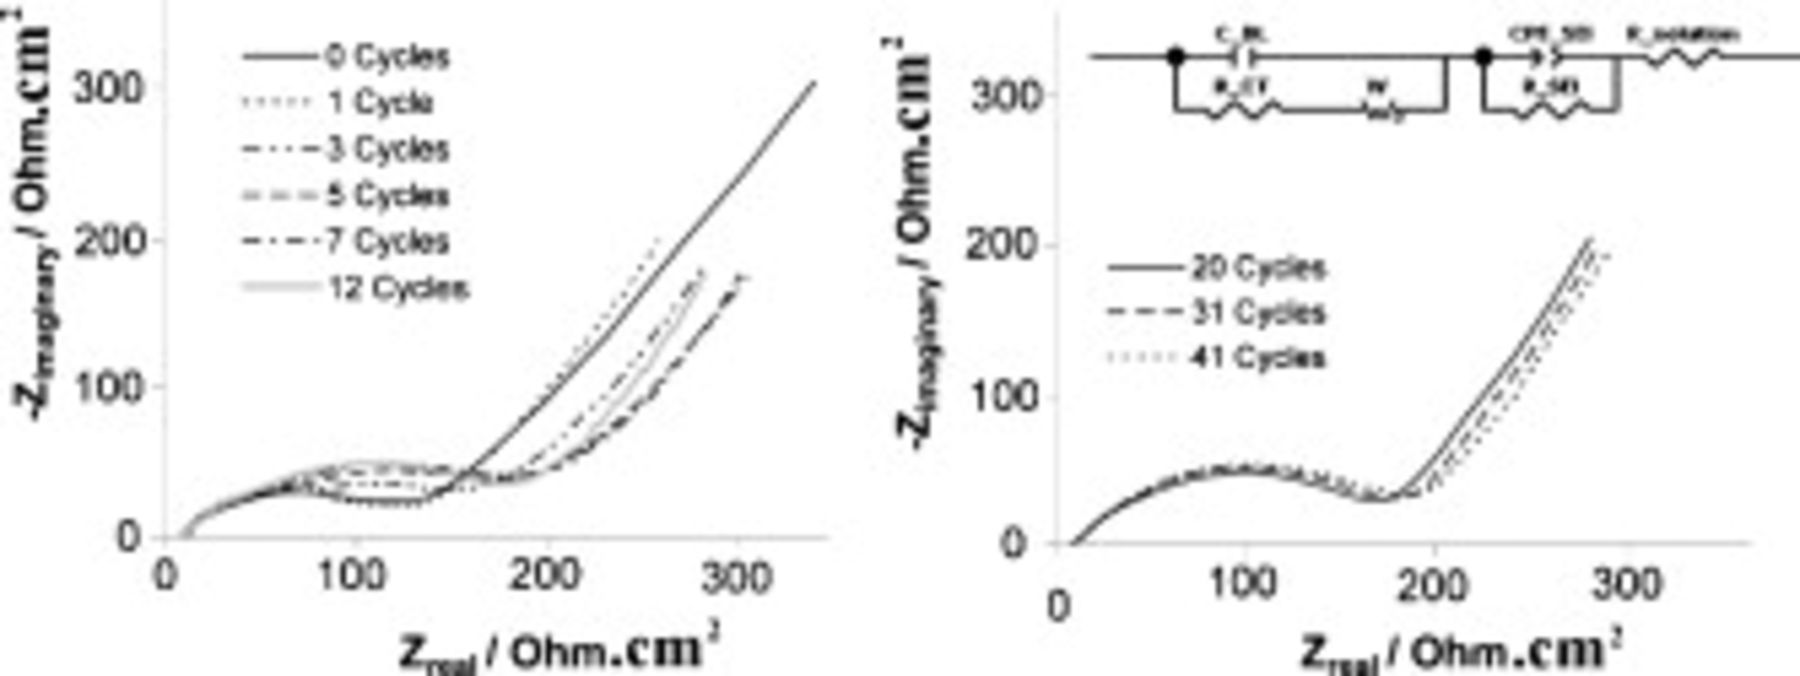
Figure 9. Nyquist plots at various cycle numbers for a cell containing  TFSI,
TFSI,  Li TFSI, and
  SMK TFSI electrolytes. Charged at
  and discharged at
  ,
,  . Inset: Equivalent circuit.
There is barely a change in the Nyquist plot after the first cycle (a 10 h process), apart from the length of the tail at the low frequency end of the spectrum. We observe that the charging voltage plateau for the first charge was 30 mV higher (3.497 V) on the first cycle than any of the other cycles (3.467 V).
A good fit of the Nyquist data can be obtained using the simple equivalent circuit in Fig. 9. The charge-transfer resistance (R_CT) is in parallel with the double-layer capacitance (C_DL) in the first part of the circuit, and a Warburg element is also present to represent diffusion through a solid film. The second part of the circuit represents the SEI, with the SEI resistance (R_SEI) in parallel with a nonideal SEI capacitance represented by a constant-phase element (CPE_SEI), while the solution resistance is represented by R_solution. Each of these variables could be further split into anodic and cathodic contributions; however, we chose a unified model for the sake of reducing the complexity of the circuit.
Lewandowski and Swiderska-Mocek used a similar circuit to model lithium symmetrical cells using an IL electrolyte,57 although the SEI capacitance is not specified as being nonideal. Here, we are able to better fit our data when the SEI capacitance is adopted as being nonideal.
We had expected substantial SEI development to have occurred during the very first cycle, but instead the major changes to the Nyquist plot occurred in subsequent cycles. The growth of the second semicircle (clearly visible in the Nyquist plot at cycle 3 in Fig. 9) suggests the continued development of the SEI during early cycling. The continued development could be due to the decomposition of the SMK cation because we have already determined, by CV, that SMK is unstable at lithium cycling potentials.
The very minor growth in the width of the flattened semicircle between cycles 20 to 41 indicates that the interface is by that stage close to being stable with cycle number. The size of the SEI resistance [ (third cycle)] calculated using our circuit is quite large compared to the solution resistance [
 (third cycle)] calculated with the circuit, which may impose significant limitations to the rate capability of the cell.
SMK TFSI as an additive: Cycle Life
Figure 10 shows that we were able to cycle a cell employing the optimized electrolyte for 260 cycles at  before a recrudescence of cell-shorting (which was accompanied by a steepened capacity decline). Before cell failure, specific capacities for each cycle were above
  , which is 70% of the theoretical LFP capacity.9 Over the course of 250 cycles, between cycles 10 and 260, the cell lost only 6.64% of capacity. The break in the values at cycle number
  occurred after a computer shutdown.
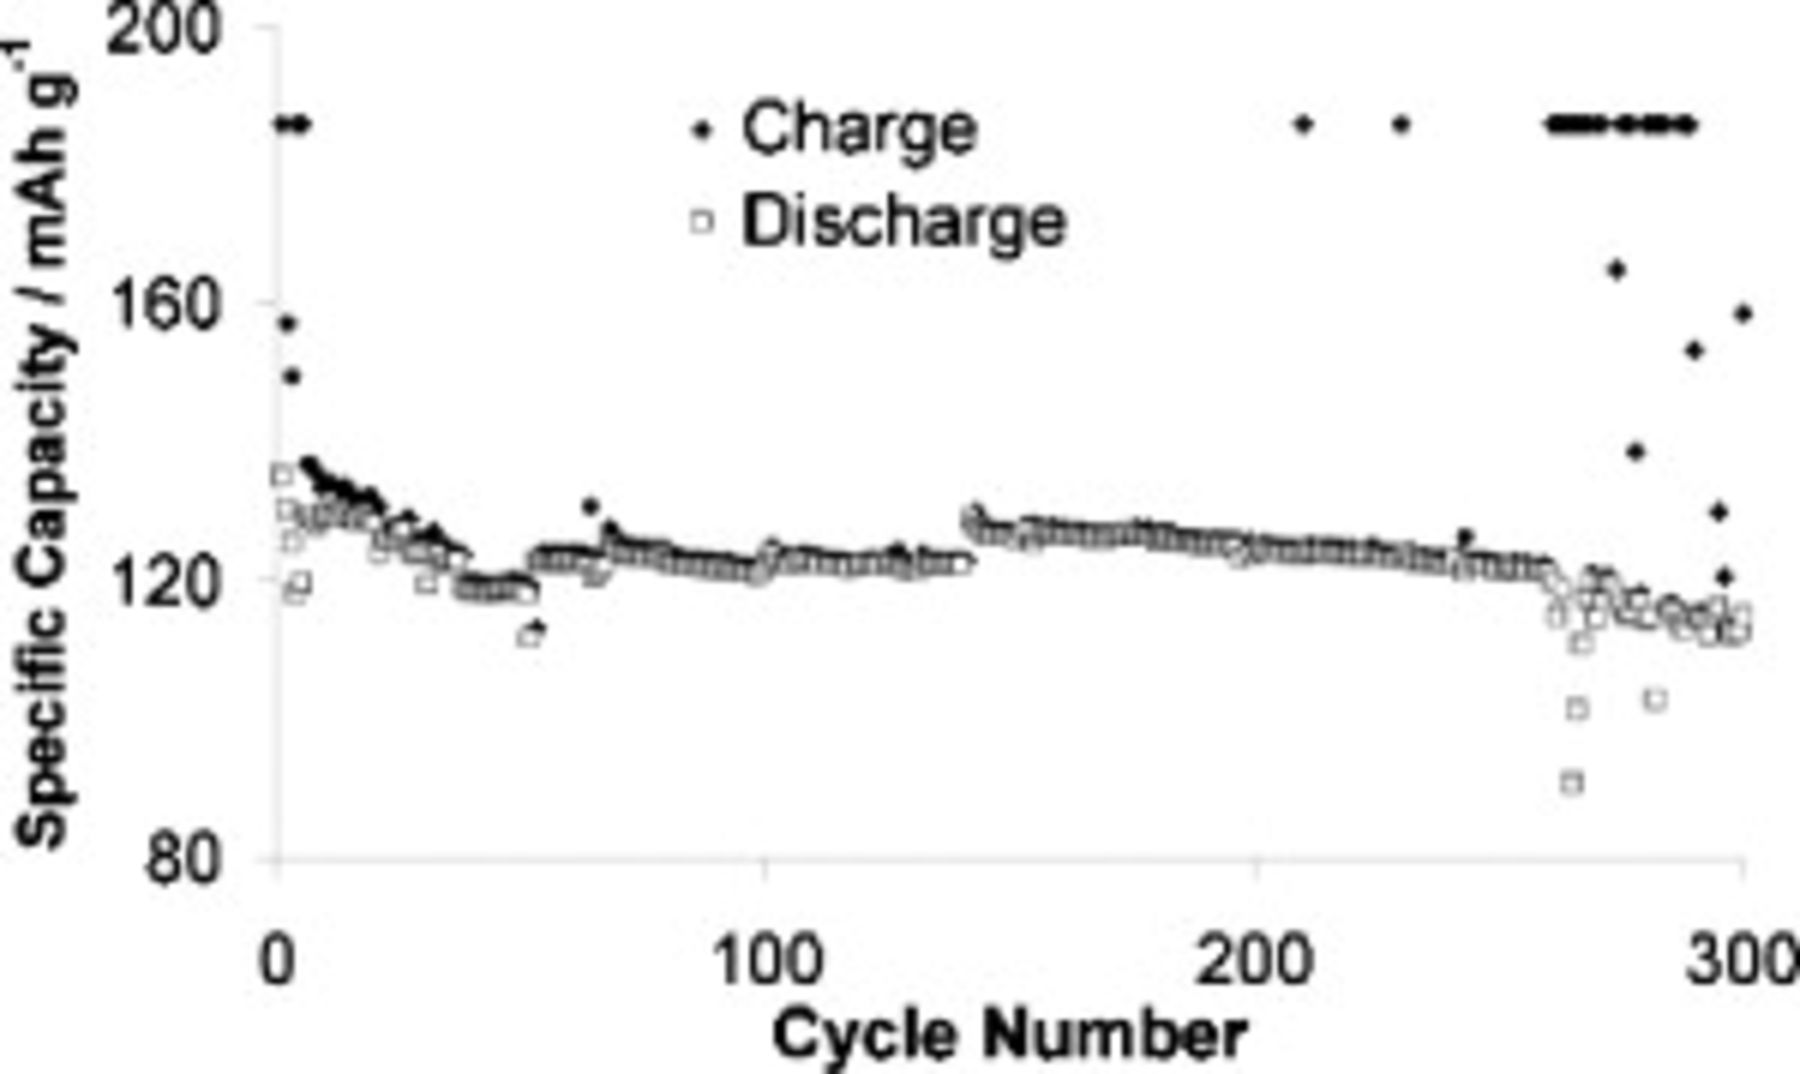
Figure 10. Cell capacity evolution at  for a cell containing
  TFSI,
TFSI,  Li TFSI, and
  SMK TFSI electrolyte. Charged at
  and discharged at
  . Abnormally high
  charge capacities indicate cycles that were affected by cell-shorting. The break in data at cycle
  occurred after a computer shutdown.
For the same cell, Fig. 11 shows voltage vs specific capacity plots for selected cycle numbers, which are each labeled in the figure. For cycles 1 and 2, the charge specific capacity was significantly higher than the discharge specific capacity; this difference, known as irreversible capacity, can arise from side reactions associated with electrochemical decomposition of the electrolyte. This behavior is one of the hallmarks of SEI formation.
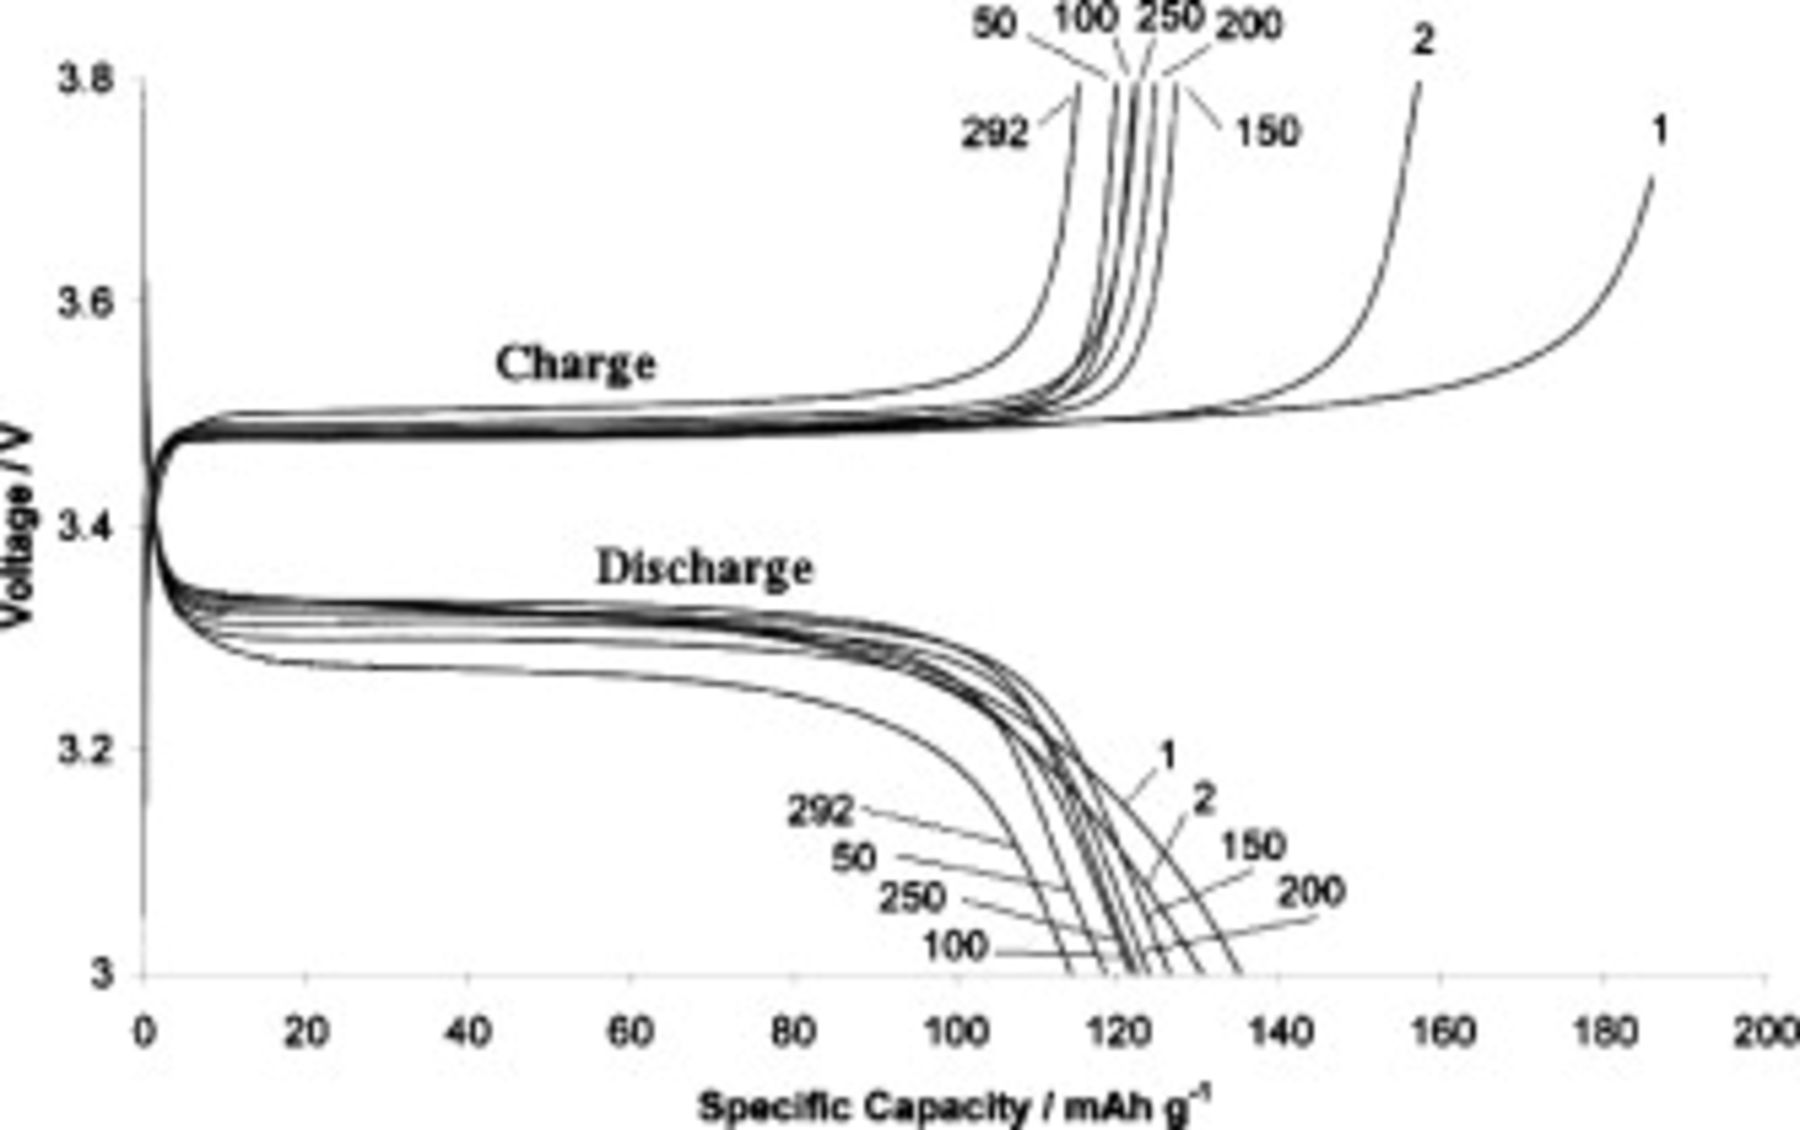
Figure 11. Capacity–voltage behavior at various cycle numbers for a cell containing  TFSI,
TFSI,  Li TFSI, and
  SMK TFSI electrolyte. Charged at
  and discharged at
  .
.
We also see that the plateau voltages of charge and discharge become more separated as the cycle number increases. This is clearly indicative of a slowly increasing resistance inside the cell and is consistent with the observations made during impedance studies. The increase in separation is most severe between cycles 250 and 292, which is the final testing period when the cell was stricken by intermittent short-circuiting (cycle 260 and onward). The proliferation of lithium dendrites that leads to a short-circuit is also expected to accelerate the rate of side reactions due to the increased surface area of the electrode.
Between cycles 100, 150, 200, and 250, there is only a small variation in specific capacity (for both charge and discharge). Capacity is markedly reduced by cycle 292 after a prolonged period of intermittent short–circuiting, which began after cycle 260.
SMK TFSI as an additive: Rate capability charging
For commercial success, a battery should be able to be recharged quickly. Attempts to halve our charge time by increasing the charging current density to  resulted in a return to cell short-circuiting. In an attempt to counter this, a cell, also containing the
  SMK TFSI electrolyte, was charged in a special manner. Small discharge pulses were programmed to interrupt the charging step (see the Experimental section) because during normal cycling affected by shorting, a temporary return to a nonshorted behavior was achieved immediately after each discharge sequence (see Fig. 7, top).
Figure 12 shows that we were able to cycle the cell at  for 100 cycles at a current density of
  (charge C-rate of C/3.75) using this technique, virtually eliminating all short-circuiting behaviors. This is among the highest constant current charging current densities reported for the extended cycling of a fully functional lithium metal battery with an IL electrolyte. Furthermore, we did not use a constant voltage step to boost capacity. The cell had virtually zero capacity loss over the 100 cycles, and efficiency is above 99% for almost every cycle. The break in the data at cycle 53 occurred after a computer shutdown.
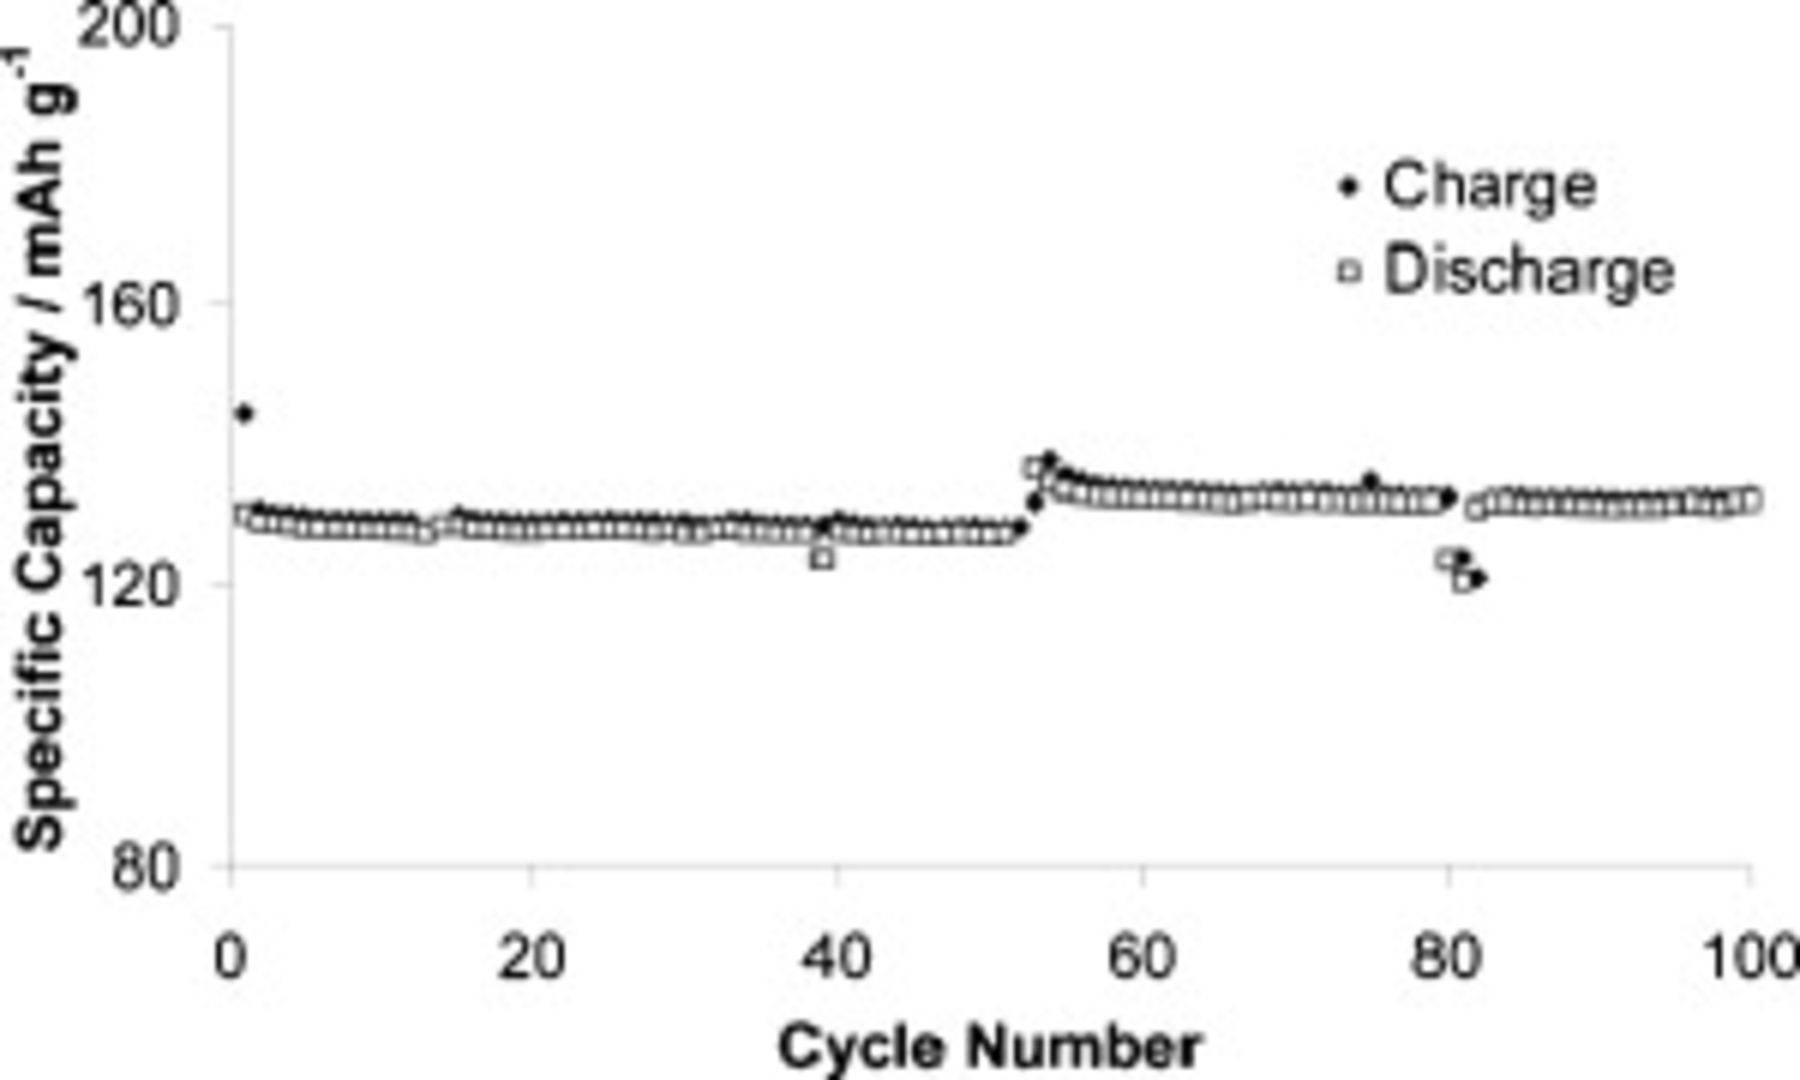
Figure 12. Cell capacity evolution at  for a cell containing
  TFSI,
TFSI,  Li TFSI, and
  SMK TFSI electrolyte. The cell was charged using an interrupted charge sequence (see the Experimental section) at
  and discharged at
  . The break in data at cycle 53 occurred after a computer shutdown.
One can highlight two key differences between the two charging techniques used in this study. The first difference is that the magnitude of the charging current used in pulse charging is double that used in the normal regime. The second difference is the inclusion of brief discharge pulses as interruptions to the charge process during pulsed charging.
Consistent with the discussion of Katz et al.45 with regard to zinc–nickel oxide cells, the higher charging current used during pulsed charging may serve to increase the number of nucleation points during the initial stages of lithium plating, potentially creating a more even deposit with fewer dendrites. However, if this high plating current was allowed to continue for a suitably long time, reduction in lithium-ion concentration at the electrode surface would become more severe and would facilitate greater inhomogeneities in lithium-ion concentration compared to when low currents are used as in normal charging. This situation is believed to encourage dendrite growth both in the zinc–nickel oxide case system45 and also in lithium metal systems.58, 59
The pulse charging process solves this problem by periodically ameliorating the decline in lithium-ion concentration by applying a brief discharge step (i.e., some lithium dissolves back into the electrolyte as  ). Thus, in regard to dendrite prevention, the pulsed charging method benefits from increased nucleation during initial charging, while the potential problem of a low lithium-ion concentration at the electrode is negated. There is also the possibility that the intermittent discharges serve to preferentially dissolve dendrites.
SMK TFSI as an additive: Self-discharge
One of the requirements of a secondary battery is a low self-discharge rate. A  TFSI cell containing the SMK TFSI additive at
  was stored in the charged state for 38 days at room temperature (after completing 100 cycles); over this storage time, the open-circuit potential dropped from 3.426 to 3.420 V. When the cell was finally discharged at
  , the discharge capacity was 93.4% of its value immediately before being stored. In Fig. 13, the voltage vs specific discharge capacity plots are shown for discharge performed both just before and after the storage period. The cell discharged with a lower plateau voltage after storage, suggestive of an increase in cell resistance, which is the most likely cause of the small decrease in capacity, given that the cell is discharged under a constant current regime. Although only a small amount of capacity was lost after storage, it would still be important to improve on this result in the interests of battery shelf life.
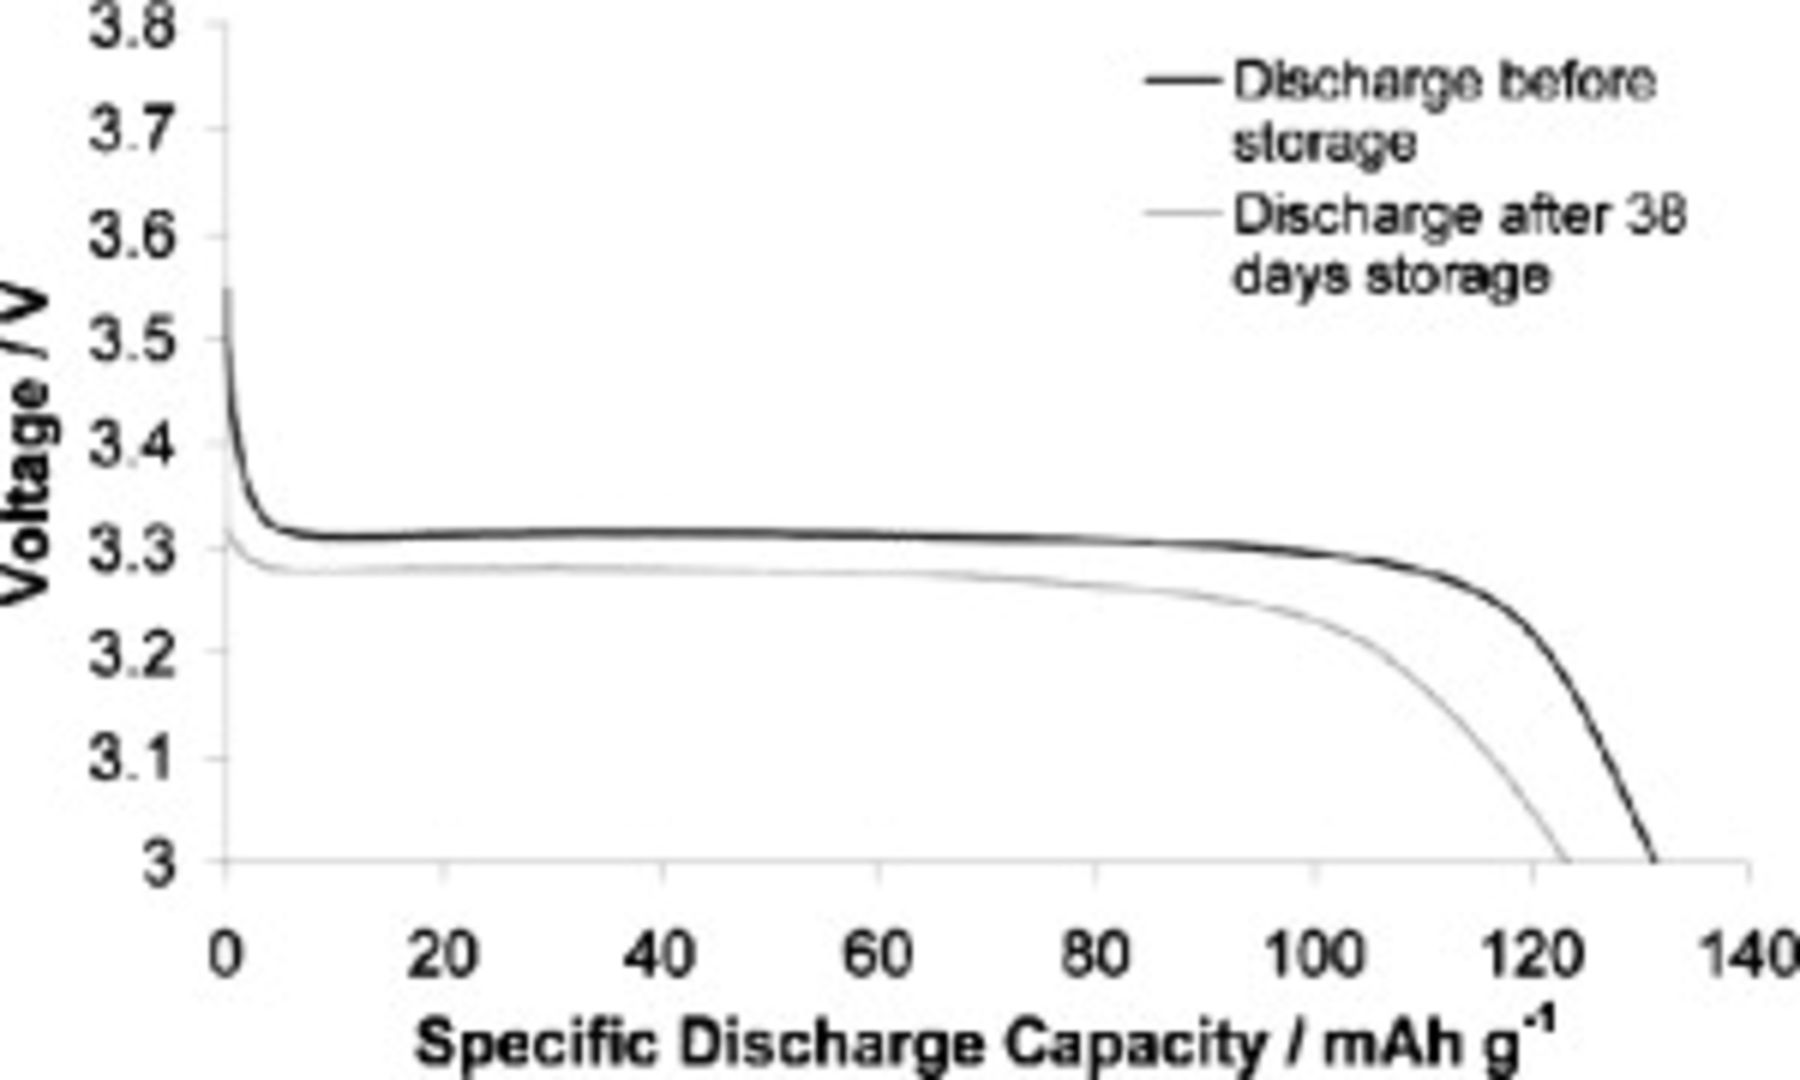
Figure 13. Capacity–voltage behavior of cell discharges before and after 38 days of storage at room temperature in the charged state. The cell electrolyte was  TFSI,
TFSI,  Li TFSI, and
  SMK TFSI. Discharge rate was
  at
at  in both bases.
SMK TFSI as an additive: Effect of temperature
Because ILs have a strongly temperature-dependent viscosity, temperature can be expected to have a significant effect on cell performance. The viscosity of the electrolyte,  TFSI,
TFSI,  SMK TFSI, and
  Li TFSI, is given in Table III for different temperatures. The viscosity at
  , 368 mPa s, is very high, even for an IL, and this high value arises primarily from the inclusion of SMK TFSI. However, at
  the viscosity is reduced approximately fivefold, and at
  it is reduced approximately 15-fold. These results suggest that there are large discrepancies in cell performance between high and low temperatures.
Table III. Viscosity of the electrolyte,  TFSI,
TFSI,  Li TFSI, and
  SMK TFSI at different temperatures.
Temperature
| Viscosity (mPa s) |
|---|---|
| 20 | 368 |
| 40 | 116 |
| 50 | 72.2 |
| 60 | 48.6 |
| 80 | 24.8 |
At our usual charge and discharge rates of 0.05 and  , respectively, the capacities of cells containing the
  SMK TFSI electrolyte were recorded at different temperatures. Figure 14 shows that capacity was exceptionally poor at
  , as expected from the viscosity data, although we expect that rate limitations imposed by the SEI are also in effect at this and all temperatures. Naturally, there was notable improvement under warmer test conditions. Capacity at
  was around 70% of the theoretical capacity of LFP
  , while at
  , where the electrolyte viscosity is only 24.8 mPa s, 94% of theoretical capacity was demonstrated.
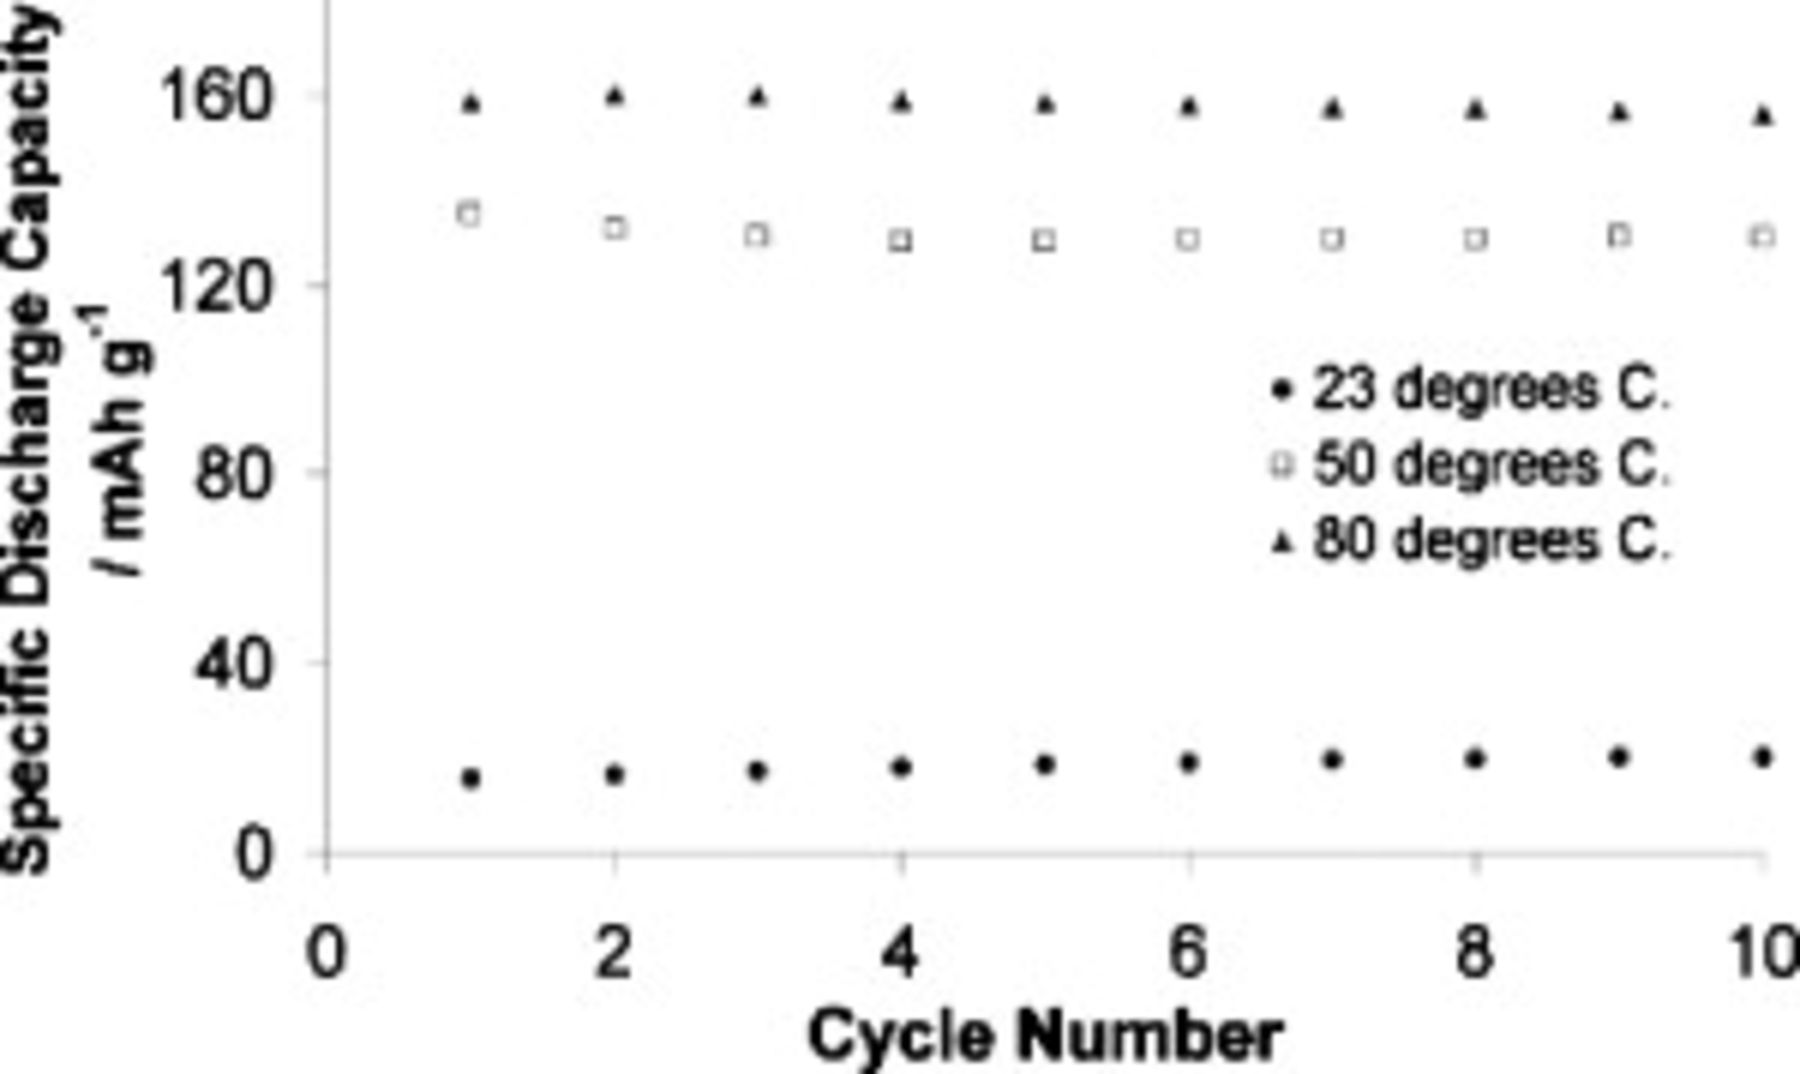
Figure 14. Discharge capacities for cells containing  TFSI,
TFSI,  Li TFSI, and
  SMK TFSI electrolyte at different temperatures. Cells charged at
  and discharged at
  .
.
With a set cutoff voltage of 3.0 V, cells were discharged at 50 and  at different rates, and the effect on the discharge capacity was recorded (see Fig. 15). Clearly, at
  the cell can only be discharged at modest rates if a high discharge capacity is to be realized, while higher rates are allowable at
  . Specific capacities at discharge rates of 0.05, 0.1, and
  are all
  at
at  . Again, we attribute the better rate performance at higher temperatures, in part, to the lower electrolyte viscosity.
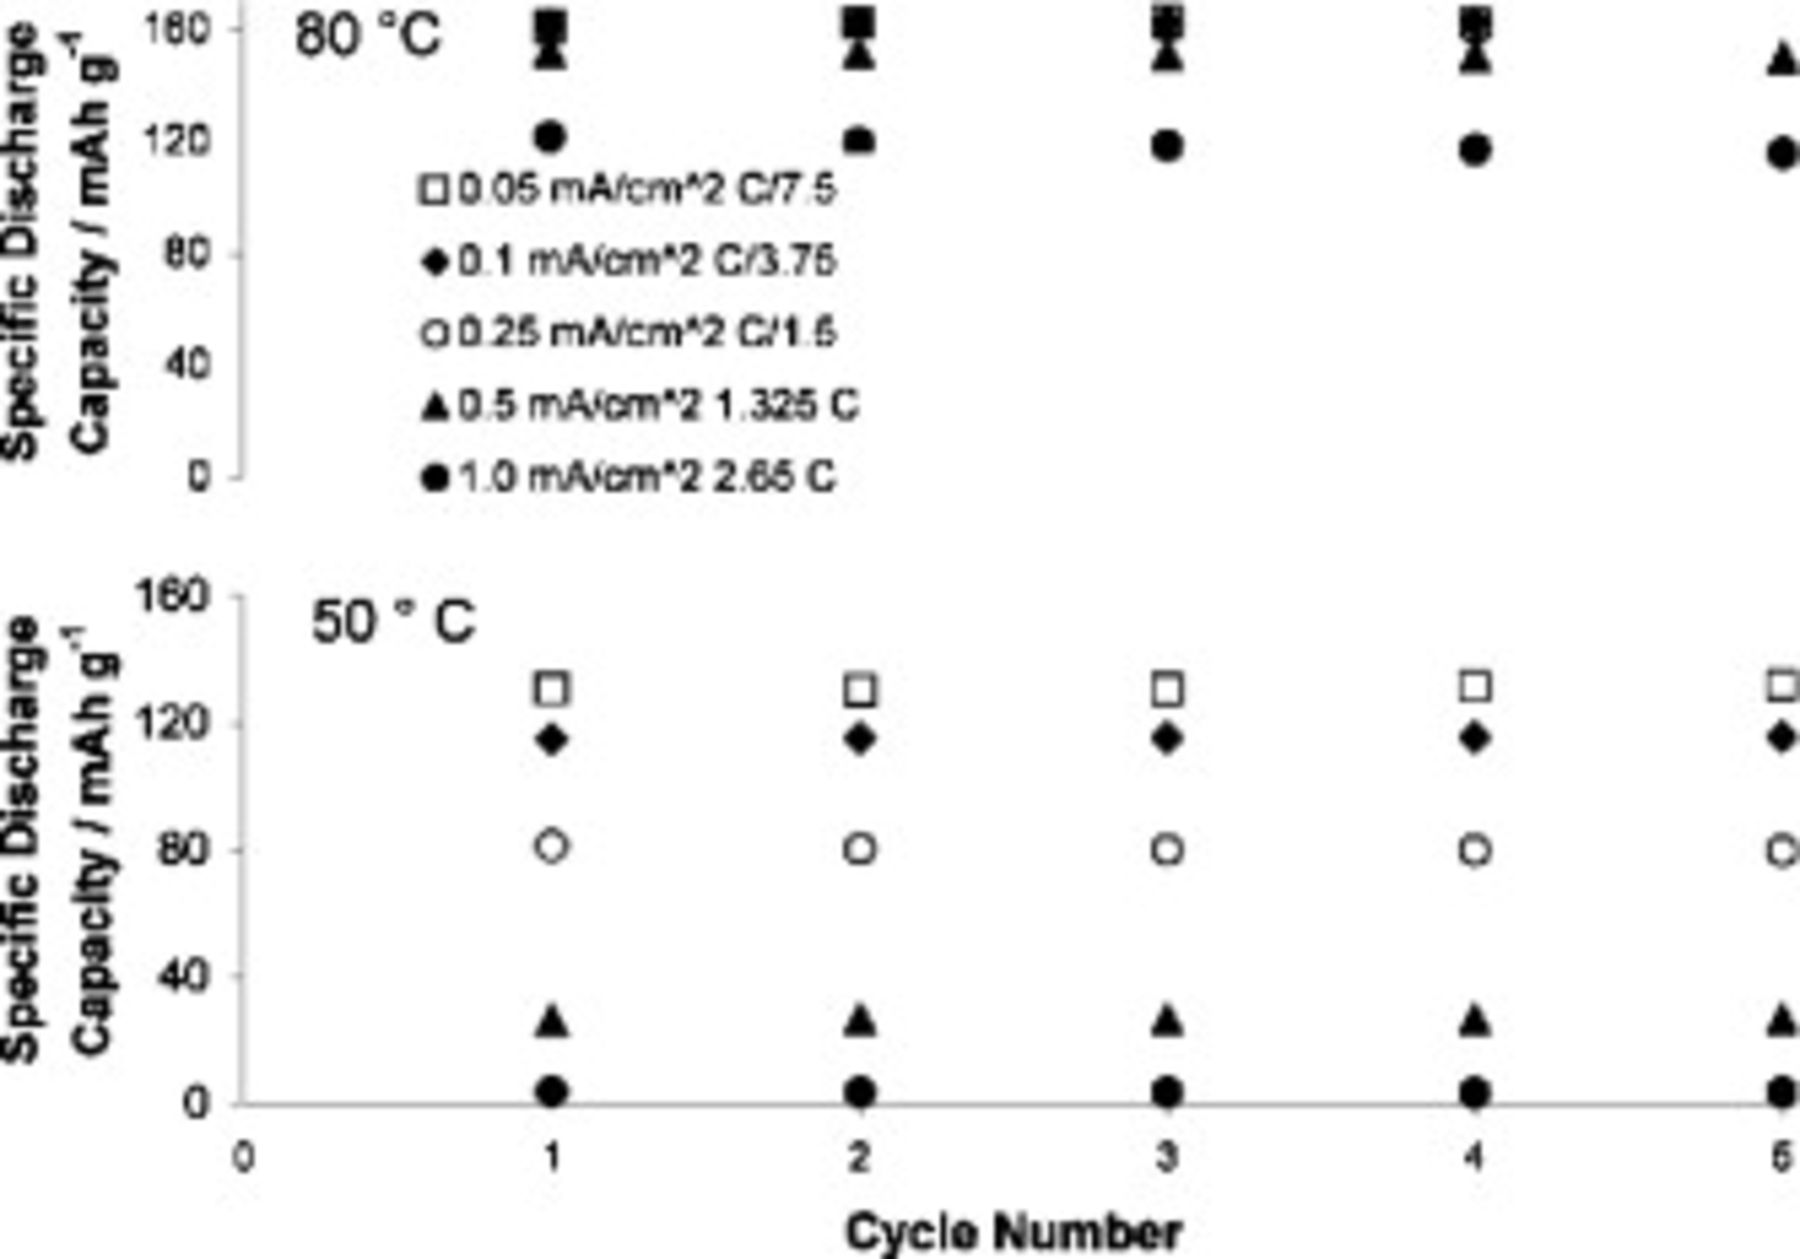
Figure 15. Discharge capacities of cells containing  TFSI,
TFSI,  Li TFSI, and
  SMK TFSI electrolyte discharged at different rates. Cells charged at
  . Top:
  . Bottom
  .
.
SMK TFSI as an additive: Cathode loading
In the interests of promoting higher energy densities, we also tested cells using a heavier loading of LFP in the cathode,  LFP. At
  , a return to the cell-shorting behavior was observed in some cycles when cells were charged at the usual rate,
  . However, at
  it was possible to charge the cells without causing short-circuits. Unfortunately, even at this temperature, only 62% of the theoretical capacity was achieved, compared to 94% for the lower LFP loading at the same temperature. This indicates that higher temperatures are still probably required before a full capacity of these thicker electrodes can be realized.
Conclusions
The ionic compound SMK TFSI had a modest electrochemical window of 3.5 V. However, addition of a lithium salt, Li TFSI, provided the mixture with the ability to form a partially passivating (SEI) layer that is capable of protecting the electrolyte from the negatively charged electrode at potentials as negative as −6 V (vs  ). It was possible to cycle symmetrical cells at
  without the formation of lithium dendrites; however, the requirement of a highly elevated temperature to achieve liquid status, the gradual electrode passivation, and poor lithium–
 cell performance rendered the neat system unviable.
Addition of SMK TFSI to a  based IL electrolyte allowed the cycling of a lithium metal–LFP battery at a more reasonable temperature
  and significantly improved the cycling behavior of the battery compared to the additive free case, which was affected by severe short-circuiting. With SMK TFSI employed, it was possible to achieve 260 cycles at
  with a capacity loss of only 6.64% over cycles 10–260. The presence of SMK TFSI clearly suppresses the growth of lithium dendrites in this system. The functional groups in the ring systems afford the SMK cation a heightened reactivity and the potential to contribute significantly to the makeup of the SEI.
In agreement with the long cycle life, electrochemical impedance spectroscopy indicated that the SEI resistance was stable over many cycles. The charge and discharge capabilities of the system were determined at different temperatures, with best results obtained at elevated temperatures. It was determined that it was not possible to fully utilize a heavier cathode loading under reasonable test conditions.
Using a pulsed charging method, which involved interrupting the charge step with brief discharges, a cell at  was able to be charged successfully for 100 cycles without failure at a high current density (
 or C/3.75), which would normally result in cell failure due to excessive short-circuiting.
Cyclic voltammetric studies demonstrated that it is feasible to use this electrolyte at temperatures as high as  . We are in the process of testing SMK TFSI in more fluid ILs, and with organic diluents, with the intention of achieving better battery performance at room temperature.
Acknowledgments
This work was done with the support of Evonik Degussa GmbH via an ARC linkage grant. The authors kindly thank Dr. Bronya Clare for the synthesis of materials used in this study.
Monash University assisted in meeting the publication costs of this article.